Abstract
This study utilizes discarded tree leaves as a substrate to synthesize biomass porous carbon nanosheets (PCNS) through high-temperature carbonization and pore-forming treatment, followed by functional modification using carboxymethyl chitosan (CMCS) and the corrosion inhibitor 8-hydroxyquinoline (8-HQ). The functionalized PCNS fillers were incorporated into water-based epoxy (WEP) coatings to enhance corrosion resistance. Electrochemical impedance spectroscopy (EIS) testing showed that after 60 days, WEP/PCNS@CMCS@8-HQ exhibited a low-frequency impedance of 1.7 × 10⁹ Ω cm2 at the lowest frequency, with significantly improved salt spray corrosion performance compared to WEP. The study demonstrates that CMCS effectively captures Cl− and acts as a repair agent, working synergistically with the external corrosion inhibitor 8-HQ to improve the dispersion of PCNS within the WEP matrix and enhance corrosion resistance. These findings indicate that green-modified PCNS offers a promising approach to improving the corrosion resistance of coatings.
This study uses discarded tree leaves to produce biomass porous carbon nanosheets (PCNS) via carbonization and pore-forming processes, then modifies them with carboxymethyl chitosan (CMCS) and 8-hydroxyquinoline (8-HQ).
1. Introduction
Corrosion of metallic materials has long posed a significant challenge in the engineering field.1–3 Despite the widespread application of various coatings to mitigate corrosion, this issue continues to cause economic losses and pose threats to public safety.4,5 Consequently, the research on low-surface-treatment and self-healing smart anticorrosive coatings has emerged as a crucial frontier in this domain.6–9 Functional nanomaterials have garnered significant attention in corrosion protection coatings. These materials primarily include multifunctional nanocontainers that can load corrosion inhibitors and gradually release them in corrosive environments.10 Carbon nanotubes and carbon nanofibers exhibit excellent dispersibility and shielding effects within smart coatings.11 Moreover, graphene and its derivatives are widely utilized in intelligent anticorrosive coatings due to their outstanding barrier properties and chemical stability.12 In contrast to organic epoxy resins, water-based coatings that use water as a solvent comply with environmental regulations regarding volatile organic compound (VOC) emissions, making them a promising direction for sustainable coatings development.13,14 These coatings have achieved significant advancements in both industrial and civil applications.
Graphene has garnered considerable attention as a filler in anticorrosive coatings. As a derivative of graphene, GO is incorporated into water-based anticorrosive coatings due to its distinctive two-dimensional nanostructure and excellent water dispersibility.15–19 Its “maze effect” enhances the anticorrosive properties of coatings, despite the high costs associated with this novel nanomaterial. Furthermore, the graphene surface exhibits a scarcity of active groups, making it difficult to graft rust converters onto the graphene surface, and compromising the adhesion between fillers and resins.20–22 However, the synthesis of graphene-like carbon materials from biomass presents a viable solution to these limitations. As an agricultural powerhouse, China boasts abundant biomass resources. Gao et al.23,24 have explored carbon materials derived from discarded biomass, presenting a more cost-effective alternative to graphene. Moreover, biomass-derived carbon surfaces are rich in active groups, offering reaction sites for grafting rust converters and improving the compatibility between fillers and resins. In the pursuit of graphene-like carbon materials derived from discarded biomass, carboxymethyl chitosan (CMCS) can be grafted onto carbon nanosheets.25,26 Water-based coatings inherently possess numerous fine pores due to water evaporation during curing, which results in inferior barrier properties and a shorter service life compared to conventional anticorrosive coatings. Therefore, achieving self-repairing capabilities is imperative for water-based coatings to attain optimal performance and prolonged service life. In this study, we introduced loaded 8-hydroxyquinoline (8-HQ) into porous carbon nanosheets (PCNS). The loaded 8-HQ can be released into cracks upon coating damage, safeguarding the steel from continuous corrosion and facilitating the repair of partial damage.27–29
Building upon the foregoing discourse, this study employed biomass-derived porous carbon material as a substrate, grafting carboxymethyl chitosan capable of sequestering Cl−, and successfully prepared the composite filler PCNS@CMCS@8-HQ. Subsequently, intelligent anticorrosive coatings were formulated by incorporating functional fillers into the resin matrix. Comprehensive characterization of the functional fillers, evaluation of anticorrosive performance, and determination of service life were conducted. Additionally, the mechanism of action of the functional fillers was elucidated.
2. Experimental
2.1. Materials
Carboxymethyl chitosan (CMCS), with a molecular weight of 240 kDa, a degree of deacetylation greater than 90%, and a degree of substitution of 90%; 1-(3-dimethylaminopropyl)-3-ethylcarbodiimide (EDC), 95%; zinc chloride (ZnCl2), analytical grade; 8-hydroxyquinoline (8-HQ), analytical reagent grade, from Macklin Co., Ltd; N-hydroxysuccinimide (NHS) (auxiliary agent), analytical grade, from Picasso Co., Ltd. Glacial acetic acid (HAC), hydrochloric acid (HCl), anhydrous ethanol, sodium chloride, water-based epoxy resin emulsion (Component A), and water-based epoxy curing agent (Component B) purchased from Shanghai Jiuyou Chemical Technology Co., Ltd (Shanghai, China). Deionized water was prepared using an ultrapure water machine (UPT-I-20L, ULUPURE, China). In this study, all chemicals and reagents were of analytical grade without further processing.
2.2. Synthesis of PCNS@CMCS@8-HQ
2.2.1. Preparation of (PCNS)
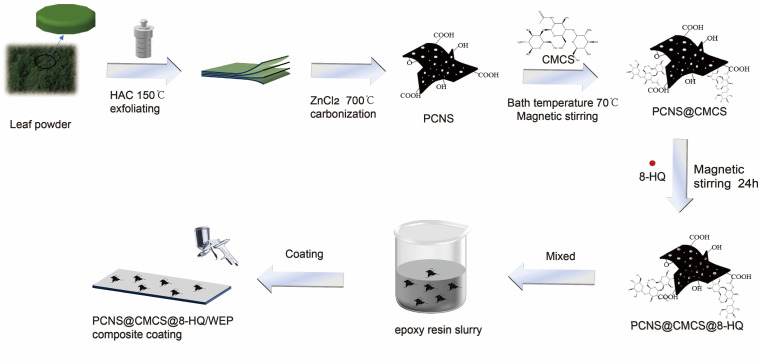
Initially, the harvested leaf powder was repeatedly washed with deionized water and then dried in a forced-air oven at 80 °C, and subsequent regrinding. Next, disperse 1 g of the powder into 70 mL of a 10 wt% HAC solution, then transfer it to a Teflon-lined stainless steel autoclave and react at 150 °C for 2 h. The suspension was added to deionized water, washed more than three times, and then centrifuged to obtain the powder, which was subsequently dried at 80 °C. Ultimately, combine the dried powder with a mixture of ZnCl2 (with a mass ratio of powder to ZnCl2 of 1 : 3), place it in a tubular furnace under a stream of nitrogen, and heat at a rate of 5 °C min−1 to 700 °C for 3 hours.30,31 The powder was repeatedly washed three times with an HCl and deionized water solution, then dried at 80 °C for 24 hours to obtain the final product, PCNS. Preparation of PCNS@CMCS@8-HQ: In this process, 0.3 g PCNS were dispersed ultrasonically in 50 mL of 10 wt% CMCS solution and stirred magnetically for 30 min. Subsequently, 0.1 g catalyst EDC and 0.03 g auxiliary agent were added, and the mixture was transferred to a water bath at 70 °C and stirred magnetically for another 30 min. The suspension was centrifuged, washed several times with ethanol, and dried in an oven at 80 °C. As a result, PCNS grafted with CMCS (PCNS@CMCS) was obtained. Next, 1 g 8-HQ was dispersed ultrasonically in 30 g ethanol, and 0.2 g PCNS@CMCS was added to the solution. The mixture was then magnetically stirred for 24 hours. The suspension was centrifuged, washed 3 times with anhydrous ethanol, and dried in an oven at 80 °C. Functional PCNS@CMCS@8-HQ was prepared.
2.3. Preparation of PCNS@CMCS@8-HQ composite coatings
Prior to coating, pretreatment of the Q235 steel plates is required. Firstly, the Q235 steel plates were polished with sandpaper of 400, 800, 1000, 1200, and 2000 grit, respectively. After polishing, the plates were washed with anhydrous ethanol to remove any debris or contaminants. PCNS@CMCS@8-HQ (0.1 wt%) was added to water-based epoxy (WEP) to prepare the intelligent PCNS@CMCS@8-HQ composite coating. The composite coating was then sprayed onto the pretreated Q235 steel plates, achieving a thickness of approximately 100 ± 10 μm.
The coatings were designated as PCNS@CMCS/WEP, PCNS@8-HQ/WEP, and PCNS@CMCS@8-HQ/WEP. Additionally, a blank coating sample, referred to as pure WEP, was prepared for comparison. The sprayed coatings were dried in a 30 °C oven for 48 hours. The entire preparation process for the composite coatings is illustrated in Fig. 1.
Fig. 1. Schematic diagram of preparation process of PCNS@CMCS@8-HQ/WEP composite coating.
2.4. Characterization
The microstructures and morphologies of the prepared carbon materials and coatings were observed by scanning electron microscopy (SEM, Regulus 8220, Japan) and transmission electron microscopy (TEM, Tecnai G2F20, America). The thickness of PCNS was measured by atomic force microscopy (AFM, MultiMode VIII, Germany). The pore structure of the prepared porous carbon was characterized by nitrogen adsorption and desorption isotherms using an automatic gas adsorption analyzer (Autosorb-IQ). Raman spectroscopy was performed on biomass porous carbon samples to determine the position and intensity of the D and G peaks using a Raman spectrometer (Raman, IHR320, Horiba, Japan). Using Fourier Transform Infrared Spectroscopy (Bruker, TENSOR II, Germany) is aimed at conducting a detailed analysis of the sample composition. Thermal analysis was carried out by a thermogravimetric analyzer (STA-02 STA449F3, NETZSCH, Germany) in a nitrogen atmosphere at a heating rate of 10 °C min−1 from room temperature to 800 °C.
The corrosion resistance of the coatings was assessed through EIS utilizing an advanced electrochemical workstation (AMETEK Parstat, MC1000A). The electrochemical setup consisted of three electrodes: a saturated calomel electrode as the reference electrode, a coated steel plate as the working electrode, and a platinum electrode as the counter electrode. The coated steel plate was immersed in a 3.5 wt% NaCl solution during the measurements. EIS data were acquired under open circuit potential (OCP) steady-state conditions, with an amplitude of 20 mV and a frequency range spanning from 10−2 to 105 Hz. The electrochemical parameters were meticulously fitted and analyzed using ZSimpWin software.
Simultaneously, in accordance with ASTM B117 standards, a salt spray accelerated corrosion test chamber (YWC, Changzhou National Equipment Research Institute) was employed to evaluate the corrosion resistance of the coating. Specifically, the coatings were subjected to a NaCl solution with a concentration of 5 wt%, and a sharp knife was used to scratch the coatings. The coated samples were then placed in the salt spray chamber under accelerated conditions for corrosion testing.
3. Results and discussion
3.1. Intelligent performance characterization of prepared fillers
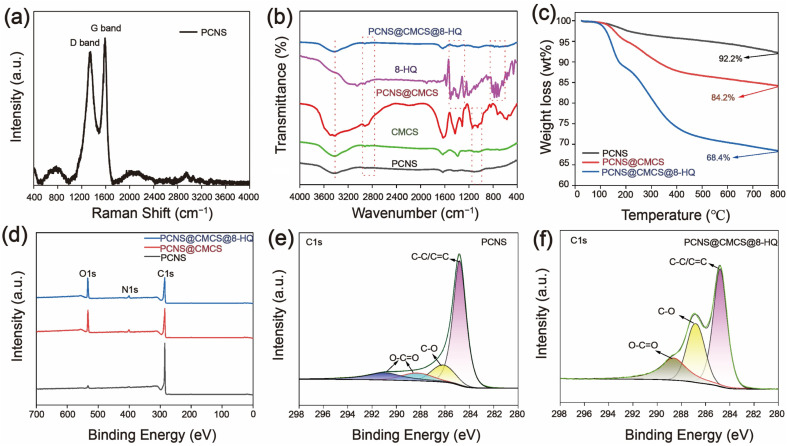
Fig. 2(a) delineates the disorder and defect structures of leaf carbonization through Raman spectroscopy, as depicted. A conspicuous D-band of carbon material emerges at 1346.34 cm−1, this arises from the intrinsic defects, non-uniformity, or impurities present after the leaves undergo carbonization. The G-band observed at 1588.43 cm−1 is due to the primary scattering of in-plane vibrations of sp2-bonded carbon atoms and the E2g vibration mode.32
Fig. 2. (a) Raman spectra of the original PCNS carbonization; (b) FT-IR spectra of PCNS and their derivatives; (c) TGA diagrams of PCNS and their derivatives; (d) total XPS spectra of PCNS and their derivatives. (e) PCNS, (f) PCNS@CMCS@8-HQ represent high-resolution XPS spectra of C 1s.
Fig. 2(b) characterizes the chemical composition of PCNS, PCNS@CMCS, and PCNS@CMCS@8-HQ using FT-IR spectroscopy, as shown. On the PCNS curve, characteristic peaks appear at 3420 cm−1, 1631 cm−1, and 908 cm−1, corresponding to –OH, C C, and C–O–C functional groups, respectively. On the PCNS@CMCS curve, peaks at 1048 cm−1 and 1122 cm−1 are attributed to ester C–O stretching vibrations. PCNS@CMCS@8-HQ filler contains many characteristic peaks of 8-HQ. Additionally, stretching vibrations of metal–oxygen (C–O, C–H, and cyclic alkanes) produce a series of absorption peaks within the range of 850 cm−1 to 700 cm−1. For PCNS@CMCS@8-HQ, its characteristic peaks are close to those of 8-HQ, indicating successful loading. Both covalent and non-covalent bonds can form, suggesting successful incorporation of the corrosion inhibitor into the porous carbon.
Fig. 2(c) illustrates the thermogravimetric analysis (TGA) curves of PCNS, PCNS@CMCS, and PCNS@CMCS@8-HQ are depicted. It is noteworthy that PCNS experiences a slight weight loss beyond 100 °C, which can be attributed to the adsorption of trace amounts of moisture during the sample storage process. Following the grafting of CMCS, a significant weight loss is observed when the temperature exceeds 150 °C, attributed to the thermal decomposition of CMCS within this temperature range. The total mass loss for PCNS@CMCS is 15.8%, whereas for PCNS@CMCS@8-HQ, it is 31.6%. The TGA results indicate that the grafting rate of CMCS on PCNS is 8%, and the loading rate of 8-HQ on PCNS is 15.8%.
XPS characterization was employed to further analyze the chemical structure of PCNS and PCNS@CMCS@8-HQ. As illustrated in the XPS full spectrum in Fig. 2(d), both PCNS@CMCS and PCNS@CMCS@8-HQ exhibit three principal peaks corresponding to C 1s, N 1s, and O 1s. However, due to the incorporation of the 8-HQ corrosion inhibitor and the modification with CMCS, the intensity of the N 1s peak is augmented compared to that of PCNS. Furthermore, owing to the presence of hydroxyl groups in CMCS and the structure of 8-HQ, the relative peak intensity of O 1s is markedly enhanced. Fig. 2(e) and (f) display the C 1s spectra of PCNS and PCNS@CMCS@8-HQ, where peaks at 284.8 eV, 285.6 eV, and 288.5 eV correspond to the C–C, C–O, and O–C O bonds of PCNS and PCNS@CMCS@8-HQ, respectively. From the figures, it can be observed that the bond strength in PCNS is not particularly high, while the intensity of the C–O and O–C O bonds in PCNS@CMCS@8-HQ is significantly enhanced.
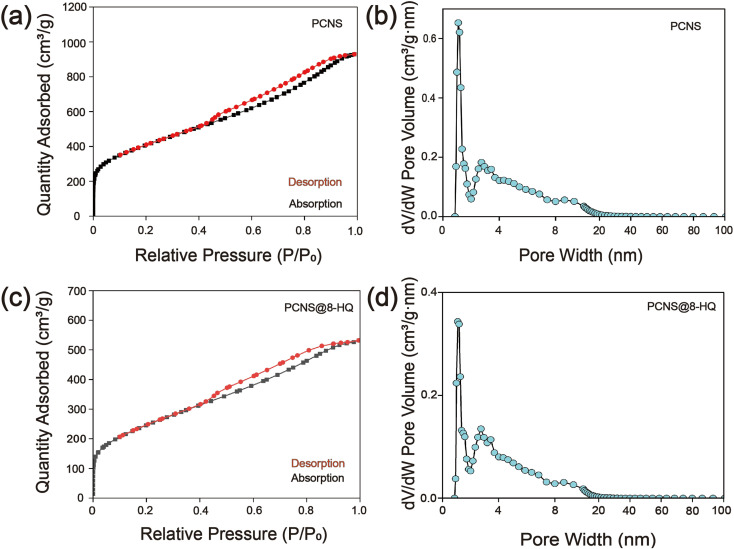
Nitrogen adsorption/desorption isotherm analysis was conducted to characterize the specific surface area and pore volume, thereby quantitatively evaluating their loading capacity.33,34 The results, depicted in Fig. 3(a) and (b), reveal a relatively high-pressure hysteresis loop in the nitrogen adsorption isotherm, indicative of a significant presence of mesopores in the synthesized PCNS. Additionally, the pore size distribution curve demonstrates pore diameters around 4.5 nm, further confirming the porous structure of the PCNS. The calculated specific surface area is 1469.61 m2 g−1, and the total pore volume is 1.4373 cm3 g−1. This synthesized material, with its abundant mesopores and substantial pore volume, is well-suited for the preparation of self-repairing fillers.
Fig. 3. (a and b) PCNS and (c and d) PCNS@8-HQ represent N2 adsorption/desorption isotherms and DFT pore size distributions.
Nitrogen adsorption/desorption isotherms, FT-IR, and TGA methods were employed to ascertain the successful loading of the corrosion inhibitor into PCNS. The isotherms of 8-HQ/PCNS and PCNS are nearly identical (Fig. 3(c) and (d)), indicating that the microstructure of PCNS remains unaltered after the loading process. Through curve analysis, the total pore volume of 8-HQ/PCNS was found to be 0.8204 cm3 g−1, with a specific surface area of 896.91 m2 g−1 and a pore size of 4.0 nm. These relatively lower values are attributed to the inhibitor occupying a portion of the available space.
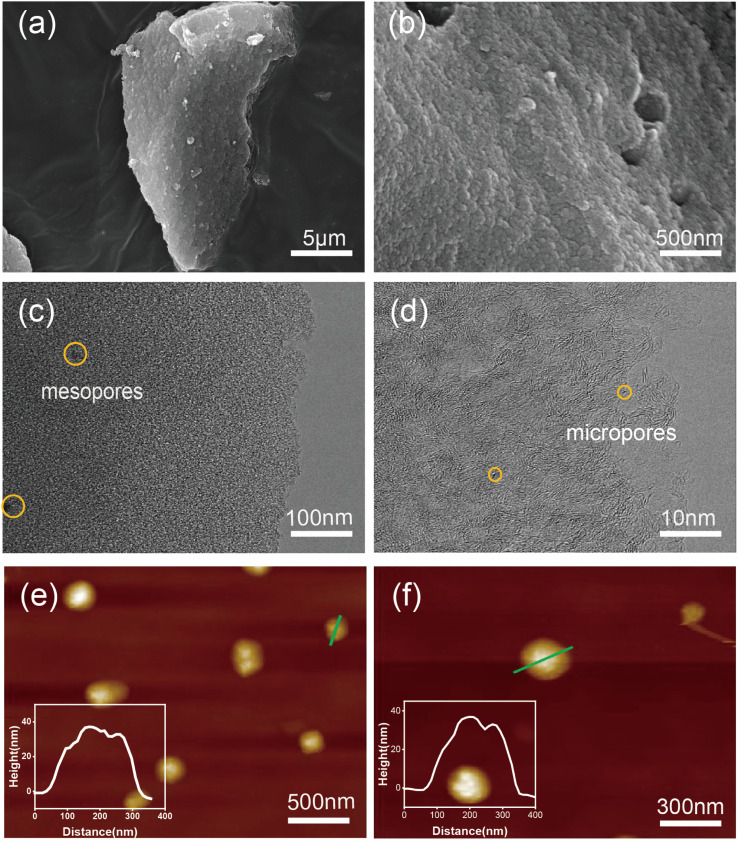
Fig. 4(a) and (b) present SEM images, revealing that the prepared material exhibits a flaky structure. This morphology is primarily attributed to the hydrothermal hydrolysis of cellulose in the leaves into oligosaccharides, leading to a transformation from a bulk structure to a layered structure with surface voids. The TEM-EDS mapping of PCNS@CMCS@8-HQ is presented in Fig. S1.†Fig. 4(c) and (d) present high-resolution TEM images, indicating that the sheet-like carbon material contains abundant mesopores and micropores, resulting from the carbonization process using ZnCl2 as an activator at 700 °C.35–37 The mechanism of ZnCl2 activation can be summarized as follows: ZnCl2 molecules penetrate the interior of the carbon during gasification and act as a scaffold. After repeatedly washing ZnCl2 with water and hydrochloric acid solution, numerous pores remain on the surface, resulting in the formation of a mesoporous structure. The thickness and structural characteristics of the prepared PCNS were examined using atomic force microscopy. Fig. 4(e) and (f), the thickness of the prepared PCNS is approximately 35 nm, and its structure is characterized as lamellar.
Fig. 4. (a and b) SEM images, (c and d) TEM images, and (e and f) AFM images of PCNS. The inset images in (e) and (f) depict the height profiles of the samples.
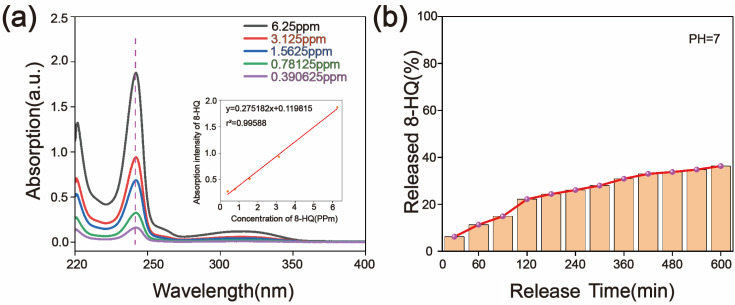
The ultraviolet absorption spectra of 8-HQ were measured using a UV-vis spectrophotometer, and the release rate of 8-HQ over time was calculated.38,39Fig. 5(a) illustrates the UV-vis spectra of solutions with varying concentrations of 8-HQ. The characteristic absorption peak of 8-HQ appears at a wavelength of 242 nm. This wavelength was selected to establish the standard UV-vis spectrum curve (as shown in the inset of Fig. 5(a)), which was then used as a reference to calculate the amount of 8-HQ released from the PCNS nanocarriers. Fig. 5(b) shows the release profile of 8-HQ from the PCNS nanocarriers over time. 8-HQ molecules were rapidly released within the initial 120 min, followed by a gradual decrease in the release rate. Approximately 36.3% of the 8-HQ molecules were released after 600 min, indicating that a substantial portion of 8-HQ had been released into the physiological saline solution.
Fig. 5. (a) UV-vis spectra of 8-HQ solution and the corresponding standard curve; (b) release rate of 8-HQ from PCNS@CMCS@8-HQ in 3.5% NaCl solution.
3.2. Corrosion performance testing
3.2.1. Electrochemical impedance spectroscopy (EIS) experiment
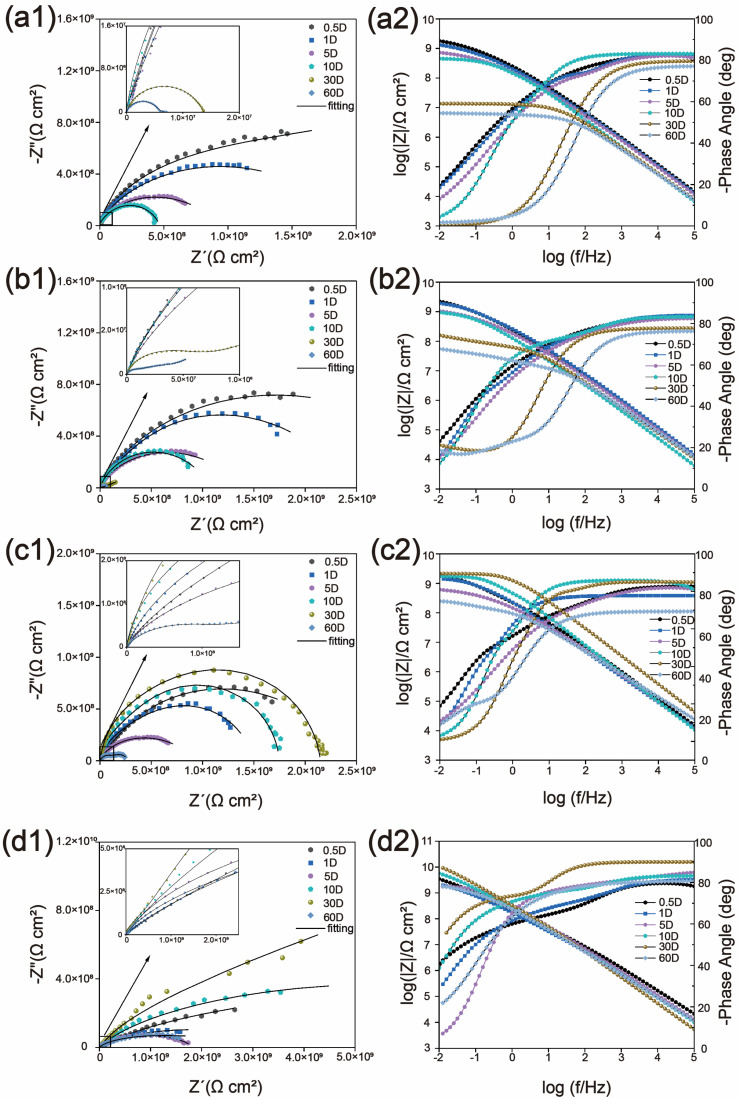
EIS is a crucial method for evaluating the corrosion resistance of coatings.40,41 EIS data were meticulously recorded for the coatings immersed in a 3.5 wt% NaCl solution for periods of 0.5, 1, 5, 10, 30, and 60 days, resulting in the generation of Nyquist and Bode plots. The EIS data were further analyzed and fitted using ZsimpWin 3.6 software. The resulting Nyquist and Bode plots are presented in Fig. 6. The comprehensive electrochemical data analyzed via EIS are provided in detail in ESI Table S1.† For the blank WEP, the diameter at high frequency and the modulus at the lowest frequency in Fig. 6(a1) significantly decreased after 60 days of immersion, while the Bode plot in Fig. 6(a2) shifted towards lower frequencies with increasing immersion time. These findings indicate that the electrolyte solution readily permeates the surface of the metal substrate, leading to corrosion phenomena, primarily due to the presence of micropores and defects formed during the curing process of WEP. Fig. 6(b1) and (c1) show the Nyquist plots for WEP/PCNS@CMCS and WEP/PCNS@8-HQ tests, respectively. The corresponding Bode plots indicate an improvement in corrosion resistance compared to WEP. However, with prolonged exposure time, a noticeable decrease in the curves is observed. Due to the superior corrosion resistance of WEP/PCNS@CMCS@8-HQ, the decreasing trend in the diameter at high frequency in the Nyquist plot Fig. 6(d1) and the modulus at the lowest frequency in the Bode plot Fig. 6(d2) was slower compared to the blank WEP when WEP/PCNS@CMCS@8-HQ was incorporated into the WEP coating. When modified PCNS was used as a filler for WEP, the EIS data after 60 days of immersion indicated that the WEP/PCNS@CMCS@8-HQ coating exhibited the largest impedance arc radius compared to the WEP, WEP/PCNS@CMCS, and WEP/PCNS@8-HQ coatings, with minimal variation in the low-frequency impedance modulus.
Fig. 6. (a1 and a2) Nyquist plots, Bode modulus plots, and phase angle plots of WEP; (b1 and b2) Nyquist plots, Bode modulus plots, and phase angle plots of WEP/PCNS@CMCS; (c1 and c2) Nyquist plots, Bode modulus plots, and phase angle plots of WEP/PCNS@8-HQ; and (d1 and d2) Nyquist plots, Bode modulus plots, and phase angle plots of WEP/PCNS@CMCS@8-HQ.
3.2.2. Fitted results of EIS measurement
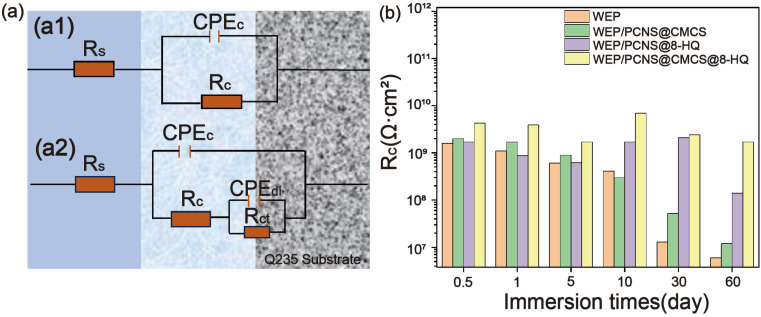
Quantitative analysis of the EIS data obtained from the prolonged immersion of the nanocomposite coating in a 3.5 wt% NaCl solution was performed using ZSimpWin, employing the equivalent circuit models depicted in Fig. 7(a1) and (a2). At the beginning of the immersion process, the coating effectively acts as a barrier to the corrosive medium in the solution, preventing the electrolyte from reaching the surface of the steel plate. This stage's impedance is represented by Model A, as its Bode plot exhibits a single time constant. Here, Rs, Rc, and CPEc denote the resistance of the solution, the resistance of the coating, and the non-ideal capacitance associated with the coating, respectively.42 After a period of immersion, corrosive products accumulate at the interface between the substrate and the coating due to the involvement of the corrosive medium in the degradation process. During this phase, the coating's corrosion resistance gradually diminishes, necessitating the introduction of new parameters, Rct is the charge transfer resistance of the double layer, while CPEdl is the non-ideal capacitance. Two time constants were observed in the Bode plot of the samples during the immersion stage. Consistent with the impedance modulus analysis results in Fig. 6, This indicates a significant enhancement in the corrosion resistance of WEP/PCNS@CMCS@8-HQ compared to WEP, highlighting the considerable impact of coating density on corrosion resistance.
Fig. 7. (a) Equivalent electrical circuits (EEC) for EIS testing: (a1) Model 1, (a2) Model 2; (b) Rc values of WEP, WEP/PCNS@CMCS, WEP/PCNS@8-HQ, and WEP/PCNS@CMCS@8-HQ.
3.2.3. SEM analysis of the stripped epoxy coating
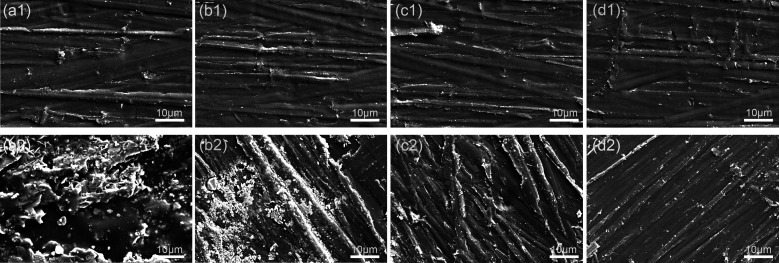
SEM images of the surfaces of the peeled coatings after electrochemical testing for WEP, WEP/PCNS@CMCS, WEP/PCNS@8-HQ, and WEP/PCNS@CMCS@8-HQ are presented in Fig. 8. The corrosion state of the coating surfaces was observed to evaluate the corrosion resistance of the coatings. From Fig. 8(d2), it is evident that the surface of the WEP/PCNS@CMCS@8-HQ sample exhibits clear sandpaper polishing scratches in most areas, with minimal pitting corrosion products. This suggests the outstanding protective efficacy of WEP/PCNS@CMCS@8-HQ, effectively blocking electrolyte solutions and other corrosive media, consistent with the electrochemical impedance test analysis. Even after 60 days, the Bode impedance modulus of WEP/PCNS@CMCS@8-HQ remains high. In contrast, the surfaces of the WEP and WEP/PCNS@CMCS samples were extensively covered with corrosion products, indicating that the aggressive medium had penetrated the metal interface, causing severe damage to the coating. The WEP/PCNS@8-HQ sample also shows some degree of surface corrosion, but the extent of corrosion is slightly less severe than that observed in the WEP and WEP/PCNS@CMCS samples.
Fig. 8. SEM images of the coating morphology at the interface with the steel substrate before and after 60 days of salt spray corrosion testing. The coatings are identified as follows: (a) WEP, (b) PCNS@CMCS/WEP, (c) PCNS@8-HQ/WEP, and (d) WEP/PCNS@CMCS@8-HQ.
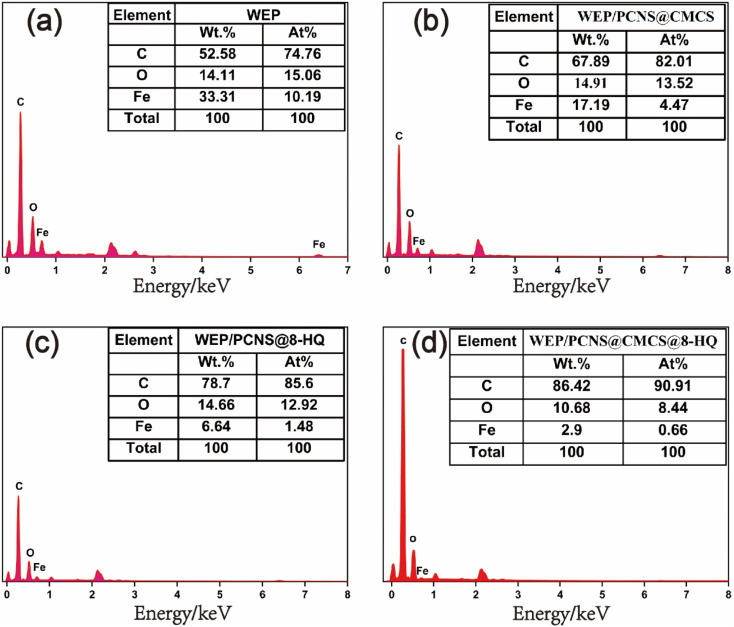
Fig. 9 shows the SEM-EDS images corresponding to the surfaces of the samples depicted in Fig. 8. The corresponding data results are presented in the table in Fig. 8. The iron content on the surface of the WEP/PCNS@CMCS@8-HQ sample is more than ten times lower than that of WEP. Higher iron content indicates more severe corrosion due to the penetration of the corrosive medium, highlighting the superior corrosion resistance of WEP/PCNS@CMCS@8-HQ. The poor corrosion resistance of WEP is attributed to the presence of micropores and cracks during its curing process, which increases the erosion of the coating by Cl− and H2O, facilitating the penetration of the corrosive medium. The results indicate that modifying the inorganic filler particles with CMCS and 8-HQ can improve the compatibility between PCNS nanosheets and the epoxy resin matrix. The uniformly dispersed WEP/PCNS@CMCS@8-HQ provides excellent shielding performance for WEP coatings, effectively blocking the corrosive medium and maintaining robust corrosion resistance.
Fig. 9. SEM-EDS spectra of the coatings ((a) WEP, (b) WEP/PCNS@CMCS, (c) WEP/PCNS@8-HQ, and (d) WEP/PCNS@CMCS@8-HQ) after delamination from the Q235 substrate following 60 days of salt spray corrosion testing.
3.2.4. Salt spray resistance
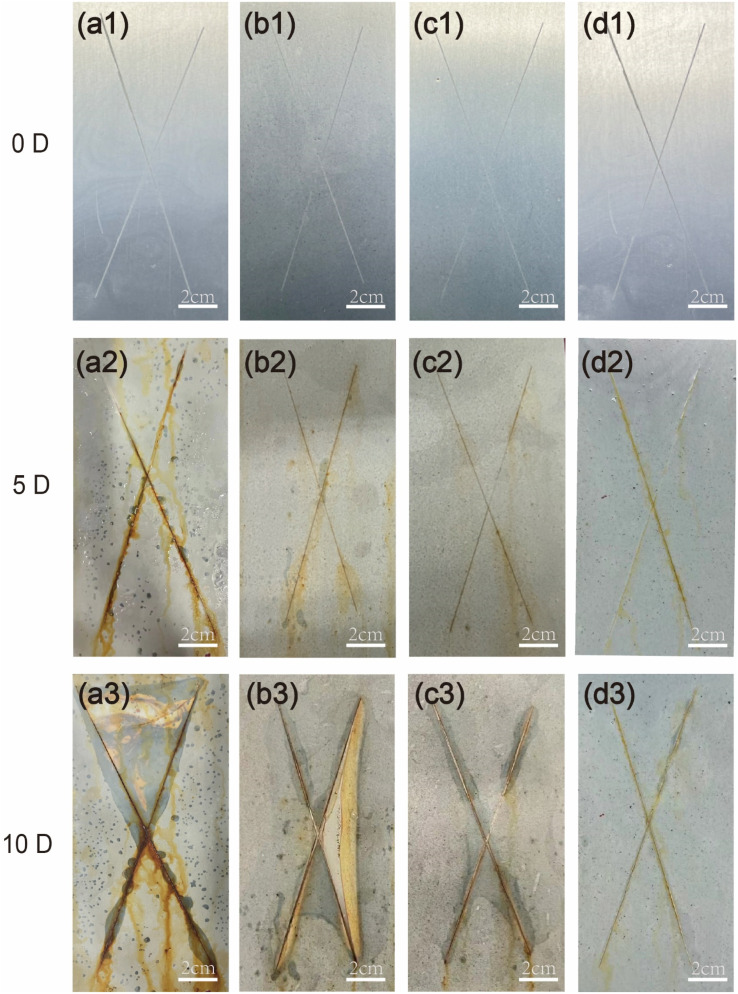
After scratching the surface of the prepared coating, it was placed in a salt spray chamber. Fig. 10 illustrates the corrosion condition of the coating surface after 5 and 10 days in the salt spray environment, which was used to evaluate the corrosion resistance of the coating. It is evident that in Fig. 10(a3), a substantial amount of rust products has appeared on the surface of the WEP coating. The primary reason for this is the presence of pores within the coating during the drying process, which facilitates the ingress and diffusion of corrosive ions. Fig. 10(b3) and 10(c3) respectively show a reduction in surface corrosion on the WEP/PCNS@CMCS coating and the PCNS@8-HQ/WEP coating, indicating that the presence of these components has enhanced the corrosion resistance of the coatings to some extent. As shown in Fig. 10(d3), the PCNS@CMCS@8-HQ/WEP composite coating showed only a minimal amount of rust products on the surface and lacked the black rust spots typically seen after corrosion, demonstrating a significant reduction in corrosion compared to the WEP coating and exhibiting excellent corrosion resistance.
Fig. 10. Visual observations of (a) WEP, (b) WEP/PCNS@CMCS, (c) WEP/PCNS@8-HQ, and (d) WEP/PCNS@CMCS@8-HQ after exposure to salt spray test conditions (5 wt% NaCl solution, pH 6.5–7.2) for 0, 5 and 10 days.
3.3. The corrosion protection mechanisms of coatings
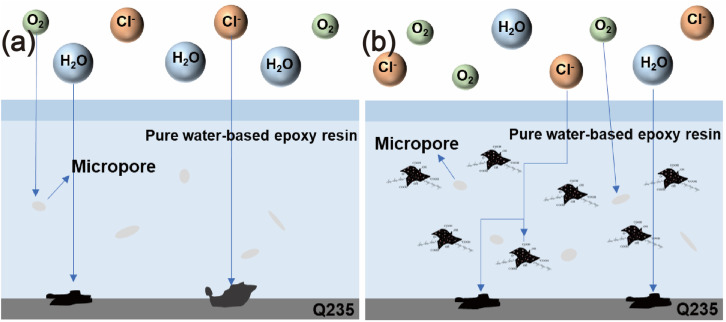
Fig. 11 illustrates the protective mechanism of the WEP/PCNS@CMCS@8-HQ coating. At the initial stage of the immersion experiment, the coatings remained unaffected by corrosion, effectively preventing the penetration of corrosive agents from the solution and providing good protection and shielding to the metal. As the immersion duration increased, the corrosive agents gradually infiltrated the defects and pores present in the cured coatings.43,44 The PCNS@CMCS@8-HQ in the WEP matrix offered effective anti-corrosion performance, extending the path of corrosive agent penetration and thereby enhancing the overall permeability and corrosion resistance of the coatings. Additionally, during the penetration process of erosive Cl−, CMCS exhibits a capturing effect, thereby reducing the content of free Cl− and further enhancing the coating's corrosion resistance. Simultaneously, based on the release of corrosion inhibitors due to its anion exchange capacity, 8-HQ demonstrates active corrosion inhibition at the metal/coating interface, this mitigated the extent of metal corrosion, demonstrating a positive self-healing function. Thus, utilizing the easily designed PCNS@CMCS@8-HQ fillers, with their Cl− capture and corrosion inhibition effects, constructs protective coatings that more effectively block corrosive agents.
Fig. 11. Schematic diagrams illustrating the corrosion and protection of (a) pure waterborne epoxy resin and (b) PCNS@CMCS@8-HQ-0.1 wt% coating.
4. Conclusion
In this study, functional hybrid materials were successfully prepared through an esterification reaction on the surface of PCNS using CMCS, and the corrosion inhibitor 8-HQ was incorporated into the porous structure. A higher specific surface area can enhance the loading capacity of corrosion inhibitors, The grafting rate of CMCS was determined to be 8%, and the loading rate of 8-HQ was 15.8%. This synthetic preparation of fillers effectively enhances the anti-corrosion performance of coatings. The release rate of the corrosion inhibitor was measured using an ultraviolet spectrophotometer. To verify the application of the prepared filler in metal anti-corrosion coatings, PCNS@CMCS@8-HQ was subsequently introduced into the WEP coating, and the corrosion resistance of WEP/PCNS@CMCS@8-HQ was tested using EIS. The electrochemical test results show that the low-frequency impedance of WEP/PCNS@CMCS@8-HQ is the highest measured at 1.7 × 10⁹ Ω cm2, this effectively mitigated corrosion on the metal surface. The reasons are as follows: (1) the ability of CMCS to capture corrosive chloride ions within the epoxy resin matrix; (2) the excellent barrier properties of biochar PCNS, and the corrosion inhibitor 8-HQ's effective corrosion inhibition and self-healing functions.
Data availability
Data available on request from the authors.
Author contributions
Weiyue Zhu: methodology, data curation, writing – original draft. Xin Li: conceptualization, investigation, formal analysis. Xiaoyan Liu: review and editing. Liang Bai: methodology. Xiaohu Wang: validation. Ao Li: visualization. Yujie Han: methodology. Chunguang Wei: supervision, reviewing and editing. Junhui Dong: supervision. Zeyu Guo: supervision. Jun Liu: supervision, review and editing, funding acquisition. Ding Nan: supervision, reviewing and editing, funding acquisition.
Conflicts of interest
The authors declare that they have no known competing financial interests or personal relationships that could have appeared to influence the work reported in this paper.
Supplementary Material
Acknowledgments
This work was financially supported by the Inner Mongolia Autonomous Region Major Science and Technology project (No. 2020ZD0024), Natural Science Foundation of Inner Mongolia (No. 2024LHMS05046), Local Science and Technology Development Project of the Central Government (No. 2021ZY0006, 2022ZY0011), the Project of Innovation Research in Postgraduate in Inner Mongolia (No. B20231023Z), Inner Mongolia Autonomous Region key Research and Technological Achievements Transformation Plan Project (No. 2023YFHH0063), Autonomous Region higher education Carbon peak carbon neutral research project (No. STZX202206), Basic Scientific Research Expenses Program of Universities directly under Inner Mongolia Autonomous Region (No. JY20220043) and Graphite and Graphene New Materials Discipline Team of Inner Mongolia University of Technology (No. PY202066). Science and Technology Projects of Inner Mongolia Autonomous Region (2024-2).
Electronic supplementary information (ESI) available. See DOI: https://doi.org/10.1039/d4ra07421a
References
- Zhou C. Pan M. Li S. Sun Y. Zhang H. Luo X. Liu Y. Zeng H. Adv. Colloid Interface Sci. 2022;305:102707. doi: 10.1016/j.cis.2022.102707. [DOI] [PubMed] [Google Scholar]
- Cheng M. Liu J. Liu Y. Jiang H. Li C. Sun S. Hu S. Chem. Eng. J. 2023;459:141532. [Google Scholar]
- Zheng L. Luo S. Yang S. J. Mater. Chem. Phys. 2023;306:128048. [Google Scholar]
- Pang L. Wang Z. Zheng Y. Lai X. Han X. J. Mater. Sci. Technol. 2020;54:95–104. [Google Scholar]
- He H. Liu Y. Xu Y. Yu S. Wang W. Liang F. Prog. Org. Coat. 2024;189:108303. [Google Scholar]
- Zhang X. Xiao G.-y. Jiao Y. Zhao X.-c. Lu Y.-p. Surf. Coat. Technol. 2014;240:361–364. [Google Scholar]
- Peng J. Chen B. Wang Z. Guo J. Wu B. Hao S. Zhang Q. Gu L. Zhou Q. Liu Z. Hong S. You S. Fu A. Shi Z. Xie H. Cao D. Lin C.-J. Fu G. Zheng L.-S. Jiang Y. Zheng N. Nature. 2020;586:390–394. doi: 10.1038/s41586-020-2783-x. [DOI] [PubMed] [Google Scholar]
- Tan Q. Gao Z. Yan J. Xia D. Hu W. Prog. Org. Coat. 2020;146:105675. [Google Scholar]
- Li C. Zhang C. He Y. Li H. Zhao Y. Li Z. Sun D. Yin X. Prog. Org. Coat. 2023;174:107276. [Google Scholar]
- Chen Z. Scharnagl N. Zheludkevich M. L. Ying H. Yang W. Chem. Eng. J. 2023;451:138582. [Google Scholar]
- Pourhashem S. Ghasemy E. Rashidi A. Vaezi M. R. J. Coat. Technol. Res. 2019;17:19–55. [Google Scholar]
- Yan M. Lan Y. X. Yeh J.-M. J. Taiwan Inst. Chem. Eng. 2024;154:105130. [Google Scholar]
- Cui G. Bi Z. Zhang R. Liu J. Yu X. Li Z. Chem. Eng. J. 2019;373:104–121. [Google Scholar]
- Cui M. Ren S. Zhao H. Xue Q. Wang L. Chem. Eng. J. 2018;335:255–266. [Google Scholar]
- Thorshaug K. Didriksen T. Jensen I. T. Almeida Carvalho P. Yang J. Grandcolas M. Ferber A. Booth A. M. Ağaç Ö. Alagöz H. Erdoğan N. Kuban A. Belle B. D. Nanoscale Adv. 2024;6:2088–2095. doi: 10.1039/d3na01057k. [DOI] [PMC free article] [PubMed] [Google Scholar]
- Fan N. Guo J. Jing G. Liu C. Wang Q. Wu G. Jiang H. Peng B. Nanoscale Adv. 2020;2:2548–2557. doi: 10.1039/c9na00660e. [DOI] [PMC free article] [PubMed] [Google Scholar]
- Xu Z. Wang X. Jiang H. Zhang Z. Shan D. Guo B. Qiu Y. Xu J. Sci. China: Technol. Sci. 2023;66:2080–2092. [Google Scholar]
- Chai M.-Z. An M.-W. Zhang X.-Y. Chu P.-K. Rare Met. 2021;41:540–545. [Google Scholar]
- Tian H. Wang C. Guo M. Cui Y. Gao J. Tang Z. Friction. 2020;9:315–331. [Google Scholar]
- Wang Y. Yan H. Ma M. Zhou C. Hou Q. Xu Z. Xia M. Ni H. Jia Y. Ye P. Polym. Adv. Technol. 2024;35:e6250. [Google Scholar]
- Zhu Q. Ong P. J. Goh S. H. A. Yeo R. J. Wang S. Liu Z. Loh X. J. Nano Mater. Sci. 2024;6:115–138. [Google Scholar]
- Lv R. Ren Y. Guo H. Bai S. Nano Mater. Sci. 2022;4:205–219. [Google Scholar]
- Gao X. Yan R. Lv Y. Ma H. Ma H. J. Cleaner Prod. 2020;266:121920. [Google Scholar]
- Gao X. Lv Y. Ma H. Ma H. Prog. Org. Coat. 2022;166:106820. [Google Scholar]
- Song L. Jing S. Qiu Y. Liu F. Li A. Chin. Chem. Lett. 2023;34:107180. [Google Scholar]
- Ashassi-Sorkhabi H. Kazempour A. Carbohydr. Polym. 2020;237:116110. doi: 10.1016/j.carbpol.2020.116110. [DOI] [PubMed] [Google Scholar]
- Xu Y. Liu R. Shao Z. Chen L. Wei W. Dong S. Wang H. Prog. Org. Coat. 2024;186:108015. [Google Scholar]
- Ghamsarizade R. Najafi S. Sarabi A. A. Roshan S. Eivaz Mohammadloo H. Prog. Org. Coat. 2023;174:107290. [Google Scholar]
- Wang M. Wang J. Hu W. Prog. Org. Coat. 2020;139:105434. [Google Scholar]
- Lu S. Y. Jin M. Zhang Y. Niu Y. B. Gao J. C. Li C. M. Adv. Energy Mater. 2017;8:1702545. [Google Scholar]
- Ma H. Yang J. Gao X. Liu Z. Liu X. Xu Z. J. Hazard. Mater. 2019;369:550–560. doi: 10.1016/j.jhazmat.2019.02.063. [DOI] [PubMed] [Google Scholar]
- Zhang Q. Wei Q. Huang K. Liu Z. Ma W. Zhang Z. Zhang Y. Cheng H.-M. Ren W. Natl. Sci. Rev. 2023;10:nwad147. doi: 10.1093/nsr/nwad147. [DOI] [PMC free article] [PubMed] [Google Scholar]
- Nguyen D. C. T. Cho K. Y. Oh W.-C. Sep. Purif. Technol. 2019;211:646–657. [Google Scholar]
- Ide Y. Koike Y. Ogawa M. J. Colloid Interface Sci. 2011;358:245–251. doi: 10.1016/j.jcis.2011.02.018. [DOI] [PubMed] [Google Scholar]
- Yu S. He J. Zhang Z. Sun Z. Xie M. Xu Y. Bie X. Li Q. Zhang Y. Sevilla M. Titirici M. M. Zhou H. Adv. Mater. 2024;36:2307412. doi: 10.1002/adma.202307412. [DOI] [PubMed] [Google Scholar]
- He D. Gao Y. Wang Z. Yao Y. Wu L. Zhang J. Huang Z.-H. Wang M.-X. J. Colloid Interface Sci. 2021;581:238–250. doi: 10.1016/j.jcis.2020.07.118. [DOI] [PubMed] [Google Scholar]
- Mou J. Luo J. Liu Z. Yao X. Li L. Shi R. Biomass Convers. Biorefin. 2023;14:18563–18577. [Google Scholar]
- Zhang C. Li W. Guo Z. Sun T. Wang W. Chen S. Prog. Org. Coat. 2023;177:107441. [Google Scholar]
- Kong D. Ma C. Wang W. Liu C. Tian Y. Wang T. Zhao Z. Zhang C. Feng H. Chen S. Chem. Eng. J. 2022;427:131734. [Google Scholar]
- Li J. Gao N. Zhang W. Xu L. Nwokolo K. I. Wu H. Liu F. Han E.-H. Sci. China: Technol. Sci. 2023;66:2381–2395. [Google Scholar]
- Hoshi Y. Miyazawa R. Otani Y. Kim D. Takata N. Kobashi M. Corros. Sci. 2024;232:112018. [Google Scholar]
- Zhang M. Xu F. Lin D. Peng J. Zhu Y. Wang H. Chem. Eng. J. 2022;446:137078. [Google Scholar]
- Chen Y. Wu L. Yao W. Wu J. Xiang J. Dai X. Wu T. Yuan Y. Wang J. Jiang B. Pan F. J. Mater. Sci. Technol. 2022;130:12–26. [Google Scholar]
- Fattah-alhosseini A. Chaharmahali R. J. Magnesium Alloys. 2023;11:4390–4406. [Google Scholar]
Associated Data
This section collects any data citations, data availability statements, or supplementary materials included in this article.
Supplementary Materials
Data Availability Statement
Data available on request from the authors.


