Abstract
Nocturnal hypoglycemia is a critical problem faced by diabetic patients. Failure to intervene in time can be dangerous for patients. The existing early warning methods struggle to extract crucial information comprehensively from complex multi-source heterogeneous data. In this paper, a deep learning framework with an innovative dynamic attention mechanism is proposed to predict nocturnal hypoglycemic events for type 1 diabetes patients. Features related to nocturnal hypoglycemia are extracted from multi-scale and multi-dimensional data, which enables comprehensive information extraction from diverse sources. Then, we propose a prior-knowledge-guided attention mechanism to enhance the network's learning capability and interpretability. The method was evaluated on a public available clinical dataset, which successfully warned 94.91% of nocturnal hypoglycemic events with an F1-score of 96.35%. By integrating our proposed framework into the nocturnal hypoglycemia early warning model, issues related to feature redundancy and incompleteness were mitigated. Comparative analysis demonstrates that our method outperforms existing approaches, offering superior accuracy and practicality in real-world scenarios.
Keywords: Feature extraction, Attention mechanism, Nocturnal hypoglycemia early alarm, Type 1 diabetes, Deep learning
Introduction
Diabetes mellitus is one of the commonest chronic diseases [1], which is generally categorized into type 1 diabetes (T1D), type 2 diabetes (T2D), and gestational diabetes [2]. Due to the inability in insulin production and utilization, the blood glucose levels are consistently higher than normal for diabetic patients without proper treatment. As the most effective method of lowering blood glucose levels, insulin therapy is essential for the treatment of T1D and longer-lasting T2D [3, 4]. Hypoglycemia is one of the serious adverse effects of diabetes treatment and is a major obstacle to achieving optimal glycemic control [5]. Studies have found that nocturnal hypoglycemia is common in diabetic patients treated with insulin [6]. The nocturnal hypoglycemia is extremely dangerous for the diabetic patients as the patients’ response to hypoglycemia is reduced considerably and the physiological defenses against hypoglycemia is significantly lower during sleep [7].
Traditional assessment of blood glucose testing is usually achieved by continuous glucose monitoring (CGM) systems. However, it takes time for the consumed carbohydrates/glucose to raising the blood glucose level. Therefore, it is necessary to predict the hypoglycemic event before it occurs [8]. With the increasing popularity of big-data analytics methods, machine learning and deep learning methods have been widely used in the medical field by using classical network regression or classification [9, 10].
Conventional methods based on physiological and clinical parameters are usually used in clinical studies [11] to predict hypoglycemia. Bayrak et al. [12] used the Recursive Autoregressive Partial Least Squares algorithm on CGM sensor data to model. Zhu et al. [13] proposed a Convolutional Neural Network (CNN) model with CGM, insulin, and dietary intake to predict blood glucose (BG) levels. Jun et al. [14] proposed an autoregressive integrated moving average model. This method relies too much on the predicted blood glucose and requires sufficient prediction accuracy. In addition to the above methods, classification models have also been used in early warning tasks. Lena et al. [15] warned of nocturnal hypoglycemia by continuous electroencephalogram monitoring and automated real-time analysis. Slander et al. [16] proposed a CGM data-based early warning system that provides complementary information through autonomic nervous system response characteristics. Although several methods exist to predict hypoglycemia, the following challenges remain. First, the complexity of time series data results in information loss and redundancy in obtaining nocturnal hypoglycemia information from time series data. Secondly, time series data features are difficult to capture, and relying only on predictive warnings does not maximize information utilization. Intra- and inter-individual variability and the complexity of different variables in glucose dynamics also pose a significant obstacle to problem-solving.
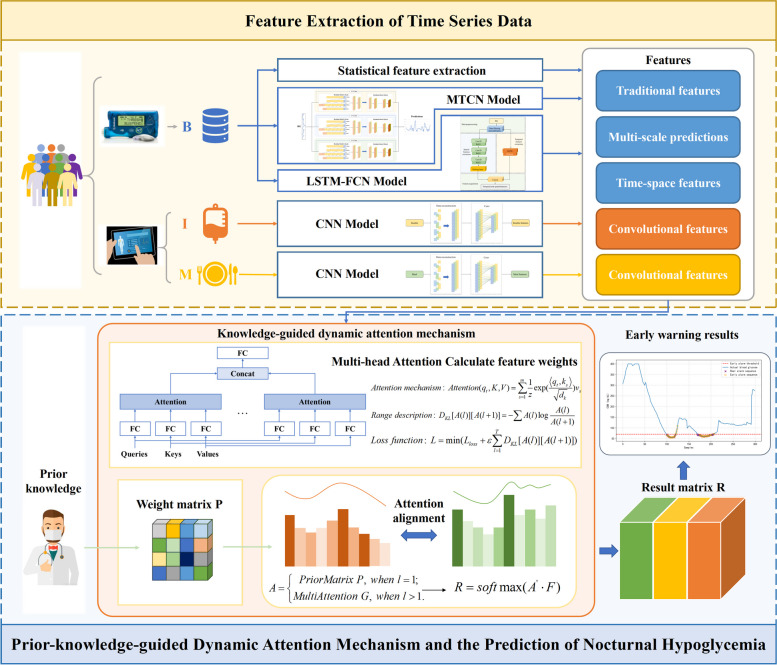
To overcome the above problems, in this paper, we propose a deep learning framework (Fig. 1) for hypoglycemic events forecasting based on dynamic attentional feature fusion inspired by clinical prior knowledge. The framework considers asynchronous information from different input variables and performs dynamic nocturnal hypoglycemia warning based on their features. The early warning framework includes two parts: feature mining and attention module. The feature mining part considers the complexity of different variables in BG dynamics and multifaceted features. In the attention module, since data features are affected by individual and temporal variability, a priori knowledge-guided dynamic attention fusion method is designed to capture feature salience dynamically under knowledge guidance. The main contributions of this paper are as follows:
Fig. 1.
Framework of the proposed method
In order to maximize the information utilization of the input data, the proposed feature mining module mines asynchronous variable features from different scales and dimensions, fuses prediction with early warning and avoids redundancy and incompleteness of input information.
To judge the value of information based on real world experience, the proposed attention mechanism adopts a priori knowledge guidance, which can dynamically calculate the attention weights based on clinical experience and enhance the interpretability of the method while removing redundant features.
Addressing the complexity of changes in different time-series variables in BG dynamics, a deep learning framework based on dynamic attention feature fusion is proposed for accurate blood glucose early warning.
Materials and methods
Traditional feature mining
The measurement of BG provided by CGM sensor is time series sequence, and its feature extraction methods contain statistics-based, frequency domain, modeling, and machine learning. Among them, statistical-based feature extraction methods can represent the clinical information embedded in BG data [17]. The traditional features in this paper include statistical features and clinical parameter features. Statistical features include: BG extreme deviation , which reflects the discrete state of BG; BG standard deviation , which observes the volatility of BG data; BG mean , median , and mode . Clinical parameter features are based on the continuous BG monitoring parameters combined with the clinical knowledge as the basis of feature extraction. These include: nadir BG value and BG coefficient of variation .
Clinical sequence deep characterization
In the clinical setting, diet and insulin incorporation impact the patient's BG level. The insulin remaining active within the body can be represented using a two-compartment model that estimates the insulin on board (IOB) [18]:
| 1 |
| 2 |
| 3 |
where is the time instant, the compartments and are insulin mass (mU) in the accessible and non-accessible subcutaneous compartments, and (mU ) is the insulin infusion rate. () is a constant related to the duration of insulin action (DIA), which characterizes the patient’s insulin activity dynamics.
Carbohydrates (CHO) on board (COB) represents the remaining CHO amount of a meal that has not yet appeared in the blood glucose. It describes the appearance rate () of glucose in the blood due to CHO intake [19]:
| 4 |
| 5 |
where is the amount of CHO ingested and is the bioavailability. denotes the maximum appearance rate time of glucose in the accessible glucose compartment. is the time instant when the meal is consumed.
In terms of the form of input variables, clinical series are time series without a fixed period. Therefore, diet and insulin data are subjected to data reconstruction to ensure the consistency of the different variables. Data reconstruction is achieved through the operation of filling zeros at empty values. We then used a convolutional neural network [20] to extract features from the reconstructed clinical data.
Multi-scale predictive features
Due to the time-dependent nature of time series, the current observation is affected by the previous observations. If the forecast results are used as one of the features, the correlation between the time series data can be captured, providing a more comprehensive representation of the features.
Deep neural networks are currently considered for modelling many complex tasks. However, many traditional neural networks are unable to adequately capture information from complex time series data. Temporal convolutional networks [21] (TCNs) are employed for BG time series prediction with controllable sensory field sizes. In general, a one-dimensional convolutional network with layers and a kernel size of has a receptive field of:
| 6 |
The number of solution layers is:
| 7 |
where is the receptive field size.
The sensory field width is:
| 8 |
where represents expansion base.
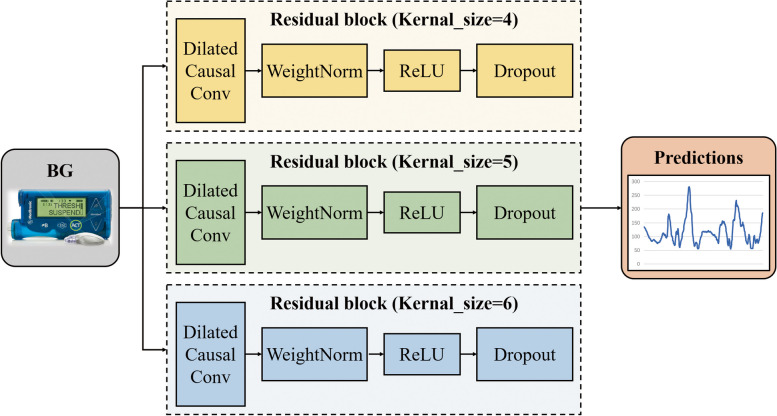
However, this network has the limitation of using a single CNN with the same kernel size. Therefore, the Multiple Temporal Convolution Network (MTCN) is proposed in this work (Fig. 2), which utilizes convolutional kernels with different sizes to extract features from different time scales and achieve complementary information. We experimentally adjusted the value of kernel size and finally defined the values of kernel size in the multiscale network as 4, 5 and 6 (Table 1).
Fig. 2.
Framework of the MTCN
Table 1.
Prediction results of different kernel sizes in TCN network on OhioT1DM dataset
| RMSE () | MAE () | |
|---|---|---|
| MTCN | 14.160 | 9.617 |
| TCN(kernel size = 4) | 14.450 | 9.815 |
| TCN(kernel size = 5) | 14.554 | 9.787 |
| TCN(kernel size = 6) | 14.343 | 9.663 |
Glucose sequence deep characterization
Traditional early warning methods usually obtain temporal features from the data, which are not sufficiently characterized. Spatio-temporal feature is considered an information supplement to reduce the dependence of the early warning model on the predicted values.
Long short-term memory fully convolutional neural network (LSTM-FCN) is used as a spatio-temporal feature extraction model to merge temporal and spatial factors (Fig. 3). Fully Convolutional Networks (FCN) are commonly used in image segmentation [22, 23]. In this paper, FCN [24] is used as a feature extractor. And the basic convolution blocks are implemented as follows:
| 9 |
| 10 |
Fig. 3.
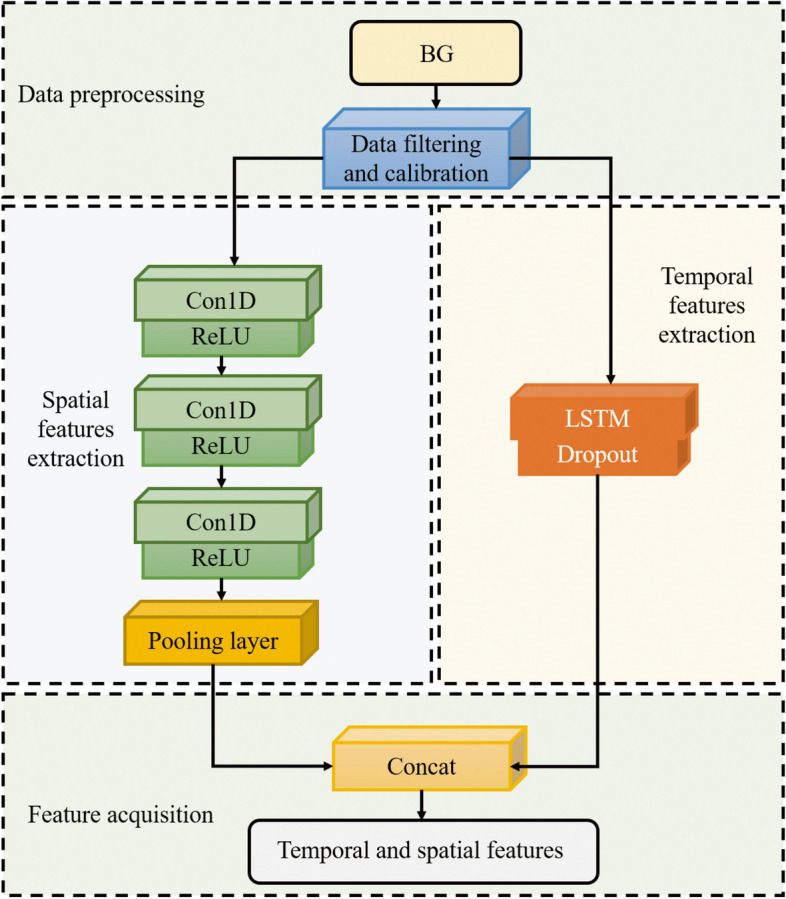
Framework of the LSTM-FCN
The output value of the convolution kernel is obtained by convolutional neural network in Sect. " Clinical Sequence Deep Characterization". is then obtained by the normalization operation. is finally obtained using the ReLU activation function. Each block is accompanied by a batch normalization and ReLU activation layer after which the convolved features are fed into the global average pooling layer. The main limitation of ReLU is the 'dying ReLU' problem, in which neurons using ReLU activation cease learning and output a constant zero value when they encounter large negative inputs. This problem not only affects the slope at zero, but extends to all negative input values. To solve this problem, leaky ReLU is a common solution. Therefore, the activation function of the neural network in this paper has also been adjusted to leaky ReLU for experiments.
Long Short-Term Memory (LSTM) [25] is a type of Recurrent Neural Networks (RNN) [26] that learns long-term dependent information. There are three kinds of gate structures included in the LSTM which are forgetting gate, input gate, and output gate. The specific parameters of LSTM-FCN are shown in Table 2.
Table 2.
The detailed parameters of LSTM-FCN
| Structure | Parameter | |
|---|---|---|
| Global hyper-parameter | Optimizer | Adam |
| Learning rate | 0.001 | |
| Mini-batch size | 32 | |
| Maximum number of epochs | 50 | |
| LSTM | Number of hidden units | 8 |
| FCN | Number of kernels | 128 |
| 256 | ||
| 128 | ||
| Size of kernels | 8 × 1 | |
| 5 × 1 | ||
| 3 × 1 | ||
| Weight initializer method | he_uniform | |
Prior-knowledge-guided dynamic attention mechanism
In order to ensure the completeness of information and improve the warning accuracy of existing data-driven models, the combined effect of different types of features needs to be considered. Attention mechanisms [27] can enhance informativeness by automatically learning features that are more important for early warning based on input information. However, in practice it is desired that the model can learn different behaviors based on the same attention mechanism and combine different behaviors as knowledge. Therefore, a multi-head attention mechanism (Fig. 4) is used, where the outputs of different attention pooling are spliced together and transformed by another linear projection that can be learned to produce the final output.
Fig. 4.
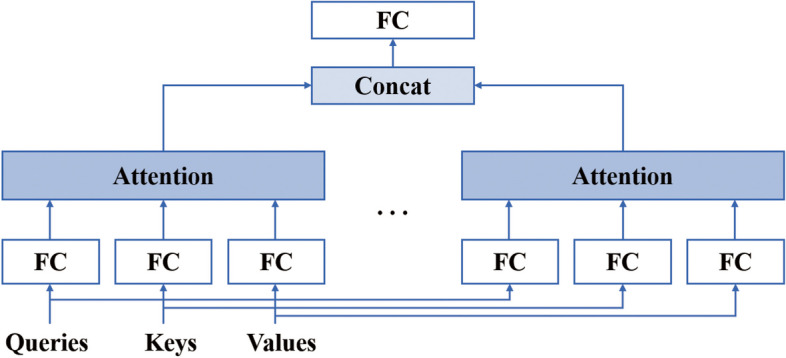
Multi-head attention
Although the attention mechanism can generate attention weights from features, the process of this weight generation is not controllable. In model training, this process may cause the training weights to deviate from prior knowledge. Inspired by this, the distribution of the weights is captured in advance, and the process is guided by incorporating domain knowledge. Their weights are artificially increased for features that have been shown to have a greater impact on the final warning results.
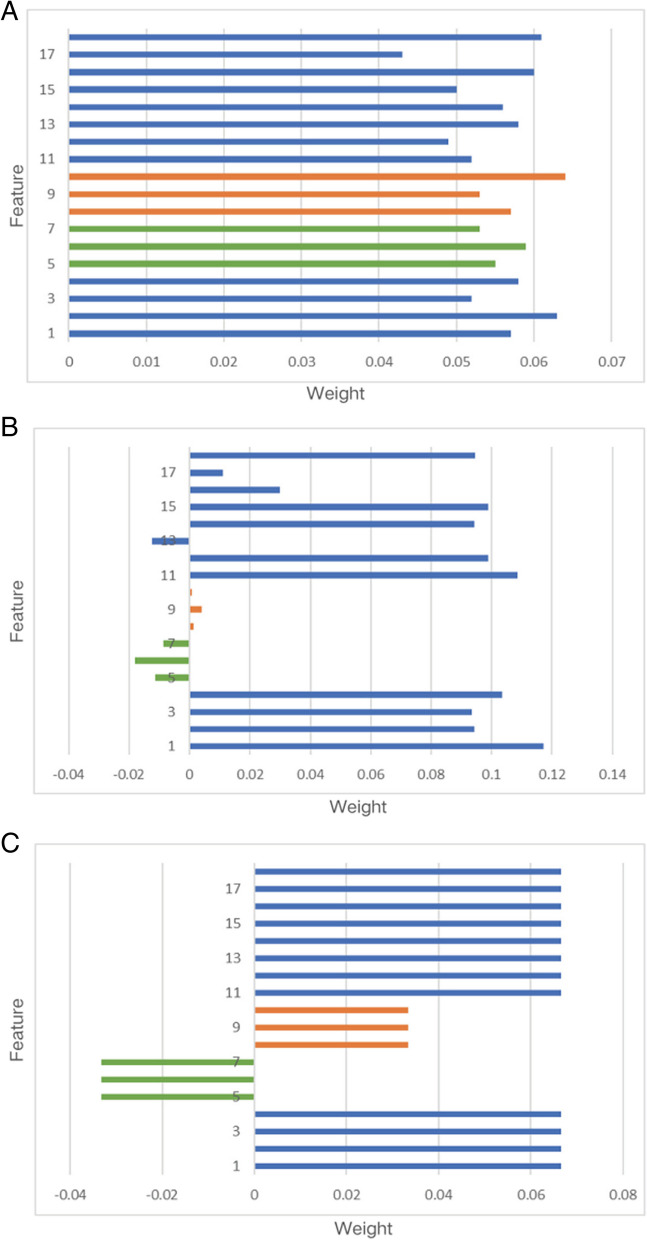
Feature description: 1 is a predicted value, 2–4 are deep features, 5–7 are dietary features, 8–10 are insulin features, 11–17 are clinical features, and 18 is the label.
To provide an intuitive understanding of the proposed model, we further visualize the attention matrices. An initial weight matrix is often randomly defined in the attention mechanism (Fig. 5A). But this does not provide a valuable guide to the final warning result. We calculate the similarity between features and nocturnal hypoglycemic events by Pearson's coefficient. Figure 5B shows that the correlation between insulin and diet and the occurrence of nocturnal hypoglycemic events is relatively low. It has been found that patients with continuous glucose monitors (CGM) do not need to be overly concerned about nocturnal hypoglycemia [6]. This is because the detected blood glucose value has a greater impact on the early warning results. Inspired by this, the prior matrix should be predefined as a guide for generating the attention weights. In detail, we first define an arithmetic matrix . Then, features that have been shown to have a greater influence on the final hypoglycemic event are artificially increased in weight . Referring to previous studies and incorporating the results of the correlation analysis, the trend of the weight distribution is given (Fig. 5C). The a priori probability attention weight P can be defined as:
| 11 |
is the number of features.
Fig. 5.
Correlation analysis and initial weight matrix P and attention weight (A: Random weight; B: Initial weight; C: Attention weight)
The samples highly influenced by insulin and diet also need to be fine-tuned regarding their feature weights. Samples sensitive to insulin and dietary intake are trained by the dynamic attention mechanism to increase the weight share of these two inputs.
In the attentional transformation, we want the weights of each layer to be gradually improved within a certain range, instead of drastically deviating from the weights of the previous layer. This process is achieved by describing the distances. And the introduction of Kullback–Leibler (KL) divergence can measure the difference between two probability distributions. Therefore we use KL divergence to align the distribution of weights. Note that the weight matrix :
| 12 |
After obtaining the initial attentional weights, the KL divergence of the two neighboring layers is calculated. To force the attention distribution of the layer to be close to that of the layer. In this way, prior knowledge can better guide the generation of self-attention distribution.
| 13 |
where is the temporal attention generated from the block. represents the prior attention when .
We reconstruct the loss function by using this function describing the distance as part of the loss function:
| 14 |
| 15 |
Finally, the obtained final attention weight matrix is combined with the feature to obtain the final warning result.
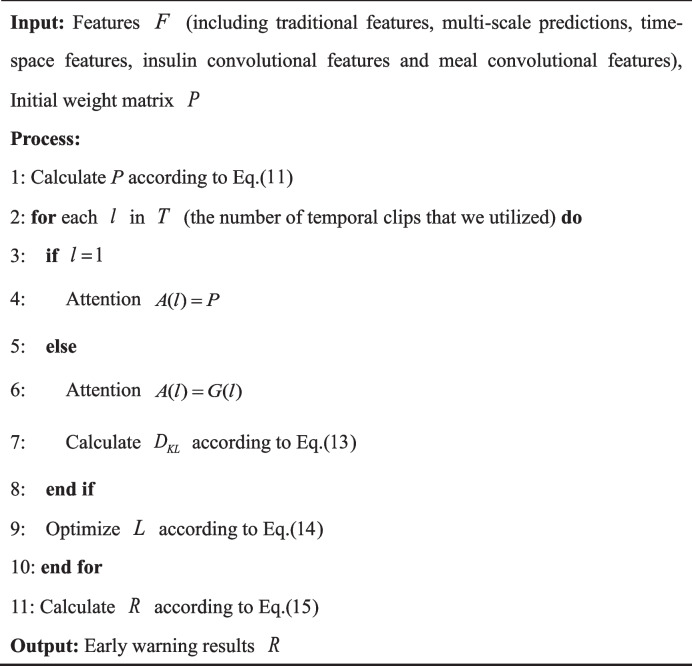
Algorithm 1 Knowledge-guided dynamic attention mechanism
Results
Dataset
The OhioT1DM dataset contains eight weeks' worth of CGM, insulin, physiological sensors, and self-reported life-event data for each of 12 people with type 1 diabetes [28]. The dataset contains data sampling dates, time stamps, and corresponding CGM records calibrated by finger prick at intervals. The OhioT1DM dataset is pre-divided into the training set and test set for the BG level prediction challenge. Specifically, the training set contains about 40 days of data, and the test set contains about 10 days of data. Individuals with insufficient data were excluded because long-term data are required to determine nocturnal hypoglycemia. After preprocessing, we retained 10 patient training and testing datasets for our experiments. It's worth noting that although the number of subjects is relatively small, each subject provided 288 blood glucose samples per day. This data volume is substantial for LSTM glucose prediction. We labeled glucose below threshold (70 mg/dL) as hypoglycemic label, totaling more than 7,000 samples, with nearly 300 hypoglycemic labels. In order to avoid training losses caused by data imbalance, positive and negative samples were balanced by over-sampling before training. Specifically, we used the RandomOverSampler to identify the underrepresented classes in the dataset and randomly selected samples from these classes to duplicate until the sample counts across each class were approximately equal. Regarding model training, we ensure that the number of features is proportional to the number of hypoglycemic samples to prevent overfitting. Because when hypoglycemic samples are scarce, an excessive number of features can lead the model to overfit on these limited samples, resulting in good performance on the training data but poor generalization to new data.
Additionally, despite the limited number of subjects in the dataset, there is considerable diversity within it. Variability exists between each and across different days for the same subject, enhancing the richness and diversity of the dataset. The input data used in this paper includes CGM, dietary information and insulin. CGM data involves continuous measurement of glucose levels over time. It provides information about changes in blood glucose levels. Dietary information includes detailed information about food intake and helps the model to capture the relationship between eating habits and nocturnal hypoglycemic events. Insulin data takes into account insulin use. The inclusion of insulin information helps to assess the effect of insulin dose on blood glucose levels.
Preprocessing
CGM may generate noise or outliers during the measurement process. The transmission of such data may bring outliers when recording the data and affect the model's training process. Therefore, smoothing the CGM data in the proposed framework can make it more stable. This paper adopts the Savitzky-Golay smoothing filtering method [29] to process CGM data. In order to achieve a relatively smoother result while retaining sufficient local features, the frame length was set to 7. Within each sliding window, a 3rd order polynomial was used to fit the raw data.
Data normalization is aligning data of different size ranges to the same size range [30]. It allows different data to be put together for comparison and manipulation. All input variables in this framework, BG values, dietary intake, and insulin infusion, were used to realign the data distribution to a standard normal distribution using Z-score standardization.
| 16 |
where Z is the normalized data and x is the raw data.
Evaluation metrics
Early warning rate, false alarm rate, missed alarm rate, accuracy rate, and F1-score are used to evaluate the performance of early warning methods [31]. Accuracy rate cannot be used as the primary reference metric when the samples are not balanced. A high warning rate may result in many false warnings, but it applies to the likelihood of being detected for serious times and is an essential measure of hypoglycemic alerts. The F1-score carries out a trade-off between two contradictory metrics, precision and recall (warning rate), to evaluate a model comprehensively. The intersection of different categories of predicted and actual values of the model lead to the corresponding confusion matrix [32].
Performance of the model
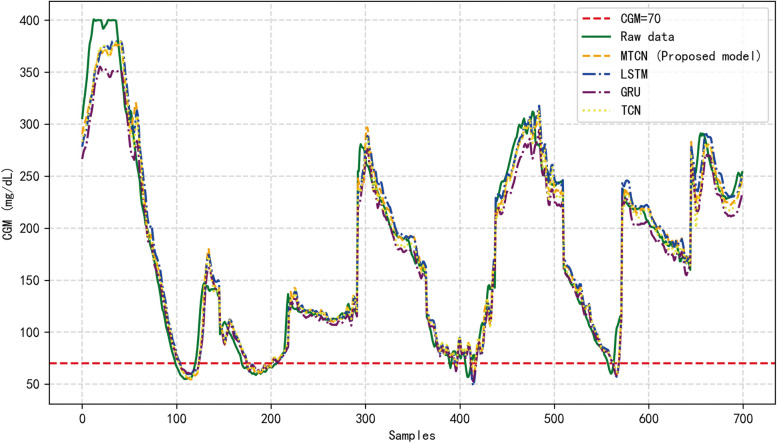
Table 3 lists the average 30-min prediction performance of the different models in the OhioT1DM dataset, including RMSE, and MAE, corresponding to the proposed MTCN, LSTM, and GRU methods. However, all methods have different levels of delay in predicting the BG values as shown in Fig. 6.
Table 3.
Prediction results of different models on OhioT1DM dataset
| RMSE () | MAE () | |
|---|---|---|
| MTCN | 14.160 | 9.617 |
| LSTM | 15.086 | 10.144 |
| GRU | 16.806 | 11.948 |
Fig. 6.
BG prediction with four methods. Note: to facilitate the display of results, data from different nights of the same patient were spliced into the same image
Figure 6 shows a patient's BG raw data and the prediction results corresponding to MTCN prediction method proposed in this paper as well as other methods. As can be observed from the figure, MTCN is more sensitive to changes in data fluctuations. In contrast, the changing trend of the proposed model is closest to the actual BG value because other methods cannot capture relevant information of arbitrary length, which can result in insufficient information.
In the nocturnal hypoglycemic warning experiment, according to the proposed method, feature mining techniques are first employed to learn the characteristics of input data. The mined features include traditional features, multi-scale prediction features, clinical sequence deep features, and BG sequence deep features. Subsequently, a classification model is trained using an attention mechanism, taking into account the combined effects of different types of features. During the learning process of attention weights, prior knowledge is utilized to guide the process and obtain the final warning results. Additionally, regularization technique Dropout is incorporated into the classification model to prevent overfitting. The hypoglycemic threshold of clinical data was set at the level of 70 mg/dL and used to support nocturnal hypoglycemic warning. The BG data of 10 patients were applied to evaluate the effectiveness of the framework proposed in this paper.
The proposed method was compared with four other methods containing Threshold warning, Random Forest (RF), Support Vector Machine (SVM), Traditional features. Threshold warning is a basic early warning method that sets thresholds to determine if a particular indicator exceeds or reaches a predetermined alert level. Random Forest is an integrated learning method that builds a powerful model by combining multiple weak learners (decision trees). Support Vector Machine is a supervised learning algorithm used for classification and regression analysis. It works by finding the optimal hyperplane in the data space to separate different classes while maximizing the margin between data points of different classes for optimal classification performance. Traditional feature methods use a pre-defined set of features for model training and prediction. These features can be attributes that are considered relevant to the prediction goal in the domain knowledge. Table 4 describes the hyperparameters of the above model. Table 5 lists the 30-min nocturnal hypoglycemia warning performance for patients.
Table 4.
Early warning model hyper-parameters
| Early warning model | Parameter | |
|---|---|---|
| Proposed model | Maximum number of epochs | 50 |
| Mini-batch size | 64 | |
| Optimizer | Adam | |
| Threshold warning | Threshold | 70 mg/dL |
| RF | N_estimators | 100 |
| Max_depth | 5 | |
| SVM | Kernel | Linear |
| C | 1.0 | |
| Traditional features | Maximum number of epochs | 50 |
| Mini-batch size | 64 | |
| Optimizer | Adam | |
Table 5.
Nocturnal hypoglycemia warning results of different models on the OhioT1DM dataset
| Early warning model | Accuracy | Recall | Missed | False | F1-score | Training time (Unit: Seconds) |
FLOPs (Unit: K) |
|---|---|---|---|---|---|---|---|
| Proposed model | 98.4% | 94.12% | 5.88% | 1.43% | 96.21% | 50.02 | 175.58 |
| Threshold warning | 98.87% | 75.74% | 24.26% | 0.24% | 85.77% | 0.33 | 1.16 |
| RF | 98.43% | 87.5% | 12.5% | 1.15% | 92.64% | 1.21 | 18.8 |
| SVM | 98.13% | 92.65% | 7.35% | 1.66% | 95.31% | 1.13 | 18.6 |
| Traditional features | 98.61% | 89.71% | 10.29% | 1.05% | 93.95% | 33.00 | 115.05 |
As shown in Table 5, the proposed framework outperforms other methods in four medium metrics: accuracy rate, warning rate, miss rate, F1-score, training time and FLOPs (Floating Point Operations Per Second). Therefore, it can be found that the proposed framework is more sensitive to different patients and boundary region states. It is usually desired that both precision rate and recall rate are at a high level, but these two metrics are contradictory in deep learning. Expecting a high precision rate requires sacrificing some of the recall rate. In a clinical situation, it is desired to minimize misses while having a relatively small number of false positives. A high F1-score value indicates that this method balances the precision and recall metrics well. However, in terms of computational complexity, the proposed framework entails higher computational demands due to the incorporation of multi-scale predictive features and a dynamic attention mechanism. Despite this, the training time remains within an acceptable range. For the experiments conducted in this paper, we used an Intel(R) Core(TM) i7-8550U CPU @1.80 GHz 1.99 GHz processor with 8 GB of RAM, leveraging the NVIDIA GeForce MX130 graphics card for deep learning tasks. The operating system was Windows 11, and the experimental code was written in Python 3.10.11, relying on the TensorFlow 2.10.0 framework. This indicates that our method does not demand high-end experimental equipment; rather, ordinary computing resources suffice. Future efforts can further reduce training time and computational demands.
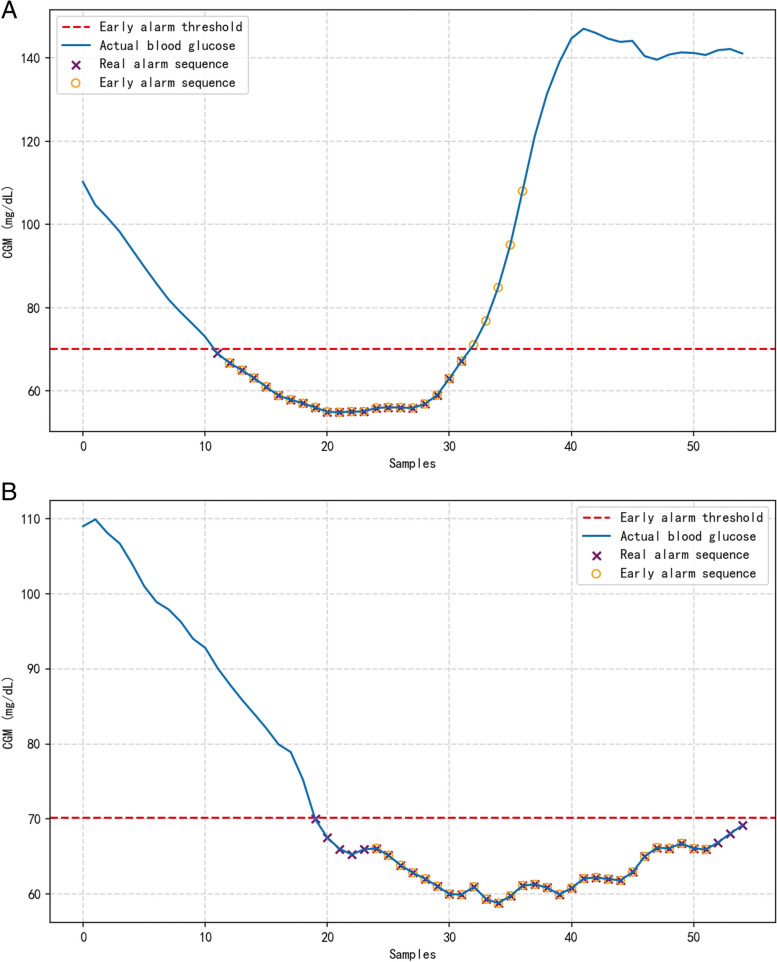
In order to verify the validity of the methodology of this paper, we looked at the nocturnal hypoglycemic alerts of different patients separately. The blue curve in Fig. 7 indicates the real blood glucose data, and the purple and orange icons mark the real warning and the warning result sequences, respectively. Figure 7A and B depict the early warning results of 30 min ahead of time nocturnal hypoglycemia for different patients. The method proposed in this paper can accurately predict most of the hypoglycemic conditions and can predict most points below the threshold in different blood glucose fluctuation states. This shows that the model has good adaptive performance.
Fig. 7.
Early warning results of nocturnal hypoglycemia in the proposed model (a: patient A; b: patient B)
The ablation experiment was used to assess the validity of the structure proposed in this paper. The details of the experiments are that Model A contains the full set of features described in the second part of this paper as well as the dynamic attention mechanism. Model B is the result of a threshold warning that relies on predicted values. Model C removes the inputs of diet and insulin. Model D removes the dynamic attention mechanism and degenerates into a self-attentive model. As illustrated in Table 6, the proposed model (model A) achieved the best performance. The threshold warning (model B) method, which only considers predicted values and lacks information on the temporal correlation of process variables, still has some errors in predicting blood glucose values. Errors occurring on the warning boundary lead to a high underreporting rate of the method. While the feature information incorporated in Model C is insufficient and lacks information sufficient to accurately classify hypoglycemia from non-hypoglycemia. Model D relies only on self-attentive mechanisms trained without prior knowledge guidance and lacks information and interpretability of judgements on actual clinical events. The proposed method does not lose relevant and necessary information and also increases the interpretability of the model, adding accurate empirical knowledge to the end-to-end model.
Table 6.
Results of ablation experiments
| Early warning model | Accuracy | Recall | Missed | False | F1-score |
|---|---|---|---|---|---|
| Proposed model (model A) | 98.4% | 94.12% | 5.88% | 1.43% | 96.21% |
| Model B | 98.87% | 75.74% | 24.26% | 0.24% | 85.77% |
| Model C | 99.06% | 79.78% | 20.22% | 0.2% | 88.38% |
| Model D | 98.7% | 89.71% | 10.29% | 0.95% | 93.99% |
Many existing studies focus on building hypoglycemia warning models based on CGM data [33–36]. Comparing our results with similar literature, [33] proposes a personalized alarm system using LSTM models. Their report demonstrates the ability to correctly detect 77% of hypoglycemic events. An effective prediction model is established based on data features [36], achieving an 87.83% hypoglycemia alarm rate. The comparison highlights that solely relying on prediction values for hypoglycemia warning can be overly dependent on the model, potentially leading to the loss of valuable input information. Our proposed dynamic warning method guided by prior knowledge achieves a hypoglycemia alarm rate of 94.91% in the test data, effectively identifying a significant portion of hypoglycemic risks. This approach is beneficial for patients to take timely measures to prevent the occurrence of hypoglycemic events. To validate the effectiveness of our model, we conducted cross-validation. In order to verify the validity of the model, we carried out cross-validation. We trained and evaluated the model using fivefold cross-validation to ensure its generalization across different subsets. The cross-validation results show the performance metrics of each model in the early warning task, including accuracy, recall, miss, false positive, and F1 scores. The average performance of each model is as follows: accuracy rate of 97.66% (± 0.20%), recall rate of 94.91% (± 0.49%), miss rate of 5.49% (± 1.79%), false positive rate of 2.22% (± 1.05%), and F1 score of 96.35% (± 0.20%). These results show that our model is robust on different data subsets and has good generalization ability. These results show that our model is robust on different data subsets and has good generalization ability.
Discussion
Our study successfully warned 94.91% of nocturnal hypoglycemic events with an F1-score of 96.35%. The results suggest that the proposed warning framework can identify nocturnal hypoglycemic events in a timely manner. As the model is guided by a priori knowledge, it is able to improve the effectiveness of the early warning method by not deviating from realistic scenarios during the training process. At the same time, this deep learning-based framework may help to develop personalized early warning methods for other events.
In our study, the attention mechanism is applied to a nighttime hypoglycemia warning task. It endows the model with powerful feature selection and weight adjustment capabilities. On this basis, we introduce a priori knowledge to avoid the training process of the model to be detached from the real situation, e.g., diet promoting the occurrence of hypoglycemic time. In addition, we further visualized the temporal weighting matrix generated by the proposed method, the general attention mechanism, during a nocturnal hypoglycemia warning. Traditionally, meal is negatively correlated with nocturnal hypoglycemic events. However, as shown in Fig. 8A, the final feature weights obtained by randomly initializing the weight matrix tend to discriminate meal as positively correlated with nocturnal hypoglycemia. This finding contradicted actual hypoglycemia diagnosis.
Fig. 8.
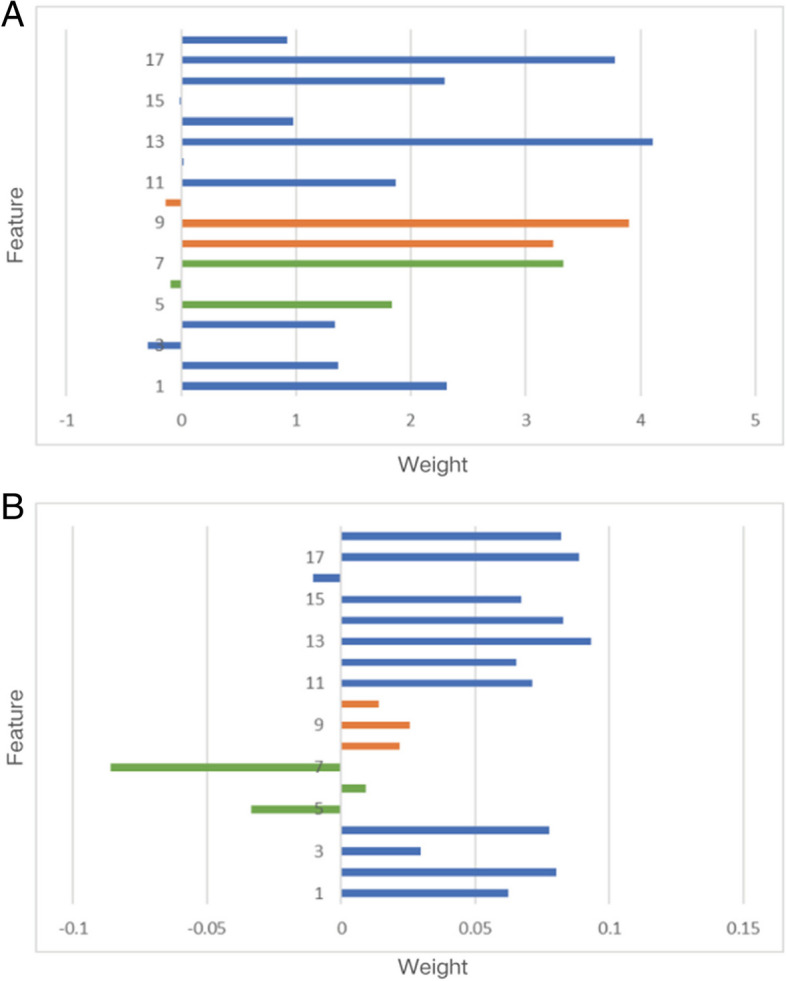
Attentions from general attention mechanism and proposed model (A: General attention mechanism; B: Proposed model)
In contrast, Fig. 8B demonstrates the effectiveness of our proposed approach. It accurately identifies features that are positively or negatively associated with nocturnal hypoglycemia and adjusts attention weights based on sample variations. This nuanced understanding enables our model to discern subtle patterns that might be overlooked in traditional analyses. By capturing these intricate associations, our method enhances the reliability of hypoglycemia predictions, providing valuable insights into nocturnal hypoglycemia dynamics.
Feature description: 1 is a predicted value, 2–4 are deep features, 5–7 are dietary features, 8–10 are insulin features, 11–17 are clinical features, and 18 is the label.
While our study has achieved some success, there are still limitations that need to be acknowledged. Firstly, our dataset is relatively limited, and future research should consider incorporating a larger number of samples to enhance the scalability and generalizability of the model. Secondly, given that hypoglycemic events in diabetic patients are influenced by multiple factors, there is room for further improvement in our model. Future research may explore the inclusion of additional relevant inputs to more comprehensively capture the diverse factors in patients' lives. This approach is expected to contribute to an improved accuracy in predicting nocturnal hypoglycemia and enhance the robustness of the warning model in clinical practice.
Conclusion
This paper proposes a deep learning framework based on dynamic attention feature fusion for nocturnal hypoglycemia prediction. The framework consists of two parts: feature extraction and dynamic attention module. Feature extraction includes traditional features, asynchronous variable features, multi-scale predictive features, and deep spatial–temporal features, which effectively avoid redundancy and incompleteness of input information. Dynamic attention is guided by prior knowledge to generate attention weights that do not deviate from reality and enhance the interpretability of the framework. The evaluation results on the OhioT1DM dataset show that the framework proposed in this paper is clinically acceptable compared to other early warning models, and ablation experiments also verify the validity of the network. Besides, the framework has application value in other multivariate time series early warning tasks. In conclusion, the experimental results show that the proposed framework is feasible and accurate for nocturnal hypoglycemia prediction in real scenarios.
Acknowledgements
Not applicable.
Abbreviations
- ARIMA
Auto regressive integrated moving average
- BG
Blood glucose
- BN
Batch normalization
- CGM
Continuous glucose monitoring
- COB
Carbohydrates (CHO) on board
- CNN
Convolutional Neural Network
- DIA
Duration of insulin action
- EEG
Electroencephalogram
- FCN
Fully Convolutional Networks
- IOB
Insulin on board
- KL
Kullback-Leibler
- LSTM
Long Short-Term Memory
- MTCN
Multiple Temporal Convolution Network
- RARPLS
Recursive Autoregressive Partial Least Squares
- RNN
Recurrent Neural Networks
- RF
Random Forest
- SVM
Support Vector Machine
- T1D
Type 1 diabetes
- T2D
Type 2 diabetes
- TCNs
Temporal convolutional networks
Authors’ contributions
X.Y. designed the study and XZ.W. was responsible for the analysis of the algorithm. Z.Y. performed the simulation experiment. XY.S. was a major contributor in writing the manuscript. RT.S., HR.L. and MC.Z. offered suggestions about this study. All authors read and approved the final manuscript.
Funding
This work is supported by Ningbo Public Service Technology Foundation [2022S046], Young Scientists Fund of the National Natural Science Foundation of China [62403114] and Liaoning Provincial Natural Science Foundation of China (2023-BSBA-128).
Data availability
The OhioT1DM Dataset and Viewer are initially available to participants in the Blood Glucose Level Prediction (BGLP) Challenge of the Third International Workshop on Knowledge Discovery in Healthcare Data at IJCAIECAI 2018, in Stockholm, Sweden. After the BGLP Challenge, these resources become publicly available to other researchers. To protect the data and ensure that it is used only for research purposes, a Data Use Agreement (DUA) is required. A DUA is a binding document signed by legal signatories of Ohio University and the researcher’s home institution. As of this writing, researchers can request a DUA at https://sites.google.com/view/kdhd2018/bglp-challenge. Once a DUA is executed, the Dataset and Viewer will be directly released to the researcher.
Declarations
Ethics approval and consent to participate
This research was conducted with due consideration of ethical principles and informed consent.
Consent for publication
Not applicable.
Competing interests
The authors declare no competing interests.
Footnotes
Publisher’s Note
Springer Nature remains neutral with regard to jurisdictional claims in published maps and institutional affiliations.
References
- 1.D AA. 6. Glycemic targets: standards of medical care in diabetes—2021. Diabetes Care. 2021;44(Supplement 1):S73–S84. [DOI] [PubMed]
- 2.De Falco I, Cioppa AD, Giugliano A, Marcelli A, Koutny T, Krcma M, et al. A genetic programming-based regression for extrapolating a blood glucose-dynamics model from interstitial glucose measurements and their first derivatives. Appl Soft Comput. 2019;77:316–28. [Google Scholar]
- 3.Livingstone K, Fisher M. Diabetes Control and Complications Trial/Epidemiology of Diabetes Interventions and Complications (DCCT/EDIC). Pract Diab Int. 2007;24:102–6. [Google Scholar]
- 4.Holman RR, Paul SK, Bethel MA, Matthews DR, Neil HAW. 10-year follow-up of intensive glucose control in type 2 diabetes. N Engl J Med. 2008;359(15):1577. [DOI] [PubMed] [Google Scholar]
- 5.Richard S, Alejandro SM, Rene RG, Abdulrahman K, Mccoy RG. Hypoglycemia among patients with type 2 diabetes: epidemiology, risk factors, and prevention strategies. Curr DiabRep. 2018;18(8):53. [DOI] [PMC free article] [PubMed] [Google Scholar]
- 6.Tkachenko P, Kriukova G, Aleksandrova M, Chertov O, Renard E, Pereverzyev SV. Prediction of nocturnal hypoglycemia by an aggregation of previously known prediction approaches: proof of concept for clinical application. Comput Methods Programs Biomed. 2016;134:179–86. [DOI] [PubMed] [Google Scholar]
- 7.Wang S, Tan Z, Wu T, Shen Q, Huang P, Wang L, et al. Largest amplitude of glycemic excursion calculating from self-monitoring blood glucose predicted the episodes of nocturnal asymptomatic hypoglycemia detecting by continuous glucose monitoring in outpatients with type 2 diabetes. Front Endocrinol. 2022;13:858912. [DOI] [PMC free article] [PubMed] [Google Scholar]
- 8.Mujahid O, Contreras I, Vehi J. Machine learning techniques for hypoglycemia prediction: trends and challenges. Sensors. 2021;21(2):546. [DOI] [PMC free article] [PubMed] [Google Scholar]
- 9.Woldaregay A, Årsand E, Botsis T, Albers D, Mamykina L, Hartvigsen G. Data-Driven Blood Glucose Pattern Classification and Anomalies Detection: Machine-Learning Applications in Type 1 Diabetes. J Med Internet Res 2019;21(5):e11030. [DOI] [PMC free article] [PubMed]
- 10.Woldaregay AZ, Arsand E, Walderhaug S, Albers D, Mamykina L, Botsis T, et al. Data-driven modeling and prediction of blood glucose dynamics: machine learning applications in type 1 diabetes. Artif Intell Med. 2019;98(Jul.):109–34. [DOI] [PubMed] [Google Scholar]
- 11.Felizardo V, Garcia N, Pombo N, Megdiche I. Data-based algorithms and models using diabetics real data for blood glucose and hypoglycaemia prediction - a systematic literature review. Artif Intell Med. 2021;118:102120. [DOI] [PubMed] [Google Scholar]
- 12.Bayrak ES, Turksoy K, Cinar A, Quinn L, Littlejohn E, Rollins D. Hypoglycemia early alarm systems based on recursive autoregressive partial least squares models. J Diabetes Sci Technol. 2013;7(1):206–14. [DOI] [PMC free article] [PubMed]
- 13.Zhu T, Li K, Herrero P, Chen J, Georgiou P, editors. A Deep Learning Algorithm for Personalized Blood Glucose Prediction. Int Joint Conf Artif Intell. 2018;2148:64–8.
- 14.Yang J, Li L, Shi Y, Xie X. An ARIMA model with adaptive orders for predicting blood glucose concentrations and hypoglycemia. IEEE J Biomed Health Informatics. 2019;23(3):1251–60. [DOI] [PubMed] [Google Scholar]
- 15.Snogdal LS, Folkestad L, Elsborg R, Remvig LS, Beck-Nielsen H, Thorsteinsson B, et al. Detection of hypoglycemia associated EEG changes during sleep in type 1 diabetes mellitus. Diabetes Res Clin Pract. 2012;98(1):91–7. [DOI] [PubMed] [Google Scholar]
- 16.Skladnev VN, Tarnavskii S, McGregor T, Ghevondian N, Gourlay S, Jones TW. Hypoglycemia alarm enhancement using data fusion. J Diabetes Sci Technol. 2010;4(1):34–40. [DOI] [PMC free article] [PubMed]
- 17.Ge L, Ge LJ. Feature extraction of time series classification based on multi-method integration. Optik. 2016;127(23):11070–4. [Google Scholar]
- 18.Wilinska ME, Chassin LJ, Schaller HC, Schaupp L, Pieber TR, Hovorka R. Insulin kinetics in type-1 diabetes: continuous and bolus delivery of rapid acting insulin. IEEE Trans Biomed Eng. 2005;52(1):3–12. [DOI] [PubMed] [Google Scholar]
- 19.Bertachi A, Biagi L, Contreras I, Luo N, Vehí J, editors. Prediction of Blood Glucose Levels And Nocturnal Hypoglycemia Using Physiological Models and Artificial Neural Networks. Int Joint Conf Artif Intell. 2018;2148:85–90.
- 20.Heaton J. Ian Goodfellow, Yoshua Bengio, and Aaron Courville: Deep learning. Genet Program Evolvable Mach. 2017;19:305–7. [Google Scholar]
- 21.Lea, Colin & Vidal, René & Reiter, Austin & Hager, Gregory. Temporal Convolutional Networks: A Unified Approach to Action Segmentation. 2016;10.1007:978-3-319-49409-8_7.
- 22.Milletari F, Navab N, Ahmadi SA. V-Net: Fully convolutional neural networks for volumetric medical image segmentation. In Proceedings - 2016 4th International Conference on 3D Vision, 3DV 2016. Institute of Electrical and Electronics Engineers Inc. 2016;20:565–71.
- 23.Nie, D., Wang, L., Gao, Y., & Shen, D. Fully convolutional networks for multi-modality isointense infant brain image segmentation. 2016 IEEE 13th International Symposium on Biomedical Imaging (ISBI). 2016;2016:1342–5. [DOI] [PMC free article] [PubMed]
- 24.Jonathan L, Evan S, Trevor D. Fully Convolutional Networks for Semantic Segmentation. IEEE Transactions on Pattern Analysis & Machine Intelligence. 2017;39(4):640–51. [DOI] [PubMed]
- 25.Memory LST. Long short-term memory. Neural Comput. 2010;9(8):1735–80. [DOI] [PubMed] [Google Scholar]
- 26.Schmidhuber J. Deep learning in neural networks: an overview. Neural Netw. 2015;61:85–117. [DOI] [PubMed] [Google Scholar]
- 27.Ashish Vaswani, Noam Shazeer, Niki Parmar, Jakob Uszkoreit, Llion Jones, Aidan N. Gomez, Łukasz Kaiser, and Illia Polosukhin. Attention is all you need. In Proceedings of the 31st International Conference on Neural Information Processing Systems (NIPS'17). Curran Associates Inc. 2017;6000–10.
- 28.Marling C, Bunescu R. The OhioT1DM Dataset for Blood Glucose Level Prediction: Update 2020. CEUR Workshop Proc. 2020;2675:71–4. [PMC free article] [PubMed]
- 29.Luo J, Ying K, Bai J. Savitzky-Golay smoothing and differentiation filter for even number data. Signal Process. 2005;85(7):1429–34. [Google Scholar]
- 30.Huang T-H, Leu Y, Pan W-T. Constructing ZSCORE-based financial crisis warning models using fruit fly optimization algorithm and general regression neural network. Kybernetes. 2016;45(4):650–65. [Google Scholar]
- 31.Powers DA. Evaluation: From precision, recall and F-measure to ROC, informedness, markedness & correlation. J Mach Learn Technol. 2011;2:2229–3981. 10.9735/2229-3981.
- 32.Sokolova M, Lapalme G. A systematic analysis of performance measures for classification tasks. Inf Process Manag. 2009;45:427–37. [Google Scholar]
- 33.Iacono F, Magni L, Toffanin CJBSP, Control. Personalized LSTM-based alarm systems for hypoglycemia and hyperglycemia prevention. 2023;86(Part A):1016–21.
- 34.Zhu T, Wang W, Yu MJC, Solitons, Fractals. A novel blood glucose time series prediction framework based on a novel signal decomposition method. 2022;164(9):112673–87.
- 35.Felizardo V, Garcia NM, Megdiche I, Pombo N, Sousa M, Babič FJEAoAI. Hypoglycaemia prediction using information fusion and classifiers consensus. 2023;123(Part A):106194–206.
- 36.Li L, Xie X, Yang J. A predictive model incorporating the change detection and Winsorization methods for alerting hypoglycemia and hyperglycemia. Med Biol Eng Comput. 2021;59(11-12):2311–24. [DOI] [PubMed]
Associated Data
This section collects any data citations, data availability statements, or supplementary materials included in this article.
Data Availability Statement
The OhioT1DM Dataset and Viewer are initially available to participants in the Blood Glucose Level Prediction (BGLP) Challenge of the Third International Workshop on Knowledge Discovery in Healthcare Data at IJCAIECAI 2018, in Stockholm, Sweden. After the BGLP Challenge, these resources become publicly available to other researchers. To protect the data and ensure that it is used only for research purposes, a Data Use Agreement (DUA) is required. A DUA is a binding document signed by legal signatories of Ohio University and the researcher’s home institution. As of this writing, researchers can request a DUA at https://sites.google.com/view/kdhd2018/bglp-challenge. Once a DUA is executed, the Dataset and Viewer will be directly released to the researcher.


