ABSTRACT
Background
Effective nutritional support is essential for maintaining good performance during exercise. Taste and olfaction are key senses for food intake, and understanding how their sensitivities change during exercise is important for effective nutritional support. However, the effects of exercise on taste and odor sensitivities remain unclear. This study aimed to investigate changes in taste and odor sensitivities during repeated endurance exercise using a bicycle ergometer.
Methods
A total of 20 women (mean age; 21.6 ± 0.2 years) participated in the study, completing four 60-minute segments, each comprising 50 minutes of bicycle ergometer exercise at an exercise intensity of 60% heart rate reserve and a 10-minute sensory test. The sensory tests were conducted five times in total: after each exercise segment and once before exercise as a control. Four concentrations (×0.5, ×0.75, ×1, and × 1.25) of a commercially available isotonic beverage were used as taste samples, and the subjects evaluated the taste intensity, preference, and odor intensity. Four types of food odorants were used as odor samples, and the subjects rated their preference. The subjects also reported their perceived fatigue levels during the taste and odor tests. Fatigue levels and taste intensity were rated using a 100-mm visual analogue scale, and taste and odor preferences and odor intensity were evaluated using a scoring method.
Results
The degree of physical fatigue significantly increased with each successive bicycle exercise segment. The taste intensity and preference for beverages with higher concentrations increased as the number of exercise segments increased, showing a significant increase in taste intensity for the × 1.25 solution in the final segment compared with before the tests. On the other hand, no significant effect was observed on the perceived odor intensity of the isotonic beverages. Similarly, there was no significant effect on the preference for odor samples due to repeated exercise.
Conclusions
These results suggest that taste sensitivity may change with prolonged exercise. Additionally, since odor intensity and preference were not significantly affected by repeated exercise, odor sensitivity may be less impacted by exercise than taste sensitivity.
KEYWORDS: Endurance exercise, taste sensitivity, odor sensitivity, bicycle ergometer
1. Introduction
When exercising for long periods of time, efficient nutritional support is important to maintain good performance or rapid fatigue recovery [1–3]. For example, carbohydrates are the body’s main source of energy during exercise [1]. Proteins are essential for muscle repair and growth, and ingesting proteins after exercise can promote muscle recovery [2]. Since electrolytes, such as sodium, potassium, and magnesium, are lost during exercise, proper hydration and intake of isotonic beverages are effective [3].
Taste and olfactory sensations are crucial for effective nutritional intake [4]. Taste, the sense that perceives the flavor of food and beverages, is divided into five basic dimensions – sweet, salty, sour, bitter, and umami. Each serves as a signal indicating the presence of specific nutrients or substances in food; sweetness signals carbohydrates, saltiness indicates electrolytes, umami suggests protein, and sourness and bitterness often signal immature or spoiled food and the presence of toxins, respectively. Olfaction is vital for sensing the flavors and aromas of food and plays a role in stimulating appetite. The olfactory sense helps assess the freshness and safety of food; for instance, it can detect food spoilage or changes in quality.
The senses of taste and olfaction are closely related and work together to provide a sense of the overall perception of taste and flavor in food. Since sweet and salty tastes detect carbohydrates and electrolytes, respectively, these may be particularly important in considering energy replenishment. Additionally, pleasant smells can increase appetite and assist in replenishing energy after exercise. By effectively using taste and smell stimuli, we may maximize energy efficiency and concentration during exercise.
There is a close relationship between physical exercise and sensory functions. For example, physical exercise has been reported to be effective in reducing pain and discomfort [5]. Exercise also affects the plasticity of the brain. Exercise changes neural circuits and can improve brain functions related to learning, memory, and sensory processing [6]. Although physical exercise can impact taste and olfactory sensations, the precise mechanisms by which exercise affects these sensory systems are still poorly understood. Exercise induces not only physiological changes, such as increased body temperature and shifts in pH balance, but also alterations in hormone levels, including insulin [7], leptin [8], and catecholamines [9]. Sensory systems are thought to be affected by such changes, and indeed, hormone levels are known to influence taste sensitivity [10]. This study aimed to investigate the effects of endurance exercise on taste and olfactory sensations. The subjects completed four 60-minute segments; 50 minutes of bicycle ergometer exercise at an exercise intensity of 60% heart rate reserve (HRR) and a 10-minute sensory test. The heart rate was monitored using an ear sensor attached to the ergometer during exercise. Sensory tests were conducted five times in total: after each exercise segment and once before exercise as a control. Commercial isotonic beverages at various concentrations (×1 [standard concentration], ×0.5, ×0.75, and × 1.25) and odorants (2-ethyl-3,5(6)-dimethylpyrazine, isovaleraldehyde, phenylacetaldehyde, and vanillin) that are present in food products were utilized as test samples. The subjects were tasked with assessing the taste and olfactory characteristics of the samples, including intensity and preference.
2. Methods
2.1. Subjects
A total of 20 women (mean age: 21.6 ± 0.2 years) who attended Kyoto Women’s University were recruited for the study. All participants were nonsmokers and had good physical health. Before the test, the subjects were informed of all experimental procedures, possible risks, and their voluntary withdrawal from the tests at any time. The study was approved by the Kyoto Women’s University Ethics Committee (Approval Number: 2021–27) in accordance with ethical standards for the conduct of human participant research as described in the Declaration of Helsinki.
2.2. Samples
The test samples used in this study were a commercial isotonic beverage for the taste sample and cocoa-containing flavorings for the odor sample. The isotonic beverage was selected because it is commonly consumed during exercise to replenish fluids and electrolytes, making it relevant for studies on endurance exercise. The cocoa-containing flavorings were selected due to their widespread use in protein drinks.
Pocari Sweat powder (Otsuka Pharmaceutical, Tokushima, Japan) was used as the taste sample. The nutritional facts per 74 g/L of powder are as follows: energy, 288 kcal; protein, 0 g; fat, 0 g; carbohydrates, 73 g; sodium chloride equivalent, 1.32 g; potassium, 214 mg; calcium, 22 mg; and magnesium, 6 mg. Pocari Sweat beverage has a citrus-like flavor and contains flavoring additives. The beverage powder was dissolved in distilled water at different concentrations: ×0.5 (37 g/L), ×0.75 (55.5 g/L), ×1 (normal concentration; 74 g/L), and × 1.25 (92.5 g/L).
1% 2-ethyl-3,5(6)-dimethylpyrazine (isomers mixture), 1% isovaleraldehyde, 1% phenylacetaldehyde, and 10% vanillin (T. HASEGAWA, Kanagawa, Japan), which are the key odor components contributing to the aroma of cocoa, were used as odor samples. All odor samples were dissolved in triacetin.
2.3. Experiment schedule
The experimental schedule is shown in Figure 1. The subjects underwent sensory evaluation after exercise for 50 minutes. The sensory evaluation, including rest periods, lasted approximately 10 minutes. Each segment consisted of four repetitions of both exercise and sensory evaluation. In total, sensory evaluation was conducted five times: before the experiment began and after the fourth exercise segment. Exhaled gas analysis was conducted before exercise and during the final 10 minutes of each exercise segment. The sensory evaluations included assessments of physical fatigue level, taste intensity, taste preference, and odor intensity for the taste samples. Additionally, odor preference and odor-induced color images were obtained for the odor samples, with the latter performed only twice, before the experiment and after the fourth exercise segment. We instructed the subjects not to ingest anything except water for 1 hour before the start of the experiment. All experiments started at 9 am, ended at approximately 1 pm, and were conducted indoors. To minimize bias, detailed information about the test samples (product name, concentration, and odorant name) were not provided to the subjects before the experiment but was shared with them afterward. The subjects consumed no food or beverage, excluding water, during the experiment. To consider the subjects’ physical condition, we informed them that they could stop the measurement at any time depending on their physical condition and if the individual measuring them noticed anything abnormal, the measurement would be stopped immediately, although the subject wished to continue. To enhance comfort during the long exercise sessions, subjects were allowed to watch videos or listen to their favorite music while using the bicycle ergometer.
Figure 1.

Experimental schedule. The subjects completed four 60-minute segments, each comprising 50 minutes of bicycle ergometer exercise and a 10-minute sensory test. Sensory tests for isotonic beverages and odorants were conducted five times in total: after each exercise segment and once before exercise as a control. The respiratory quotient (RQ) was measured before the exercise and during the last 10 minutes of each exercise segment. Odor-induced color association analysis was conducted at two time points: before exercise and after the 4th exercise segment.
2.4. Endurance exercise
A bicycle ergometer (Aerobike 75XLII ME, Combi, Tokyo, Japan) was used for exercise. The exercise intensity was set at 60% of the HRR. The 60% HRR was calculated by the Karvonen formula [11]. Heart rate was monitored using an ear sensor attached to the ergometer. The subjects were instructed to pedal at 50 to 60 rpm, with the pedal load automatically adjusted to maintain the target heart rate. Energy expenditure was measured using an ergometer. Exhaled gas analysis was performed using face mask measurements with a portable gas monitor AR-1 (Arco system, Chiba, Japan). The respiratory quotient (RQ) is determined by dividing the rate of CO2 produced (VCO2) by the rate of O2 consumed (VO2). Body weight was recorded before the experiment began and after the 4th exercise segment.
2.5. Sensory evaluation
2.5.1. Evaluation of physical fatigue
At each segment, the subjects were asked to assess their degree of physical fatigue using a 100-mm Visual Analog Scale (VAS). The right and left ends of the scale represented “strong” and “weak” fatigue, respectively.
2.5.2. Taste samples and their evaluation
The subjects were presented with four cups containing isotonic beverages of different concentrations (×1 [standard concentration], ×0.5, ×0.75, and × 1.25) and asked to evaluate their taste intensity, taste preference, and odor intensity. After tasting each solution, the participants spat out the sample and rated the taste intensity on a 100-mm VAS. The right and left ends of the scale represent “strong” and “weak” tastes, respectively. Taste preference was assessed using a scoring method in which taste solutions were graded on a scale of −3 to + 3: −3, strongly unpleasant; −2, unpleasant; −1, slightly unpleasant; 0, neither pleasant nor unpleasant; +1, slightly pleasant; +2, pleasant; and + 3, strongly pleasant. The subjects also selected their most preferred solution from the four solutions. The odor intensity when the solution was in the mouth was assessed on a scale of 0 to + 3: 0, no odor; +1, slightly aromatic; +2, aromatic; and + 3, strongly aromatic.
Taste samples were presented to the participants in ascending order. After tasting each solution, participants thoroughly rinsed their mouths with distilled water. All solutions (30 mL) were stored in plastic cups at room temperature, with distilled water purified using an Autostill WG510 (Yamato Scientific, Tokyo, Japan) used as a stimulus and mouth rinse.
2.5.3. Odor samples and their evaluation
The odorants were presented to the subjects in vials. The end of a paper strip was impregnated with an odorant, and the subjects were asked to evaluate their odor preference and odor-induced color image toward the odorant when smelling it. Similar to the taste preference assessment for taste samples, odor preference was evaluated using a scoring method, with odorants rated on a scale of −3 to + 3.
2.6. Color image analysis using Aroma Rainbow® [12,13]
To evaluate the quality of odors from aspects beyond intensity and preference, we conducted a color image analysis using the Aroma RainbowⓇ method [12,13]. The Aroma RainbowⓇ method expresses aromas, emotions, and other perceptions using colors. The subjects evaluate odors by selecting the color that best represented their sensory experience if smelling odorants. The color chart listing a total of 38 colors was presented to the subjects. The colors listed on the color chart are as follows: 30 colors (6 hues: red 2 R, orange 6yO, yellow 8Y, green 12 G, blue 18B, purple 20 V; 5 tones: pale, light, vivid, deep, dark), 6 achromatic colors (W, 7.5 Gy, 6.0 Gy, 4.5 Gy, 3.0 Gy, Bk), and gold and silver papers. The colors were set based on the Practical Color Co-ordinate System (PCCS: developed by Japan Color Research Institute), except for gold and silver papers. The subjects were asked to select two colors from the color chart that matched the image they perceived from the odorant. At this time, the subjects were also asked to evaluate the contribution rate of the selected colors. We instructed the subjects to ensure that the sum of their contribution rates was 100%. The colors imaged from each odorant and their contribution rates were counted, and the contribution to each color image was determined according to the contribution rate (Equation 1). The color of the panel was adjusted according to this contribution (Equation 2). An octagon was created with six sides for six chromatic colors, one side for achromatic colors, and one side for gold and silver, and the color panels were arranged radially. The position of the panel reflects the brightness, indicating that the inside of the octagon is less bright and the outside is brighter.
Equation 1) Calculation of the contribution of each color:
Equation 2) Rule for the number of color panels:
k = 0%: 0 panel, 0% < k < 5%: 1 panel, 5% ≤ k < 10%: 2 panels (1 additional panel for every 5%).
2.7. Statistical analysis
A priori power analysis was conducted using G*Power version 3.1.9.7 [14] to determine the sample size required to test the hypothesis. The results indicated the required sample sizes to achieve 80% power for detecting high (f = 0.4), medium (f = 0.25), and low effects (f = 0.1), at a significance criterion of α = 0.05, were n = 9, 21, and 121, respectively, for repeated measure one-way ANOVA. Previous research on the relationship between exercise and taste has reported that the effects of exercise can be detected with fewer than 20 subjects [15,16]. Therefore, we determined that a sample size of 20 was sufficient to achieve our study objectives.
The data are expressed as the mean ± standard error of the mean. Statistical analysis was performed using Dunn’s post hoc test following the Friedman test with GraphPad Prism 6 software (GraphPad Software, San Diego, CA, USA). The statistical analyses were performed on the degree of physical fatigue (Figure 2a), RQ (Figure 2b), energy expenditure (Figure 2c), taste intensity (Figure 3), taste preference (Figure 4), odor intensity (Figure 6), and odor preference (Figure 7). In the Dunn’s post-hoc test, data were compared before the experiment and at each evaluation point. In energy expenditure, the 1st exercise segment was used as the baseline. p < 0.05 was considered to indicate statistical significance. The p values are summarized in Supplementary Table 1.
Figure 2.
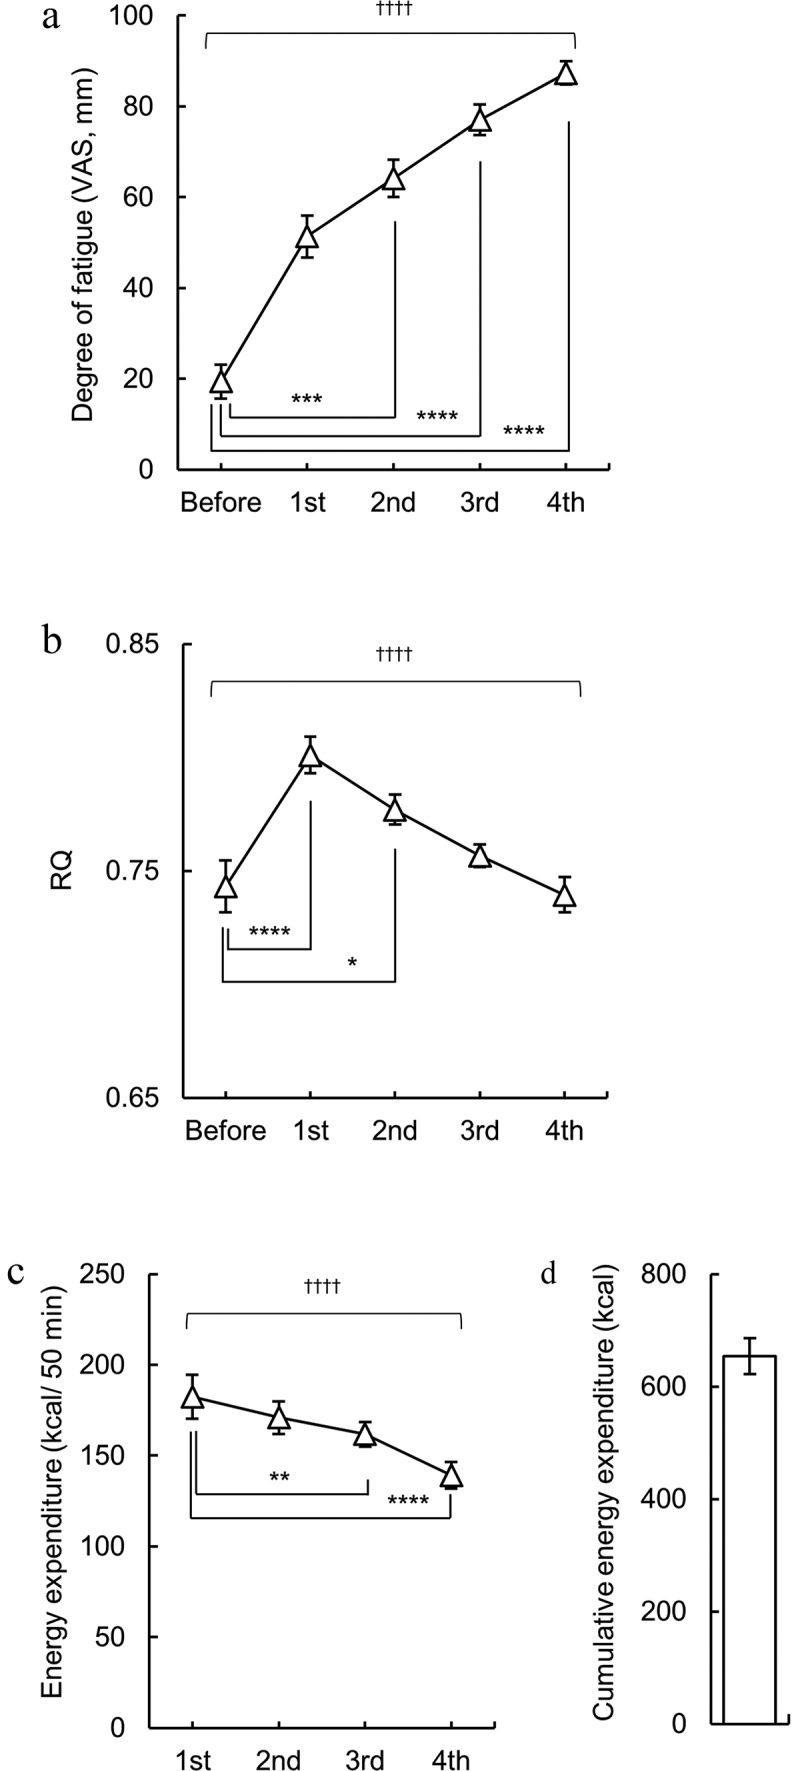
Changes in physiological indicators due to endurance exercise. Changes in (a) the degree of physical fatigue, (b) the respiratory quotient (RQ), and (c) the energy expenditure induced by exercise. (d) Cumulative energy expenditure. *, **, *** and **** indicate p < 0.05, 0.01, 0.001 and 0.0001, respectively (Dunn’s post hoc test after the Friedman test). † indicates p < 0.05 (Friedman test). n = 20.
Figure 3.
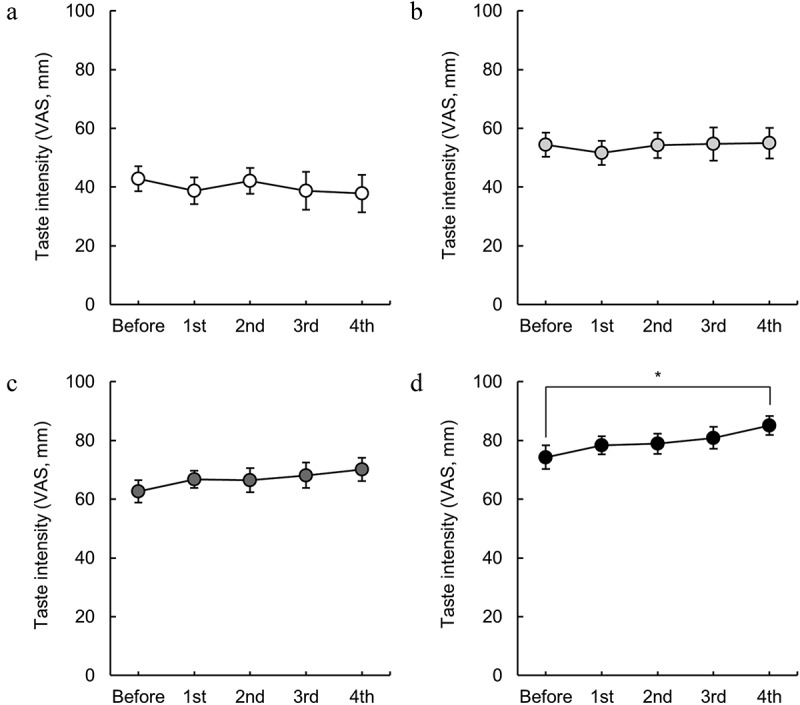
Changes in the taste intensity of isotonic beverages induced by endurance exercise. The taste intensities for (a) ×0.5, (b) ×0.75, (c) ×1, and (d) ×1.25 solutions. * indicates p < 0.05 (Dunn’s post hoc test after the Friedman test). n = 17.
Figure 4.
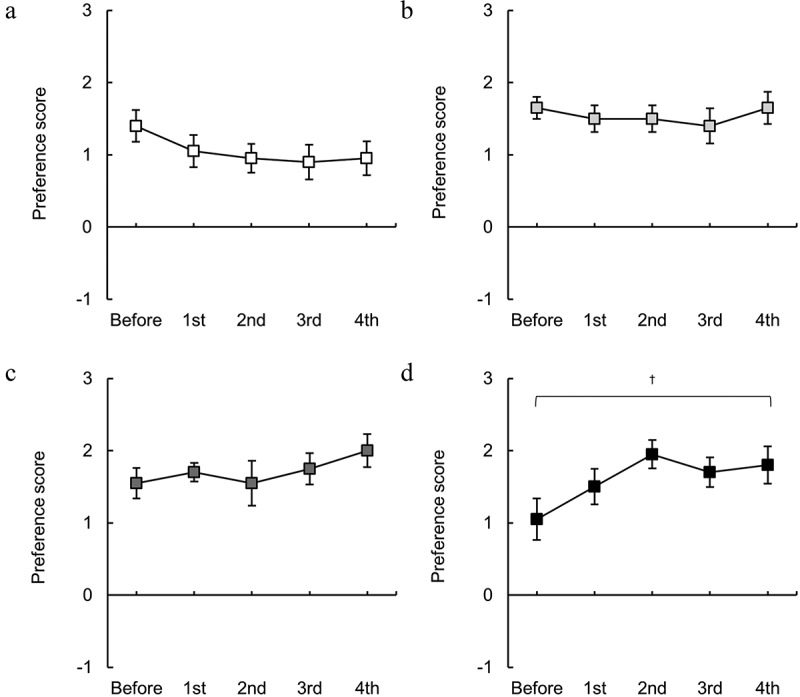
Changes in the taste preference of isotonic beverages induced by exercise. The preference scores for (a) ×0.5, (b) ×0.75, (c) ×1, and (d) ×1.25 solutions. † indicates p < 0.05 (Friedman test). n = 20.
Figure 6.
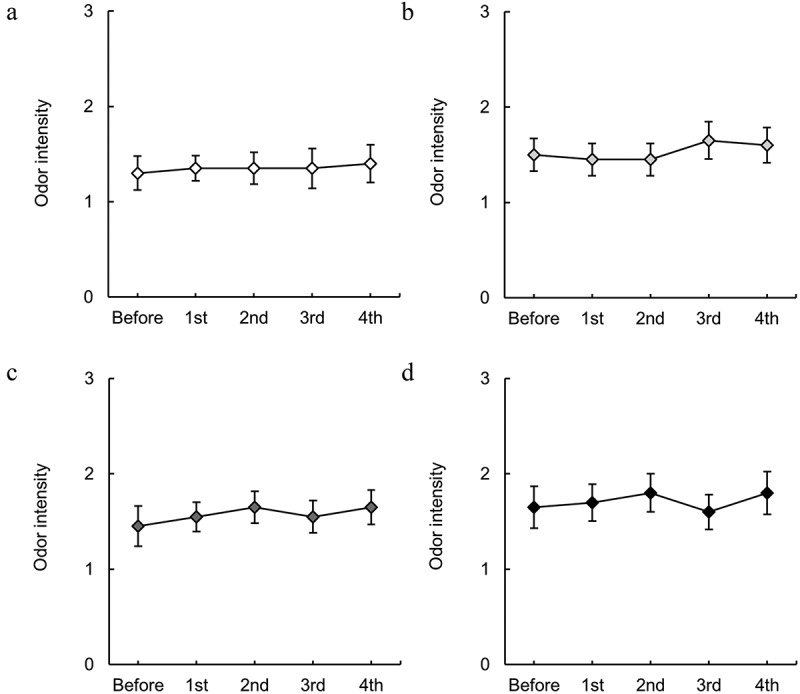
Changes in the odor intensity of isotonic beverages induced by endurance exercise. The odor scores for (a) ×0.5, (b) ×0.75, (c) ×1, and (d) ×1.25 solutions. n = 20.
Figure 7.
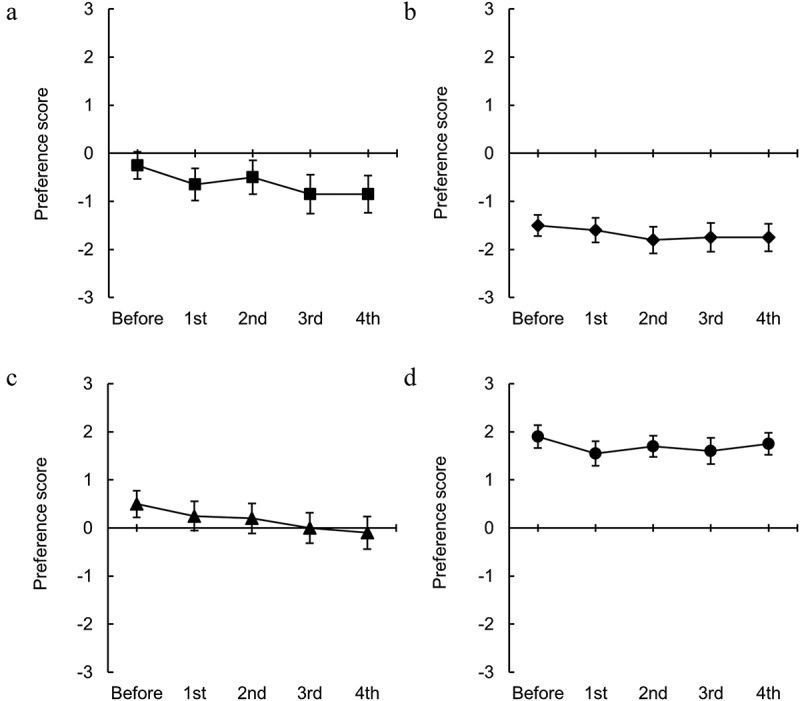
Changes in the odor preferences of odorants induced by endurance exercise. The preference scores for (a) 2-ethyl-3,5(6)-dimethylpyrazine, (b) isovaleraldehyde, (c) phenylacetaldehyde, and (d) vanillin. n = 20.
3. Results
3.1. Changes in physiological indicators due to endurance exercise
Changes in the physical fatigue level, RQ, and energy expenditure are shown in Figure 2. The physical fatigue levels were measured using the VAS (Figure 2a). The degree of physical fatigue increased with each successive bicycle exercise segment. At the 2nd or subsequent measurement segments, the physical fatigue levels were significantly higher than before exercise (p < 0.001 for Before vs. 2nd, p < 0.0001 for Before vs. 3rd and 4th with Dunn’s multiple comparisons test; Figure 2a). Compared to pre-exercise levels, RQ significantly increased during the initial exercise segment, followed by a gradual decrease (p < 0.0001 for Before vs. 1st, p < 0.05 for Before vs. 2nd with Dunn’s multiple comparisons test; Figure 2b). Energy expenditure, as depicted in Figure 2c, peaked during the 1st exercise segment and subsequently declined with repeated segments (p < 0.01 for 1st vs. 3rd, p < 0.0001 for 1st vs. 4th with Dunn’s multiple comparisons test; Figure 2c). The cumulative energy expenditure was 654 ± 32 kcal (Figure 2d).
3.2. Effects of endurance exercise at different concentrations on the taste intensity, taste preference, and odor intensity of isotonic beverages
Figure 3 shows the changes in the perceived taste intensity of the isotonic beverage at various concentrations. The taste intensities perceived from solutions of × 0.5, ×0.75, and × 1 did not change significantly with repeated exercise and remained relatively stable (Figure 3a-c). Conversely, for the × 1.25 solution, perceived taste intensity increased with repeated exercise, and after the 4th exercise segment, it exhibited a significantly greater value than the pre-exercise level (p < 0.05, Dunn’s multiple comparison test; Figure 3d).
Figure 4 shows the changes in taste preference for isotonic beverages at four different concentrations. There were no significant alterations in taste preference for the × 0.5, ×0.75, and × 1 solutions due to repeated exercise (Figure 4a-c). On the other hand, for the × 1.25 solution, repeated exercise caused large changes in taste preference, with exercise increasing taste preference (p < 0.05, Friedman test; Figure 4d).
Figure 5 shows the percentage of subjects choosing the most preferred solution for each test segment. Before exercise, ×0.75 was the highest, followed by × 0.5. The percentage of subjects choosing the × 1 or × 1.25 solutions increased with repeated exercise, indicating that repeated exercise influenced taste preference toward isotonic beverages with relatively high concentrations.
Figure 5.
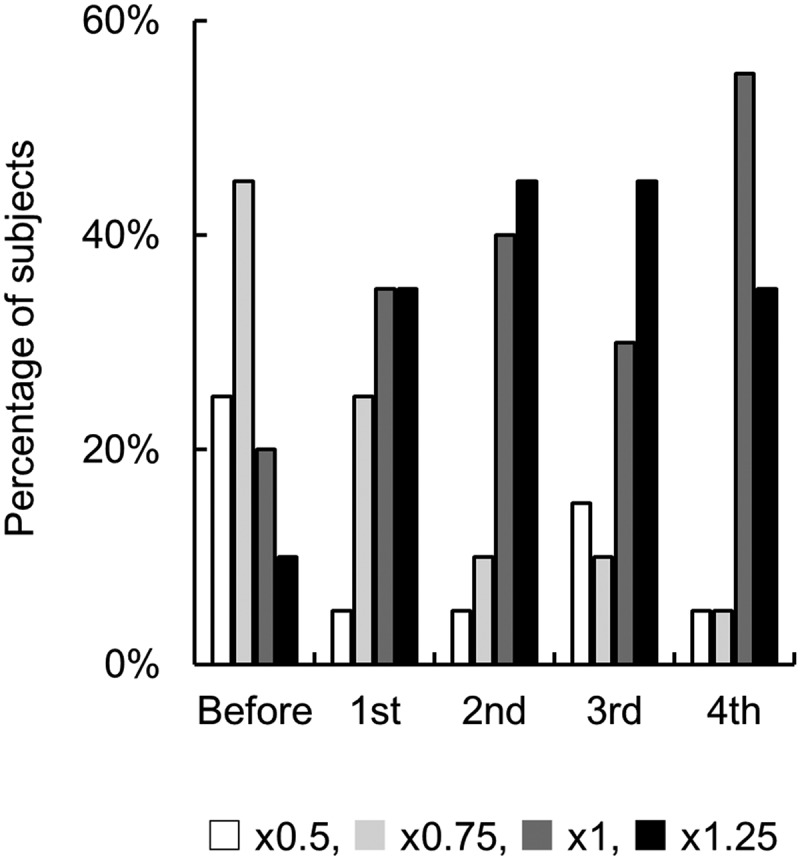
Effect of endurance exercise on the most preferred concentration of isotonic beverages. n = 20.
Figure 6 shows the changes in the perceived odor intensity of isotonic beverages at four different concentrations. The isotonic beverage tested had a citrus-like flavor. No significant effect of repeated exercise was observed on perceived odor intensity at any concentration.
3.3. Effect of endurance exercise on odor preference and odor-induced color image for odorants
Figure 7 shows the changes in odor preference for four types of odorants: 2-ethyl-3,5(6)-dimethylpyrazine, isovaleraldehyde, phenylacetaldehyde, and vanillin. Although there was a tendency for the preference for phenylacetaldehyde to decrease with repeated exercise, no significant effect of repeated exercise on odor preference was observed for any of the tested substances.
To evaluate the quality of odors from aspects beyond intensity and preference, odor-induced color images were evaluated before exercise and after the 4th exercise segment. The characteristics of the color image for each odorant differed depending on the substance (Figure 8). On the other hand, there was no large change in the selected color images before and after endurance exercise.
Figure 8.
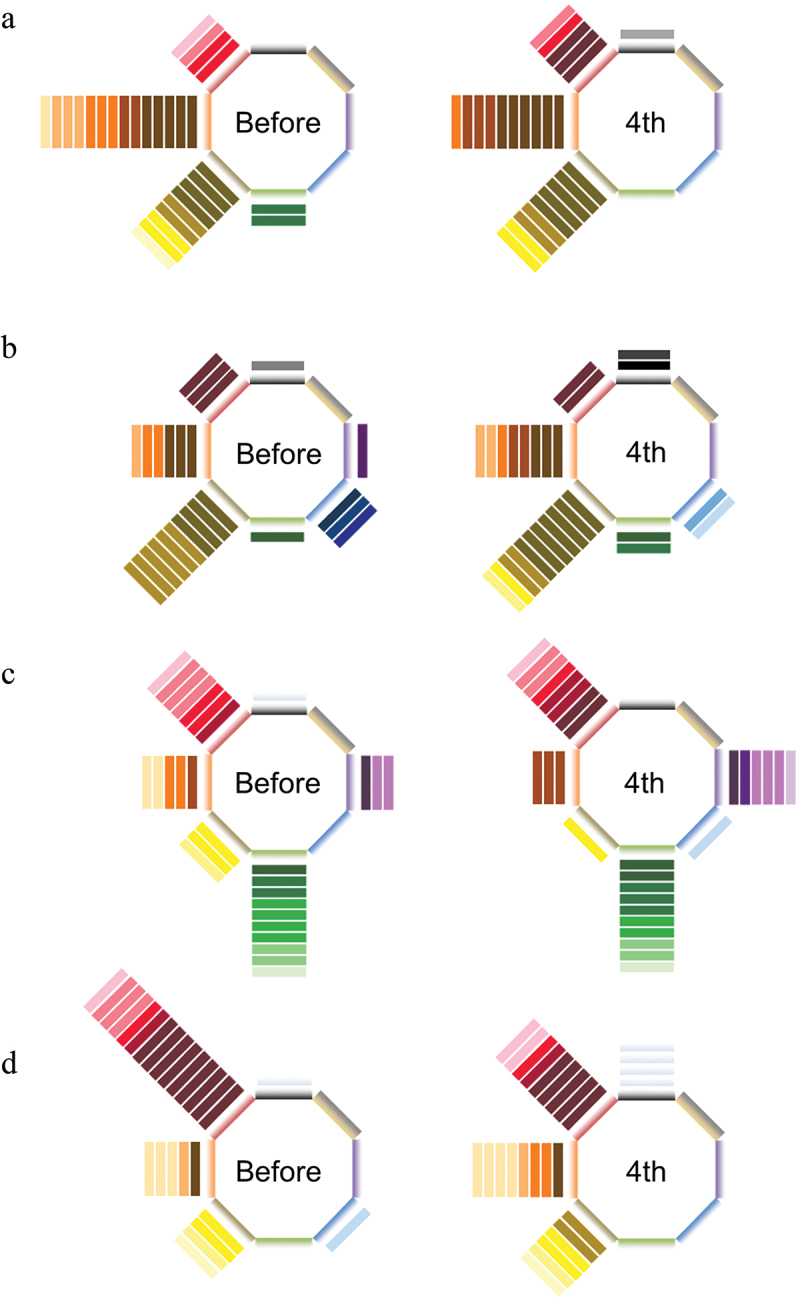
Effect of endurance exercise on odor-induced color images. The color images for (a) 2-ethyl-3,5(6)-dimethylpyrazine, (b) isovaleraldehyde, (c) phenylacetaldehyde, and (d) vanillin. n = 14.
4. Discussion
Prolonged and/or high-intensity exercise induces severe physical fatigue. Therefore, the sensory perception of the same stimulus may be different when individuals are tired than when they are not. Taste and olfactory senses affect food selection, appetite regulation, and nutrient absorption. Taste helps detect the nutrients required by the body, whereas olfaction detects the flavor and aroma of food and stimulates appetite, thereby, helping to efficiently consume the energy and nutrients required after exercise. Therefore, taste and olfaction are important for efficiently replenishing nutrients after training, contributing to improved performance and maintaining physical condition. Knowledge about how taste and olfactory sensations are affected by physical exercise is important for providing appropriate nutritional support.
There are reports about the relationship between acute exercise and taste and olfactory sensations. For example, the threshold for sweet taste was increased by a half-marathon [17], and the preference for sucrose and citric acid increased significantly from pre- to post-exercise [18]. Additionally, a significant effect was observed for perceived pleasantness of the sweet beverages [15], and subjects perceived a more intense sweetness and showed a greater appreciation for the sweet solution post-exercise [16]. Furthermore, the study investigating the association between physical activity and taste suggests that individuals with higher levels of physical activity may have better sensitivities to salty and bitter tastes [19]. However, there was no difference in odor detection between rest and exercise [20]. These results suggest that the effects of acute exercise are more pronounced on taste than on olfaction. However, few studies have observed changes in taste and odor sensitivity over time during exercise. Additionally, no study has simultaneously compared the changes of taste and odor sensitivities during exercise in the same subjects. In this study, the subjects underwent repeated bicycle ergometer exercises to examine the effects of physical exercise on taste and olfactory sensations.
The exercise intensity was set to 60% of the HRR, corresponding to moderate exercise intensity [21]. Repeated exercise significantly increased physical fatigue levels. The energy expenditure for each exercise segment decreased with the number of repetitions. In this study, the workload was adjusted according to heart rate. Therefore, it is presumed that the heart rate increases easily due to the accumulation of physical fatigue, leading to a reduction in workload and consequently a decrease in energy expenditure.
RQ was also monitored. RQ, which typically ranges between 0.7 and 1.0, serves as an indicator of metabolic fuel or substrate utilization in tissues and must be calculated under resting or steady-state exercise conditions. A ratio of 0.7 indicates mixed fat utilization, while a ratio of 1.0 indicates exclusive carbohydrate utilization [22]. During endurance exercise, the RQ initially increases and then gradually decreases [23]. This suggests that, initially, carbohydrates dominate as the energy source, but gradually, fat becomes the predominant source. The change in RQ observed in the present study aligns with that in previous reports, showing an increase during the 1st exercise segment followed by a gradual decrease.
First, we investigated the effects of exercise on taste intensity and preference. We used commercially available isotonic beverages commonly consumed during endurance exercise as taste substances. Previously, we investigated changes in sweet and bitter taste sensitivity due to exercise fatigue using taste solutions [17,24]. Here, we used commercially available beverages to investigate how taste sensitivity to food products changes during exercise. No significant change in taste intensity was observed at concentrations of × 0.5 and × 0.75. However, the perceived taste intensity of highly concentrated isotonic beverages increased with the number of exercise repetitions. Similarly, taste preferences for highly concentrated solutions increased. Among the four concentrations, while many subjects chose × 0.75 or × 0.5 before the exercise segment, as the exercise was repeated, the number of subjects choosing higher concentration solutions increased. These results suggest that the perceived taste intensity from highly concentrated solutions was enhanced by repeating exercise, consequently leading to an increase in taste preference for such solutions; in other words, physical exercise could alter taste sensitivity.
We also investigated the effect of exercise on odor preference and odor-induced color image. Since cocoa odor is widely added to protein drinks, cocoa compounds were used as odor samples in this study. Although > 600 odor compounds have been reported in cocoa and cocoa products [25], we focused on 2-ethyl-3,5(6)-dimethylpyrazine, isovaleraldehyde, phenylacetaldehyde, and vanillin, which are the main odor components contributing to the aroma of cocoa. These odorants show different sensory characteristics; vanillin and isovaleraldehyde are pleasant and unpleasant odors, respectively. 2-ethyl-3,5(6)-dimethylpyrazine and phenylacetaldehyde are odors that were neither pleasant nor unpleasant. The preference for phenylacetaldehyde tended to decrease with repeated exercise, although the change was non-significant. No significant effect of repeated exercise on preferences for other odor components was observed. Considering this alongside the odor intensity of isotonic beverages, it was presumed that olfactory sensation may be less affected by physical exercise compared to taste sensation.
Considering the possibility that endurance exercise might influence not only the intensity or preference of odors but also subtler aspects, such as odor quality, we employed Aroma RainbowⓇ in this study. Aroma RainbowⓇ is a visual tool that associates different emotions with specific colors [12,13]. It has been specifically proposed for applications that represent the quality of odors using colors. Using this method, we aimed to explore whether exercise influences subtle aspects of odor quality beyond just intensity or preference. The colors imagined from 2-ethyl-3,5(6)-dimethylpyrazine, isovaleraldehyde, phenylacetaldehyde, and vanillin aromas were mostly orange, yellow, green, and red, respectively, and the color patterns imagined from each odorant were different. No drastic differences were observed in odor-induced color images before and after exercise, suggesting that endurance exercise may not significantly alter the characteristics perceived by odor.
Odorant substances are detected via two routes, namely, the orthonasal route and the retronasal route [26]. Smelling brings odorants from the nostrils into the nasal cavity (orthonasal route). Alternatively, chewing and swallowing propel odorants released by food upward, behind the palate and into the nasal cavity from the back of the mouth (retronasal route). We evaluated the perception of odors through the orthonasal route in this study. Because each pathway is known to have a different role in odor perception [27], we should investigate the effect of physical fatigue on the retronasal route in future studies; for example, this could involve evaluating the odor perceived when a sample is swallowed.
We discuss the factors contributing to the observed change in taste intensity due to endurance exercise. In this study, subjects were permitted to beverage water during exercise but were restricted from consuming energy-rich foods and beverages. Interestingly, there was a minimal difference in body weight pre- and post-exercise (pre-exercise: 51.7 ± 1.6 kg vs. post-exercise: 51.4 ± 1.6 kg), indicating that water consumption alone was not a direct cause of the observed changes. Isotonic beverages contain sugar and minerals, which are consumed during exercise. It has been reported that exercise can increase the threshold for sweet taste [17]. As exercise continued, the RQ increased and then decreased. This indicates that carbohydrates are consumed first before fats are utilized. Since carbohydrates were decreased, the preference for highly concentrated carbohydrate solutions may have increased. Consequently, it is plausible that a solution with a weak taste may become unsatisfactory, while a solution with a stronger taste may become preferable. Additionally, taste sensitivity is indirectly influenced by blood hormones such as insulin and leptin [10]; insulin enhances the response to salt by increasing the activity of sodium ion channels in taste cells. On the other hand, leptin reduces the response to sweetness, potentially by modulating the sweet signaling pathways in taste cells. Thus, such hormone levels, which change depending on physiological states, may affect taste sensitivity. In future studies, we intend to explore these factors further.
A limitation of this study is that the subjects were all women. Additionally, to obtain generalizable results, we used ordinary young women, not athletes, as subjects. It is possibility that different results were observed depending on sex, age, or training frequency. Furthermore, to eliminate the influence of calories, isotonic drinks were not ingested but spat out in this study, leading to different results if swallowed, as this would result in caloric intake. We plan to examine whether these differences arise because of these factors.
5. Conclusions
In this study, we investigated changes in taste and odor sensitivities during endurance exercise. While the taste intensity and preference were changed by endurance exercise, the odor intensity and preference were not. These results suggest that taste sensitivity may change with prolonged exercise, and that odor sensitivity may be less affected by exercise compared to taste sensitivity. Eventually, we will analyze differences in taste and odor sensitivities based on sex, training frequency, and blood hormone levels, to better understand the mechanism behind exercise-induced changes in sensitivity. Since taste and olfaction are key senses for food intake, our findings offer valuable insights into effective nutritional support for maintaining optimal performance.
Acknowledgments
We thank Nao Adachi, Sayaka Hara, Chihiro Murayama, and Eri Noso (Kyoto Women’s University, Japan) for their support with the sensory evaluation.
Funding Statement
This work was supported in part by a Grant-in-Aid for Scientific Research (B) 22H02292 from the Japan Society for the Promotion of Science.
Disclosure statement
No potential conflict of interest was reported by the author(s).
Author contributions
Conceptualization, M.N., H.U.; data collection M.N., R.M., M.M.; data analysis M.N., K.N.; interpretation of the data, S.S., K.S., writing – original draft preparation, M.N., K.N.; writing – review and editing, M.N., K.N., S.S., K.S., H.U.; funding acquisition, M.N. All authors have read and approved publication of this paper.
References
- 1.Gollnick PD, Matoba H.. Role of carbohydrate in exercise. Clin Sports Med. 1984;3(3):583–17. doi: 10.1016/S0278-5919(20)31305-3 [DOI] [PubMed] [Google Scholar]
- 2.Kreider RB, Campbell B.. Protein for exercise and recovery. Phys Sportsmed. 2009;37(2):13–21. doi: 10.3810/psm.2009.06.1705 [DOI] [PubMed] [Google Scholar]
- 3.Latzka WA, Montain SJ. Water and electrolyte requirements for exercise. Clin Sports Med. 1999;18(3):513–524. doi: 10.1016/S0278-5919(05)70165-4 [DOI] [PubMed] [Google Scholar]
- 4.Melis M, Tomassini Barbarossa I, Sollai G, et al. The implications of taste and olfaction in nutrition and health. Nutrients. 2023;15(15):3412. doi: 10.3390/nu15153412 [DOI] [PMC free article] [PubMed] [Google Scholar]
- 5.Lima LV, Abner TSS, Sluka KA. Does exercise increase or decrease pain? Central mechanisms underlying these two phenomena. J Physiol. 2017;595(13):4141–4150. doi: 10.1113/JP273355 [DOI] [PMC free article] [PubMed] [Google Scholar]
- 6.Di Liegro CM, Schiera G, Proia P, et al. Physical activity and brain health. Genes (Basel). 2019;10(9):720. doi: 10.3390/genes10090720 [DOI] [PMC free article] [PubMed] [Google Scholar]
- 7.Richter EA, Sylow L, Hargreaves M. Interactions between insulin and exercise. Biochem J. 2021;478(21):3827–3846. doi: 10.1042/BCJ20210185 [DOI] [PubMed] [Google Scholar]
- 8.Bouassida A, Zalleg D, Bouassida S, et al. Leptin, its implication in physical exercise and training: a short review. J Sports Sci Med. 2006;5(2):172–181. [PMC free article] [PubMed] [Google Scholar]
- 9.Kjaer M, Secher NH, Galbo H. Physical stress and catecholamine release. Baillière’s Clin Endocrinol And Metab. 1987;1(2):279–298. doi: 10.1016/S0950-351X(87)80064-2 [DOI] [PubMed] [Google Scholar]
- 10.Loper HB, La Sala M, Dotson C, et al. Taste perception, associated hormonal modulation, and nutrient intake. Nutr Rev. 2015;73(2):83–91. doi: 10.1093/nutrit/nuu009 [DOI] [PMC free article] [PubMed] [Google Scholar]
- 11.Karvonen MJ, Kentala E, Mustala O. The effects of training on heart rate; a longitudinal study. Ann Med Exp Biol Fenn. 1957;35(3):307–315. [PubMed] [Google Scholar]
- 12.Nojiri K, Nakamura A, Qian M. Method for expressing image with colors and color expression drawing (in Japanese). JP Patent 6826195. (2021 Feb 3). [Google Scholar]
- 13.Nojiri K, Nakamura A, Qian M. Method for expressing image with colors and color expression drawing. US Patent 11138766. (2021. Oct 5).
- 14.Faul F, Erdfelder E, Lang AG, et al. G*power 3: a flexible statistical power analysis program for the social, behavioral, and biomedical sciences. Behav Res Methods. 2007;39(2):175–191. doi: 10.3758/BF03193146 [DOI] [PubMed] [Google Scholar]
- 15.King NA, Appleton K, Rogers PJ, et al. Effects of sweetness and energy in drinks on food intake following exercise. Physiol Behav. 1999;66(2):375–379. doi: 10.1016/S0031-9384(98)00280-7 [DOI] [PubMed] [Google Scholar]
- 16.Gauthier AC, Villeneuve M, Cournoyer M, et al. Intensity and appreciation of sweet taste solutions are modulated by high-intensity aerobic exercise in adolescent athletic males. Pediatr Exerc Sci. 2024:1–8. doi: 10.1123/pes.2024-0040 [DOI] [PubMed] [Google Scholar]
- 17.Narukawa M, Ue H, Morita K, et al. Change in taste sensitivity to sucrose due to physical fatigue. Food Sci Technol Res. 2009;15(2):195–198. doi: 10.3136/fstr.15.195 [DOI] [Google Scholar]
- 18.Horio T, Kawamura Y. Influence of physical exercise on human preferences for various taste solutions. Chem Senses. 1998;23(4):417–421. doi: 10.1093/chemse/23.4.417 [DOI] [PubMed] [Google Scholar]
- 19.Gauthier AC, Dupont F, Mathieu ME, et al. Association between physical activity and taste–the advantage of increased intensity for some but not all individuals. PLOS ONE. 2023;18(12):e0295173. doi: 10.1371/journal.pone.0295173 [DOI] [PMC free article] [PubMed] [Google Scholar]
- 20.Stone H, Pryor G, Colwell J. Olfactory detection thresholds in man under conditions of rest and exercise. Percept Psychophys. 1967;2(4):167–170. doi: 10.3758/BF03210313 [DOI] [Google Scholar]
- 21.Norton K, Norton L, Sadgrove D. Position statement on physical activity and exercise intensity terminology. J Sci Med Sport. 2010;13(5):496–502. doi: 10.1016/j.jsams.2009.09.008 [DOI] [PubMed] [Google Scholar]
- 22.Patel H, Kerndt CC, Bhardwaj A. Physiology, respiratory quotient. Treasure Island, Florida: Statpearls. Treasure Island, StatPearls Publishing LLC; 2024. [PubMed] [Google Scholar]
- 23.Schrauwen P, Hesselink MK, Vaartjes I, et al. Effect of acute exercise on uncoupling protein 3 is a fat metabolism-mediated effect. Am J Physiol Endocrinol Metab. 2002;282(1):E11–17. doi: 10.1152/ajpendo.2002.282.1.E11 [DOI] [PubMed] [Google Scholar]
- 24.Narukawa M, Ue H, Uemura M, et al. Influence of prolonged exercise on sweet taste perception. Food Sci Technol Res. 2010;16(5):513–516. doi: 10.3136/fstr.16.513 [DOI] [Google Scholar]
- 25.Aprotosoaie AC, Luca SV, Miron A. Flavor chemistry of cocoa and cocoa products—an overview. Compr Rev Food Sci Food Saf. 2016;15(1):73–91. doi: 10.1111/1541-4337.12180 [DOI] [PubMed] [Google Scholar]
- 26.Altundag A, Salihoglu M, Cayonu M, et al. The effect of anatomic clearance between tongue and soft palate on retronasal olfactory function. Chem Percept. 2014;7(1):40–45. doi: 10.1007/s12078-014-9162-7 [DOI] [Google Scholar]
- 27.Small DM, Gerber JC, Mak YE, et al. Differential neural responses evoked by orthonasal versus retronasal odorant perception in humans. Neuron. 2005;47(4):593–605. doi: 10.1016/j.neuron.2005.07.022 [DOI] [PubMed] [Google Scholar]


