

Abstract
In search for novel T-cell immunogens involved in protection against invasive meningococcal disease, we screened fractionated proteins of Neisseria meningitidis (strain SD, B:15:P1.16) by using peripheral blood mononuclear cells (PBMCs) and specific T-cell lines obtained from normal individuals and patients convalescing from N. meningitidis infection. Proteins of iron-depleted meningococci produced higher PBMC proliferation indices than proteins of iron-replete organisms, indicating that iron-regulated proteins are T-cell immunogens. Insoluble proteins of the iron-depleted cells, which produced better T-cell stimulation than soluble ones, were fractionated by using sodium dodecyl sulfate-polyacrylamide gels and recovered as five fractions (F1 to F5) corresponding to decreasing molecular weight ranges. The proteins were purified (by elution and precipitation) or electroblotted onto nitrocellulose membranes (dissolved and precipitated) before use in further T-cell proliferation assays. One of the fractions (F1), containing high-molecular-mass proteins (>130 kDa), consistently showed the strongest T-cell proliferation responses in all of the T-cell lines examined. F1 proteins were subdivided into four smaller fractions (F1A to F1D) which were reexamined in T-cell proliferation assays, and F1C induced the strongest responses in patients’ T-cell lines. Rabbit polyclonal antibodies to F1C components were used to screen a genomic expression library of N. meningitidis. Two major clones (C1 and C24) of recombinant meningococcal DNA were identified and fully sequenced. Sequence analysis showed that C24 (1,874 bp) consisted of a single open reading frame (ORF), which was included in clone C1 (2,778 bp). The strong CD4+ T-cell-stimulating effect of the polypeptide product of this ORF (named TspA) was confirmed, using a patient T-cell line. Immunogenicity for B cells was confirmed by showing that convalescent patients’ serum antibodies recognized TspA on Western blots. Additional genetic sequence downstream of C24 was obtained from the meningococcal genomic sequence database (Sanger Centre), enabling the whole gene of 2,761 bp to be reconstructed. The DNA and deduced amino acid sequence data for tspA failed to show significant homology to any known gene, except for a corresponding (uncharacterized) gene in Neisseria gonorrhoeae genome sequences, suggesting that tspA is unique to the genus Neisseria. The DNA and deduced amino acid sequence of the second ORF of clone C1 showed significant homology to gloA, encoding glyoxalase I enzyme, of Salmonella typhimurium and Escherichia coli. Thus, we have identified a novel neisserial protein (TspA) which proved to be a strong CD4+ T-cell- and B-cell-stimulating immunogen with potential as a possible vaccine candidate.
Neisseria meningitidis is the most common cause of pyogenic meningitis among children and young adults and is the only bacterium that causes epidemic outbreaks of meningitis. The clinical manifestations of infection with N. meningitidis range from asymptomatic carriage to overwhelming septicemic shock (5). There is presently an upsurge of meningococcal infection worldwide, particularly that due to serogroup B. This serogroup causes 55 to 70% of all N. meningitidis infections in England and Wales. N. meningitidis capsular polysaccharide (CPS) vaccines against serogroups A, C, W135, and Y offer short-lived, strain-specific protection, but they do not protect against group B. CPS vaccines are also ineffective in children less than 2 years old, the age group most at risk. The ideal N. meningitidis vaccine should provide long-term immunity to all strains in all age groups; no such vaccine has been developed thus far.
Immunity to N. meningitidis infection correlates with the presence of bactericidal immunoglobulin G (IgG) (13). Help by CD4+ T cells is required for an efficient humoral immune response generating lytic IgG and memory B cells. CD4+ T cells recognize antigen (Ag) peptides associated with major histocompatibility complex class II on Ag-presenting cells (APCs). Thus, appropriate proteins may enhance the effectiveness of meningococcal vaccines by acting as more appropriate carriers for the immunogenic CPS or as protective immunogens in their own right. Attempts have been made to improve the efficacy of the CPSs as vaccine candidates by conjugating them to carrier proteins (e.g., tetanus toxoid) to make them CD4+ T-cell dependent. However, with the poorly immunogenic group B CPS, there was no increase in lytic IgG and no memory development (29). The tolerogenicity of serogroup B CPS (due to molecular mimicry) may ultimately preclude its use in conjugate vaccines (14, 20).
The outer membrane proteins (OMPs) are potential vaccine candidates. The number of OMPs studied so far for T-cell stimulation is very limited; they include the major porins PorA and PorB (class 1 and 2 OMPs, respectively) and class 5 proteins (Opa and Opc) (10, 26, 27). Vaccination with N. meningitidis outer membrane vesicles (Norwegian vaccine) elicits strong primary and memory CD4+ T-cell responses to PorA and PorB (17). However, the major-class OMPs are highly variable and are used in the serological typing of N. meningitidis. Several outer membrane vesicle vaccines enriched with these class proteins underwent extensive clinical trials in Scandinavia (8) and South America (11, 22, 28). The results were largely disappointing. However, crude mixtures of meningococcal OMPs have been used with success as carriers for the Haemophilus influenzae type b CPS vaccine (16), indicating that they do contain potent CD4+ T-cell epitopes.
The identification and characterization of further meningococcal T- and B-cell protein Ags is a priority to enable the design of the optimal vaccines for N. meningitidis infection. Here we describe an approach that led to the identification of TspA, a novel meningococcal protein Ag which stimulates T cells of both normal individuals and patients convalescing from N. meningitidis infection. We report the characterization of this Neisseria-specific Ag.
MATERIALS AND METHODS
N. meningitidis growth conditions and protein extraction.
N. meningitidis, strain SD (B:15:P1.16), was subcultured in Mueller-Hinton broth and grown overnight in 5% CO2. Iron limitation, as a relatively well-characterized form of stress, was achieved by the addition of 25 μM desferrioxamine (Ciba) to the Mueller-Hinton broth. To obtain total protein extracts, the cells were resuspended in phosphate-buffered saline (PBS) and sonicated for 4 min on ice at 4°C.
To separate soluble and insoluble membrane-bound meningococcal components, sonicated whole-cell extracts of iron-depleted organisms (SD−) or iron-replete organisms (SD+), at a concentration of 1 mg/ml, were centrifuged at 3,000 × g, and the pellet was resuspended in PBS containing 10% Triton X-100 and incubated by shaking for 3 h at room temperature. This was followed by centrifugation at 100,000 × g for another 2 h. The supernatant (soluble proteins) was removed, and the pellet (insoluble proteins) was resuspended in PBS.
SDS-PAGE and electroblotting.
Sodium dodecyl sulfate-polyacrylamide gel electrophoresis (SDS-PAGE) of sonicated SD− whole-cell extracts (1 mg/ml) was performed in 10% linear polyacrylamide gels. Separated proteins were transferred from the SDS-polyacrylamide gels onto nitrocellulose membranes (Schleicher & Schuell; 0.45 μm pore size) (3, 6).
Preparation of fractions of electroblotted proteins for T-cell proliferation assays.
For addition to proliferation assay mixtures, the nitrocellulose membranes were divided transversely into five equal fractions corresponding to different approximate molecular masses, with fractions F1 to F5 corresponding to >130 kDa, 70 to 130 kDa, 50 to 70 kDa, 34 to 50 kDa, and <34 kDa, respectively (Fig. 1). An additional piece of neat (unused) nitrocellulose membrane with the same surface area as the fractions was included as a negative control. Blot fractions were dried for 1 h at 37°C and solubilized in dimethyl sulfoxide. Nitrocellulose particles were precipitated with carbonate-bicarbonate buffer (pH 9.6) and collected by centrifugation (1). The dimethyl sulfoxide was removed by washing the precipitates four times in Hanks’ balanced salt solution. Fractions were resuspended in RPMI 1640 to a final volume of 0.5 ml, of which 10-μl aliquots were added to each well in the T-cell proliferation assays.
FIG. 1.
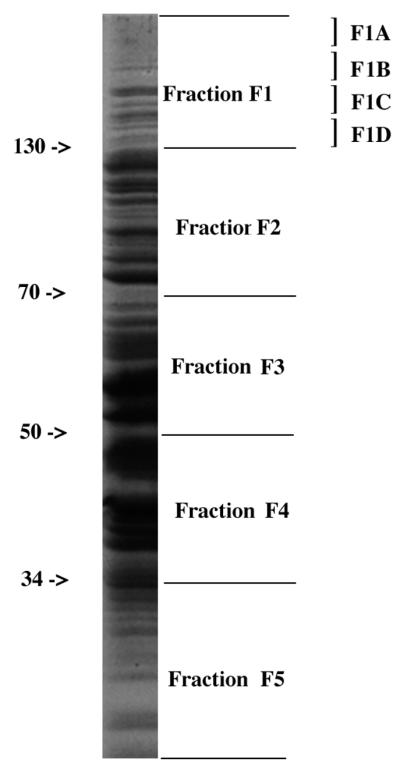
Coomassie brilliant blue-stained SDS-polyacrylamide gel of whole bacterial lysate of strain SD, indicating how the separated proteins were divided into five fractions (F1 to F5) based on approximate molecular mass ranges (in kilodaltons) and F1 was further divided into four subfractions (F1A to F1D).
Protein purification by elution from SDS-polyacrylamide gels.
Triton X-100-treated SD− insoluble proteins were separated on SDS-polyacrylamide gels. The gel was then divided transversely into five fractions corresponding to those produced from the nitrocellulose membranes after transblotting. Fraction F1 was subsequently subdivided transversely into four subfractions (F1A to F1D) (Fig. 1). The gel fractions were allowed to partially dehydrate for 15 min and crushed with a syringe barrel. They were then shaken in 10 ml of 0.1 M Tris-HCl (pH 6.8)–0.1% SDS for 48 h at 4°C. The gel matrix was removed by centrifugation, and the eluted proteins were recovered by lyophilization or by precipitation with acidified acetone. In the first method, the protein-containing supernatant was dialyzed against 0.02 M Tris buffer and then frozen at −70°C for 24 h before being freeze-dried overnight, using a Birchfield freeze-drier. The lyophilized powders were reconstituted in water. In the second method, eluted proteins were precipitated by adding 10 volumes of cold acidified acetone (90% acetone, 5% acetic acid, 5% triethylamine) to the protein-containing supernatant, and the mixture was incubated on ice for 6 to 7 h. The precipitated material was collected by centrifugation, and the pellet was stored at −20°C until it was redissolved in distilled water. Proteins recovered by precipitation rather than by lyophilization were used in the T-cell stimulation assays, as the lyophilized proteins did not induce T-cell proliferation.
Preparation of PBMCs and T-cell proliferation assay.
Peripheral blood mononuclear cells (PBMCs) were isolated from the blood of 13 normal healthy volunteers and two patients convalescing from meningococcal disease by liquid gradient centrifugation over Histopaque 1077 (Sigma-Aldrich Co. Ltd.). The PBMCs were adjusted to 2 × 10⁶ cells/ml in RPMI 1640 supplemented with 10 mmol of HEPES, 2 mmol of l-glutamine, 100 U of penicillin per ml, and 100 mg of streptomycin per ml (Sigma), with 10% human AB serum (Blood Transfusion Service, Sheffield, United Kingdom) added (RPMI/AB). A total of 2 × 10⁵ PBMCs (in 200 μl) were added to each well of 96-well flat-bottomed plates (ICN Biomedicals Ltd.), and 100 μg of SD+ per ml, 100 μg of SD− per ml, 5 μg of Candida Ags (CAD) per ml, or 10 μg of phytohemagglutinin (PHA) per ml was then added to quadruplicate wells.
The cells were incubated at 37°C in 5% CO2 for 7 days. The cultures were pulsed with 1 μCi of [3H]thymidine (Amersham International, Amersham, United Kingdom) per well for the final 18 h. The cells were harvested on unifilter plates by using an automatic cell harvester (FiltermateTM196). [3H]thymidine incorporation was measured as counts per min on a Beckman Topcount. Results are expressed as means ± standard deviations. Student’s t test for unpaired data was used for continuous variables. The Bonferoni correction to the standard P value for significance (P ≤ 0.05) was applied for multiple simultaneous comparisons. Stimulation (proliferation) indices (SIs) were calculated as counts per minute of cells cultured with the Ag divided by counts per minute of cells cultured without Ag.
Generation of EBV-transformed B-cell lines.
B-cell lines were generated, as described previously (12), to serve as APCs in the T-cell proliferation assay and for maintaining the T-cell lines. PBMCs were incubated with Epstein-Barr virus (EBV) produced by the B95-8 cell line (provided by C. Davenport, Division of Immunology, University of Nottingham) and then cultured in supplemented RPMI 1640 containing 10% fetal calf serum. Cyclosporine (0.5 μg/ml) was added for the first 4 weeks of culture.
Generation, stimulation, and analysis of T-cell lines.
PBMCs were cultured at 106 cells/well (24-well plates) in RPMI/AB. SD− antigens (100 μg/ml) and interleukin-2 (IL-2) (5 U/ml; Boehringer Mannheim) were added to each well, and the culture was incubated for 5 days. On day 5, an additional 5 U of IL-2 per ml was added, and on day 14, cells were used in a proliferation assay. T-cell lines were maintained by weekly addition of gamma-irradiated autologous feeder cells (either EBV-transformed B cells [EBV-B cells] or PBMCs; 106), SD− antigens (100 μg/ml), and IL-2 (5 U/ml) to 105 T cells.
For proliferation assays, T-cell lines were cultured at 1 × 10⁴ cells/well (in flat-bottomed 96-well plates) plus 2 × 10⁴ gamma-irradiated autologous EBV-B cells/well in RPMI/AB. Cells were cultured for 4 days with different antigen preparations. Eighteen hours before cell harvest, cultures were pulsed with 0.5 μCi of [3H]thymidine per well. Cells were harvested, and [3H]thymidine incorporation was measured and analyzed as described above.
To determine the phenotype of T-cell lines, 2 × 10⁶ cells were incubated at 4°C for 30 min with an anti-CD3, anti-CD4, anti-CD8, or anti-γ/δ monoclonal antibody (MAb) (Dako). The cells were then washed in PBS and incubated with fluorescein isothiocyanate-conjugated F(ab)2 sheep anti-mouse immunoglobulins (Sigma) for 30 min at 4°C. They were washed again in PBS and fixed in 300 μl of 10% formaldehyde in PBS. The stained cells were analyzed with a Becton Dickinson fluorescence-activated cell scanner (FACScan).
To enrich a T-cell line for CD4+ cells, the cells were resuspended at 107 cells/ml in PBS and incubated with anti-CD8 and anti-γ/δ T-cell receptor MAbs (Dako) at 4°C for 15 min. Cells were then pelleted, resuspended in PBS to which MACS magnetic microbeads coated with sheep anti-mouse IgG (Miltenyi Biotec GmbH) were added, and incubated at 4°C for 15 min. The labelled cells were run into the column, which was then washed with PBS. The effluent was collected as the negatively selected, CD4+ T-cell-enriched fraction.
Preparation of rabbit antiserum to meningococcal F1C proteins and Western blotting.
Rabbit polyclonal antibodies (R-F1C) were raised against purified proteins contained in fraction F1C, eluted from SDS-polyacrylamide gels, and lyophilized. A New Zealand White male rabbit was immunized five times at 2-week intervals. The first injection contained 30 μg of protein mixed with Freund’s complete adjuvant, and booster doses consisted of the same amount of the Ag mixed with Freund’s incomplete adjuvant. After four injections, the animal was test bled, boosted with one more injection, and then sacrificed 8 days later, and the serum was stored at −20°C. Western blotting was carried out on electroblotted proteins as described previously (6) with R-F1C (diluted 1:1,000). Western blotting was also carried out with convalescent patients’ sera diluted 1:50 in blocking buffer, as previously described (6).
Screening a gene library of N. meningitidis.
The R-F1C antiserum was used to screen a previously established genomic library of N. meningitidis (strain SD) in λZapII (7, 18). The library was amplified in Escherichia coli XL1-Blue (E. coli XB) (Stratagene) and screened for plaques reactive with R-F1C (preabsorbed with XB before use at a dilution of 1:1,000) as described previously (7). Identified plaques were purified, their pBluescript plasmids (containing recombinant meningococcal DNA inserts) were rescued in vivo in XB, proteins were expressed, and plasmids were extracted and examined by agarose gel electrophoresis, as described previously (7).
DNA sequencing and analysis.
Recombinant meningococcal DNA in the rescued pBluescript plasmids was sequenced (7). Initial sequences were obtained by using the forward and reverse universal primers TTG TAA ACC GAC GGC CAG TG and CAC ACA GGA AAC AGC TAT GAC C, respectively. Subsequent sequencing was performed by designing primers based on the newly obtained sequences (7).
Meningococcal sequence data obtained from these plasmids were analyzed by using the GeneJockey II program for Apple Macintosh (Biosoft). Database searches (GenEMBL and GenBank) were carried out for sequence homologies, using the Daresbury Genetics Computer Group program and the available BLAST (Basic Local Alignment Search Tool) search facility on the Internet.
RESULTS
PBMC proliferative responses to whole-cell extracts of N. meningitidis.
Lymphocyte proliferation assays were performed with PBMCs from 13 normal healthy donors to identify those individuals with T-cell responses to whole bacterial extracts of group B meningococci (strain SD). In these experiments PBMCs were cultured for 7 days with whole-cell extracts of meningococci grown under iron-sufficient conditions (SD+) or iron-restricted conditions (SD−) to induce the expression of iron-regulated genes. CAD and PHA were used as positive controls. For a negative control, no Ag was added to the wells. Based on the response to CAD, an SI of 2 or more was considered positive.
CAD stimulated lymphocyte proliferation in all donors, although not always to a greater extent than meningococcal total proteins, and PHA induced high proliferation for all donors (Table 1). Negative controls for the normal donors never exceeded 500 cpm. PBMCs from six normal donors gave proliferative responses to the meningococcal proteins, with SD− consistently inducing higher responses than SD+ (Table 1). Therefore, in all subsequent experiments, only SD− extracts were used. At least seven other normal donors failed to show a proliferative response to the meningococcal extracts (SD+ or SD−), suggesting that individuals vary in T-cell responsiveness to N. meningitidis (not shown).
TABLE 1.
Proliferation of PBMC (2 × 10⁵ cells/well) in response to meningococcal proteins
| Donor or patient | Mean cpm ± SD (SIa) in response to:
|
||||
|---|---|---|---|---|---|
| SD+ proteins | SD− proteins | CAD | PHA | Negative controlb | |
| D1 | NDc | 203 ± 18 (14.5) | 390 ± 203 (27.9) | 778.4 ± 101 (55.6) | 14 ± 5.5 |
| D2 | 494 ± 43 (18.3) | 626 ± 34 (23.2) | 78.3 ± 14 (2.9) | 1,644.3 ± 650 (60.9) | 27 ± 8.3 |
| D3 | 145 ± 21 (3.1) | 197 ± 30 (4.2) | 94 ± 23 (2.0) | 5,315.7 ± 291 (113.1) | 47 ± 19 |
| D4 | 1,190 ± 66 (2.8) | 2,252 ± 73 (5.3) | 6,545 ± 725 (15.4) | 152,745 ± 4,676 (359.4) | 425 ± 21 |
| D5 | 211 ± 16 (3.3) | 793 ± 25 (12.4) | 12,608 ± 411 (197) | 39,040 ± 1,672 (610) | 64 ± 11 |
| D6 | 121 ± 14 (2.2) | 286 ± 36 (5.2) | 709.5 ± 71 (12.9) | 24,365 ± 4,473 (443) | 55 ± 18 |
| P1d | |||||
| EC | ND | 2,019 ± 565 (2.5) | ND | 12,622 ± 450 (16) | 813 ± 69 |
| LC | ND | 4,240 ± 200 (5.0) | ND | 11,500 ± 534 (13) | 831 ± 48 |
Calculated as mean counts per minute for cells cultured with the Ag divided by mean counts per minute for the negative control.
Cells cultured without Ag.
ND, not done.
EC, early convalescent; LC, late convalescent.
PBMC proliferation to SD− proteins was also examined for a patient (P1), from whom early and late convalescent blood samples (7 and 28 days after recovery, respectively) were obtained (Table 1). Both early and late convalescent PBMCs showed significant proliferative responses to SD− when compared with PBMCs cultured alone (P < 0.0055 and P < 0.0001, respectively, with a cutoff of P ≤ 0.025). The late convalescent PBMCs produced a significantly greater response to SD− than did the early convalescent PBMCs (SI = 5 and 2.5, respectively; P < 0.0003), whereas their responses to PHA were very similar.
Establishment of T-cell lines specific to whole SD− meningococcal Ags.
T-cell lines (99% CD3+) specific to meningococcal Ags were generated from several normal healthy donors and from convalescent patients recovering from meningococcal disease. The cell lines were maintained weekly with SD− extract, gamma-irradiated autologous APCs, and IL-2. The APCs were EBV-B-cell lines or, for some of the normal donors, PBMCs. The T-cell lines showed proliferative responses to meningococcal Ags. For example, with the T-cell line established from patient 2 (P2), protein extracts of both SD+ and SD− meningococci yielded statistically significant T-cell proliferation (2,104 ± 200 and 4,225 ± 427 cpm, respectively), compared to the no-Ag negative control (T plus B cells alone; 884 ± 31 cpm) (P < 0.001). However, SD− protein extracts yielded stronger T-cell stimulation than those of SD+ extracts (P < 0.0001, with a cutoff of P ≤ 0.05).
Stimulation of T-cell lines by fractionated meningococcal Ags.
Meningococcal total proteins were separated by SDS-PAGE (Fig. 1) and transferred to nitrocellulose membranes. These were divided into five equal transverse fractions (F1 to F5) corresponding to different molecular mass ranges, as indicated in Fig. 1. T-cell proliferation assays were then performed with SD+ and SD− fractionated proteins. As shown in Fig. 2a, a T-cell line from normal donor 1 (D1) showed the highest proliferative responses to fractions F1 and F5 of SD−. F1, which contains high-molecular-mass proteins (>130 kDa), stimulated T cells approximately three times better than the T plus B cells alone and significantly better than F2, F3, F4, and F5 (P < 0.001 for the former three and P < 0.005 for the latter, with a cutoff off of P ≤ 0.013).
FIG. 2.


T-cell proliferation assays carried out with T-cell lines from donor D1 (a), donor D4 (b and c) and patient P2 (d), stimulated with fractionated proteins (fractions F1 to F5) of iron-depleted meningococci (SD−). Each bar represents the mean for quadruplicate wells (1 × 10⁴ T cells and 2 × 10⁴ APCs per well) from one experiment. Error bars indicate standard deviations. T+B cells alone, no-Ag negative control. (a and b) SD− whole-cell lysate blotted onto nitrocellulose membranes before division into fractions; (c and d) insoluble protein extracts of SD− lysate eluted from the SDS-polyacrylamide gels after the gel was divided into fractions.
The same experiments were repeated for the D4 T-cell line, and similar results were obtained for fractionated SD− proteins (Fig. 2b). Again, the response to fraction F1 was significantly higher (P < 0.001) than that to fractions F2, F3, F4, and F5 (with a cutoff of P ≤ 0.013). Similar results were also obtained with the D2 T-cell line (data not shown). In contrast, fractionated SD+ whole-cell extracts showed little or no stimulation of the T-cell lines from D1 and D4 compared with neat nitrocellulose membrane (data not shown).
The results shown in Fig. 2a and b indicated that the most potent meningococcal T-cell stimulants were in the high-molecular-weight range (fraction F1). Further experiments were therefore undertaken with T-cell lines from normal donor D4 and patient P2 to confirm the molecular weight range of the major T-cell stimulants. Insoluble SD− membrane components (which were found to induce a better T-cell stimulation than soluble components [data not shown]) were run on SDS-PAGE and recovered as five fractions corresponding to the molecular weight ranges shown in Fig. 1. In this case, the proteins were not transferred to nitrocellulose membranes but were recovered directly from the polyacrylamide gels. The gels were sliced transversely into the five fractions from which protein fractions F1 to F5 were eluted. The proteins were then precipitated, redissolved, and adjusted to equivalent protein concentrations for addition to the T-cell cultures. The results were consistent with those obtained by using the nitrocellulose membrane blot method. With the D4 T-cell line, fraction F1 proteins induced the highest T-cell proliferation compared with fractions F2, F3, F4, and F5 (P < 0.001, with a cutoff of P ≤ 0.013) (Fig. 2c). With the P2 T-cell line, F1 proteins again gave higher proliferation than F2, F3, F4, and F5 proteins (P < 0.005, P < 0.001, P < 0.014, and P < 0.003, respectively, with a cutoff of P ≤ 0.013) (Fig. 2d).
Subfractions of T-cell-stimulating meningococcal Ags.
Based on the consistent T-cell-stimulatory effect of its proteins, fraction F1 was chosen for further studies in order to identify the individual T-cell-stimulating proteins. Fraction F1 contains approximately 12 proteins, as detected on silver-stained SDS-polyacrylamide gels (data not shown). To find out which protein(s) was responsible for the T-cell stimulation, SD− insoluble proteins were again separated by SDS-PAGE, and fraction F1 of the gel was further subdivided into four subfractions (F1A to F1D). The area above the 200-kDa level was divided into two equal segments (subfractions F1A and F1B), and the area below this was divided into another two equal segments (subfractions F1C and F1D) (Fig. 1). The proteins were then eluted from the gel segments, precipitated by using the acidified-acetone method described above, and tested for their ability to stimulate T-cell proliferation. As shown in Fig. 3, with the patient P2 T-cell line, subfraction F1C induced the highest T-cell proliferative response (P < 0.002 compared to T plus B cells alone), although all four subfractions showed stimulation compared to the no-Ag negative control (T plus B cells alone). Thus, the order of decreasing stimulation of the P2 T-cell line by the four F1 subfractions was C > D ≥ B > A. For the T-cell line of another patient (P1), this order of stimulation was D ≥ C > A ≥ B, and for the normal donor D4 T-cell line, the order was B > C > D > A (data not shown). The collective ranking for T-cell stimulation given by these experiments was C > D ≥ B > A. Therefore, subfraction F1C was chosen for further analysis, since this subfraction most consistently stimulated the SD−-specific T-cell lines of different donors.
FIG. 3.

T-cell proliferation assay carried out with the T-cell lines from patient P2 stimulated with eluted proteins of subdivisions of fraction F1 of meningococcal strain SD grown under iron restriction (SD−). Each bar represents the mean for quadruplicate wells (1 × 10⁴ T cells and 2 × 10⁴ APCs per well) from one experiment. Error bars indicate standard deviations. T+B cells alone, no-Ag negative control.
Cloning of an F1C protein (TspA).
SD− F1C proteins were eluted from the corresponding subfractions of SDS-polyacrylamide gels and lyophilized. A rabbit polyclonal antiserum (R-F1C) was then raised against these F1C proteins. Immunoblotting showed that this antiserum clearly recognized the high-molecular-mass proteins contained in the purified F1C fraction and whole-cell extracts of the SD− strain (Fig. 4). In the latter case, the strongest antibody reactions occurred with proteins at around 200 kDa. R-F1C also reacted, although weakly, with several low-molecular-mass F1C and SD− proteins, which may be breakdown products of the higher-molecular-mass proteins. No reaction was detected with rabbit preimmune serum (not shown).
FIG. 4.
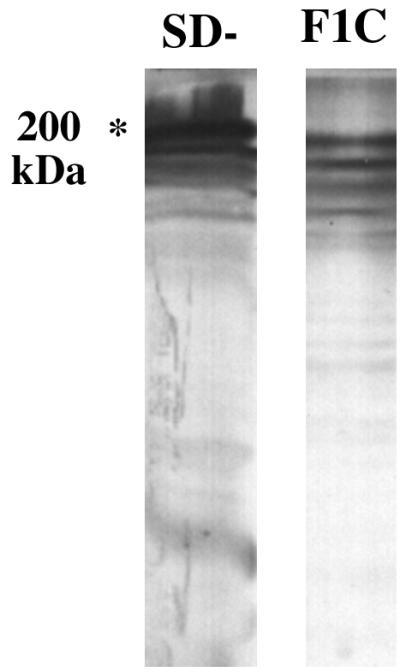
Western blot of rabbit anti-F1C against SD− whole-cell extracts and purified F1C proteins.
The R-F1C antiserum was then used to screen a genomic expression library of N. meningitidis (strain SD) in λZapII. This phage library had been established following the digestion of the meningococcal genomic DNA with the restriction enzyme Sau3A and ligated into the λZapII phage at the XhoI restriction site of the multiple cloning site (18).
After screening of approximately 50,000 plaques by immunoblotting, 55 positive clones (C1 to C55) were identified. Four of the most immunogenic (strongly positive) clones (C1, C13, C14, and C24) were chosen for purification and characterization. They were purified by being reseeded into E. coli XB at a high dilution and rescreened with the R-F1C antiserum. The meningococcal DNA inserts were rescued in vivo into pBluescript SKII plasmids (within XB) and designated pSKC1, pSKC13, pSKC14, and pSKC24. The plasmid-containing XB strains were grown in the presence of isopropyl-β-d-thiogalactoside (IPTG) and analyzed by Western blotting for the expression of meningococcal proteins, using R-F1C antiserum (preadsorbed with XB). All of the samples examined showed very similar Western blot profiles, with the expression of a major immunogenic high-molecular-mass protein (ca. 130 kDa) and several lower-molecular-mass proteins (possibly breakdown products of the major protein) reactive with the R-F1C antiserum. The profiles of pSKC1 and pSKC24 are shown in Fig. 5.
FIG. 5.
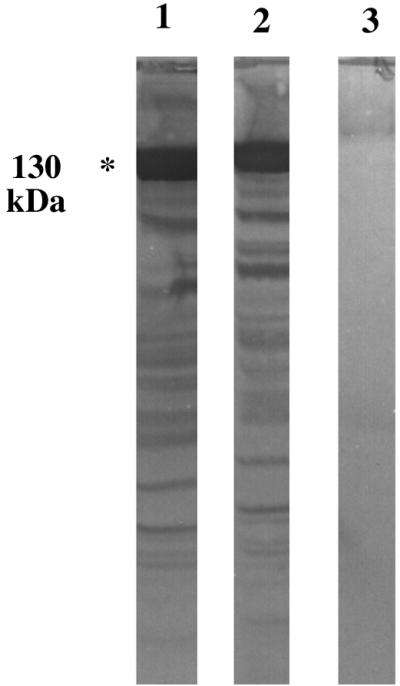
Western blot of whole-cell extracts of E. coli XB transformed with plasmids pSKC1 (lane 1), pSKC24 (lane 2), and pBluescript (without a DNA insert) (lane 3). Organisms were cultured in the presence of IPTG, and the blots were probed with rabbit anti-F1C preadsorbed with the host strain containing pBluescript.
Plasmid preparations were extracted, and their meningococcal DNA inserts were examined by agarose gel electrophoresis. They all appeared to comigrate, except for pSKC24, which was smaller, with an estimated recombinant DNA insert of 1.8 kb (not shown). Sequencing of the 5′ and 3′ ends of the DNA inserts, using universal forward and reverse primers, confirmed that the comigrating plasmids were indeed identical. Therefore, only pSKC1 and pSKC24 (containing clones C1 and C24, respectively) were chosen for further molecular characterization.
From the initial sequence data, it was clear that clones C1 and C24 were identical at their 3′ ends (reverse) but different at their 5′ ends. This and the differences in plasmid size suggested that pSKC1 contained a larger meningococcal DNA insert than that pSKC24. This was confirmed when both strands of both plasmid inserts were fully sequenced. The cloned meningococcal DNA insert in pSKC1 was 2,778 bases long, and that in pSKC24 was 1,874 bases long, extending from base 904 of clone C1 to its 3′ end (Fig. 6).
FIG. 6.

Schematic representation of meningococcal DNA fragments C1 and C24. Numbers indicate distances (in bases) from the 5′ end and sites of Sau3A restriction.
The DNA sequence data for clones C1 and C24 were analyzed, and likely open reading frames (ORFs) were identified (Fig. 6). ORF1 was present in C1 but not C24, whereas ORF2 was present in both plasmids. Thus, clone C24 consisted of only the latter ORF, the product of which (named TspA) must have been responsible for the selection of the immunogenic clones.
To confirm the immunogenicity of TspA produced by the selected clones, the ability of the purified recombinant TspA to stimulate the meningococcal (SD−)-specific T-cell line of patient P2 was examined.
T-cell stimulation by TspA.
The TspA fragment expressed by clone C24 (in E. coli XB) was prepared by elution from SDS-polyacrylamide gels followed by precipitation with acidified acetone. As a negative control, ca. 130-kDa proteins (E. coli P130) of the host E. coli XB, containing pBluescript with no meningococcal DNA inserts, were eluted and precipitated in the same way as for TspA. To achieve comparability, the test TspA and P130 were prepared from the same number of cells, as assessed by the optical density at 600 nm of log-phase cultures, and the precipitated products were reconstituted in equal volumes of PBS. Equal volumes of the final TspA and P130 purified preparations were then tested in T-cell proliferation assays for their ability to stimulate T-cell lines. In these experiments, the meningococcal (SD−)-specific T-cell line of patient P2 was used.
Before T-cell proliferation assays were performed, the P2 T-cell line was phenotyped by indirect immunofluorescence with a CD4-specific MAb and flow cytometry. This showed that the T-cell population was 50% CD4+. To establish a line enriched for CD4+ T cells, the γ/δ+ T cells and CD8+ T cells were removed by using magnetic beads (mini-MACS) coated with MAbs to γ/δ T-cell receptors and CD8. The resulting T-cell population was 86.5% CD4+.
The results shown in Table 2 demonstrate that the CD4+ cell-enriched T cells of the P2 line clearly responded to TspA (SI = 4). This was significantly higher than the response to SD− (SI = 2.3; P < 0.003) or the negative controls, including E. coli P130 (SI = 1.3; P < 0.001, with a cutoff of P ≤ 0.017). Although the absolute responses (in counts per minute) are similar to those with whole PBMCs (Table 1), it should be noted that 20 times fewer T cells were used, i.e., 1 × 10⁴/well (plus 2 × 10⁴ APCs) compared with 2 × 10⁵ PBMCs.
TABLE 2.
Proliferation of CD4+ cell-enriched, SD−-maintained, and TspA-maintained T-cell lines of patient P2 (1 × 10⁴ T cells and 2 × 10⁴ APCs per well) stimulated with purified TspA and E. coli P130 and insoluble SD− proteins
| Ag or mitogen | Mean cpm ± SD (SIa) for the following T-cell line:
|
||
|---|---|---|---|
| CD4+ cell enriched | SD− maintained | TspA maintained | |
| Negative controlb | 1,115 ± 151 (1) | 1,431 ± 44 (1) | 837 ± 901 (1) |
| P130 | 1,500 ± 117 (1.3) | 1,375 ± 132 (0.9) | 1,115 ± 87 (1.3) |
| TspA | 4,500 ± 474 (4.0) | 2,376 ± 500 (1.7) | 3,719 ± 394 (4.4) |
| SD− extract | 2,602 ± 163 (2.3) | 2,516 ± 81 (1.8) | 1,662 ± 394 (2.0) |
| PHA | 12,287 ± 550 (11.0) | 12,500 ± 350 (8.8) | 10,120 ± 500 (12.0) |
Calculated as mean counts per minute for cells cultured with the Ag divided by mean counts per minute for cells cultured without Ag (negative control).
T plus B cells alone.
Two parallel cultures of the CD4+ cell-enriched P2 T-cell line were maintained with SD− or TspA. After 4 weeks, both cell lines were reexamined for T-cell proliferation and CD4 phenotype. The SD−-maintained line showed a reduced response to TspA (SI = 1.7) that was similar to the response to SD− (SI = 1.8), although TspA continued to induce a significantly better T-cell response than E. coli P130 (P < 0.009, with a cutoff of P ≤ 0.017) (Table 2). This SD−-maintained T-cell line showed a reduction of CD4+ cells to 67%.
The TspA-maintained specific T-cell line gave a much better response to TspA (SI = 4.4) than to SD− (SI = 2.0; P < 0.006) (Table 2). Again the response to TspA was higher than that to P130 (SI = 3; P < 0.0012, with a cutoff of P ≤ 0.017). This TspA-maintained T-cell line remained 85% CD4+.
B-cell stimulation by TspA.
The recombinant TspA, expressed by pSKC24, was immunoblotted against sera from four patients convalescing from meningococcal disease. Figure 7 clearly shows that all four patients responded with IgG antibodies against recombinant TspA.
FIG. 7.

Western blot of whole-cell extracts of E. coli XB transformed with pSKC24 containing recombinant TspA (C24) or with pBluescript with no meningococcal DNA insert (Ec). Membranes were probed with convalescent-phase sera from four different patients (P3 to P6), or the rabbit anti-F1C (positive control). All sera were adsorbed with XB containing pBluescript, as described previously (6). ∗, ca. 130 kDa.
Sequence analysis of TspA.
The DNA and deduced amino acid sequences of the ORFs were used to search the GenEMBL data bank for sequence homologies. Only the DNA and deduced amino acid sequences of ORF1 (accession no. Y14298) showed significant homology to known sequences. ORF1 showed 60% homology and a 414-base overlap with the gloA genes of Salmonella typhimurium (accession no. STU57364) and E. coli (accession no. U57363). gloA is known to encode the glyoxalase I enzyme component of the glyoxalase system that inactivates electrophilic 2-oxaldehydes (25).
The DNA and deduced amino acid sequences of the TspA-encoding ORF2 failed to show any significant homology to any known sequence in the available data banks (GenEMBL and Swissprot). However, it showed homology to a corresponding gene in N. gonorrhoeae genome sequences (16a), suggesting that tspA is present in both pathogenic species of the genus Neisseria.
The sequence analysis indicates that ORF2 represents the C-terminal fragment encoded by the gene of interest (tspA). Additional genetic sequence downstream of ORF2 was obtained from the meningococcal genomic sequence database (17a), enabling the whole gene of 2,761 bases to be reconstructed (accession no. AJ010113).
DISCUSSION
In view of the need for meningococcal vaccine components that are highly immunogenic for helper T cells, we adopted an immunological approach to identify novel T-cell stimulants of N. meningitidis. The more conventional strategy has been to start with previously identified meningococcal components and then investigate their potential immunogenicity. By contrast, we chose to utilize the discriminatory capacity of the immune system itself to highlight the meningococcal components that were most immunogenic for T cells and then isolate and characterize these components. Thus, we stimulated peripheral blood T cells, of both normal healthy donors and patients convalescing from meningococcal infections, with crude insoluble membrane components of group B meningococci fractionated on the basis of molecular weight. We raised an antiserum against the most immunogenic subfraction; this antiserum was used to screen a recombinant genomic expression library of N. meningitidis. This led to the isolation and sequencing of a novel meningococcal protein whose immunogenicity for the T cells and B cells of convalescent patients was confirmed.
The PBMCs of many (although not all) normal donors gave an in vitro proliferative response to the meningococcal lysate, which may represent a primary response or a memory response following natural benign exposure to N. meningitidis. The differences in stimulation observed with different donors may reflect HLA polymorphism, different histories of exposure to neisserial Ags (e.g., carriage of Neisseria lactamica), or exposure to cross-reactive Ags of other organisms. However, in terms of identifying meningococcal Ags that stimulate protective T-cell immunity, investigating the response of convalescent patients was particularly important. In such cases the infection is unequivocally documented, and the fact that the patient has survived and recovered (with the aid of intensive therapy) suggests that protective immunity has developed.
Proteins obtained from meningococci grown under iron restriction gave significantly better stimulation than those grown under iron-sufficient conditions. We concluded that proteins that are expressed under iron restriction (iron-regulated proteins [FeRPs]) might have contributed to the PBMC proliferation. It is known that during iron-restricted growth, meningococci express several new proteins, including two transferrin-binding proteins, two lactoferrin-binding proteins, two hemoglobin-haptoglobin utilization proteins, iron-binding proteins, and several other FeRPs (e.g., FrpA to -C) of unknown function (2, 4, 15, 19, 21, 23, 24). Indirect evidence has suggested that FeRPs induce T-cell-dependent antibody responses in animals (4, 9).
The highest T-cell responses were to fraction F1 of the meningococcal proteins separated by SDS-PAGE, i.e., the high-molecular-mass components (≥130 kDa). This is intriguing since fractions F3 and F4, in particular, contain known T-cell stimulants, namely, PorA, PorB, and possibly class 5 (Opa and Opc) proteins (26, 27). Recent studies have shown that these proteins stimulate T-cell proliferation in a wide-range of major histocompatibility complex class II molecular types. It is possible that fractions F2 to F4 contain a mixture of T-cell-suppressive as well as T-cell-stimulatory antigens, with a net result of a minimal proliferative T-cell response. Alternatively, the individual proteins within these fractions have different optimal dose responses that vary among different HLA types.
The rabbit antiserum raised against subfraction F1C (R-F1C) identified a number of clones from the genomic expression library of N. meningitidis, with those selected on the basis of giving the strongest signal having in common an ORF (ORF2 in clone C1). This ORF partially encoded a novel neisserial protein which we named TspA (for T-cell-stimulatory protein A). ORF2 consisted of 1,854 bases with 617 deduced amino acids and an estimated molecular mass of 65 kDa. This ORF was present in all of the selected clones, and therefore, it was highly likely that the common major immunogenic protein was related to this ORF. This immunogenic protein expressed by clone C24 was ca. 130 kDa, as identified on SDS-polyacrylamide gels and Western blots with R-F1C. This was twice as big as the estimated product of ORF2, which may (or may not) reflect dimerization of the protein.
Having identified and purified the C24 product as an immunogenic B-cell-stimulating component of F1C proteins as recognized by R-F1C, it was important to confirm that this protein (TspA) was responsible, at least partly, for the observed T-cell-stimulatory effect of F1C. Therefore, TspA was precipitated after elution from the preparatory gels. Comigrating proteins of the host E. coli were eluted and precipitated from the same number of cells in the same way as the purified TspA; these proteins were collectively designated E. coli P130 and were used in the T-cell proliferation assays in parallel with TspA to act as a negative control. TspA and P130 were tested for their capacity to stimulate a meningococcus-specific T-cell line, derived from a convalescent patient (P2), which had been highly enriched for CD4+ cells. TspA caused significantly greater proliferation than not only P130 but also the crude preparation of SD− proteins, thus confirming that TspA is, indeed, a potent T-cell stimulant which is recognized in the protective response to natural meningococcal infection. It is noteworthy that this recombinant TspA is truncated, and a full molecule may (or may not) induce an even stronger T-cell proliferation. It is interesting that when the CD4+ T-cell-enriched P2 cell line was further maintained with whole SD− lysate, the proportion of CD4+ cells declined again (from 86.5 to 67%), as did the response to TspA. By contrast, maintaining the line with TspA maintained the proportion of CD4+ cells and the response to TspA. This indicates that TspA is a specific CD4+ T-cell stimulant, whereas the whole meningococcal lysate contains stimulants of CD4+ T cells and other T cells.
Sera from patients recovering from meningococcal disease were shown to contain antibodies specific for TspA, thus demonstrating that TspA is immunogenic for B cells during natural infection. Normal sera from five individuals, with no history of invasive meningococcal disease, failed to react with TspA (data not shown). Further evidence for the B-cell immunogenicity of TspA is provided by our finding that antibodies to TspA are readily generated in BALB/c mice immunized with the purified recombinant protein (data not shown), as well as by its immunogenicity in rabbits shown by raising the antiserum to the meningococcal protein fraction F1C (R-F1C).
Additional sequence data downstream of C24 were obtained from the recently released meningococcal genomic sequence data (16a). This helped us to reconstruct the full gene of 2,761 bases which encodes TspA and showed that the ORF of clone C24 constitutes the C-terminal two-thirds of the gene. This may explain the difference in molecular mass detected on Western blotting with R-F1C antiserum for the product of pSKC24 (ca. 130 kDa) (Fig. 5) and the natural product present in the crude SD− (and SD+ [not shown]) preparation and the F1C subfraction (ca. 200 kDa) (Fig. 4).
Attempts are being made to amplify the complete gene, using PCR, and to clone it in an expression vector. Further work will involve full molecular, immunochemical, and functional characterization of the complete protein. An important aspect of this work will be determining the general immunogenicity of TspA in a broad selection of individuals.
ACKNOWLEDGMENTS
This work was partly funded by Sir Halley Stewart’s Trust and the British Medical Research Council (grant no. G9425494PB).
REFERENCES
- 1.Abou-Zeid C, Filley E, Steele J, Gav R. A simple new method for using antigens separated by polyacrylamide gel electrophoresis to stimulate lymphocytes in vitro after converting bands cut from Western blots into antigen-bearing particles. J Immunol Methods. 1987;98:5–10. doi: 10.1016/0022-1759(87)90429-7. [DOI] [PubMed] [Google Scholar]
- 2.Adhikari P, Berish S A, Nowalk A J, Veraldi K L, Morse S A, Mietzner T A. The fbpABC locus of Neisseria gonorrhoea functions in the periplasm-to-cytosol transport of iron. J Bacteriol. 1996;178:2145–2149. doi: 10.1128/jb.178.7.2145-2149.1996. [DOI] [PMC free article] [PubMed] [Google Scholar]
- 3.Ala’Aldeen D A, Davies H A, Wall R A, Borriello S P. The 70 kilodalton iron regulated protein of Neisseria meningitidis is not the human transferrin receptor. FEMS Microbiol Lett. 1990;69:37–42. doi: 10.1016/0378-1097(90)90409-j. [DOI] [PubMed] [Google Scholar]
- 4.Ala’Aldeen D A A. Transferrin receptors of Neisseria meningitidis: promising candidates for a broadly cross-protective vaccine. J Med Microbiol. 1996;44:237–243. doi: 10.1099/00222615-44-4-237. [DOI] [PubMed] [Google Scholar]
- 5.Ala’Aldeen D A A. Neisseria meningitidis. In: Emmerson A M, Hawkey P, Gilaspy S, editors. Principles and practice of clinical bacteriology. Chichester, United Kingdom: John Wiley and Sons; 1997. pp. 277–304. [Google Scholar]
- 6.Ala’Aldeen D A A, Stevenson P, Griffiths E, Gorringe A R, Irons L I, Robinson A, Hyde S, Borriello S P. Immune responses in man and animals to meningococcal transferrin-binding proteins: implications for vaccine design. Infect Immun. 1994;62:2894–2900. doi: 10.1128/iai.62.7.2984-2990.1994. [DOI] [PMC free article] [PubMed] [Google Scholar]
- 7.Ala’Aldeen D A A, Westphal A H, de Kok A, Weston V, Atta M, Baldwin T J, Bartley J, Borriello S P. Cloning, sequencing, characterisation and implications on vaccine design of the novel dihydrolipoyl acetyltransferase of Neisseria meningitidis. J Med Microbiol. 1996;45:419–432. doi: 10.1099/00222615-45-6-419. [DOI] [PubMed] [Google Scholar]
- 8.Bjune G, Hoiby E A, Gronnesby J K, Arnesen O, Fredriksen J H, Halstensen A, Holten E, Lindbak A K, Nokleby H, Rosenqvist E, Solberg L K, Closs O, Eng J, Froholm L O, Lystad A, Bakketeig L S, Hareide B. Effect of outer membrane vesicle vaccine against group B meningococcal disease in Norway. Lancet. 1991;338:1093–1096. doi: 10.1016/0140-6736(91)91961-s. [DOI] [PubMed] [Google Scholar]
- 9.Danve B, Lissolo L, Mignon M, Dumas P, Colombani S, Schryvers A B, Quentin-Millet M-J. Transferrin-binding proteins isolated from Neisseria meningitidis elicit protective and bactericidal antibodies in laboratory animals. Vaccine. 1993;11:1214–1220. doi: 10.1016/0264-410x(93)90045-y. [DOI] [PubMed] [Google Scholar]
- 10.Delvig A A, Rosenqvist E, Oftung F, Robinson J H. T-cell epitope mapping the porB protein of serogroup B Neisseria meningitidis in B 10 congenic strains of mice. Clin Immunol Immunopathol. 1997;85:134–142. doi: 10.1006/clin.1997.4437. [DOI] [PubMed] [Google Scholar]
- 11.De Moraes J C, Perkins B A, Camargo M C, Hidalgo N T P, Barbosa H A, Sacchi C T, Gral I M L, Gattas V L, Vasconcelos H G, Plikaytis B D, Wenter J D, Broome C V. Protective efficacy of a serogroup B meningococcal vaccine in Sao Paulo, Brazil. Lancet. 1992;340:1074–1078. doi: 10.1016/0140-6736(92)93086-3. [DOI] [PubMed] [Google Scholar]
- 12.Davenport C, Bottazzo G F, Todd I. Stimulation of human B cells specific for candida albicans for monoclonal antibody production. FEMS Microbiol Immunol. 1992;89:335–344. doi: 10.1111/j.1574-6968.1992.tb05014.x. [DOI] [PubMed] [Google Scholar]
- 13.Frasch C E. Immunisation against Neisseria meningitidis. In: Easmon C, Jeljaszewics J, editors. Medical microbiology. London, United Kingdom: Academic Press; 1983. pp. 115–144. [Google Scholar]
- 14.Kruisbeek A M, Amsen D. Mechanisms underlying T-cell tolerance. Curr Opin Immunol. 1996;8:233–244. doi: 10.1016/s0952-7915(96)80062-8. [DOI] [PubMed] [Google Scholar]
- 15.Lewis L A, Grey E, Wang Y P, Roe B A, Dyer D W. Molecular characterization of hpuAB, the haemoglobin-haptoglobin-utilization operon of Neisseria meningitidis. Mol Microbiol. 1997;23:737–749. doi: 10.1046/j.1365-2958.1997.2501619.x. [DOI] [PubMed] [Google Scholar]
- 16.Makela P H, Eskola J, Kayhty H, Takala A K. Vaccines against Haemophilus influenzae type b. In: Ala’Aldeen D A A, Hormaeche C E, editors. Molecular and clinical aspects of bacterial vaccine development. Chichester, United Kingdom: John Wiley and Sons Ltd.; 1995. pp. 42–92. [Google Scholar]
- 16a.Meningococcal genomic sequence database. [Online.] Sanger Centre. http://www.sanger.ac.uk/Projects/N_meningitidis. [15 November 1998, last date accessed.]
- 17.Naess L M, Oftung F, Aase A, Wetzler L M, Sandin R, Michaelsen T E. Human T-cell responses after vaccination with the Norwegian group B meningococcal outer membrane vesicle vaccine. Infect Immun. 1998;66:959–965. doi: 10.1128/iai.66.3.959-965.1998. [DOI] [PMC free article] [PubMed] [Google Scholar]
- 17a.Neisseria gonorrhoeae genome sequences. [Online.] University of Oklahoma. http://dna1.chem.ou.edu/gono/html. [15 November 1998, last date accessed.]
- 18.Palmer H M, Powell N B L, Ala’Aldeen D A A, Wilton J, Borriello S P. Neisseria meningitidis transferrin binding protein 1 expressed in Escherichia coli is surface exposed and binds human transferrin. FEMS Microbiol Lett. 1993;110:139–146. doi: 10.1111/j.1574-6968.1993.tb06310.x. [DOI] [PubMed] [Google Scholar]
- 19.Pettersson A, Prinz T, Umar A, Bienzen J, Tommassen J. Molecular characterization of LbpB, the second lactoferrin-binding protein of Neisseria meningitidis. Mol Microbiol. 1998;27:559–610. doi: 10.1046/j.1365-2958.1998.00707.x. [DOI] [PubMed] [Google Scholar]
- 20.Rijkers G T, Sanders E A M, Breukels M A, Zegers B J M. Responsiveness of infants to capsular polysaccharides: implications for vaccine development. Rev Med Microbiol. 1996;7:3–12. [Google Scholar]
- 21.Schryvers A B, Gonzalez G C. Comparison of the abilities of different protein sources of iron to enhance Neisseria meningitidis infection in mice. Infect Immun. 1989;57:2425–2429. doi: 10.1128/iai.57.8.2425-2429.1989. [DOI] [PMC free article] [PubMed] [Google Scholar]
- 22.Sierra G V G, Campa H C, Varcacel N M, Garcia I L, Izquierdo P L, Sotolongo P F, Casanueva G V, Rico C O, Rodriguez C R, Terry M H. Vaccine against group B Neisseria meningitidis: protection trial and mass vaccination results in Cuba. NIPH Ann. 1991;14:195–210. [PubMed] [Google Scholar]
- 23.Thomson S A, Sparling P F. Cytotoxin-related FrpA protein of Neisseria meningitidis is excreted extracellularly by meningococci and by HlyBD+Escherichia coli. Infect Immun. 1993;61:2908–2911. doi: 10.1128/iai.61.7.2906-2911.1993. [DOI] [PMC free article] [PubMed] [Google Scholar]
- 24.Thomson S A, Wang L I, West A, Sparling P F. Neisseria meningitidis produces iron-regulated proteins related to the RTX family of exoproteins. J Bacteriol. 1993;175:811–818. doi: 10.1128/jb.175.3.811-818.1993. [DOI] [PMC free article] [PubMed] [Google Scholar]
- 25.Thornalley P J. Pharmacology of methylglyoxal: formation, modification of proteins and nucleic acids, and enzymatic detoxification: a role in pathogenesis and antiproliferative chemotherapy. Gen Pharmacol. 1996;27:565–573. doi: 10.1016/0306-3623(95)02054-3. [DOI] [PubMed] [Google Scholar]
- 26.Wiertz E J H J, Delvig A, Donors E M L M, Brugghe H F, Unen L A M, Termijtelen A A M, Achtman M, Hoogerhout P, Poolman J T. T-cell response to outer membrane proteins of Neisseria meningitidis: comparative study of Opa, Opc, and PorA proteins, class 1 outer membrane proteins. Infect Immun. 1996;64:298–304. doi: 10.1128/iai.64.1.298-304.1996. [DOI] [PMC free article] [PubMed] [Google Scholar]
- 27.Wiertz E J H J, Van Gaans-Van den Brink J A M, Schreuder G M T H, Termijtelen A A M, Hoogerhout P, Poolman J T. T cell recognition of Neisseria meningitidis class 1 outer membrane proteins. Identification of T cell epitopes with selected synthetic peptides and determination of HLA restriction elements. J Immunol. 1991;147:2012–2018. [PubMed] [Google Scholar]
- 28.Zollinger W D, Boslego J, Moran E, Garcia J, Cruz C, Ruiz S, Brandt B, Martinez M, Arthur J, Underwood P, Hankins W, Mays J, Gilly J The Chilean National Committee for Meningococcal Disease. Meningococcal serogroup B vaccine protection trial and follow-up studies in Chile. NIPH Ann. 1991;14:211–212. [PubMed] [Google Scholar]
- 29.Zollinger W D, Mandrell R E, Griffiss J M, Atieri P, Berman S. Complex of meningococcal group B polysaccharide and type 2 outer membrane protein immunogenic in man. J Clin Invest. 1979;63:836–848. doi: 10.1172/JCI109383. [DOI] [PMC free article] [PubMed] [Google Scholar]