Abstract
The cytomatrix at the active zone (CAZ) has been implicated in defining the site of Ca2+-dependent exocytosis of neurotransmitters. Here, we demonstrate the expression and function of ELKS, a protein structurally related to the CAZ protein CAST, in insulin exocytosis. The results of confocal and immunoelectron microscopic analysis showed that ELKS is present in pancreatic β cells and is localized close to insulin granules docked on the plasma membrane-facing blood vessels. Total internal reflection fluorescence microscopy imaging in insulin-producing clonal cells revealed that the ELKS clusters are less dense and unevenly distributed than syntaxin 1 clusters, which are enriched in the plasma membrane. Most of the ELKS clusters were on the docking sites of insulin granules that were colocalized with syntaxin 1 clusters. Total internal reflection fluorescence images of single-granule motion showed that the fusion events of insulin granules mostly occurred on the ELKS cluster, where repeated fusion was sometimes observed. When the Bassoon-binding region of ELKS was introduced into the cells, the docking and fusion of insulin granules were markedly reduced. Moreover, attenuation of ELKS expression by small interfering RNA reduced the glucose-evoked insulin release. These data suggest that the CAZ-related protein ELKS functions in insulin exocytosis from pancreatic β cells.
INTRODUCTION
The release of neurotransmitters is restricted to specialized presynaptic membrane compartments called active zones (Landis et al., 1988). The cytomatrix at the active zone (CAZ) is thought to play an organizational role in defining presynaptic sites of synaptic vesicle docking and fusion (Garner et al., 2000). On the other hand, the fusion of vesicles is mediated by the formation of the soluble N-ethylmaleimide–sensitive factor attachment protein receptor (SNARE) complex of the presynaptic plasma membrane protein syntaxin 1 and synaptosomal associated protein of 25 kDa (SNAP-25) and the synaptic vesicle protein vesicle-associated membrane protein-2 (Rizo and Südhof, 2002). Although the role of CAZ is understood in neurons, the role of active zones or exocytotic “hot spots” is still unclear in other regulated secretory cells, including pancreatic β cells, where the SNARE complex also plays an important role in their exocytotic processes (Daniel et al., 1999; Nagamatsu et al., 1999).
Recently, several CAZ-related specific proteins in neurons, including Bassoon, RIMs, Munc13s, Piccolo/Aczonin, and CASTs, have been identified and are thought to have a function in synaptic vesicle exocytosis and in the spatial organization of transmitter release (Gundelfinger et al., 2003; Rosenmund et al., 2003). RIM1, a small G protein Rab3A effector, regulates the Ca2+-dependent exocytosis of neurotransmitters in a Rab3A-dependent manner (Wang et al., 1997; Castillo et al., 2002; Schoch et al., 2002). Munc13-1 binds both RIM1 and the target (t)-SNARE syntaxin 1 and is implicated in the priming of synaptic vesicles (Brose et al., 2000; Betz et al., 2001). Bassoon and Piccolo/Aczonin are very large (>400 kDa) and are structurally related CAZ proteins (tom Dieck et al., 1998; Wang et al., 1999). Genetic knockout studies in several organisms have confirmed the importance of RIM1, Munc13-1, and Bassoon in synaptic vesicle exocytosis; disruption of RIM1 and Munc13-1 genes reduced the neurotransmitter release (Martin, 2002; Rosenmund et al., 2002; Schoch et al., 2002; Gundelfinger et al., 2003), and the loss of Bassoon resulted in impaired synaptic transmission and ectopic synapse formation in mouse retina (Altrock et al., 2003; Dick et al., 2003). In addition, CAST directly binds Bassoon, Piccolo, and RIM1 and indirectly binds Munc13-1 through RIM1, which suggests that CAST may act as a platform for form action of a dynamic multicomplex at the CAZ (Ohtsuka et al., 2002; Takao-Rikitsu et al., 2004). On the other hand, the t-SNAREs syntaxin1 and SNAP-25 are not specifically localized to active zones, but rather they are present on the entire axonal plasma membrane (Garcia et al., 1995). Given the spatial restriction of synaptic transmitter release to CAZ, the CAZ complex must exist at active zones that regulate SNARE function and thus cause the spatial restriction of the fusion process (Rosenmund et al., 2003). Thus, CAZ multicomplexing through CAST might be physically and functionally associated with the SNARE complex and regulate neurotransmitter release (Takao-Rikitsu et al., 2004).
Recently, Fujimoto et al. (2002) reported that several CAZ proteins identified in neurons also were expressed in pancreatic β cells, as found by using reverse transcription (RT)-PCR analysis, with the exception of CAST (Fujimoto et al., 2002); however, detailed localization and the functional roles of these proteins in insulin exocytosis are not known. To clarify the functions of the CAZ protein in insulin exocytosis that must function in collaboration with the SNAREs, we first examined the expression and localization of ELKS (Nakata et al., 1999), a protein structurally related to CAST (Deguchi-Tawarada et al., 2004) in pancreatic β cells. ELKS was first identified as a gene with a 5′ terminus fused to the RET tyrosine kinase oncogene in a papillary thyroid carcinoma (Nakata et al., 1999). Recently, ELKS also has been identified as Rab6-interacting protein 2 (Monier et al., 2002), ERC1 (Wang et al., 2002), and CAST2 (Deguchi-Tawarada et al., 2004), and its functions have been studied; ELKS seems to be involved in intracellular membrane traffic in several tissues (Monier et al., 2002; Wang et al., 2002), and, notably, ELKS is a component of active zones in the brain that binds RIMs (Wang et al., 2002; Deguchi-Tawarada et al., 2004). So far, there is no report showing the expression and function of ELKS in pancreatic β cells. In this study, we found that ELKS was appreciably expressed in rat pancreatic islets and in an insulin-producing clonal cell line, MIN6 β cells, where ELKS was colocalized with both insulin granules and syntaxin 1. We then investigated how ELKS functions in the docking and fusion of insulin granules by using living MIN6 β cells and total internal reflection fluorescence (TIRF) image analysis. The data obtained indicate that ELKS is involved in the regulation of insulin exocytosis.
MATERIALS AND METHODS
Plasmids
The construction of green fluorescent protein (GFP)-insulin expression vector has been described previously (Ohara-Imaizumi et al., 2004b). To produce constructs in which the TAT protein transduction domain (PTD) peptide is located at the N terminus of either the ELKS Bassoon-binding domain (ELKSBsnBD, aa 405–602) or the ELKS noncoiled-coil control domain (ELKSContD, aa 324–403), the coding region that corresponds to mouse ELKSBsnBD or ELKSContD was amplified by PCR by using oligonucleotide primers including the nucleotide sequence against the TAT PTD peptide (YGRKKRRQRRR) in each sense primer, as described previously (Ohara-Imaizumi et al., 2002a), and the PCR products were subcloned into a pPROEX vector with or without an Myc-tag. The resulting products were confirmed by an automated DNA sequencer (Amersham Biosciences UK, Little Chalfont, Buckinghamshire, United Kingdom).
Antibodies (Abs)
Polyclonal (p) anti-CAST (anti-CAST pAb; Takao-Rikitsu et al., 2004) and anti-ELKS (anti-ELKS pAb; Deguchi-Tawarada et al., 2004) were used. A mouse monoclonal antibody (mAb) against ELKS (anti-ELKS mAb) was raised against a peptide corresponding to aa 117–142, according to standard methods. Mouse monoclonal anti-Bassoon (StressGen Biotechnologies, Victoria, Ontario, Canada), mouse monoclonal anti-Munc13-1 (Synaptic Systems, Goettingen, Germany), mouse monoclonal anti-syntaxin 1 (Sigma-Aldrich, St. Louis, MO), mouse monoclonal anti-insulin (Sigma-Aldrich), mouse monoclonal anti-vascular endothelial (VE)-cadherin (BD Biosciences, San Jose, CA), mouse monoclonal anti-c-Myc (9E10) (Chemicon International, Temecula, CA), mouse monoclonal anti-GFP (Roche Diagnostics, Basel, Switzerland), mouse monoclonal anti-HA (Roche Diagnostics, Indianapolis, IN), rabbit polyclonal anti-RIM2 (Synaptic Systems), and guinea pig anti-insulin (Dako-Cytomation Denmark A/S, Glostrup, Denmark) antibodies were purchased from commercial sources.
Cell Culture and Transfection
MIN6 cells (a gift from Dr. J.-I. Miyazaki, Osaka University, Osaka, Japan) at passage 15–30 were cultured as described previously (Nagamatsu et al., 1999) on fibronectin-coated (KOKEN, Tokyo, Japan) high-refractive index glass (Olympus, Tokyo, Japan) for imaging by TIRF microscopy (TIRFM) or on glass chamber slides (eight wells, Lab-Tek slides; Nunc, Rochester, NY). MIN6 cells were transfected with the expression vector encoding the GFP-tagged insulin as described previously (Ohara-Imaizumi et al., 2002b). All experiments were performed within 3 d after transfection.
Immunofluorescence Staining
Immunofluorescence staining of rat pancreas was performed as described previously with minor modification (Nagamatsu et al., 1996). In brief, rat pancreas was dissected in 4% paraformaldehyde in 0.1 M phosphate buffer, pH 7.4, cryoprotected with graded concentrations of sucrose in phosphate-buffered saline (PBS), embedded in OCT compound (Miles, Elkhart, IN), and then frozen by immersion in liquid nitrogen. Semithin frozen sections were cut with a Miles cryostat, transferred to poly-l-lysine–coated thin slides (0.1 mm in thickness; Matsunami Glass, Osaka, Japan), and immunostained. Sections were incubated with primary antibodies (rabbit anti-ELKS pAb, mouse anti-insulin mAb, and mouse anti-VE-cadherin antibody, diluted 1:200) in PBS containing 4% fetal calf serum, 0.1% sodium azide, and 0.25% Triton X-100, followed by secondary antibodies (goat anti-mouse IgG conjugated to Texas Red (Molecular Probes, Eugene, OR) or goat anti-rabbit IgG conjugated to fluorescein (Sigma-Aldrich). The sections were examined by using laser-scanning confocal microscopy (optical slice of 1 μm: LSM510 with Zeiss 10 and 100× Plan-Neofluar objective; Carl Zeiss, Oberkochen, Germany).
For immunostaining, MIN6 β cells were fixed with ice-cold 100% methanol for 20 s and were permeabilized with 0.25% Triton X-100. Cells were incubated with the primary antibodies in PBS containing 3% bovine serum albumin (BSA) (Sigma-Aldrich) and 0.25% Triton X-100 for 2 h at room temperature, followed by the addition of secondary antibodies (goat anti-mouse IgG conjugated to Alexa Fluor-488, -546, and -633 (Molecular Probes), goat anti-rabbit IgG conjugated to Alexa Fluor-488 and -546 (Molecular Probes), or goat anti-guinea pig IgG conjugated to fluorescein (Sigma-Aldrich) for 1 h at room temperature.
Immunogold Labeling for Electron Microscopy
Immunogold labeling was carried out as described previously (Akimoto et al., 1999). The pancreas was fixed in 4% paraformaldehyde phosphate-buffered saline at 4°C for 2 h. After having been washed with PBS, specimens were dehydrated through a series of graded ethanols and were embedded in LR White resin (London Resin, Basingstoke, United Kingdom). Ultrathin sections were cut and mounted on nickel grids. The sections were incubated with 5% normal donkey serum phosphate-buffered saline for 1 h and they were incubated with anti-ELKS pAb antibody at 4°C for 24 h. As cytochemical controls, nonimmunized rabbit IgG was incubated with samples. After washing with PBS, the samples were incubated with 12-nm colloidal gold-conjugated donkey anti-rabbit IgG antibody (Jackson ImmunoResearch Laboratories, West Grove, PA) at room temperature for 2 h. After another wash with PBS, they were incubated with anti-insulin mAb (Sigma-Aldrich) at 4°C for 24 h. As cytochemical controls, nonimmunized mouse IgG was incubated with samples. After washing with PBS, the samples were incubated with 18-nm colloidal gold-conjugated donkey anti-mouse IgG antibody (Jackson ImmunoResearch Laboratories) at room temperature for 2 h. The specimen were washed with PBS and then fixed in 2% glutaraldehyde. After rinsing with deionized water, ultrathin sections were stained with uranyl acetate and were observed with a transmission electron microscope (JEM-1010; JEOL, Tokyo, Japan).
TAT-conjugated Antibody
TAT-conjugated Cy3-labeled anti-ELKS antibody was prepared as described previously (Ohara-Imaizumi et al., 2004a). In brief, anti-ELKS mAb was labeled with Cy3 by use of a Fluoro Link-antibody Cy3 labeling kit (Amersham Biosciences UK), according to manufacture's instructions. The Cy3-labeled antibody was dialyzed against 0.1 M borate buffer and was incubated with a fivefold molar excess of a cross-linker, sulfosuccinimidyl 6-[3′-(2-pyridyldithio)-propionamido] hexanoate (Pierce Chemical, Rockford, IL) for 3 h at room temperature. The conjugated antibody was separated from free cross-linker by gel filtration eluted with HBSS-HEPES (5 mM) buffer, pH 7.2. A 10-fold molar excess of TAT PTD peptide (GYGRKKRRQRRRGGGC) was added to the conjugated antibody, and the mixture was incubated overnight at 4°C. The TAT-conjugated antibody was separated from free TAT PTD peptide by gel filtration eluted with HBSS-HEPES (5 mM) buffer. On the day of experiments using TIRFM, MIN6 cells were transduced for 40 min with the TAT-conjugated Cy3-labeled anti-ELKS mAb (∼120 μg/ml).
TIRFM
The Olympus TIRF system was used with an inverted microscope (IX70; Olympus) and a high-aperture objective lens (Apo 100× OHR; numerical aperture 1.65; Olympus) as described previously (Ohara-Imaizumi et al., 2002b). In this study, the microscope was modified to allow both epifluorescence (EPIF) and through-the-objective TIRF illumination. To observe GFP alone, we used a 488-nm laser line for excitation and a 515-nm long-pass filter for the barrier. To observe the fluorescence image of GFP and Cy3 simultaneously under TIRF illumination, we used the 488-nm laser line for excitation and an image splitter (MultiSpec MicroImager; Optical Insight, Santa Fe, NM) that divided the green and red components of the images with 565-nm dichroic mirror (Q565; Chroma Technology, Brattleboro, VT) and passed the green component through a 530 ± 15-nm bandpass filter (HQ530/30m; Chroma Technology) and the red component through a 630 ± 25-nm band-pass filter (HQ630/50m; Chroma Technology). The images were then projected side by side onto a cooled charge-coupled device (CCD) camera (DV887DCSBV; ANDOR Technology, Belfast, Northern Ireland; operated with MetaMorph version 6.2; Universal Imaging, Downingtown, PA). Images were acquired at 300-ms intervals. Most analyses, including tracking (single projection of difference images) and area calculations, were performed using MetaMorph software. The two images were brought into focus in the same plane by adding weak lenses to one channel, and they were brought into resister by careful adjustment of the mirrors in the image splitter. Before each experimental session, we took an alignment image that showed density by means of scattered 90-nm TetraSpeck fluorescent beads (Molecular Probes). They were visible in both the green and red channels and thus provided markers in the x-y plane. Beads in the two images were brought into super-position by shifting one image by using MetaMorph software. The space constant for the exponential decay of the evanescent field was ∼43 nm. For the study of the real-time images of GFP-tagged insulin granule motion by TIRF, treated MIN6 cells were placed on the high refractive index glass, mounted in an open chamber, and incubated for 30 min at 37°C in Krebs-Ringer buffer (KRB) containing 110 mM NaCl, 4.4 mM KCl, 1.45 mM KH2PO4, 1.2 mM MgSO4, 2.3 mM calcium gluconate, 4.8 mM NaHCO3, 2.2 mM glucose, 10 mM HEPES, pH 7.4, and 0.3% BSA. Cells were then transferred to the thermostat-controlled stage (37°C) of TIRFM. Stimulation with KCl was achieved by the addition of 100 mM KCl-KRB (NaCl was reduced to maintain the isotonicity of the solution) into the chamber (final concentration, 50 mM KCl). On the day of experiments using TIRFM, MIN6 cells were transduced for 50 min with 70 μg/ml TAT fusion proteins.
To observe the TIRF image from triple immunostaining of MIN6 cells, we used the TIRFM with an arc-lamp source (IX2-ARCEVA; Olympus). To observe fluorescein, a filter of 490 ± 10 was used for excitation, and the emission signals were filtered with 528 ± 19-nm band-pass filter. To observe Alexa Fluor-546, a filter of 555 ± 14 was used for excitation, and the emission signals were filtered with 617 ± 36-nm band-pass filter. To observe Alexa Fluor 633, a filter of 635 ± 10 was used for excitation, and the emission signals were filtered with 685 ± 20-nm band-pass filter. Images were collected by the cooled CCD camera operated with MetaMorph software and then were analyzed by MetaMorph.
Insulin Release Assay
Control and TAT fusion protein-treated (70 μg/ml for 50 min) MIN6 cells were housed in a small chamber and perifused with the KRB (2.2 mM glucose) for 60 min at a flow rate of 0.5 ml/min at 37°C before the collection of fractions. Insulin release was stimulated by 22 mM glucose. Fractions were collected at 1-min intervals. At the end of the stimulation period, the cells were disrupted by sonication, and aliquots of media and cell extracts were analyzed for immunoreactive insulin (IRI) by radioimmunoassay. The amount of released insulin is expressed as a percentage of the total cellular content per minute.
Measurement of [Ca2+]i
MIN6 cells were loaded with 10 μM fura-2 acetoxymethyl ester (Fura-2 AM, Molecular Probes) for 30 min at 37°C in KRB (2.2 mM glucose), followed by washing and an additional 15-min incubation with KRB. Then, the coverslips were mounted on an ARGUS/HiSCA system (Hamamatsu Photonics, Hamamatsu, Japan). Fura-2 fluorescence was detected by cooled CCD camera after excitation at wavelengths of 340 nm (F340) and 380 nm (F380), and the ratio image (F340/F380) was calculated by use of the ARGUS/HiSCA system.
Immunoblotting
Proteins were extracted from rat brain or MIN6 cells by homogenization, or from rat islets, with the 1% Triton X-100 lysis buffer, and then were boiled in SDS sample buffer with 10 mM dithiothreitol subjected to SDS-PAGE, and then transferred onto nitrocellulose filters. The filter was incubated with anti-CAST or anti-ELKS pAbs followed by horseradish peroxidase-conjugated secondary antibody, and the bands were visualized by use of a chemiluminescence detection system (PerkinElmer Life and Analytical Sciences, Boston, MA).
Immunoprecipitation
For the in vitro binding studies of ternary complex formation of ELKS, Bassoon, and RIM2, immunoprecipitation was performed as described previously (Ohtsuka et al., 2002). In brief, each expression plasmid of Myc-ELKS, enhanced green fluorescent protein (EGFP)-Bassoon, or HA-RIM2 was transfected into human embryonic kidney (HEK)293 cells, and each protein was extracted and mixed. After incubation overnight at 4°C, immunoprecipitation was performed using anti-GFP antibody. The samples were then analyzed by immunoblotting. To examine the effects of TAT-ELKSBsnBD on the binding of ELKS and Bassoon, an immunoprecipitation assay for Myc-ELKS and EGFP-Bassoon was performed in the presence or absence of Myc-tagged TAT-ELKSBsnBD by using anti-GFP antibody, as described previously (Takao-Rikitsu et al., 2004). In brief, each expression plasmid of Myc-ELKS and EGFP-Bassoon was transfected into HEK293 cells, and each protein was extracted and mixed in the presence or absence of Myc-tagged TAT-ELKSBsnBD. After incubation overnight at 4°C, immunoprecipitation was performed using anti-GFP antibody. The samples were then analyzed by immunoblotting by using anti-Myc and anti-GFP antibodies.
For immunoprecipitation from MIN6 cells, the MIN6 cell lysates were immunoprecipitated with anti-Bassoon mAb or anti-Myc mAb (as a control) and pelleted with protein A-Sepharose (Nagamatsu et al., 1996). The immunoprecipitates were subjected to immunoblot analysis with anti-Bassoon mAb, anti-ELKS pAb, and anti-RIM2 pAb.
Pull-Down Assay
Myc-tagged TAT-ELKSBsnBD was incubated with glutathione-Sepharose beads containing GST-Bassoon and GST-Piccolo at 4°C overnight as described previously (Ohtsuka et al., 2002). After the beads were extensively washed with the lysis buffer, the bound proteins were eluted by boiling the beads in an SDS sample buffer [60 mM Tris-HCl, pH 6.7, 3% SDS, 2% (vol/vol) 2-mercaptoethanol, and 5% glycerol] for 5 min. The samples were then analyzed by immunoblotting by using the anti-Myc antibody.
ELKS RNA Interference
The following 21-mer oligonucleotide pairs were used as small interfering RNA (siRNA) against mouse ELKS: 5′-r(CAGUGUUGGAGGUGGCAGU) d(TT)-3′ and 5′-r(ACUGCCACCUCCAACACUG)d(TT)-3′ (synthesized by QIAGEN, Valencia, CA). A GFP-22 siRNA (QIAGEN) was used as a nonspecific control. The ELKS siRNA and GFP-22 siRNA were transfected into MIN6 cells by using RNAiFect (QIAGEN) according to the manufacturer's protocol. The efficiency and specificity of the siRNA targeted against ELKS were assessed by cotransfection of expression vector encoding Myc-tagged ELKS and siRNA-ELKS into HEK293 cells (Figure 13A).
Figure 13.
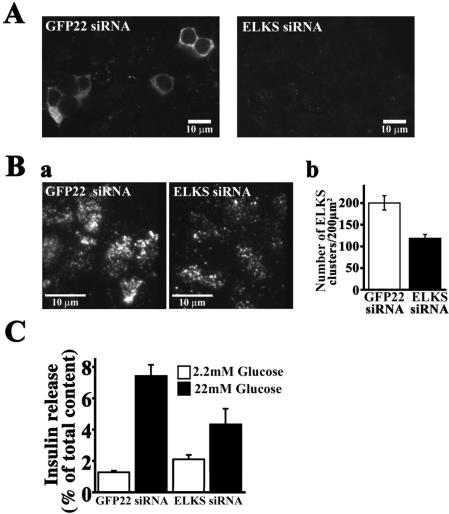
Silencing ELKS in MIN6 cells with RNAi. (A) ELKS siRNA suppressed expression of recombinant Myc-tagged ELKS in HEK293 cells. The expression vector encoding Myc-tagged ELKS and GFP-22 siRNA (as control) or ELKS siRNA were cotransfected into HEK293 cells. Two days after transfection, cells were fixed, permeabilized, and stained with anti-Myc mAb and Alexa Fluor-546–conjugated anti-mouse secondary antibody. The fluorescence image was analyzed by confocal laser scanning microscopy. Note that ELKS siRNA efficiently silenced the expression of Myc-tagged ELKS. (B) a, silencing of endogenous ELKS in MIN6 cells with siRNA caused reduction of number of ELKS clusters. GFP-22 siRNA (as control) or ELKS siRNA was transfected into MIN6 cells. At 3 d after transfection, cells were fixed, permeabilized, and stained with anti-ELKS pAb and Alexa Fluor-546–conjugated anti-rabbit secondary antibody. The fluorescence image was analyzed by TIRFM. Note that the number of ELKS clusters was markedly reduced on the plasma membrane of ELKS siRNA-transfected cells, compared with GFP-22 siRNA-transfected cells. b, number of ELKS clusters in the plasma membrane. The number of individual fluorescent spots of ELKS shown in TIRF images was counted. Data are mean ± SE for each transfected cell (n = 40 cells each). (C) Silencing of endogenous ELKS with siRNA caused a decrease of glucose-evoked insulin release from MIN6 cells. GFP-22 (control) or ELKS siRNA-transfected MIN6 cells were incubated for 15 min with basal low glucose (2.2 mM) or high glucose (22 mM). Data are mean ± SEM of eight determinations from individual wells.
Point Spread Function (PSF)
To obtain the estimation of real diameter of the clusters in the TIRF images, the PSF was determined by measuring the diameter of 90-nm fluorescent beads (Molecular Probes), which was 340 ± 27 nm (35 beads) under our experimental conditions: PSF = {(beadsmeasured diameter)2–(beadsreal diameter)2}1/2. The real diameter of the spots was calculated by subtraction of the PSF: {clusterreal size = [(clustermeasured size)2–(PSF)2]1/2} as described previously (Ohara-Imaizumi et al., 2004a).
RESULTS
ELKS Is Abundantly Present in Pancreatic Islet
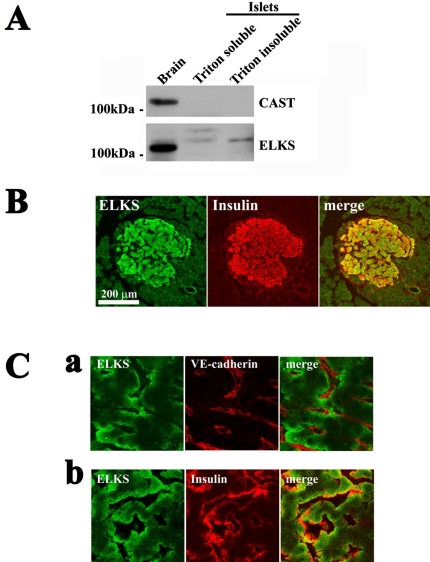
First, we studied the expression of CAST and ELKS protein in rat pancreatic islets, by using immunoblot analysis. Figure 1A shows that rat islets expressed ELKS but not CAST protein, whereas rat brain (used as positive control) expressed both CAST and ELKS proteins. The ELKS protein in islets exhibited distinct gel mobility, compared with that in the brain. It has been reported that the anti-ELKS pAb recognized a protein band of 120 kDa in rat brain and multiple protein bands of ∼130–140 kDa in other rat tissues, including the spleen, lung, liver, muscle, kidney, and testis. The data suggest that there are multiple splice variants of ELKS (i.e., ELKSα and the other ELKS isoforms) in tissues other than the brain (Yokota et al., 2000; Monier et al., 2002; Wang et al., 2002; Deguchi-Tawarada et al., 2004). Therefore, the protein bands of ∼130–140 kDa observed in islets seemed to be due to β cell-specific splice variants of ELKS.
Figure 1.
ELKS is present in pancreatic islet β cells. (A) Immunoblot analysis of the pancreatic islet lysate by using anti-CAST and anti-ELKS antibodies. Rat brain homogenate (used as positive control) and rat pancreatic islet lysate (1% Triton X-100 –soluble and –insoluble fractions) (20 μg of each protein) were analyzed by immunoblotting by using anti-CAST or anti-ELKS pAbs. Note that rat islets expressed ELKS but not CAST, whereas rat brain expressed both CAST and ELKS. (B) Colocalization of ELKS and insulin in rat pancreatic islets as determined by immunofluorescence labeling and confocal laser microscopy. Islets were immunostained for ELKS and insulin and were viewed in the green (ELKS) or the red (insulin) channel. There was significant overlap (merged [yellow]) of ELKS and insulin immunofluorescence. Magnification, 10×; bars, 200 μm. (C) Localization of ELKS, insulin, and VE-cadherin in islets by immunofluorescence labeling and confocal laser microscopy with higher magnification (100×). Islets were double stained using anti-ELKS pAb and anti-VE-cadherin mAb (a) or anti-insulin mAb (b). Bars, 20 μm.
Because ELKS is a major protein with CAST family that is expressed in pancreatic islets, we then examined the localization of ELKS in rat pancreatic islets, by immunohistochemistry by using confocal laser microscopy. As shown in Figure 1B, ELKS immunostaining was mainly observed in the pancreatic islets. Double staining for insulin and ELKS showed that the immunoreactivity of ELKS was seen in insulin-positive β cells, which indicates that ELKS is most abundant in β cells. The immunofluorescence of the other CAZ proteins, Bassoon, RIM2, and Munc13-1, also was detected in pancreatic islets, but CAST immunofluorescence was not detectable (our unpublished data), which is consistent with the results as shown in Figure 1A and those of a previous report of assessment by RT-PCR analysis (Fujimoto et al., 2002).
The confocal imaging of islets by higher magnification (100×) showed that ELKS was localized at the plasmalemmal region of rat pancreatic β cells, especially those facing blood capillaries labeled with VE-cadherin, a marker for endothelial cells (Lampugnani et al., 1992; Vasir et al., 2001) (Figure 1C, a). Interestingly, the region of insulin immunostaining was colocalized with ELKS (Figure 1C, b), although the ELKS seemed to be more widely distributed than insulin. On the other hand, the immunostaining pattern of syntaxin 1 differed from these but was seen on the entire cellular plasma membrane (our unpublished data), as described previously (Nagamatsu et al., 1996).
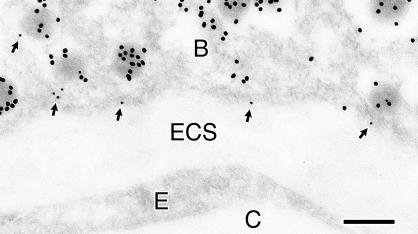
We intended to confirm that ELKS is colocalized with insulin granules by immunogold electron microscopy by using anti-ELKS pAb and anti-insulin mAb (Figure 2). Different-sized colloidal gold particles (12 and 18 nm in diameter) were used to distinguish between the localization of ELKS and insulin. At the ultrastructural level in the section of rat pancreas, the immunoreactivity of ELKS (small gold particles, 12 nm) was frequently detected close to insulin (large gold particles,18 nm)-containing granule docked on the plasma membrane facing blood capillary (arrows). Thus, the immunoelectron results support our confocal microscopy data, indicating that ELKS colocalizes with the docking sites of insulin granules, and, in particular, gathers on blood capillaries.
Figure 2.
Ultrastructural localization of ELKS in β cells. Ultrathin sections of the rat pancreas were reacted with the anti-ELKS pAb, and then with 12-nm colloidal gold-conjugated donkey anti-rabbit IgG antibody. Next, they were incubated with anti-insulin mAb and then with 18-nm colloidal gold-conjugated donkey anti-mouse IgG antibody. Note that the immunoreactivity of ELKS (small gold particles) was frequently detected close to insulin-containing granules (large gold particles) docked on the plasma membrane facing blood capillary (arrows). B, β cell; C, blood capillary; E, endothelial cell; ECS, extracellular space. Bar, 0.2 μm.
ELKS Is Unevenly Distributed in Separated Clusters in the Plasma Membrane of MIN6 β Cells
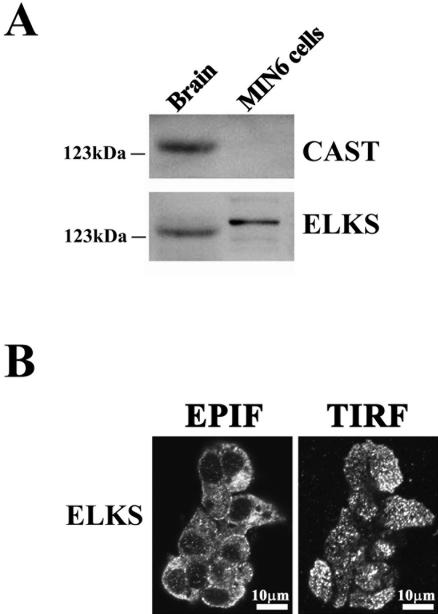
To investigate the function of ELKS, we used MIN6 β cells, in which insulin release responds to the physiological range of glucose (Miyazaki et al., 1990), and the expression pattern of the SNAREs is the same as that in primary β cells (Nagamatsu et al., 1999; Daniel et al., 1999). We examined the expression of CAST isoforms in MIN6 cells by means of immunoblotting. As shown in Figure 3A, a band of ELKS protein was detected in MIN6 cells and rat brain (used as a positive control), but a band of CAST was not detected in MIN6 cells. Distinct gel mobility (∼130–140 kDa) also was observed in MIN6 cells, as well as in islets, which may reflect the β cell-specific splice variants of ELKS, as described above. Thus, MIN6 cells predominantly expressed ELKS but not CAST, which is in agreement with the results observed in rat islets.
Figure 3.
ELKS is present in MIN6 β cells. (A) Immunoblot analysis of CAST and ELKS proteins. The homogenates of rat brain (used as a positive control) and MIN6 β cells (20 μg of each protein) were analyzed by immunoblotting by using anti-CAST or anti-ELKS pAbs. Note that MIN6 cells expressed ELKS but not CAST. (B) Immunofluorescence staining of MIN6 cells with anti-ELKS pAb observed by EPIF microscopy and TIRFM. Cells were fixed and immunostained using anti-ELKS pAb and Alexa Fluor 488-conjugated anti-rabbit secondary antibody. EPIF images were observed by inverted EPIF microscopy, and TIRF images were observed by simply shifting the mirror in the same cells. Bars, 10 μm.
To determine the subcellular localization of ELKS in MIN6 cells, the cells were fixed, immunostained with anti-ELKS pAb, and observed by both EPIF (common) microscopy and TIRFM of the same cell. Under EPIF microscopy, the immunofluorescence of ELKS was observed as dots primarily in not only the subplasmalemmal region but also the cytosol (Figure 3B, EPIF). TIRFM showed that the immunofluorescence of ELKS was unevenly and locally distributed in separate clusters in the plasma membrane (Figure 3B, TIRFM). Thus, the distribution pattern of ELKS clusters in the plasma membrane was regional and restricted.
Site of ELKS Clusters Is Mostly Consistent with Docking Sites of Insulin Granules
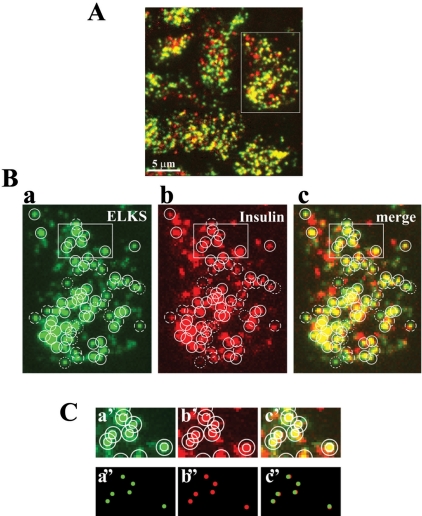
To determine the relationship between the site of docked insulin granules and that of ELKS clusters, we performed the double labeling for insulin and ELKS and observed them by TIRFM. As shown in Figure 4A, the spots for ELKS (green) were associated with areas for insulin granules, although these spots seem to be enlarged because of the fluorescence of Alexa Fluor, and the diffraction-limited resolution of the objective. To correct judgment for rating the association of ELKS clusters with insulin granules, we corrected the apparent size of TIRF image to real size by using a formula based on the PSF, which was determined by measuring the diameter of fluorescent beads, as described previously (Ohara-Imaizumi et al., 2004a) (see Materials and Methods). Indeed, the diameter of insulin granules observed in the TIRF image was 425 ± 19 nm (n = 6 cells), although the real size of insulin granules was calculated as 270 ± 30 nm, by use of a formula based on PSF, which agreed well with the value (289 nm) measured by electron microscopy of mouse pancreas (Dean, 1973). Similarly, the real diameter of the ELKS clusters was calculated as 257 ± 35 nm, on the basis of the apparent size of ELKS clusters (417 ± 21 nm, n = 6 cells). To correct the apparent sizes to real sizes based on these values, circles (400 nm in diameter) drawn around fluorescent spots for insulin granules and ELKS clusters observed in TIRF images (Figure 4B) were reduced to 68 and 64%, respectively (Figure 4C). As shown in the drawing in Figure 4C, ELKS clusters were precisely localized with insulin granules. By using these corrections, we could demonstrate that ELKS clusters were rated to be associated with granule (positive) when their signals fully overlapped. Clusters that overlapped less were rated as negative, and partially overlapping clusters were rated as neutral (Figure 4B). As shown in Figure 4B, 60.5 ± 2.2 and 24.5 ± 4.7% of all labeled ELKS clusters fully or partially corresponded to the docking sites of insulin granules, respectively, whereas 15.1 ± 4.4% of ELKS clusters did not correspond to the docking sites of insulin granules (n = 13 cells). Thus, ∼85% of ELKS clusters corresponded to sites of docked insulin granules. Although some of these clusters may have been colocalized with insulin granules, at least 60% of ELKS clusters were perfectly matched to the sites of docked insulin granules, thus indicating that ELKS is involved in physiological interaction with insulin granule on the docking site.
Figure 4.
Colocalization of ELKS clusters and insulin granules in the plasma membrane of MIN6 cells analyzed by TIRFM. (A) Cells were fixed and double immunostained using anti-ELKS pAb, anti-insulin mAb, and secondary antibodies (Alexa Fluor-488–conjugated anti-rabbit and Alexa Fluor-546–conjugated anti-mouse antibodies). The colocalization of ELKS clusters (green) and insulin granules (red) is demonstrated by the overlap (yellow) of green and red channel images. (B) Most ELKS clusters (a, green) corresponded to sites of docked insulin granules (b, red). Box in the abovementioned image indicates the region that is magnified below. Each circle (1 μm in diameter) in the green channel corresponds to the circle in the red channel. Solid circles represent the colocalization of ELKS clusters and insulin granules (positive). Dotted circles indicate observed ELKS clusters but not insulin granules (negative). Dashed circles indicate ELKS clusters with only a partially corresponding overlap (neutral). (C) Boxes in the above-mentioned images indicate regions that are magnified below. Inner circles (400 nm in diameter) were drawn around fluorescent spots in each image (a′, b′, and c′). Sizes of circles in images (a′) and (b′) were reduced to 64% (257 nm in diameter) and 68% (270 nm in diameter), respectively, to correct to the real diameters (a″ and b″), and these were transferred to identical pixel localizations (c″). Circles of ELKS clusters (green) and insulin granules (red) overlapped (rated as positive).
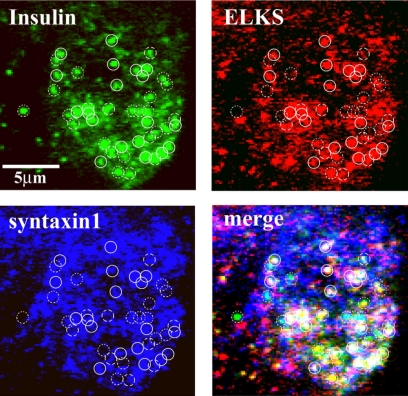
We then examined the interaction between insulin granules docking sites and ELKS and syntaxin 1 clusters, by triple immunostaining observed using TIRFM with an arc-lamp source. As shown in Figure 5, a majority of the insulin granules colocalized with either ELKS or syntaxin 1 clusters. Among them, 46.1 ± 2.9% of insulin granules (n = 12 cells) docked on the sites of ELKS clusters colocalizing with syntaxin 1.
Figure 5.
Insulin granules are preferentially docked to ELKS clusters colocalized with syntaxin 1 clusters. Cells were fixed and triple immunostained using rabbit anti-ELKS pAb, mouse anti-syntaxin 1 mAb, guinea pig anti-insulin pAb, and secondary antibodies (Alexa Fluor-546–conjugated anti-rabbit, Alexa Fluor-633–conjugated anti-mouse, and fluorescein-conjugated anti-guinea pig antibodies) and then were observed using TIRFM with an arc-lamp source. Colocalization was rated as described in Figure 4. Solid circles (1 μm in diameter) represent the insulin granules colocalized with ELKS and syntaxin 1 clusters. Dotted circles indicate observed insulin granules not colocalized with syntaxin 1 and ELKS clusters. Dashed circles indicate insulin granules with ELKS clusters or syntaxin 1 clusters.
Colocalization of ELKS and Syntaxin 1 Clusters in the Plasma Membrane
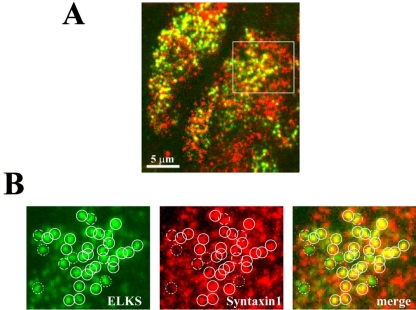
We examined the colocalization of ELKS and syntaxin 1. As shown in Figure 6A, syntaxin 1 clusters (red) were more enriched and evenly distributed on the entire plasma membrane than are ELKS clusters (green), which were less dense and unevenly distributed on the plasma membrane. The number of ELKS clusters on the plasma membrane was 115.5 ± 6.8 per 200 μm2 (n = 15 cells), whereas the number of syntaxin 1 clusters was 236.8 ± 7.2 per 200 μm2 (n = 15 cells; p < 0.001). Detailed examination of A by correction of the apparent size of the TIRF image to real size by using a formula based on PSF, revealed that the majority of ELKS clusters colocalized with the syntaxin 1 clusters (Figure 6B). Of the labeled ELKS clusters, 69.8 ± 6.8% of all labeled ELKS clusters was fully corresponded to the syntaxin 1 clusters (positive) (n = 15 cells), and 13.9 ± 2.8% of the ELKS clusters were only partially overlapped with syntaxin 1 cluster (rated as neutral). Thus, ∼84% of ELKS clusters colocalized with syntaxin1 clusters. This uneven distribution of ELKS clusters colocalized with syntaxin 1 clusters seems to indicate that the fusion site of docked insulin granules is restricted to ELKS clusters.
Figure 6.
Colocalization of ELKS and syntaxin 1 clusters in the plasma membrane. (A) Cells were fixed and double immunostained using anti-ELKS pAb, anti-syntaxin 1 mAb, and secondary antibodies (Alexa Fluor-488–conjugated anti-rabbit and Alexa Fluor-546–conjugated anti-mouse antibodies). The colocalization of ELKS clusters (green) and syntaxin 1 clusters (red) is demonstrated by the overlap (yellow) of red and green channel images. (B) A majority of ELKS clusters (green) colocalized with syntaxin 1 clusters (red). Box in the above-mentioned image indicates the region that is magnified below. Each circle (1 μm in diameter) in the green channel corresponds to the circle in the red channel. Colocalization was rated as described in Figure 4. The real diameters of ELKS and syntaxin 1 clusters were calculated as 257 ± 35 and 280 ± 37 nm on the basis of the apparent size of the ELKS and syntaxin 1 clusters (417 ± 21 and 431 ± 24 nm, respectively, n = 6 cells). Solid circles represent the colocalization of ELKS and syntaxin 1 clusters (positive). Dotted circles indicate observed ELKS clusters but not syntaxin 1 clusters (negative). Dashed circles indicate ELKS clusters with only partially corresponding overlap (neutral).
Fusion of Insulin Granules Frequently Occurred on ELKS Clusters
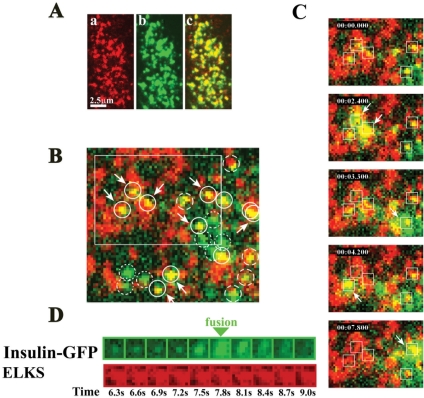
To determine whether the fusion of insulin granules occurred on the ELKS clusters, we analyzed the interaction between the docking/fusion of GFP-tagged insulin granules and ELKS clusters labeled by TAT-conjugated, Cy3-labeled mAb, by using living MIN6 cells and TIRF images. As has been demonstrated previously (Ohara-Imaizumi et al., 2004a), TAT-conjugated Cy3-labeled anti-ELKS mAb is rapidly transduced into cells (our unpublished data). We ensured that the TAT-conjugated, Cy3-labeled anti-ELKS mAb specifically found endogenous ELKS clusters in the plasma membrane. MIN6 cells treated with TAT-conjugated, Cy3 labeled mAb for 30 min were fixed and immunostained with anti-ELKS pAb. As shown in Figure 7A, there was significant overlapping of ELKS clusters labeled with TAT-conjugated, Cy3-labeled mAb (red) and those stained with pAb (green).
Figure 7.
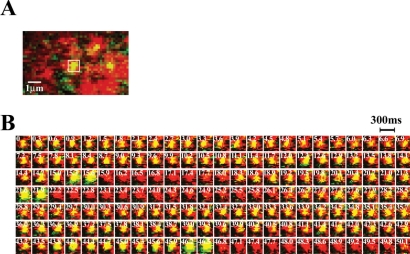
ELKS clusters are sites for docking and fusion of insulin granules in living cells. (A) TIRF image of ELKS in the plasma membrane labeled with TAT-conjugated Cy3-labeled anti-ELKS mAb and stained with anti-ELKS pAb. After MIN6 cells were treated with TAT-conjugated Cy3-labeled anti-ELKS mAb for 30 min, cells were fixed and immunostained with anti-ELKS pAb and then were observed with TIRFM. There was significant colocalization (c) between ELKS clusters labeled with TAT-conjugated, Cy3-labeled antibody (a) and those stained with pAb (b). (B) TIRF image of GFP-tagged insulin granules and Cy3-labeled ELKS clusters in living MIN6 cells and dual image analysis of GFP-tagged insulin granule motion at ELKS clusters during 50 mM KCl stimulation. Three days after MIN6 cells were transfected with the expression vector insulin-GFP (green), cells were treated with TAT-conjugated Cy3-labeled anti-ELKS antibody (red) for 50 min. Each circle (1 μm in diameter) in the green channel corresponds to the circle in the red channel. Solid circles represent the colocalization of insulin granules and ELKS clusters. Dotted circles indicate observed insulin granules, but not ELKS clusters. Dashed circles indicate insulin granules with only a partially corresponding overlap. Arrowed circles represent the insulin granules that eventually were fused by stimulation with 50 mM KCl (see the dual-colored movie in supplemental data). Box indicates the area in C. (C) Insulin granules underwent exocytosis at ELKS clusters. The box (1 × 1 μm) indicates the granule to be fused. Timestamp (minute:second:millisecond) was overlaid. Time 0 indicates the addition of KCl. (D) Sequential images (1 × 1 μm, 300-ms intervals) of a single insulin granule (green) at the ELKS cluster (red) during stimulation with 50 mM KCl.
To examine whether insulin fusion occurs on ELKS clusters, MIN6 cells were first transfected with GFP-tagged insulin expression vector and then were treated with TAT-conjugated, Cy3-labeled anti-ELKS mAb. Stimulation with high KCl (50 mM) showed that the fusion events of insulin granules occurred frequently at the ELKS clusters; 67.3 ± 6.7 and 16.2 ± 5.5% of all fusion events fully or partially occurred on the ELKS clusters, respectively, whereas 16.5 ± 3.6% of the fusion events occurred on sites other than ELKS clusters (n = 4 cells) (Figure 7B, granules to be fused are indicated by arrows; also see Figure 7C and Supplemented Movie 1). Thus, the data indicate that fusion frequently occurs on ELKS clusters. On the other hand, because the distribution of ELKS clusters and insulin granules is widespread, the occurrence of insulin fusion on ELKS clusters may be accidental. To address this issue, we examined three other regions that were randomly chosen. The data demonstrated that, on region 1, 62.8 ± 8.3 and 18.5 ± 4.8% of all fusion events fully or partially occurred on ELKS clusters, respectively (n = 4 cells); and on region 2, 59.8 ± 7.5 and 16.9 ± 4.9% of all fusion events fully or partially occurred on ELKS clusters, respectively (n = 4 cells); on region 3, 60.2 ± 7.5 and 15.8 ± 7.4% of the all fusion events fully or partially occurred on ELKS clusters, respectively (n = 4 cells). Thus, for all regions, we obtained the same numbers, strongly indicating that the occurrence of insulin fusion on ELKS clusters is not accidental.
Figure 7D shows sequential images (1 × 1 μm, 300-ms intervals) of a single granule (green) and an ELKS cluster (red) simultaneously observed during KCl stimulation and demonstrates that GFP-tagged insulin was diffused laterally through fusion on the plasma membrane, whereas no changes were observed in the ELKS clusters (also see Supplemental Movie 1). Because the number of fusion events in the cells transduced with TAT-conjugated mAb was similar to that in control cells, labeling endogenous ELKS with TAT-conjugated, Cy3-labeled mAb did not affect insulin exocytosis (our unpublished data).
Interestingly, we observed repeated fusion from insulin granules at the same sites on ELKS cluster (Figure 8A). In MIN6 cells, most fusion events (90% of the total fused granules) evoked by KCl stimulation occurred from previously docked granules, with ∼10% of the fusion occurring from newly recruited granules (Ohara-Imaizumi et al., 2002b), and the fusion events of newly recruited granules also mostly occurred on the ELKS clusters (63.1 ± 5.2 and 19.4 ± 2.9% of all fusion events fully or partially occurred on sites at the ELKS clusters, respectively, whereas 17.4 ± 3.9% of the fusion events did not occur on the ELKS clusters; n = 10 cells). The present data revealed that some of the fusion events from newly recruited granules occurred repeatedly on the same ELKS cluster (Figure 8B).
Figure 8.
Repeated fusion from insulin granules on the same site of ELKS cluster. (A) Dual imaging of GFP-tagged insulin granules and Cy3-labeleld ELKS clusters in living MIN6 cells. The box indicates the granule to be fused repeatedly. (B) Sequential images analysis boxed in A (1 × 1 μm, 300-ms intervals) of repeated fusion from GFP-tagged insulin granules (green) at the same Cy3-labeled ELKS cluster (red), during 50 mM KCl stimulation. Time 0 indicates the addition of KCl. The time of each frame in the sequence is indicated in seconds.
Association of ELKS Interacting with Bassoon with the Docking and Fusion of Insulin Granules
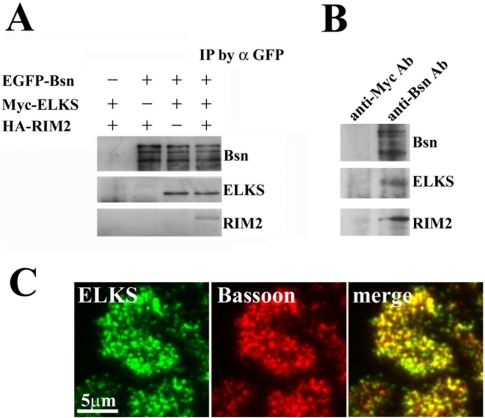
Finally, we investigated whether ELKS is implicated in regulating the docking and fusion of insulin granules. We had previously found that the immunostaining of ELKS overlapped that of Bassoon in hippocampal neurons (Deguchi-Tawarada et al., 2004). Indeed, in vitro binding studies demonstrated that ELKS binds Bassoon and RIM2 (Figure 9A). As shown in Figure 9A, when cell lysates expressing Myc-ELKS and EGFP-Bassoon and HA-RIM2 were immunoprecipitated with anti-GFP antibody, ELKS was coimmunoprecipitated in the presence or absence of RIM2, whereas RIM2 was coimmunoprecipitated only in the presence of ELKS. These results demonstrate that ELKS forms a ternary complex with Bassoon and RIM2, thus indicating that ELKS function is associated with these CAZ-related molecules. Indeed, in MIN6 cells, when Bassoon was immunoprecipitated by its antibody, ELKS and RIM2 were coimmunoprecipitated with Bassoon, indicating that ELKS forms a ternary complex with Bassoon and RIM2 (Figure 9B). In addition, TIRF imaging of dual immunostaining for ELKS and Bassoon clearly showed that most ELKS clusters were colocalized with Bassoon in the plasma membrane (Figure 9C).
Figure 9.
Interaction with ELKS and Bassoon. (A) In vitro binding studies of ternary complex formation of ELKS, Bassoon, and RIM2. Each expression plasmid of Myc-ELKS, HA-RIM2, or EGFP-Bassoon was transfected into HEK293 cells. Each protein was extracted and mixed, in the indicated combinations, followed by immunoprecipitation by using anti-GFP antibody (α GFP). Immunoprecipitates were then analyzed by immunoblotting by using the anti-GFP, anti-Myc, and anti-HA antibodies. IP, immunoprecipitation. (B) Coimmunoprecipitation assay in MIN6 cells. MIN6 cell lysates were immunoprecipitated with anti-Bassoon mAb or anti-Myc mAb (as a control). The immunoprecipitates were subjected to immunoblot analysis with anti-Bassoon mAb, anti-ELKS pAb, and anti-RIM2 pAb. Note that when Bassoon was immunoprecipitated by its antibody, ELKS and RIM2 were coimmunoprecipitated with Bassoon. (C) Colocalization of ELKS and Bassoon in the plasma membrane of MIN6 cells analyzed by TIRFM. Cells were fixed and double immunostained using anti-ELKS pAb and anti-Bassoon mAb, followed by secondary antibodies (Alexa Fluor-488–conjugated anti-rabbit and Alexa Fluor 546-conjugated antimouse antibodies). The colocalization of ELKS clusters (green) and Bassoon clusters (red) is demonstrated by the overlap (yellow) of green and red channel images.
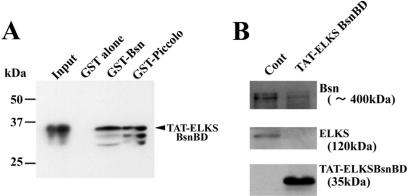
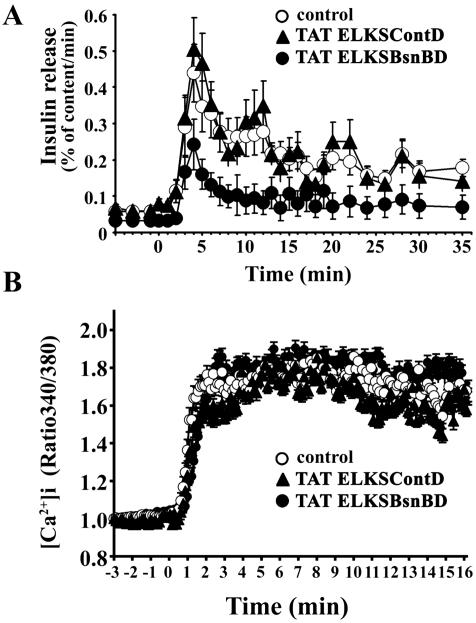
We, therefore, analyzed insulin granule docking and fusion when the action of ELKS was inhibited by the transduction of the ELKS Bassoon-binding domain peptide. We produced both a Bassoon-binding domain of ELKS (aa 405–602) fused to a TAT peptide (TAT-ELKSBsnBD) and a noncoiled-coil domain of ELKS (aa 324–403) fused to a TAT peptide, as the control (TAT-ELKSContD), and then transduced either ELKSBsnBD or ELKSContD into MIN6 cells by means of the TAT system, as described previously (Ohara-Imaizumi et al., 2002a). We first examined, by pull-down assay, whether TAT-ELKSBsnBD binds Bassoon. As shown in Figure 10A, TAT-ELKSBsnBD binds GST-Bassoon but does not bind GST alone. The TAT-ELKSBsnBD also binds GST-Piccolo, which is structurally related to Bassoon and binds the Bassoon binding region of CAST (Takao-Rikitsu et al., 2004). Next, to examine the effects of TAT-ELKSBsnBD on the binding of ELKS and Bassoon, we performed an immunoprecipitation assay for Myc-ELKS and EGFP-Bassoon in the presence or absence of TAT-ELKSBsnBD. As shown in Figure 10B, TAT-ELKSBsnBD inhibited the binding of Bassoon to ELKS, indicating that TAT-ELKSBsnBD can disrupt the formation of the ELKS and Bassoon complex.
Figure 10.
TAT-ELKSBsnBD binds Bassoon (A) and inhibits the binding of ELKS and Bassoon. (A) Direct binding of TAT-ELKSBsnBD to Bassoon by pull-down assay. The GST fusion proteins containing Bassoon and Piccolo as well as GST alone were immobilized to glutathione-Sepharose beads. Myc-tagged TAT-ELKSBsnBD was then incubated with the beads. Proteins that bound to the beads were analyzed by immunoblotting by using anti-Myc mAb. Arrowheads indicate TAT-ELKSBsnBD. Note that TAT-ELKSBsnBD found GST-Bassoon and GST-Piccolo, but it did not bind GST alone. (B) Effects of TAT-ELKSBsnBD on the binding of ELKS and Bassoon. Immunoprecipitation assay of Myc-ELKS and EGFP-Bassoon was performed in the presence or absence of Myc-tagged TAT-ELKSBsnBD by using anti-GFP antibody, followed by immunoblotting by using the anti-Myc and anti-GFP antibodies. Note that the binding of ELKS and Bassoon was inhibited in the presence of TAT-ELKSBsnBD.
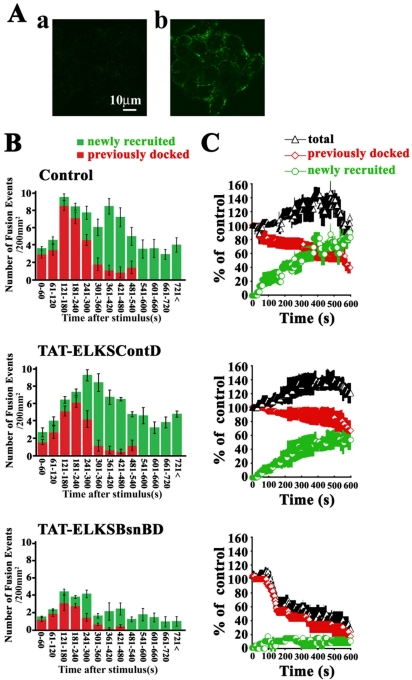
We then monitored the docking and fusion process of GFP-tagged insulin granules in TAT-ELKSBsnBD–treated MIN6 cells stimulated by 22 mM glucose. TAT-ELKSBsnBD was quickly delivered into the MIN6 cells in <30 min (Figure 11A). As shown in the histogram of the number of fusion events per minute (Figure 11B, control), the fusing granules originated mostly from previously docked granules (Figure 11B, red column) during the first phase of glucose-stimulated insulin release (0–4 min), whereas during the second phase (>4 min) those fusion granules arose mostly from newly recruited granules (Figure 11B, green column), as described previously (Ohara-Imaizumi et al., 2002a,b). TAT-ELKSBsnBD treatment not only reduced the fusion events during the first phase of release but also strongly inhibited the second phase of release, whereas TAT-ELKSContD treatment had no effect on either phase, indicating that the effect of TAT-ELKSBsnBD is specific. During the first phase, TAT-ELKSBsnBD treatment reduced the total number of fusion events, which mostly arose from previously docked granules, to ∼59% that of control levels (20.4 ± 1.0 in TAT-ELKSContD–treated cells vs. 12.1 ± 0.4 in TAT-ELKSBsnBD–treated cells, n = 10, p < 0.005). In contrast, fusion events in the second phase of insulin release mostly occurred from newly recruited docked granules and were markedly inhibited (to ∼32% of control levels) by TAT-ELKSBsnBD treatment (52.2 ± 2.0 in TAT-ELKSContD–treated cells vs. 16.7 ± 1.6 in TAT-ELKSBsnBD–treated cells, n = 10, p < 0.0005). These results were consistent with the data for endogenous insulin release from perifused cells treated with TAT-ELKSBsnBD (Figure 12A). The dynamic changes in the total number of docked granules during glucose stimulation in TAT-ELKSBsnBD–treated cells showed that the total number of docked granules during the time course decreased because the number of newly recruited granules to eventually dock to the plasma membrane did not increase (Figure 11C). On the other hand, as was observed in TAT-ELKSContD–treated cells, TAT-ELKSBsnBD did not alter the glucose-induced change in intracellular Ca2+ concentration [Ca2+]i measured by loading cells with Fura-2 AM (Figure 12B). These findings suggest that ELKS together with Bassoon is involved in the docking and fusion of insulin granules.
Figure 11.
TAT-ELKSBsnBD inhibits both phases of insulin release. (A) Transduction of TAT-ELKSBsnBD into MIN6 cells. Control cells (a) and Myc-tagged TAT-ELKSBsnBD-treated (70 μg/ml for 50 min) cells (b) were fixed, immunostained for Myc, and deserved by confocal laser-scanning microscopy. (B) Analysis of fusion events of GFP-tagged insulin granules in control, TAT-ELKSContD-treated, and TAT-ELKSBsnBD–treated MIN6 cells by high-glucose (22 mM) stimulation with TIRFM. MIN6 cells expressing GFP-tagged insulin were treated with and/or without 70 μg/ml TAT fusion protein for 50 min, and TIRF images were acquired every 300 ms by 22 mM glucose stimulation. The fusion events (200 μm2) were manually counted as described in Materials and Methods. The histogram shows the number of fusion events (n = 6 cells) at 1-min intervals after high glucose (22 mM) stimulation in control and the TAT fusion protein-treated cells. The histogram is divided into two categories: fusion from previously docked granules (red column) and newly recruited docked granules (green column). Data are mean ± SEM. (C) Time-dependent change of the number of insulin granules docked to the plasma membrane. The number of previously docked granules (red line) and the number of newly recruited granules (green line) during 22 mM glucose stimulation were determined by counting granules on each sequential image (200 μm2,n = 3 cells each) in control and in TAT fusion protein-treated cells. Black line shows the total number of docked granules and corresponds to the sum of the red and green lines. Time 0 indicates the addition of high glucose (22 mM). The number of previously docked granules at time 0 was taken as 100% (46, 55, and 65 granules, respectively, in each of the control cells; 49, 59, and 57 granules, respectively, in each of the TAT-ELKSContD-treated cells; 52, 57, and 68 granules, respectively, in each of the TAT-ELKSBsnBD-treated cells). Data are mean ± SEM.
Figure 12.
Effects of TAT-ELKSBsnBD on insulin release and on [Ca2+]i response to high glucose in MIN6 cells. (A) Insulin release from perifused control and the TAT fusion protein-treated (70 μg/ml for 50 min) cells stimulated with 22 mM glucose. The cells in the cell chamber (∼106 cells per chamber) were perifused with KRB (0.5 ml/min) at 37°C, and the perfusate was analyzed for IRI by radioimmunoassay. Results are given as a percentage of the cellular insulin content (2.9 μg/106 cells in control cells, 3.1 μg/106 cells in TAT-ELKSContD-treated cells, and 2.8 μg/106 cells in TAT-ELKSBsnBD–treated cells). (B) Glucose-induced changes in [Ca2+]i in control and the TAT fusion protein-treated (70 μg/ml for 50 min) cells. Glucose-induced changes in [Ca2+]i were measured in each treated cells by Fura-2 AM (5 μM). Time 0 indicates the time of the addition of high glucose. The fluorescence ratio (340/360) at time 0 was taken as 1.
Silencing of ELKS with Specific siRNA Attenuates Glucose-evoked Insulin Release from MIN6 β Cells
We further examined whether ELKS clusters are required for insulin exocytosis by silencing ELKS with siRNA technology. One of the double-stranded RNA oligos was designed according to the mouse ELKS cDNA sequence (ELKS siRNA) and delivered to the MIN6 cells by transient transfection, as described in Materials and Methods. First, we studied how ELKS siRNA works by using HEK293 cells. As shown in Figure 13A, the ELKS silencer strongly suppressed expression of recombinant Myc-tagged ELKS when the expression vector encoding Myc-tagged ELKS (full length, aa 1–948) and ELKS siRNA were cotransfected into HEK293 cells. The GFP-22 siRNA, used as noninterfering control, had no effect on ELKS expression. Thus, our designed ELKS siRNA was found to be effective for inhibiting ELKS RNA expression. Then, ELKS siRNA was transfected into MIN6 cells, and the number of ELKS clusters observed by TIRFM was markedly reduced, to ∼60%, on the plasma membrane of the cells, compared with GFP-22 siRNA-transfected control cells. We then investigated the effect of glucose-stimulated insulin release from MIN6 cells, in which ELKS RNA expression is inhibited. The silencing of ELKS did not affect the basal release (2.2 mM glucose), but it resulted in a decrease in glucose (22 mM)-evoked insulin release, to ∼58% of the release from GFP-22–transfected control cells (Figure 13C), indicating that ELKS is involved in regulated insulin release.
DISCUSSION
CAST is a novel CAZ protein (Ohtsuka et al., 2002) that is associated with the active zone of neurons. CAST, also known as ERC2 (Wang et al., 2002), which is mainly expressed in the brain, may serve as a key component of the CAZ structure through binding with other CAZ proteins such as Bassoon, RIM1, and Munc13-1 (Takao-Rikitsu et al., 2004). ELKS, which is highly homologous to CAST, corresponds to Rab6-interacting protein 2 (Monier et al., 2002), ERC1 (Wang et al., 2002), and CAST2 (Deguchi-Tawarada et al., 2004) and is distributed in several tissues. ELKS has been identified as a gene fused to RET tyrosine kinase in thyroid carcinomas (Nakata et al., 1999; Nakata et al., 2002) and may serve a regulatory function in the nuclear factor-κB activation (Ducut Sigala et al., 2004); Rab6-interacting protein 2 was identified as a Rab6 small G protein-interacting protein and is likely to function in endosomes of the Golgi transport in several tissues (Janoueix-Lerosey et al.,1995; Monier et al., 2002). Of note, ELKS was recently identified as a component of the CAZ structure in the brain that binds RIMs (Wang et al., 2002; Deguchi-Tawarada et al., 2004). In pancreatic β cells, the presence of an active zone for insulin exocytosis has not been found although the expression of CAZ-related proteins was reported recently (Fujimoto et al., 2002). Detailed examinations of the functional roles of these proteins in insulin exocytosis are still needed, and active zones in pancreatic β cells are very attractive focus of study. In the present study, we explored the localization and function of ELKS in pancreatic β cells, and the data obtained indicate that ELKS functions in insulin exocytosis.
Immunohistochemical studies, including immunoelectron microscopic analysis, clearly revealed that ELKS was colocalized with insulin granules at the plasma membrane of β cells facing blood capillaries. Interestingly, insulin immunostaining was observed to be denser on the capillary side (Figure 1). In contrast, the immunostaining pattern of t-SNAREs (syntaxin 1 and SNAP-25), which are part of the exocytotic machinery (Daniel et al., 1999; Nagamatsu et al., 1999), was uniform (Sadoul et al., 1995; Nagamatsu et al., 1996). Thus, it is possible that ELKS may have a specialized role in leading the insulin granules to the capillary side. Indeed, Orci et al. (1987) reported that insulin may be released into capillaries. Thus, ELKS may have a potential role in the translocation of insulin granules to a specialized exocytotic site, such as a hot spot, observed in neuron. To correctly address this issue, observation of insulin exocytosis from islets in situ may be the best method: however, technical difficulties prevented us from using the method in the study. Nevertheless, in the present study, use of TIRFM and immunoelectron microscopy supported the idea that ELKS may have a role in forming active zone-like regions in β cells.
To study this subject in more detail, we used insulin-producing clonal cells, MIN6 cells. The data showed a regional distribution of ELKS in the plasma membrane, compared with syntaxin 1, which was uniformly distributed on the entire plasma membrane. Of note, 80% of all ELKS clusters were colocalized with insulin granules, despite the patchy distribution of ELKS in the plasma membrane, and fusion occurred on ELKS clusters, which indicates that insulin granules selectively docked to the sites of ELKS clusters. Thus, it seems that ELKS defines the fusion site of insulin granules. In addition, we previously reported that fusion from insulin granules occurred on syntaxin 1 clusters (Ohara-Imaizumi et al., 2004a); thus, we examined the triple colocalization of ELKS, syntaxin 1, and insulin granules. We observed that ∼50% of insulin granules were present on the ELKS sites colocalizing with syntaxin 1 clusters. Thus, fusion was assumed to occur on these sites, which indicated that ELKS contributes to defining the fusion site. Judging from the correct definition of the active zone in neurons, which is characterized by the presence of an electron-dense matrix of cytoskeletal filaments beneath the plasma membrane where it is associated with synaptic vesicles (Landis et al., 1988; Hirokawa et al., 1989; Burns and Augustine, 1995), it is difficult to conclude that β cells have such an active zone. Nonetheless, the evidence that 1) ELKS is dense in the plasma membrane facing blood capillaries and that 2) fusion from insulin granules repeatedly occurs on ELKS clusters suggests the existence of an active zone in β cells. Of course, more experiments will be required to confirm our hypothesis.
Does ELKS function in insulin exocytosis? By using a TAT fusion protein, we examined whether ELKS and its interacting molecules function in the insulin exocytosis process. ELKS directly binds Bassoon and RIM2 (Figure 9A), which indicates that the function of ELKS is associated with these CAZ proteins, although the functional role of bassoon in pancreatic β cells is not known. It has been reported that CAST binds to Bassoon through the central region (second coiled-coil domain) of CAST. The microinjected Bassoon binding domain of CAST impairs synaptic transmission in cultured superior cervical ganglion neurons, which suggests that CAST regulates transmitter release in cooperation with Bassoon at the CAZ (Takao-Rikitsu et al., 2004). By reference to these experiments, we speculated that ELKS may function in association with CAZ protein in insulin exocytosis; therefore, we introduced the Bassoon-binding domain of ELKS fused to TAT (TAT-ELKSBsnBD) into MIN6 cells. In TAT-ELKSBsnBD-treated cells, fusions from the previously and newly docked granules were inhibited in both the first and second phases of insulin exocytosis, in which we also observed a marked reduction in the accumulation of newly docked granules. So far, there have been no reports showing that ELKS and Bassoon are associated with syntaxin 1 and SNAP25, so that, at present, we cannot determine how CAZ proteins directly interact with SNARE proteins: nevertheless, our results suggest that ELKS, through binding to Bassoon, regulates both the docking and fusion steps in insulin exocytosis. Finally, to directly address the question of whether ELKS functions in insulin exocytosis, we performed siRNA-based experiments. The attenuation of ELKS expression by RNA interference decreased the number of ELKS clusters in the plasma membrane and reduced glucose-evoked insulin release from clonal β cells (Figure 13). Although these data are not shown, these cells showed the reduced number of docked granules. Together, our data strongly indicate that CAZ-related protein play an important role in the docking/fusion of insulin granules and may form an active zone-like region in pancreatic β cells.
In conclusion, ELKS is a possible candidate for definition of the fusion site of insulin exocytosis, and it regulates docking and fusion of insulin granules.
Supplementary Material
Acknowledgments
This work was supported by Grants-in-Aid for Scientific Research (C) 17590277 (to M.O.-I.), (B) 15390108 (to S. N.), Scientific Research on Priority Areas 16044240 (to M.O.-I.), and Exploratory Research 14657043 (to S. N.) from the Japanese Ministry of Education; Culture, Sports, Science and Technology and by a grant from Japan Private School Promotion Foundation (to S. N.).
This article was published online ahead of print in MBC in Press (http://www.molbiolcell.org/cgi/doi/10.1091/mbc.E04–09–0816) on May 11, 2005.
Abbreviations used: BSA, bovine serum albumin; CAZ, cytomatrix at the active zone; CCD, charge-coupled device; EPIF, epifluorescence; GFP, green fluorescent protein; KRB, Krebs-Ringer buffer; mAb, monoclonal antibody; pAb, polyclonal antibody; PBS, phosphate-buffered saline; PSF, point spread function; PTD, protein transduction domain; SNAP-25, synaptosomal associated protein of 25 kDa; TIRFM, total internal reflection fluorescence microscopy; t-SNARE, target-soluble N-ethylmaleimide–sensitive factor attachment protein receptor.
The online version of this article contains supplemental material at MBC Online (http://www.molbiolcell.org).
References
- Akimoto, Y., Kreppel, L. K., Hirano, H., and Hart, G. W. (1999). Localization of the O-linked N-acetylglucosamine transferase in rat pancreas. Diabetes 48, 2407–2413. [DOI] [PubMed] [Google Scholar]
- Altrock, W. D., et al. (2003). Functional inactivation of a fraction of excitatory synapses in mice deficient for the active zone protein bassoon. Neuron 37, 787–800. [DOI] [PubMed] [Google Scholar]
- Betz, A., Thakur, P., Junge, H. J., Ashery, U., Rhee, J. S., Scheuss, V., Rosenmund, C., Rettig, J., and Brose, N. (2001). Functional interaction of the active zone proteins Munc13–1 and RIM1 in synaptic vesicle priming. Neuron 30, 183–196. [DOI] [PubMed] [Google Scholar]
- Brose, N., Rosenmond, C., and Rettig, J. (2000). Regulation of transmitter release by Unc-13 and its homologues. Curr. Opin. Neurobiol. 10, 303–311. [DOI] [PubMed] [Google Scholar]
- Burns, M. E., and Augustine., G. J. (1995). Synaptic structure and function: dynamic organization yields architectural precision. Cell 83, 187–194. [DOI] [PubMed] [Google Scholar]
- Castillo, P. E., Schoch, S., Schmitz, F., Sudhof, T. C., and Malenka, R. C. (2002). RIM1alpha is required for presynaptic long-term potentiation. Nature 415, 327–330. [DOI] [PubMed] [Google Scholar]
- Daniel, S., Noda, M., Straub, S. G., and Sharp, G.W.G. (1999). Identification of the docked granule pool responsible for the first phase of glucose-stimulated insulin secretion. Diabetes 48, 1686–1690. [DOI] [PubMed] [Google Scholar]
- Dean, P. M. (1973). Ultrastructural morphometry of the pancreatic-cell. Diabetologia 9, 115–119. [DOI] [PubMed] [Google Scholar]
- Deguchi-Tawarada, M., Inoue, E., Takao-Rikitsu, E., Inoue, M., Ohtsuka, T., and Takai, Y. (2004). CAST 2, identification and characterization of a protein structurally related to the presynaptic cytomatrix protein CAST. Genes Cells 9, 15–23. [DOI] [PubMed] [Google Scholar]
- Dick, O., tom Dieck, S., Altrock, W. D., Ammermüller, J., Weiler, R., Garner, C. C., Gundelfinger, E. D., and Brandstätter. J. H. (2003). The presynaptic active zone protein Bassoon is essential for photoreceptor ribbon synapse formation in the retina. Neuron 37, 775–786. [DOI] [PubMed] [Google Scholar]
- Ducut Sigala, J. L., Bottero, V., Young, D. B., Shevchenko, A., Mercurio, F., and Verma, I. M. (2004). Activation of transcription factor NF-kappaB requires ELKS, an IkappaB kinase regulatory subunit. Science 304, 1963–1967. [DOI] [PubMed] [Google Scholar]
- Fujimoto, K., Shibasaki, T., Yokoi, N., Kashima, Y., Matsumoto, M., Sasaki, T., Tajima, N., Iwanaga, T., and Seino, S. (2002). Piccolo, a Ca2+ sensor in pancreatic β-cells. J. Biol. Chem. 277, 50497–50502. [DOI] [PubMed] [Google Scholar]
- Garcia, E. P., McPherson, P. S., Chilcote, T. J., Takei, K., and De Camilli, P. (1995). rbSec1A and B colocalize with syntaxin 1 and SNAP-25 throughout the axon, but are not in a stable complex with syntaxin. J. Cell Biol. 129, 105–120. [DOI] [PMC free article] [PubMed] [Google Scholar]
- Garner, C. C., Kindler, S., and Gundelfinger, E. D. (2000). Molecular determinants of presynaptic active zones. Curr. Opin. Neurobiol. 10, 321–327. [DOI] [PubMed] [Google Scholar]
- Gundelfinger, E. D., Kessel, M. M., and Qualmann, B. (2003). Temporal and spatial coordination of exocytosis and endocytosis. Nat. Rev. Mol. Cell Biol. 4, 127–139. [DOI] [PubMed] [Google Scholar]
- Hirokawa, N., Sobue, K., Kanda, K., Harada, A., and Yorifuji. H. (1989). The cytoskeletal architecture of the presynaptic terminal and molecular structure of synapsin 1. J. Cell Biol. 108, 111–126. [DOI] [PMC free article] [PubMed] [Google Scholar]
- Janoueix-Lerosey, I., Jollivet, F., Camonis, J., Marche, P. N., and Goud, B. (1995). Two-hybrid system screen with the small GTP-binding protein Rab6. Identification of a novel mouse GDP dissociation inhibitor isoform and two other potential partners of Rab6. J. Biol. Chem. 270, 14801–14808. [DOI] [PubMed] [Google Scholar]
- Lampugnani, M. G., Resnati, M., Raiteri, M., Pigott, R., Pisacane, A., Houen, G., Ruco, L. P., and Dejana, E. (1992). A novel endothelial-specific membrane protein is a marker of Cell-Cell contacts. J. Cell Biol. 118, 1511–1522. [DOI] [PMC free article] [PubMed] [Google Scholar]
- Landis, D.M.D., Hall, A. K., Weinstein, L. A., and Reese, T. S. (1988). The organization of cytoplasm at the presynaptic active zone of a central nervous system synapse. Neuron 1, 201–209. [DOI] [PubMed] [Google Scholar]
- Martin, T. F. (2002). Prime movers of synaptic vesicle exocytosis. Neuron 34, 9–12. [DOI] [PubMed] [Google Scholar]
- Miyazaki, J., Araki, K., Yamato, E., Ikegami, H., Asano, T., Shibasaki, Y., Oka, Y., and Yamamura, K. (1990). Establishment of a pancreatic beta cell line that retains glucose-inducible insulin secretion: special reference to expression of glucose transporter isoforms. Endocrinology 127, 126–132. [DOI] [PubMed] [Google Scholar]
- Monier, S., Jollivet, F., Janoueix-Lerosey, I., Johannes, L., and Goud, B. (2002). Characterization of novel Rab6-interacting proteins involved in endosome-to-TGN transport. Traffic 3, 289–297. [DOI] [PubMed] [Google Scholar]
- Nakata, T., Kitamura, Y., Shimizu, K., Tanaka, S., Fujimori, M., Yokoyama, S., Ito, K., and Emi, M. (1999). Fusion of a novel gene, ELKS, to RET due to translocation t(10;12)(q11;p13) in a papillary thyroid carcinoma. Genes Chromosomes Cancer 25, 97–103. [DOI] [PubMed] [Google Scholar]
- Nakata, T., Yokota, T., Emi, M., and Minami, S. (2002). Differential expression of multiple isoforms of the ELKS mRNAs involved in a papillary thyroid carcinoma. Genes Chromosomes Cancer 355, 30–37. [DOI] [PubMed] [Google Scholar]
- Nagamatsu, S., Fujiwara, T., Nakamichi, Y., Watanabe, T., Katahira, H., Sawa, H., and Akagawa, K. (1996). Expression and functional role of syntax in 1/HPC-1 in pancreatic beta cells. Syntaxin 1A, but not 1B, plays a negative role in regulatory insulin release pathway. J. Biol. Chem. 271, 1160–1165. [DOI] [PubMed] [Google Scholar]
- Nagamatsu, S., Watanabe, T., Nakamichi, Y., Yamamura, C., Tsuzuki, K., and Matsushima, S. (1999). Alpha-soluble N-ethlmaleimide-sensitive factor attachment protein is expressed in pancreatic beta cells and functions in insulin but not gamma-aminobutyric acid secretion. J. Biol. Chem. 274, 8053–8060. [DOI] [PubMed] [Google Scholar]
- Ohara-Imaizumi, M., Nakamichi, Y., Nishiwaki, C., and Nagamatsu, S. (2002a). Transduction of MIN6 beta cells with TAT-syntaxin SNARE motif inhibits insulin exocytosis in biphasic insulin release in a distinct mechanism analyzed by evanescent wave microscopy. J. Biol. Chem. 277, 50805–50811. [DOI] [PubMed] [Google Scholar]
- Ohara-Imaizumi, M., Nakamichi, Y., Tanaka, T., Ishida, H., and Nagamatsu, S. (2002b). Imaging exocytosis of single insulin secretory granules with evanescent wave microscopy: distinct behavior of granule motion in biphasic insulin release. J. Biol. Chem. 277, 3805–3808. [DOI] [PubMed] [Google Scholar]
- Ohara-Imaizumi, M., Nishiwaki, C., Kikuta, T., Kumakura, K., Nakamichi, Y., and Nagamatsu, S. (2004a). Site of docking and fusion of insulin secretory granules in live MIN6 beta cells analyzed by TAT-conjugated anti-syntaxin 1 antibody and total internal reflection fluorescence microscopy. J. Biol. Chem. 279, 8403–8408. [DOI] [PubMed] [Google Scholar]
- Ohara-Imaizumi, M., Nishiwaki, C., Kikuta, T., Nagai, S., Nakamichi, Y., and Nagamatsu, S. (2004b). TIRF imaging of docking and fusion of single insulin granule motion in primary rat pancreatic beta-cells: different behaviour of granule motion between normal and Goto-Kakizaki diabetic rat beta-cells. Biochem. J. 381, 13–18. [DOI] [PMC free article] [PubMed] [Google Scholar]
- Ohtsuka, T., et al. (2002). Cast: a novel protein of the cytomatrix at the active zone of synapses that forms a ternary complex with RIM1 and Munc13-1. J. Cell Biol. 158, 577–590. [DOI] [PMC free article] [PubMed] [Google Scholar]
- Orci, L., Mariella, R., and Richard, G.W.A. (1987). The condensing vacuole cells is more acidic than the mature secretory vesicle. Nature 326, 77–79. [DOI] [PubMed] [Google Scholar]
- Rizo, J., and Südhof, T. C. (2002). Snares and Munc18 in synaptic vesicle fusion. Nat. Rev. Neurosci. 8, 641–653. [DOI] [PubMed] [Google Scholar]
- Rosenmund, C., and Sigler, A., Augustin, I., Reim, K., Brose, N., and Rhee, J. S. (2002). Differential control of vesicle priming and short-term plasticity by Munc13 isoforms. Neuron 33, 411–424. [DOI] [PubMed] [Google Scholar]
- Rosenmund, C., Rettig, J., and Brose, N. (2003). Molecular mechanisms of active zone function. Curr. Opin. Neurobiol. 1, 509–519. [DOI] [PubMed] [Google Scholar]
- Sadoul, K., Lang, J., Montecucco, C., Weller, U., Regazzi, R., Catsicas, S., Wollheim, C. B., and Halban, P. A. (1995). SNAP-25 is expressed in islets of Langerhans and is involved in insulin release. J. Cell Biol. 128, 1019–1028. [DOI] [PMC free article] [PubMed] [Google Scholar]
- Schoch, S., Castillo, P. E., Jo, T., Mukherjee, K., Geppert, M., Wang, Y., Schmitz, F., Malenka, R. C., and Südhof, T. C. (2002). RIM1α forms a protein scaffold for regulating neurotransmitter release at the active zone. Nature 415, 321–326. [DOI] [PubMed] [Google Scholar]
- Takao-Rikitsu, E., Mochida, S., Inoue, E., Deguchi-Tawarada, M., Inoue, M., Ohtsuka, T., and Takai, Y. (2004). Physical and functional interaction of the active zone proteins, CAST, RIM1, and Bassoon, in neurotransmitter release. J. Cell Biol. 164, 301–311. [DOI] [PMC free article] [PubMed] [Google Scholar]
- tom Dieck, S., et al. (1998). Bassoon, a novel zinc-finger CAG/glutamine-repeat protein selectively localized at the active zone of presynaptic nerve terminals. J. Cell Biol. 142, 499–509. [DOI] [PMC free article] [PubMed] [Google Scholar]
- Vasir, B., Jonas, J. C., Stell, G. M., Hollister-Lock, J., Hasenkamp, W., Sharma, A., Bonner-Weir, S., and Weir, G. C. (2001). Gene expression of VEGF and its receptors Flk-1/KDR and Flt-1 in cultured and transplanted rat islets. Transplantation 71, 924–935. [DOI] [PubMed] [Google Scholar]
- Wang, X., Kibschull, M., Laue, M. M., Lichte, B., Petrasch-Parwez, E., and Kilimann, M. W. (1999). Aczonin, a 550-kD putative scaffolding protein of presynaptic active zones, shares homology regions with Rim and Bassoon and binds profilin. J. Cell Biol. 147, 151–162. [DOI] [PMC free article] [PubMed] [Google Scholar]
- Wang, Y., Okamoto, M.,. Schmitz, F., Hofmann, K., and Südhof, T. C. (1997). Rim is a putative Rab3 effector in regulating synaptic vesicle fusion. Nature 388, 593–598. [DOI] [PubMed] [Google Scholar]
- Wang, Y., Liu, X., Biederer, T., and Südhof, T. C. (2002). A family of RIM-binding proteins regulated by alternative splicing: implications for the genesis of synaptic active zones. Proc. Natl. Acad. Sci. USA 99, 14464–14469. [DOI] [PMC free article] [PubMed] [Google Scholar]
- Yokota, T., Nakata, T., Minami, S., Inazawa, J., and Emi, M. (2000). Genomic organization and chromosomal mapping of ELKS, a gene rearranged in a papillary thyroid carcinoma. J. Hum. Genet. 45, 6–11. [DOI] [PubMed] [Google Scholar]
Associated Data
This section collects any data citations, data availability statements, or supplementary materials included in this article.


