

Abstract
The spindle pole body (SPB) is the microtubule organizing center of Saccharomyces cerevisiae. Its core includes the proteins Spc42, Spc110 (kendrin/pericentrin ortholog), calmodulin (Cmd1), Spc29, and Cnm67. Each was tagged with CFP and YFP and their proximity to each other was determined by fluorescence resonance energy transfer (FRET). FRET was measured by a new metric that accurately reflected the relative extent of energy transfer. The FRET values established the topology of the core proteins within the architecture of SPB. The N-termini of Spc42 and Spc29, and the C-termini of all the core proteins face the gap between the IL2 layer and the central plaque. Spc110 traverses the central plaque and Cnm67 spans the IL2 layer. Spc42 is a central component of the central plaque where its N-terminus is closely associated with the C-termini of Spc29, Cmd1, and Spc110. When the donor-acceptor pairs were ordered into five broad categories of increasing FRET, the ranking of the pairs specified a unique geometry for the positions of the core proteins, as shown by a mathematical proof. The geometry was integrated with prior cryoelectron tomography to create a model of the interwoven network of proteins within the central plaque. One prediction of the model, the dimerization of the calmodulin-binding domains of Spc110, was confirmed by in vitro analysis.
INTRODUCTION
The spindle pole body (SPB) is the microtubule organizing center of Saccharomyces cerevisiae (Jaspersen and Winey, 2004). Two SPBs establish the bipolar mitotic spindle, a defining event of mitosis that allows the stable transmission of equivalent genetic material to the mother and daughter cell at the time of cell division. This role of the SPB is carried out by the centrosome in higher eukaryotes.
The structure of the SPB is reviewed in Jaspersen and Winey (2004). Briefly the ultrastructure observed by electron tomography consists of a series of stacked layers embedded in the nuclear envelope (Figure 1A). The inner plaque is the area where the microtubules dock to the SPB and harbors the γ-tubulin complex and the N-terminus of Spc110. The central plaque and the IL2 layer are the two core layers. This core is composed of 5 proteins (Figure 1A). Spc29 and Cmd1 reside in the central plaque. Spc42 is thought to begin within the central plaque, but terminate in the IL2 layer. The C-terminus of Spc110 is in the central plaque where it binds Cmd1. The C-terminus of Cnm67 lies in the IL2 layer where it binds Spc42 and links the SPB core to the outer plaque. The outer plaque is the cytoplasmic boundary of the SPB where the astral microtubules nucleate from a second region of γ-tubulin. Based on primarily two-hybrid interactions the SPB core proteins are typically depicted as components lying along a linear path that proceeds from Spc110 to Spc29 to Spc42 to Cnm67.
Figure 1.

Core layers of the SPB. (A) Schematic diagram of the SPB shows the proteins and the layers where they are located. The image is drawn approximately to scale for the dimensions of an SPB from a diploid cell. Scale bar, 25 nm. (B) Schematic of possible positions for CFP and YFP when attached to SPB components. For different CFP and YFP combinations the capacity for FRET is shown.
The ultrastructure of the SPB is clearly quite different from the centrosome. Centrioles are not present and the SPB remains inserted in the nuclear envelope during mitosis. Yet both have in common the γ-tubulin complex, Spc110/kendrin/AKAP-450, calmodulin, centrin, and Sfi1p. (The latter two proteins are part of the SPB half-bridge, a domain involved in SPB duplication and not shown in Figure 1; Ivanovska and Rose, 2001; Kilmartin, 2003). Despite differences in gross anatomy, the SPB and centrosome likely share an underlying structure.
To date the only component of either the SPB or centrosome whose structure is solved at atomic resolution is calmodulin (Babu et al., 1985). The paucity of structural information has limited our understanding of the molecular functions performed by individual SPB proteins. Without crystals or well behaved soluble proteins, the available research tools to probe the SPB structure or any large macromolecular complex are few.
We turned to a hybrid approach that combined in vivo live-cell FRET measurements with previous cryo-EM analysis. CFP and YFP were used as FRET donor and acceptor and attached to the components of the SPB. Initially FRET values were classified as either positive or negative for energy transfer as judged by a comparison to carefully designed controls. This binary classification system allowed us to map the ends of proteins within the architecture of the SPB. Next the positive values were subdivided into classes. The classification specified a unique geometry for the SPB components that was not only consistent with previous structural and genetic studies, but broadened our understanding of SPB organization.
MATERIALS AND METHODS
Media and Strains
The compositions of synthetic dextrose minimal medium (SD), SD-complete (SDC), and yeast peptone dextrose-rich broth medium (YPD) are described elsewhere (Sundin et al., 2004).
All strains are derived from W303 (ade2-1oc, can1-100, his3-11,15, leu2-3112, trp1-1, ura3-1) and listed in Table 1. They share the W303 genetic markers except for the noted introduction of CFP or YFP gene cassettes fused to the targeted genes and in some cases are TRP1 and cyhR. The gene cassettes were introduced by standard procedures (Hailey et al., 2002). The C-terminal YFP cassette was inserted with either G418 (gene amplified from plasmid pDH6) or HIS3 (pDH5) selection. The C-terminal CFP cassette was inserted with either G418 (pDH3) or hygromycin-B (pBS4) selection. N-terminal fusions were introduced following the procedures of Prein et al. (2000) using either plasmid pDH22 or pBS5 for the insertion of YFP or CFP, respectively. Primers for amplification were synthesized by IDT (Coralville, IA). Plasmids and standard procedures are fully described at the web site for the Yeast Resource Center (http://depts.washington.edu/~yeastrc/p_p_home.htm).
Table 1.
FRETR values of pairwise combinations of SPB core proteins
| CFP donor | YFP acceptor | FRETR | SD | N | Strain |
|---|---|---|---|---|---|
| C:Cmd1 | N:Spc110 | 1.01 | 0.11 | 95 | BESY102-2A |
| C:Cmd1 | C:Spc42 | 1.06 | 0.07 | 99 | BESY97-3D |
| C:Cmd1 | C:Cnm67 | 1.09 | 0.1 | 102 | BESY98-2D |
| C:Cmd1 | C:Spc29 | 1.68 | 0.16 | 84 | BESY100-3B |
| C:Cmd1 | N:Spc29 | 1.75 | 0.23 | 93 | BESY101-4C |
| C:Cmd1 | C:Spc110 | 1.94 | 0.21 | 93 | BESY99-6C |
| C:Cmd1 | N:Spc42 | 2.04 | 0.21 | 90 | BESY96-1D |
| C:Cnm67 | N:Spc110 | 0.99 | 0.07 | 77 | EMY178 |
| C:Cnm67 | N:Spc29 | 0.99 | 0.1 | 69 | EMY167-1D |
| C:Cnm67 | C:Spc110 | 1.02 | 0.06 | 79 | EMY175 |
| C:Cnm67 | C:Cmd1 | 1.1 | 0.08 | 102 | BESY95-6D |
| C:Cnm67 | C:Spc29 | 1.1 | 0.11 | 70 | EMY192 |
| C:Cnm67 | N:Spc42 | 1.15 | 0.08 | 77 | EMY176 |
| C:Cnm67 | C:Spc42 | 2.52 | 0.19 | 81 | EMY164-1D |
| Cnm67-YFP-CFP | Cnm67-YFP-CFP | 2.65 | 0.18 | 64 | DHY151 |
| YFP-Spc110-CFP | YFP-Spc110-CFP | 1.02 | 0.06 | 132 | EMY173 |
| C:Spc110 | C:Cnm67 | 1.05 | 0.06 | 79 | DHY71 |
| C:Spc110 | C:Spc42 | 1.06 | 0.07 | 42 | BESY38 |
| C:Spc110 | C:Spc29 | 1.32 | 0.07 | 81 | DHY212 |
| C:Spc110 | N:Spc42 | 2.18 | 0.22 | 101 | DHY209 |
| C:Spc110 | C:Cmd1 | 2.37 | 0.21 | 93 | BESY86-12D |
| Spc110-YFP-CFP | Spc110-YFP-CFP | 2.42 | 0.22 | 95 | DHY150 |
| C:Spc29 | N:Spc110 | 1.03 | 0.07 | 107 | EMY180 |
| C:Spc29 | C:Cnm67 | 1.1 | 0.08 | 70 | DHY41 |
| C:Spc29 | C:Spc42 | 1.14 | 0.07 | 87 | DHY47-6B |
| C:Spc29 | C:Spc110 | 1.42 | 0.13 | 81 | DHY38 |
| C:Spc29 | C:Cmd1 | 1.7 | 0.15 | 84 | BESY89-1C |
| C:Spc29 | N:Spc42 | 2.24 | 0.18 | 72 | DHY208 |
| C:Spc42 | N:Spc29 | 0.98 | 0.09 | 84 | EMY181-1D |
| C:Spc42 | N:Spc110 | 1.02 | 0.06 | 82 | EMY179 |
| C:Spc42 | C:Spc110 | 1.08 | 0.11 | 42 | EMY190 |
| C:Spc42 | C:Cmd1 | 1.13 | 0.08 | 99 | BESY91-2C |
| C:Spc42 | C:Spc29 | 1.2 | 0.14 | 87 | EMY194-2C |
| C:Spc42 | C:Cnm67 | 2.06 | 0.24 | 81 | EMY195-9A |
| N:Spc42 | N:Spc110 | 1.04 | 0.07 | 89 | BESY25 |
| N:Spc42 | C:Cnm67 | 1.11 | 0.06 | 77 | BESY22 |
| CFP-Spc42-YFP | CFP-Spc42-YFP | 1.25 | 0.08 | 49 | BESY31 |
| YFP-Spc42-CFP | YFP-Spc42-CFP | 1.29 | 0.09 | 49 | BESY34 |
| N:Spc42 | C:Spc110 | 1.86 | 0.17 | 101 | BESY23 |
| N:Spc42 | C:Spc29 | 1.86 | 0.15 | 72 | BESY45 |
| N:Spc42 | C:Cmd1 | 2.1 | 0.16 | 90 | BESY88-8A |
C and N, the position of the tag at the C- or N-terminus, respectively.
Electron Microscopy
Diploid strains were prepared for electron microscopy using high-pressure freezing and freeze substitution (Winey et al., 1995). Thin (70 nm) sections were imaged in a Philips CM10 transmission electron microscope (Mahwah, NJ). Nineteen spindle pole bodies from Spc42-GFP cells and 23 spindle pole bodies from wild-type cells were imaged. Negatives containing spindle pole bodies in longitudinal view were digitized at 600 dpi using an Agfa Duoscan f40 scanner (Orangeburg, NY). The lengths of the central plaque, the intermediate layer, and the distance between the two layers were modeled using the IMOD software package.
Fluorescence Microscopy
An overview of our methods is presented at the website, http://depts.washington.edu/~yeastrc/fm_home.htm. Fresh cells were grown on solid YPD medium supplemented with additional 3× adenine overnight at 30°C. Microcolonies were scraped off the plate and suspended in 30 μl of SDC medium. A 3–4-μl aliquot was mounted on a pad of 0.9% SeaKem LE agarose (FMC BioProducts, Rockland, ME) in SDC as described (Sundin et al., 2004).
Microscopy was preformed on a DeltaVision system manufactured by Applied Precision (Issaquah, WA). The microscope was equipped with an IL-70 (Olympus, Tokyo, Japan), a Uplan Apo 100× oil objective (1.35 NA), a CoolSnap HQ digital camera from Roper Scientific (Tucson, AZ), and optical filter sets from Omega Optical (Brattleboro, VT). The 100 W mercury arc lamp was changed when YFP photosensor values dropped below 550,000 or after 150 h of usage, whichever came first.
For each strain 60–100 images were captured. Exposure times were 0.4 s with 2 × 2 binning and a final image size of 512 × 512. Fields were focused manually using DIC followed by an automated capture of a single focal plane of YFP, FRET, CFP, and DIC images. The order of capture was critical because YFP photobleaches rapidly when exposed to the CFP excitation light (Hailey et al., 2002).
FRET Analysis
Images were analyzed with the SoftWoRx program from Applied Precision. SPBs that remained in focus during image capture were selected. The sum of the pixel intensities in a 5 × 5 pixel square encompassing the SPB was reduced by an adjacent background region of the same size for each channel. SpilloverCFP and SpilloverYFP were determined by capturing images of strain DHY20 (Spc110-YFP) and DHY89 (Spc110-CFP) and dividing the background subtracted FRET channel by the background subtracted YFP or CFP channel. To ensure the most reliable estimates for the spillover factors, images were repeatedly captured over the course of the research and then averaged. FRETR was calculated by dividing the background corrected FRET channel image by SpilloverTotal as described in the text. Statistical analysis was performed with JMP IN software from SAS Institute (Cary, NC).
Stoichiometry of the SPB Core Proteins
The YFP images collected for the FRET determinations were used to determine the relative stoichiometry of the core proteins. Because the YFP image was collected first there was no photobleaching before image capture. The wavelengths used for YFP excitation do not excite CFP, so energy transfer would not increase the intensity of the YFP signal. To ensure uniformity only proteins singularly labeled with YFP were included. Image intensities were normalized to photosensor values, which varied by ∼17% over the course of the experiments. Signals were normalized to the mean signal from YFP tagged Spc42.
Model Construction
Here we supplement with additional details the considerations that led to the central plaque geometry and model (see Figure 6).
Figure 6.

The spatial arrangement of the core proteins in the central plaque. (A) The relative postitions of the N- and C-termini as proven in Supplementary Materials. The geometry is presented in the context of the spacing between the IL2 layer and the central plaque. The lines connecting the termini follow the color coding of the FRET categories in Figure 4. (B) The lattice pattern of Spc42 in the IL2 layer based on the two-dimensional projection map of protein density described in (Bullitt et al., 1997). The repeat units of 3- and sixfold symmetry are shown. (C–E) Steps in the construction of the model of the central plaque. (C) Face-on view of the hexagonal unit of the central plaque shown from the perspective of the IL2 layer. Spc42 coiled coils projecting from the IL2 layer are at the vertices. The 30 Å lateral cross section of the fluorescent proteins are shown as circles. Orange, blue, yellow, and red represent the fluorescent proteins centered on C:Spc29, N:Spc42, C:Cmd1, and C:Spc110, respectively. The triangular arrangement of the proteins in the plane of the central plaque in A was introduced and sixfold rotational symmetry was applied. The proteins were closely packed to minimize the dimensions of the hexagonal unit. (D) Positions of termini. (E) Placement of N:Spc29. N:Spc29 and C:Spc29 are equidistant to C:Cmd1. N:Spc29 lies outside of the area, colored blue, where protein ends are close enough to C:Spc42 to register FRET. (F–H) Expanded schematic models of the central plaque that connect ends and includes features described in text and Materials and Methods. (F) Spc29 and Spc42; (G) Spc110 and Cmd1; and (I) all the components of the central plaque.
The repetition of the proteins within the hexagonal unit and throughout the central plaque results in a spectrum of pairwise distances between protein ends. Only the closest pair is assumed to significantly contribute to the FRET signal because of the steep decline of FRET with increasing distance. In agreement with this assumption, the FRETR values fit a normal distribution that typically fell well within the Lilliefors 95% confidence limits (unpublished data).
The second molecule of Spc42 was introduced at a position that precisely reproduced the distance relationships of the initial N:Spc42 with C:Spc29 and C:Cmd1. In addition the sixfold symmetry and density distribution seen in the lattice structure of the Spc42 sheets (Figure 6B; Bullitt et al., 1997) was enforced so that both N-termini were orthogonal to the C:Spc42 density. The distance between the second N:Spc42 and C:Spc110 was 38% greater than the distance between C:Spc110 and the initial N:Spc42. This minor difference could not be avoided and still satisfy the other criteria.
The melding of the FRET based geometry with the lattice structure of Spc42 arranged the termini of the core proteins. To depict the whole proteins, we attempted to keep the representations simple, but still reflect the literature on the proteins and our hypotheses (see Figure 6, F–H). Spc42 is a small wedge that connects the Spc42 coiled coil to the N-terminus. The wedge extends past the N-terminus to allow emphasis of the two-hybrid and in vitro evidence for an interaction with the C-terminus of Spc110 (see references in Results). Spc29 is a larger wedge to reflect the larger size compared with the Spc42 N-terminal domain (253 amino acids compared with ∼65). Spc29 is drawn to resemble a camera's shutter to suggest that the contact with Spc110 is dynamic. Calmodulin consists of two globular domains equal in size and separated by a flexible linker. It binds to Spc110 at positions 900–920.
The image of Spc110 accommodates a number of observations. The MultiCoil algorithm (Wolf et al., 1997) predicts that from residues 700–739 the probability of Spc110p forming a coiled coil drops from 98% to <50%. After the coiled coil is the region where Spc29 binds (see text). Thus we show the coiled coil motif unraveling as Spc110p approaches and enters the central plaque (see Figures 5 and 6G). For simplicity and clarity we have shown the positions of the coiled coils of both Spc110 and Spc42 as if they were located within the plane of the central plaque (see Figure 6). However, most if not all of Spc110 and Spc42 coiled domains sit below and above the central plaque, respectively. Spc110 binds Spc29, Spc42, and Cmd1 (references in Results and Discussion), so the C-terminal domain snakes through the hexagonal unit contacting these proteins before ending at the location of the C-terminus.
Figure 5.

Schematic edge-on view of SPB core proteins showing the course of the proteins through the central plaque and IL2 layers. The distance and depth of the layers as seen in cryo-electronmicrographs are shown. The circles represent the termini, and the twists represent regions of coiled coils. Spc42 is shown in blue, Cnm67 in green, Spc29 in orange, Cmd1 in yellow, and Spc110 in red.
Spc110 Domain Analysis
Domain analysis was performed by limited proteolysis as described (Brockerhoff et al., 1992) with the following modifications. A fragment of Spc110 containing the C-terminal region (residues 715–944) was fused to maltose-binding protein (MBP) and coexpressed with Cmd1. The purified recombinant protein was subjected to partial proteolysis with endoproteinase LysC. The first cleavage was in the linker between MBP and Spc110 and occurred within 10 min of addition of the protease (1/1000). Within 15 min, three fragments appeared with apparent molecular weights upon SDS-PAGE of 27, 26, and 25 kDa. All three of these fragments bound calmodulin as determined by a gel overlay assay with radiolabeled Cmd1 (Brockerhoff et al., 1992). Extended digestion with more protease (1/250 ratio wt/wt endo LysC to Spc110) for 30 min enriched for the 25-kDa fragment. Calmodulin was stable under these conditions. The N-terminus of this fragment was VITAN (N-terminal analysis performed by Midwest Analytical, St. Louis, MO), which indicates that a stable domain of Spc110 begins at residue 736. The predicted molecular weight of fragment 736–944 is 25.4 kDa, in good agreement with the observed migration on SDS-PAGE of the proteolytic fragment. The fragment of Spc110 from residues 736–944 was fused to MBP and coexpressed in Escherichia coli strain SB1 (Geiser et al., 1991) with Cmd1 and ArgU tRNA. The fusion protein was purified on amylose resin as recommended by the manufacturer (New England Biolabs, Beverly, MA) and subjected to gel filtration and velocity sedimentation on sucrose gradients as described (Vinh et al., 2002). Gel filtration and velocity sedimentation was done in the presence of 1 mM dithiothreitol. Thus, the dimerization observed was not due to the formation of a disulfide bond by Cys911 in Spc110.
RESULTS
SPB Architecture Is Compatible with FRET-based Analysis
A FRET-based approach using CFP and YFP is valid if the tagged protein complex is functional and second, if the ultrastructure of the complex is maintained. Both criteria were satisfied in our examination of the structure of the SPB.
Because the FRET measurements were performed in live cells, the viability of the strains carrying the CFP and YFP tags established that the labeled proteins were functional. Forty-one strains were created that had unique pairwise combinations of CFP and YFP tagged SPB proteins (Table 1). In each case the CFP and YFP linked proteins represented the only form of the proteins in the cell. The following were tagged: 1) the C-termini of Spc42, Cnm67, Spc29, Cmd1, and Spc110, and 2) the N-termini of Spc42, Spc110, and Spc29. The only combinations tested and found not to be viable were the pairing of YFP-Spc29 with either CFP-Spc42 or Spc110-YFP.
The SPB could be functional but distorted by the incorporation of CFP or YFP. Previously Spc110, Spc29, Cnm67, and Spc42 were tagged with GFP and positioned in the SPB by immuno-EM (Adams and Kilmartin, 1999). In that study no changes in the ultrastructure of the SPB were noted. We reexamined cells in which Spc42 was replaced with Spc42-GFP. Spc42 forms the crystalline lattice around which is built the central core of the SPB (Bullitt et al., 1997). In addition Spc42 is in twofold excess over the other core components (see below). We reasoned that among the core components, a GFP tag on Spc42 was the most likely to disrupt the structure of the SPB. However, the morphology of the SPB was normal.
A comparison of the SPB from wild-type cells and the Spc42-GFP variant revealed no statistical difference in the gross dimensions of the SPBs (Figure 2). The central plaque from the Spc42-GFP cells had a mean diameter of 168.8 nm (±23.4) compared with 165.3 nm (±30.9) for wild-type. The IL2 layers had mean lengths of 136 nm (±12.9) and 129.6 nm (±19) for Spc42-GFP and wild-type cells, respectively. Similarly the mean center-to-center distances between the central plaque and the IL2 layer were 26.7 nm (±3.7) and 25.1 nm (±2.1), respectively, consistent with previous results on the distance between layers (O'Toole et al., 1999). Thus the basic size and organization of the SPB was unchanged. In addition the bipolar spindle and the duplicated SPB appeared normal in images of Spc42-GFP cells at all stages of the cell cycle (unpublished data).
Figure 2.
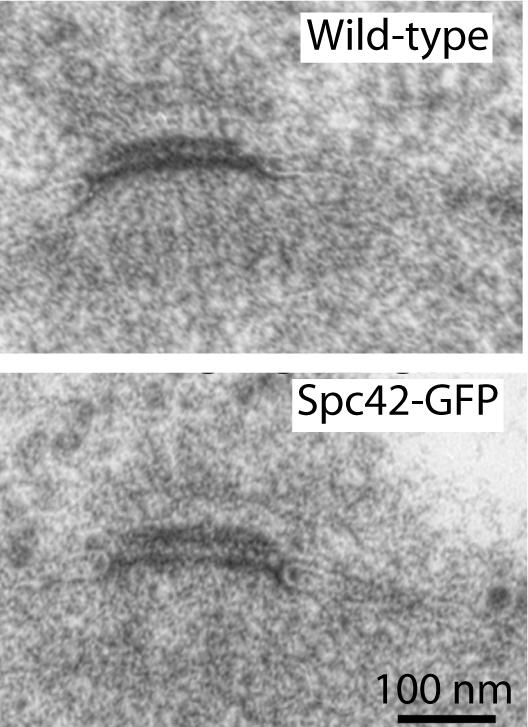
Electron micrographs of wild-type and Spc42-GFP–tagged SPBs show standard morphology.
FRETR Is a Relative Measure of FRET Magnitude
There are many methods to gauge FRET in vivo (Berney and Danuser, 2003; Sekar and Periasamy, 2003). We chose to expand on the simplest method, the measurement of fluorescence intensity by an epifluorescence microscope configured with three filter set combinations. One filter set visualizes the FRET donor, one the FRET acceptor, and one the fluorescence emitted from FRET between the donor and acceptor. The advantages of this approach are several-fold. Live cells can be imaged quickly, easily, and under normal culture conditions. Signal-to-noise is excellent with modern filter sets. The equipment is generally available, so that advances can be adopted by the research community at large.
For initial controls, Spc110 was tagged at its C-terminus with either CFP, YFP, or a tandem YFP-CFP construct. Microscopy revealed a significant level of fluorescence in the FRET channel even when either Spc110-CFP or Spc110-YFP was expressed individually (Figure 3). This spillover of fluorescence from CFP and YFP into the FRET channel has been observed previously (Gordon et al., 1998; Hailey et al., 2002). As in the past, we calculated factors that related the level of intensity in the CFP or YFP channel to the intensity in the FRET channel for CFP and YFP, respectively.
 |
 |
SpilloverCFP and SpilloverYFP had values of 0.232 (±0.050, n = 348) and 0.446 (±0.058, n = 570), respectively.
Figure 3.

Evaluating FRET by fluorescence microscopy. Fluorescence occurs in the FRET channel even when only YFP or CFP are present and energy transfer cannot occur. The combination of the spillover from the YFP and CFP channels creates the baseline to evaluate actual energy transfer in the positive control. The filter set combinations are shown for each channel. The order of image acquisition is from left to right. For each strain, images were saved in the TIFF format with the same minimum and maximum pixel intensity.
For FRET experiments the amount of CFP and YFP is measured and the sum of the spillover from CFP and YFP yields the total expected baseline fluorescence: SpilloverTotal = (SpilloverCFP× CFPchannel) + (SpilloverYFP × YFPchannel). Previously, SpilloverTotal was usually treated as background and subtracted from the FRET channel (Berney and Danuser, 2003). In contrast, we define a new metric to measure FRET, FRETR, in which the FRETchannel is divided by the SpilloverTotal.
 |
FRETR represents the relative increase in the FRET signal above a baseline defined by SpilloverTotal. Thus in the absence of energy transfer, FRETR has a predicted value of 1.
FRETR Is a Robust Measure of Energy Transfer between CFP- and YFP-labeled Core Components
Before attributing a physical proximity to the ends of proteins based on FRETR, the characteristics of the FRETR metric were examined. Foremost was the evaluation of values that arise in the absence of energy transfer. The structure of Spc110 lent itself to the creation of six negative controls. The N-terminus of Spc110 is located in the inner plaque at a distance of 600–800 Å from the central plaque (Jaspersen and Winey, 2004). Because FRET between CFP and YFP requires a distance of <100 Å, the pairing of YFP-Spc110 with any CFP-labeled protein located in either core layer cannot support FRET (Figure 1B, lane 1). However, fluorescence microscopy cannot resolve objects separated by <200 nm, so the localization pattern of the negative controls is indistinguishable from all the other pairwise combinations between the core proteins to be examined.
For the negative controls, YFP was attached to the N-terminus of Spc110, and CFP attached to either N:Spc42 (N: or C:Protein abbreviates the tagging of the C- or N-terminus), C:Spc42, C:Cnm67, C:Spc29, C:Cmd1, or C:Spc110. Among the negative controls FRETR ranged from 0.99 to 1.04, with a mean value of 1.02 (± 0.08, n = 582; Figure 4A, Table 1).
Figure 4.

The measurement of FRET. (A) The different combinations of tagged core SPB proteins produced a full range of experimental FRETR values. Each point represents the FRETR value of an individual SPB. On average 80 SPBs were examined for each strain. The YFP/CFP combinations in each strain are described in Table 1. The means are connected. The color coding for the different categories is kept throughout the figure and in Figure 6, A, D, and E. (B–D) FRETR is independent of the extent of spillover in contrast to other FRET metrics. FRETR was compared with FRETS and FRETN. FRETS equals the FRETchannel – SpilloverTotal. FRETN equals FRETS ÷ (CFPchannel × YFPchannel) (Gordon et al., 1998). The same dataset of 3401 color-coded SPBs was used to compute FRETR FRETS, and FRETN. (B) In each category FRETR is independent of spillover as seen by the even response as spillover increased. (C and D) For FRETS and FRETN bias was apparent. As spillover increased FRETS increased and FRETN was suppressed. (E–H) FRETR response is linear. FRETR is equal to the slope of the lines in E and F. FRETN is equal to the slope of the lines in G and H. (I) Protein combinations were grouped into five FRETR categories. Plotted are the means and standard deviations. The numbers indicating the protein pairs correspond to the row numbers in Table 2. (J) The combined group means of the FRETR categories show clear differences. Bars correspond to the SD. Tukey-Kramer test classified the experimental categories statistically different at an alpha greater than 10–6. (K) The linear relationship between FRETR and NFRET. NFRET = FRETS÷ (CFPchannel × YFPchannel)1/2 (Xia and Liu, 2001). The mean FRET values for the protein pairs in I were calculated using both metrics from the same dataset of 3401 SPBs and also color coded as in I.
For our two positive controls, Spc110 and Cnm67 were tagged at their C-termini with a YFP and CFP in tandem (Figure 1B, lane 2). Spc110-YFP-CFP and Cnm67-YFP-CFP had FRETR values of 2.42 (±0.22) and 2.65 (±0.18), respectively (Table 1). These values define the upper limit of the FRETR metric and indeed no higher values have been seen in any other pairings or controls we have studied (Muller, unpublished results).
Next, FRETR values were determined in 33 experimental pairwise combinations of core proteins labeled with CFP and YFP. A priori we envisioned several possibilities (Figure 1B). The central plaque and IL2 layer are protein dense, so the structural integrity of the SPB (Figure 2) implies that the large fluorescent proteins reside on the surface of the layers and not internally. Given the dimensions of the core layers and the space between them, high FRET can only occur when the tagged ends of the two proteins fall on the same side of the same layer (Figure 1B, lanes 3–5). If the ends are positioned on opposite sides, the distance between YFP and CFP will be too great to support FRET (Figure 1B, lanes 8 and 9). In the case where the two proteins are positioned in different layers but both ends are in the space between the layers, then FRET should be possible (Figure 1B, lane 7). However the distance between layers is estimated at 108 (±14.4) Å (O'Toole et al., 1999). Given an R0 of 49 Å for the distance for half maximal FRET between YFP and CFP (Heim, 1999), interlayer FRET is expected to be detectable, but low.
Before proceeding with the analysis and interpretation of the FRET data, the behavior of FRETR was examined and compared with other FRET metrics. In particular FRETR was compared with FRETS (FRETchannel – SpilloverTotal) and FRETN (FRETS/[CFPchannel × YFPchannel]) (Gordon et al., 1998), because these form the bases of many metrics (Berney and Danuser, 2003).
As described below the FRETR values were grouped into five categories of increasing FRET: none, lowest, low, moderate, and high (Figure 4, A and I). Unlike either FRETS or FRETN, FRETR did not show a dependence on the level of SpilloverTotal (Figure 4, B–D). SPBs having a low value of SpilloverTotal yielded both low and high FRETR values. On the other hand, FRETS and FRETN clearly depend on the Spillover extentTotal of (Figure 4, C and D).
One other strength of FRETR is the uniform and low coefficient of variation (CV; 100 × StdDev/Mean). Among all the strains examined, CV ranged from 5.7 to 13, and was typically <12 (30/31). In contrast CV ranged from 20 to 1107 for FRETN, with highest variability at the lower values. The basis for the low CV of FRETR was the linearity of FRETR over the full range of values. The data yielded a good linear fit across all FRET categories (Figure 4, E and F). In comparison, the linear fit of FRETN was fair among the high category pairings (Figure 4G), but in each successively lower FRET category the R2 for a linear fit dropped. In the lowest (avg. R2 = 0.1) and none (avg. R2 = 0.002) categories, FRETN lost all indication of linearity (Figure 4H).
The Topology of the Core Proteins within the IL2 Layer and Central Plaque
As a first step toward understanding the organization of the core proteins, the protein pairs were scored on whether energy transfer occurred or not. First, for each pair of protein ends, values were averaged from the two strains that had the same proteins tagged but with CFP and YFP reversed (Table 2). The average was taken to minimize any bias due to the tags or donor/acceptor stoichiometry. Remarkably only three protein pairs showed no indication of FRET: YFP-Spc29 with Spc42-CFP; YFP-Spc29 with Cnm67-CFP; and Spc110-YFP (-CFP) with Cnm67-CFP (-YFP). From Tukey-Kramer statistical analysis, which compared the means and the distribution, all three were indistinguishable from the negative controls. All three represent interlayer pairings (Figure 1, A and B, lane 7).
Table 2.
Classification of FRETR values
| Row | CFP- and YFP-labeled protein pair | Line segment in proof | FRETR mean | SD | Tukey-Kramer HSD levels | FRET class |
|---|---|---|---|---|---|---|
| 1 | C:Spc42 and N:Spc29 | 0.98 | 0.09 | 1 | None | |
| 2 | N:Spc110 and C:Cnm67 | 0.99 | 0.07 | 1 | Control None | |
| 3 | C:Cnm67 and N:Spc29 | 0.99 | 0.10 | 1 | None | |
| 4 | N:Spc110 and C:Cmd1 | 1.01 | 0.11 | 1 | Control None | |
| 5 | C:Spc42 and N:Spc110 | 1.02 | 0.06 | 1, 2 | Control None | |
| 6 | N:Spc110 and C:Spc110 | 1.02 | 0.06 | 1 | Control None | |
| 7 | N:Spc110 and C:Spc29 | 1.03 | 0.07 | 1, 2 | Control None | |
| 8 | C:Cnm67 and C:Spc110 | 1.04 | 0.06 | 1, 2 | None | |
| 9 | N:Spc42 and N:Spc110 | 1.04 | 0.07 | 1, 2 | Control None | |
| 10 | C:Spc42 and C:Spc110 | AF | 1.07 | 0.09 | 1, 2, 3 | Lowest |
| 11 | C:Cnm67 and C:Cmd1 | BC | 1.09 | 0.09 | 2, 3 | Lowest |
| 12 | C:Spc42 and C:Cmd1 | AC | 1.10 | 0.08 | 2, 3 | Lowest |
| 13 | C:Cnm67 and C:Spc29 | BD | 1.10 | 0.09 | 2, 3 | Lowest |
| 14 | N:Spc42 and C:Cnm67 | BE | 1.13 | 0.08 | 3, 4 | Lowest |
| 15 | C:Spc42 and C:Spc29 | AD | 1.17 | 0.12 | 4 | Lowest |
| 16 | N:Spc42 and C:Spc42 | AE | 1.27 | 0.09 | 5 | Low |
| 17 | C:Spc29 and C:Spc110 | DF | 1.37 | 0.12 | 6 | Low |
| 18 | C:Spc29 and C:Cmd1 | DC | 1.69 | 0.15 | 7 | Moderate |
| 19 | N:Spc29 and C:Cmd1 | 1.75 | 0.23 | 7 | Moderate | |
| 20 | N:Spc42 and C:Spc110 | EF | 2.02 | 0.25 | 8 | High |
| 21 | C:Spc29 and N:Spc42 | DE | 2.05 | 0.25 | 8 | High |
| 22 | C:Cmd1 and N:Spc42 | CE | 2.07 | 0.19 | 8 | High |
| 23 | C:Cmd1 and C:Spc110 | CF | 2.15 | 0.30 | 9 | High |
| 24 | C:Spc42 and C:Cnm67 | AB | 2.29 | 0.31 | 10 | High |
| 25 | Spc110-YFP-CFP | 2.42 | 0.22 | 11 | Control High | |
| 26 | Cnm67-YFP-CFP | 2.65 | 0.18 | 12 | Control High |
The average of the reciprocal pairs in Table 1. The line segments for the geometric proof in Supplementary Materials represent the distances between the listed termini. For the Tukey-Kramer comparison of means, pairs not sharing the same level are significantly different at an alpha of 0.05.
The lowest FRET values that were statistically distinct from the negative controls were also interlayer pairings (Table 2, Figures 1 and 4I). Thus the tagged C-termini of Spc42 and Cnm67, both located in the IL2 layer (Bullitt et al., 1997), were able to FRET with all of the tagged proteins of the central plaque with the already noted exception of Spc110 with Cnm67. The results argued that all the ends of all the core proteins pointed toward the gap between layers, as depicted in Figure 1B (lane 7) and Figure 5.
This conclusion on the topology of the ends was supported by the strong positive FRET signals from the other pairings (Table 2). In particular fluorescent proteins attached to both ends of Spc42 resulted in significant FRET (FRETR of 1.27). In turn all intralayer pairings between a tagged end of Spc42 and another component located in the same layer of the SPB yielded FRETR values greater than 2, the highest values in our study and approaching the levels of the positive controls. In conclusion the C-termini of Spc42 and Cnm67 lie along the internal edge of the IL2 layer, and the N-termini of Spc42 and Spc29 as well as C-termini of Spc29, Spc110, and Cmd1 lie along the inner surface of the central plaque (Figure 5).
Classification of the FRETR Values
Among the pairwise combinations of SPB components a full dynamic range was found, from 0.98 (±0.09) for the Spc42-CFP, YFP-Spc29 pair to 2.52 (± 0.19) for the Cnm67-CFP, Spc42-YFP pair (Figure 4A, Table 1). Including the positive and negative controls, a total of 3401 SPBs representing 41 different CFP and YFP combinations were examined. This rich data set was explored to determine if other structural information could be obtained.
FRETR values were grouped to facilitate meaningful comparisons among the measurements. (Table 2, Figure 4, I–J). The protein pairs were divided into five categories guided by a Tukey-Kramer statistical test for differences among means. The Tukey-Kramer test identified 12 levels (shown in Table 2) in which a level represented a group mean that was significantly different (95% confidence) from the other means. We were conservative and broadened the class sizes to gain a more general sense of how the protein pairs clustered. All values greater than 2.00 were in the high category. The moderate class had values of 1.69 and 1.75. The low category had values of 1.27 and 1.37. The none category was defined by the negative controls and ranged from 0.98 to 1.04. Finally the lowest category embraced the values from 1.07 to 1.20. The relationship between the C-termini of Spc110 and Spc42 exists at the boundary of detectable FRET, with a value of 1.07. Its inclusion in the lowest category was supported by the geometric proof (see below). The average values for the categories were as follows: none control, 1.02 ± 0.08; none, 1.01 ± 0.09; lowest, 1.11 ± 0.10; low, 1.33 ± 0.12; moderate, 1.71 ± 0.19; high, 2.11 ± 0.28; high control, 2.51 ± 0.23 (Figure 4J).
The classification was based on a comparison of FRETR values. However when FRET values were recalculated with another FRET metric, NFRET (FRETS/(YFPchannel × CFPchannel)1/2; Xia and Liu, 2001) the classification of the different pairs did not change. Indeed NFRET was found to be linearly related to FRETR (Figure 4K) even though the coefficient of variation was much greater for NFRET than for FRETR. Thus the groupings are not dependent on the use of our new FRET metric.
The FRETR Values Specify a Unique Spatial Arrangement of the Core Proteins
To build a model of the central plaque we assumed that FRETR is primarily a function of distance. As described by Förster, for a given donor-acceptor pair the efficiency of FRET is predominantly determined by the distance between fluorophores and by their relative orientation defined by the variable Κ2 (Stryer, 1978). For several reasons differences in orientation are unlikely to account for the differences in FRETR among the tagged SPB components. Along the planar surfaces of the central plaque and IL2 layer the fluorescent protein tags will be similarly constrained so that the principle difference among the pairs will be fluorophore-to-fluorophore distance. Moreover, the SPB contains ∼1000 molecules of each component. The flexible peptide linkage between the fluorescent protein and the SPB protein will create a randomly orientated population whose energy transfer is averaged across the whole SPB during image capture. Although the orientation between fluorescent proteins cannot be assumed to be random (i.e., Κ2 of 2/3; Stryer, 1978), as long as the average Κ2 is similar for the different pairwise combinations, the variation in FRETR will reflect variation in proximity. Still, given the uncertainty in the average value for Κ2 and that FRETR is a relative measure of FRET, we did not invoke the Förster equation to directly derive distances. Instead we established a relative geometry that was independent of assigned distances. The geometry was then incorporated into the known dimensions and arrangement of the SPB.
Two assumptions were made. First, each positive FRET class represented a group of protein pairs that shared a common distance between fluorophores. For example, the distance between fluorophores for the C-terminally tagged Spc42 paired with the C-terminally tagged Cnm67 (FRETR, 2.29, high class, Table 2) was equal to the distance between fluorophores in the C-terminally tagged Cmd1 paired with the C-terminally tagged Spc110 (FRETR, 2.15, high class, Table 2). The distances were not specified, but assumed to be equal.
The second assumption was that higher FRETR classes indicated pairings that were closer to each other than lower FRETR classes. This assumption was supported by two observations. Cmd1 is known to bind at the C-terminus of Spc110 (Geiser et al., 1993) and the pairing of Cmd1 with the C-terminus Spc110 fell into the high class. The lowest class grouped six interlayer combinations between a protein end in the IL2 layer and a protein end known to be in the distant central plaque.
Given these two assumptions, we solved the spatial arrangement of the SPB proteins using the principles of Euclidean geometry. A brief overview is presented here and the formal proof is in Supplementary Materials. Each protein terminus was considered a point in three-dimensional space. We let the points A, B, C, D, and F represent the C-termini of Spc42 (A), Cnm67 (B), Cmd1 (C), Spc29 (D), Spc110 (F), respectively, and point E represent the N-terminus of Spc42. Because the IL2 layer is parallel to the central plaque, the points were placed in two parallel planes. Points A and B are in one plane (corresponding to the IL2 layer), and the other points were in the second plane (corresponding to the central plaque). Next a subset of the distance relationships was enforced. Denoting |AB| as the distance between the points A and B, |AB| = |DE| = |CE| = |EF| = |CF| (the high category distances), |AD| = |AC| = |BE| = |BD| = |BC| = |AF| (the lowest category distances), |DF| > |DC| > |AB| (low category distance > moderate category distance > high category distance). From these geometric relationships a solution was derived for the relative positions of points A through F (Figure 6A).
The proof shows the C-termini of Spc29, Cmd1, and Spc110 forming the vertices of a 30-60-90 triangle, with the N-terminus of Spc42 at the midpoint of the hypotenuse (Figure 6A). Again, absolute distances were not part of the proof. The spatial arrangement requires only that relative distance relationships are satisfied. The dimensions of the SPB places limits on plausible distances and this is reflected in Figure 6A and is discussed further below. The proof is consistent with the mirror image of the structure depicted in Figure 6A, but no other arrangements.
The spatial arrangement derived from the proof satisfies all 14 FRET relationships from the lowest to the high category. Thirteen of those relationships were part of the starting set of givens that formed the basis of the proof. The fourteenth was a prediction that provided a validation of the model. The proof positioned the N- and C-termini of Spc42 on a line that was perpendicular to the planes of the central plaque and the IL2 layer. In other words, based on the proof the distance from the N-terminus of Spc42 to the C-terminus is the shortest distance between the two layers. Therefore, FRET between the N- and C-termini of Spc42 should be greater than all other interlayer pairs. The prediction was borne out, as FRETR for the N-Spc42-C pair (Table 2, row 16) was 1.27 (±0.09), significantly greater than the mean of 1.11 (±0.10) for all the other IL2-central plaque pairs (Table 2, rows 10–15).
In conclusion we were able to build a coherent model of the SPB that was based on 14 distance constraints from 28 FRET measurements. The constraints were broad, simply requiring that distances within FRET categories were equal and that higher FRET values were the consequence of closer proximity. The result was a unique relative geometry. We have also begun a computational approach to solve the geometry by an alternative to the Euclidean proof. Relaxing the equality constraint to allow for a 10–20% variation in distance within a FRET category does not alter the overall geometry (Ess and Muller, unpublished results). Because all the distance geometry constraints were met, there was no evidence that restricted orientations produced aberrant FRETR values. All FRET measurements were consistent with known distances and interactions between SPB components.
A Model of the Geometry of the Central Plaque
Spc42 forms a crystalline lattice in the IL2 layer (Bullitt et al., 1997; Figure 6B, compare with Figure 6C in Bullitt et al., 1997). The lattice is likely assembled from a basic unit containing a trimer of dimers of Spc42. Spc42 is 363 amino acids in length, with a predicted dimeric coiled-coil domain from positions 60 to 137. The preferred model is that three coiled-coil dimers are bundled together at the center of a threefold axis of symmetry in the lattice (Bullitt et al., 1997; Figure 6B). The lattice also has a center of sixfold symmetry where the coiled-coil domains of Spc42 mark the six vertices (Figure 6B). The C-terminal domains of Spc42 surround the center of the hexagon. Based on the protein density maps from cryo-EM, the side of the hexagonal unit was ∼80 Å (Bullitt et al., 1997).
Starting with the coiled coil domains of Spc42, the lattice pattern of Spc42 was melded with the FRET-based geometry to yield a model of the central plaque. Because the coiled coils project orthogonally from the IL2 layer they necessarily form the vertices of a hexagon in the central plaque as well. This hexagonal repeat unit became the template for the construction of the model (Figure 6, C–H).
Next the construction of the model required a determination of the stoichiometry of the SPB proteins. In yeast the intensity of a GFP signal from an SPB-tagged protein is directly proportional to the amount of protein present (Yoder et al., 2003). The intensity of the YFP signal from the labeled SPB proteins were averaged and normalized to the YFP signal from tagged Spc42. Spc42 was found to be in twofold molar excess over the other components of the central plaque and IL2 layer. The ratio of the intensity values of the YFP-tagged SPB components relative to tagged Spc42 were as follows: Spc110, 0.47 (±0.14, N = 846); Cmd1, 0.58 (±0.15, N = 468); Spc29, 0.42 (±0.13, N = 640); and Cnm67, 0.44 (±0.16, N = 409).
The FRET-based relative geometry was then calibrated to the structure of the SPB and the dimensions of GFP. The spacing between the IL2 layer and the central plaque is 108 Å. Because the geometry placed the N- and C-termini of Spc42 on a line perpendicular to the two layers, in the model the termini were separated by 108 Å to match the interlayer distance.
The structure of GFP is an 11-stranded β-barrel with a diameter of ∼30 Å and a length of ∼40 Å (Yang et al., 1996). The hexagonal unit contains 12 copies of Spc42 and therefore 12 copies of the fluorescent protein when Spc42 is tagged. In the model of the central plaque, these fluorescent proteins were tightly packed upright in a ring that was orthogonal to the ring of protein density of the C-terminal domain of Spc42 in the IL2 layer (Figure 6, B and C), in accordance with positioning of the N-terminus orthogonal to the C-terminus. The packing of the GFPs led to an approximate length of 105 Å for the side of the hexagonal unit, ∼25% larger than the estimate from EM.
The FRET based geometry positioned Spc42 bisecting the hypotenuse of a triangle with the termini of Spc29, Spc110, and Cmd1 at the vertices. This spatial arrangement was incorporated into the model in a manner that minimized the required size of the hexagonal unit but allowed for the space to accommodate the fluorescent protein tags. The FRET-based geometry did not include the second Spc42 (Figure 6C). However, the second Spc42 could be positioned to preserve the distance relationships between Spc42 and the termini of Spc29 and Cmd1. On the other hand Spc110 has an asymmetric relationship with the two Spc42 ends. Because FRET drops rapidly with distance, the FRET-based geometry should emphasize the more proximal Spc42. The asymmetry also implies a chirality to the arrangement of Spc110, Spc29, and Cmd1 in the central plaque, because the end of Spc110 could also be represented as proximal to the other Spc42 (unpublished data).
FRET measures the relationships between fluorophores and not the protein termini. As a first approximation the termini were placed at the centers of the lateral cross sections of the fluorescent proteins (Figure 6D), but we note that the termini could lie anywhere beneath or near the base of fluorescent proteins.
Finally the position of the N-terminus of Spc29 was constrained by the positive FRETR value when paired with Cmd1. Because only one pairing led to a positive signal, positioning Spc29 was more uncertain than positioning the other termini, which had four or five associated positive FRET values. The N-terminus was tentatively placed at the base of the coiled coils of Spc42. Here the N- and C-termini of Spc29 were equidistant from the C-terminus of Cmd1 (FRETR of 1.75 and 1.69, respectively, Table 2, Figure 6E). The N-terminally tagged Spc29 did not FRET with either C-terminally tagged Spc42 or Cnm67 (Table 2) so the N-terminus of Spc29 must reside away from the N-terminus of Spc42 and away from its own C-terminus.
Dimerization of the C-terminal Domain of Spc110
Both the C-terminus of Spc110 and Cmd1 were at the edge of the hexagonal repeat unit in the model. Because Cmd1 binds to the C-terminal domain of Spc110, the model suggests that this domain defines the perimeter of the repeat unit. Because adjacent units would contact each other along their perimeter, the lateral connections between units is predicted to include binding between adjoining domains of Spc110 and Cmd1. The dimerization of this region would link together the matrix of the central plaque.
To test whether dimerization could be confirmed in vitro, we first performed a domain analysis on the C-terminal region of Spc110. Residues 736–944 of Spc110 form a domain stable to limited proteolysis. This domain was fused to MBP and coexpressed with Cmd1 in E. coli. The oligomeric state of the purified recombinant protein was determined from the sedimentation coefficient and the Stoke's radius as described (Vinh et al., 2002). With a sedimentation coefficient of 6.54S and a Stoke's radius of 56.1 Å, the molecular weight of the MBP-Spc110 (736–944) fusion protein is calculated to be 154 kDa. Because MBP (Blondel and Bedouelle, 1990) and calmodulin (Finn and Forsen, 1995) are monomeric under our experimental conditions, this molecular weight strongly predicts that the C-terminal domain of Spc110 dimerizes and binds two calmodulins (predicted molecular weight of 164 kDa).
DISCUSSION
The FRET results suggest that the Il2 layer and central plaque form an integrated meshwork of proteins with Spc42 closely associated with all components of the central plaque. The general features of the core proteins of the IL2 and central plaque, based on our FRET results and the general literature (Jaspersen and Winey, 2004), are as follows (Figure 5). The N-terminus of Spc42 begins at the inner boundary of the central plaque, forms a coiled-coil domain that defines the spacing of the gap between layers, enters the IL2 layer, and finally loops back to end at the internal face of the IL2 layer. Remarkably, even though the N-terminal domain before the coiled coil is only ∼60 amino acids long, the N-terminus is in close proximity to the C-termini of Spc29, Cmd1, and Spc110. Cnm67 begins at the outer plaque, penetrates the IL2 and ends in close proximity to the C-terminus of Spc42. The N- and C-termini of Spc29 both lie on the inner face of the central plaque. Cmd1 is situated near the C-terminal end of Spc110, consistent with in vitro binding experiments, genetic and two-hybrid results (Geiser et al., 1993). Finally Spc110, which at its N-terminus binds the γ-tubulin complex (Knop and Schiebel, 1997; Nguyen et al., 1998) extends from the inner plaque through the central plaque and ends in close juxtaposition to the C-terminus of Spc42. All the termini of the central plaque and IL2 layer proteins lie along the internal edges of the IL2 and central plaque layers, facing the space between the two layers.
Organization of the Central Plaque
The SPB is organized around an hexagonal lattice of Spc42 (Bullitt et al., 1997). The arrangement of Spc42 in the Il2 layer was suggested by analysis of cryoelectron micrographs of both SPB cores and two-dimensional crystals of Spc42 that arise in vivo upon Spc42 overexpression. Because the N-terminus of Spc42 is situated in the central plaque, the arrangement of Spc42 in the IL2 layer necessarily imposes the same organization on the location of Spc42 in the central plaque. Cryoelectron microscopy has not revealed this implied organization of the central plaque (Bullitt et al., 1997; O'Toole et al., 1997). However the visualization of the Spc42 arrangement in the IL2 relied upon the contrast between regions of high protein density and pockets of low or no density. If as supported by the FRET results the components of the central plaque are densely packed, a uniform and high protein density would mask the organization in electron micrographs.
The Spc42 lattice provided a template that enabled us to take the FRET-based geometry of the core proteins and generate a model for the organization of the central plaque. The model suggests that Spc42 and Spc29 form the heart of the central plaque (Figure 6F). A strong association between Spc29 and Spc42 is well documented. Spc29 has a robust two-hybrid interaction with the N-terminus of Spc42 (Elliott et al., 1999). In an Spc110–226 mutant, Spc29 remains associated with Spc42 under the conditions in which Spc110–226, calmodulin, and the γ-tubulin complex pull away from the SPB (Yoder et al., 2005). Finally, Spc29 is seen with Spc42 at the satellite of the SPB (Adams and Kilmartin, 1999). In our model Spc29 lies along the path of Spc42 (Figure 6F) and together they form a ring of protein around the center of the hexagonal unit in the central plaque.
We place at the center of the hexagonal unit a trimer of Spc110 dimers as they unravel from their coiled coil motif (Figure 6G). In the model Spc110 enters the central plaque through the ring of Spc29 and Spc42. Two-hybrid analysis suggested that Spc29 binds to Spc110 between the end of the coiled coil and the start of the Cmd1-binding domain, from positions 811 to 898 (Elliott et al., 1999). This region overlaps Region II of Spc110 (position 772–836; Sundberg and Davis, 1997), a domain that plays a role in locking Spc110 in place during mitosis (Yoder et al., 2005). The FRET model is consistent with Spc29 and Spc42 acting as a clasp to surround and lock Spc110 in place. However the central plaque must not only lock Spc110 in place to withstand the push and pull of mitosis, but also must be organized in a way that facilitates the remodeling of the SPB during G1/S-phase when 50% of Spc110 turns over (Yoder et al., 2003). Therefore any locking mechanism must be reversible and the interaction between Spc110 and Spc29 must be dynamic.
Calmodulin and the C-terminal domain of Spc110 are positioned to reinforce lateral stability of the central plaque. This is evident when we tessellate the hexagonal unit to form a mosaic lattice of the central plaque components (Figure 6H). Calmodulin and the C-terminal domain of Spc110 from one hexagonal unit are juxtaposed with their counterparts in the adjoining hexagonal units. The dimerization of the C-terminal Spc110/Cmd1 domain was confirmed in vitro. Surprisingly even though calmodulin is a highly conserved component of the SPB, it is not required. An SPC110–407 mutant of S. cerevisiae that lacks the calmodulin-binding domain is still viable (Geiser et al., 1993). One explanation is that the integrity of the SPB is maintained through structurally redundant lateral connections in IL2 layer and central plaque.
The tessellation of the repeat unit prompts the question of what determines the lateral limits of the SPB. How is the repeat symmetry broken and the boundary with the nuclear envelope established? One clue may come from a comparison of the dimensions of the SPB with the cluster of nuclear microtubules that originate at the SPB. The SPB is circular (Bullitt et al., 1997; O'Toole et al., 1999) with an average diameter of ∼165 nm for the central plaque from a diploid (Figure 2) and therefore an area of ∼2.1 × 10⁶Å2. A diploid would have ∼35 microtubules emanating from the SPB (32 kinetochore microtubules and a three pole-to-pole microtubules; O'Toole et al., 1999). Microtubules have a cross-sectional diameter of 25 nm, so the minimal total area occupied by 35 microtubules (hexagonal packing with a packing density of 91%; Weisstein, 2005) is 1.9 × 10⁶Å2. Even assuming some spread at the inner plaque, the SPB has almost the minimal area required to attach the nuclear microtubules. One mechanism that could minimize both the size of the SPB and the size of the bundle of microtubules would be feedback between microtubule attachment and Spc110 turnover. A removal of Spc110 molecules that are not nucleating microtubules would break the lattice symmetry, leaving Spc42 and Spc29 to interact with other proteins of the nuclear envelope. Spc110 is only added to the SPB after the insertion of Spc42 and Spc29 into the nuclear envelope (Adams and Kilmartin, 1999), so the edge of the SPB does not require Spc110. The mechanism and role of Spc110 turnover is an area of continued research.
In conclusion, we have shown that FRET based measurements can be a useful tool to examine the structure of a large protein complex. The approach is particularly powerful in combination with electron microscopy. Electron microscopy and FRET have overlapping spatial resolutions and together the two effectively complement each other. Electron microscopy adds constraints that discipline and narrow the interpretation of the FRET results and FRET provides information on the relative organization of individual proteins. By consolidating all available information, our model of the SPB offers a new perspective to guide future investigations.
Supplementary Material
Acknowledgments
We thank the members of the consulting group in Department of Biostatistics at the University of Washington for their advice on statistical analysis. We particularly thank Mike Ess for invaluable insights and discussions. We thank Sue Jasperson and Mark Winey for their encouragement and input into the direction of the research. This work was funded by National Institutes of Health (NIH) P41 RR 11823 and NIH R01 GM40506 (T.D.). The research was part of the Yeast Resource Center, a National Center for Research Resources that promotes technology development and collaborative science. EM analysis was carried out at the Boulder Laboratory for 3D Electron Microscopy of Cells (Grant RR-00592 to J.R.M. from the National Center for Research Resources of the NIH).
This article was published online ahead of print in MBC in Press (http://www.molbiolcell.org/cgi/doi/10.1091/mbc.E05–03–0214) on May 4, 2005.
Abbreviations used: SPB, spindle pole body; CFP, cyan fluorescent protein; YFP, yellow fluorescent protein.
The online version of this article contains supplemental material at MBC Online (http://www.molbiolcell.org).
References
- Adams, I. R., and Kilmartin, J. V. (1999). Localization of core spindle pole body (SPB) components during SPB duplication in Saccharomyces cerevisiae. J. Cell Biol. 145, 809–823. [DOI] [PMC free article] [PubMed] [Google Scholar]
- Babu, Y. S., Sack, J. S., Greenhough, T. J., Bugg, C. E., Means, A. R., and Cook, W. J. (1985). Three-dimensional structure of calmodulin. Nature 315, 37–40. [DOI] [PubMed] [Google Scholar]
- Berney, C., and Danuser, G. (2003). FRET or no FRET: a quantitative comparison. Biophys. J. 84, 3992–4010. [DOI] [PMC free article] [PubMed] [Google Scholar]
- Blondel, A., and Bedouelle, H. (1990). Export and purification of a cytoplasmic dimeric protein by fusion to the maltose-binding protein of Escherichia coli. Eur. J. Biochem. 193, 325–330. [DOI] [PubMed] [Google Scholar]
- Brockerhoff, S. E., Edmonds, C. G., and Davis, T. N. (1992). Structural analysis of wild-type and mutant yeast calmodulins by limited proteolysis and electrospray ionization mass spectrometry. Protein Sci. 1, 504–516. [DOI] [PMC free article] [PubMed] [Google Scholar]
- Bullitt, E., Rout, M. P., Kilmartin, J. V., and Akey, C. W. (1997). The yeast spindle pole body is assembled around a central crystal of Spc42p. Cell 89, 1077–1086. [DOI] [PubMed] [Google Scholar]
- Elliott, S., Knop, M., Schlenstedt, G., and Schiebel, E. (1999). Spc29p is a component of the Spc110p subcomplex and is essential for spindle pole body duplication. Proc. Natl. Acad. Sci. USA 96, 6205–6210. [DOI] [PMC free article] [PubMed] [Google Scholar]
- Finn, B. E., and Forsen, S. (1995). The evolving model of calmodulin structure, function and activation. Structure 3, 7–11. [DOI] [PubMed] [Google Scholar]
- Geiser, J. R., Sundberg, H. A., Chang, B. H., Muller, E. G., and Davis, T. N. (1993). The essential mitotic target of calmodulin is the 110-kilodalton component of the spindle pole body in Saccharomyces cerevisiae. Mol. Cell. Biol. 13, 7913–7924. [DOI] [PMC free article] [PubMed] [Google Scholar]
- Geiser, J. R., van Tuinen, D., Brockerhoff, S. E., Neff, M. M., and Davis, T. N. (1991). Can calmodulin function without binding calcium? Cell 65, 949–959. [DOI] [PubMed] [Google Scholar]
- Gordon, G. W., Berry, G., Liang, X. H., Levine, B., and Herman, B. (1998). Quantitative fluorescence resonance energy transfer measurements using fluorescence microscopy. Biophys. J. 74, 2702–2713. [DOI] [PMC free article] [PubMed] [Google Scholar]
- Hailey, D. W., Davis, T. N., and Muller, E. G. (2002). Fluorescence resonance energy transfer using color variants of green fluorescent protein. Methods Enzymol. 351, 34–49. [DOI] [PubMed] [Google Scholar]
- Heim, R. (1999). Green fluorescent protein forms for energy transfer. Methods Enzymol. 302, 408–423. [DOI] [PubMed] [Google Scholar]
- Ivanovska, I., and Rose, M. D. (2001). Fine structure analysis of the yeast centrin, Cdc31p, identifies residues specific for cell morphology and spindle pole body duplication. Genetics 157, 503–518. [DOI] [PMC free article] [PubMed] [Google Scholar]
- Jaspersen, S. L., and Winey, M. (2004). The budding yeast spindle pole body: structure, duplication, and function. Annu. Rev. Cell Dev. Biol. 20, 1–28. [DOI] [PubMed] [Google Scholar]
- Kilmartin, J. V. (2003). Sfi1p has conserved centrin-binding sites and an essential function in budding yeast spindle pole body duplication. J. Cell Biol. 162, 1211–1221. [DOI] [PMC free article] [PubMed] [Google Scholar]
- Knop, M., and Schiebel, E. (1997). Spc98p and Spc97p of the yeast gammatubulin complex mediate binding to the spindle pole body via their interaction with Spc110p. EMBO J. 16, 6985–6995. [DOI] [PMC free article] [PubMed] [Google Scholar]
- Nguyen, T., Vinh, D. B., Crawford, D. K., and Davis, T. N. (1998). A genetic analysis of interactions with Spc110p reveals distinct functions of Spc97p and Spc98p, components of the yeast gamma-tubulin complex. Mol. Biol. Cell 9, 2201–2216. [DOI] [PMC free article] [PubMed] [Google Scholar]
- O'Toole, E. T., Mastronarde, D. N., Giddings, T. H., Jr., Winey, M., Burke, D. J., and McIntosh, J. R. (1997). Three-dimensional analysis and ultrastructural design of mitotic spindles from the cdc20 mutant of Saccharomyces cerevisiae. Mol. Biol. Cell 8, 1–11. [DOI] [PMC free article] [PubMed] [Google Scholar]
- O'Toole, E. T., Winey, M., and McIntosh, J. R. (1999). High-voltage electron tomography of spindle pole bodies and early mitotic spindles in the yeast Saccharomyces cerevisiae. Mol. Biol. Cell 10, 2017–2031. [DOI] [PMC free article] [PubMed] [Google Scholar]
- Prein, B., Natter, K., and Kohlwein, S. D. (2000). A novel strategy for constructing N-terminal chromosomal fusions to green fluorescent protein in the yeast Saccharomyces cerevisiae. FEBS Lett. 485, 29–34. [DOI] [PubMed] [Google Scholar]
- Sekar, R. B., and Periasamy, A. (2003). Fluorescence resonance energy transfer (FRET) microscopy imaging of live cell protein localizations. J. Cell Biol. 160, 629–633. [DOI] [PMC free article] [PubMed] [Google Scholar]
- Stryer, L. (1978). Fluorescence energy transfer as a spectroscopic ruler. Annu. Rev. Biochem. 47, 819–846. [DOI] [PubMed] [Google Scholar]
- Sundberg, H. A., and Davis, T. N. (1997). A mutational analysis identifies three functional regions of the spindle pole component Spc110p in Saccharomyces cerevisiae. Mol. Biol. Cell 8, 2575–2590. [DOI] [PMC free article] [PubMed] [Google Scholar]
- Sundin, B. A., Chiu, C. H., Riffle, M., Davis, T. N., and Muller, E. G. (2004). Localization of proteins that are coordinately expressed with Cln2 during the cell cycle. Yeast 21, 793–800. [DOI] [PubMed] [Google Scholar]
- Vinh, D. B., Kern, J. W., Hancock, W. O., Howard, J., and Davis, T. N. (2002). Reconstitution and characterization of budding yeast gamma-tubulin complex. Mol. Biol. Cell 13, 1144–1157. [DOI] [PMC free article] [PubMed] [Google Scholar]
- Weisstein, E. W. (2005). Circle Packing. Mathworld-A Wolfram Web Resource http://mathworld.wolfram.com/CirclePacking.html.
- Winey, M., Mamay, C. L., O'Toole, E. T., Mastronarde, D. N., Giddings, T. H., Jr., McDonald, K. L., and McIntosh, J. R. (1995). Three-dimensional ultrastructural analysis of the Saccharomyces cerevisiae mitotic spindle. J. Cell Biol. 129, 1601–1615. [DOI] [PMC free article] [PubMed] [Google Scholar]
- Wolf, E., Kim, P. S., and Berger, B. (1997). MultiCoil: a program for predicting two- and three-stranded coiled coils. Protein Sci. 6, 1179–1189. [DOI] [PMC free article] [PubMed] [Google Scholar]
- Xia, Z., and Liu, Y. (2001). Reliable and global measurement of fluorescence resonance energy transfer using fluorescence microscopes. Biophys. J. 81, 2395–2402. [DOI] [PMC free article] [PubMed] [Google Scholar]
- Yang, F., Moss, L. G., and Phillips, G. N., Jr. (1996). The molecular structure of green fluorescent protein. Nat. Biotechnol. 14, 1246–1251. [DOI] [PubMed] [Google Scholar]
- Yoder, T. J., McElwain, M. A., Francis, S. E., Bagley, J., Muller, E. G., Pak, B., O'Toole, E. T., Winey, M., and Davis, T. N. (2005). Analysis of a spindle pole body mutant reveals a defect in bi-orientation and illuminates spindle forces. Mol. Biol. Cell 16, 141–152. [DOI] [PMC free article] [PubMed] [Google Scholar]
- Yoder, T. J., Pearson, C. G., Bloom, K., and Davis, T. N. (2003). The Saccharomyces cerevisiae spindle pole body is a dynamic structure. Mol. Biol. Cell 14, 3494–3505. [DOI] [PMC free article] [PubMed] [Google Scholar]
Associated Data
This section collects any data citations, data availability statements, or supplementary materials included in this article.