Abstract
As a significant fruit and timber tree species among conifers, Pinus koraiensis remains it evergreen status throughout the harsh winters of the north, a testament to its intricate and prolonged evolutionary adaptation. This study delves into the annual trends of physiological indicators, gene expression levels, and metabolite accumulation to dissect the seasonal adaptability of P. koraiensis needles. Chlorophyll content reaches its zenith primarily between July and September, whereas carotenoids persist until spring. Additionally, notable seasonal variations are observed in the levels of soluble sugar and protein. Transcriptome data is categorized into four distinct stages: spring (S2), summer (S3-S4), autumn (S5), and winter (S6-S1). The differential expression of transcription factor genes, including bHLH, MYB-related, AP2/ERF, C3H, and NAC, provides insights into the needles’ seasonal adaptations. Analysis of chlorophyll and carotenoid metabolism, sugar metabolism, and the MAPK signaling pathway identifies PSY5 (Cluster-50735.3), AMY13 (Cluster-37114.0), pgm1 (Cluster-46022.0), and MEKK1-1 (Cluster-33069.0) may as potential key genes involved in sustaining the needle’s evergreen nature and cold resistance. Ultimately, a comprehensive annual adaptability map for P. koraiensis is proposed, enhancing understanding of its responses to seasonal variations.
Supplementary Information
The online version contains supplementary material available at 10.1186/s12870-024-05924-6.
Keywords: Pinus koraiensis needles, Seasonal adaptation, Physiology, Transcriptome, Metabolome
Introduction
Leaves play a vital role in tree growth and ecosystem functioning, serving as the primary site for photosynthesis. This process utilizes sunlight to convert carbon dioxide and water into energy and oxygen, fueling tree growth [1, 2]. Additionally, leaves facilitate water absorption from the soil through transpiration and help regulate tree temperature. They also store nutrients and exchange gases through stomata, maintaining tree vitality [3, 4]. The unique structure of leaves aids in resisting pests and disease invasions [5]. Moreover, leaf shape, color, and growth status reflect the trees’ growth environment, health, and ecological adaptability, forming a crucial basis for botanical research and ecological conservation [6, 7].
Several factors influence leaf growth and development, including internal plant components, environmental conditions, and genetic factors. Plant metabolic activities, particularly carbon and nitrogen metabolism, provide the materials and energy necessary for leaf growth [8, 9]. Soluble sugar (SS) and protein (SP), direct products of carbon and nitrogen metabolism, ensure normal cellular physiological activities and serve as building blocks for leaf expansion and thickening [10, 11]. For instance, the accumulation of SS and SP in Lycium ruthenicum Murr leaves promotes development and delays senescence [12]. Antioxidant enzymes such as superoxide dismutase (SOD), peroxidase (POD), and catalase (CAT) play critical roles in maintaining cell membrane integrity and stability, indirectly affecting leaf health and growth [13]. In Oryza sativa psf mutants, reduced SOD and CAT activity increases reactive oxygen species (ROS) levels, accelerating leaf senescence and mortality [14]. Leaf form, size, and development capacity are also governed by genetic factors. Plant genomes contain genes that control leaf development, determining morphology and growth characteristics through genetic information transmission [15, 16]. For example, overexpression of the SiER4_X1 and SiER1_X4 genes in Arabidopsis thaliana significantly increased the number of leaves, expanded leaf length and width, and substantially boosted the biomass per plant [17]. Additionally, overexpression of the PagEXPA1 gene promoted the development of leaf size and xylem vascular tissue in Populus alba × Populus glandulosa and significantly enhanced plant height, which is more conducive to poplar’s resistance to abiotic stresses in extreme environments [18].
Pinus koraiensis, an evergreen coniferous tree in the Pinaceae family, is a pioneer species that has endured natural selection [19, 20]. With a stable population structure and high environmental tolerance, it thrives in harsh conditions while retaining its leaves through cold winters [21]. The dark green needles of P. koraiensis, measuring 6–13 cm long, grow in bundles of five, are thick and straight, and feature small serrations along the edges to reduce water evaporation and protect against external damage [22, 23]. These needles adapt to shady, semi-shady, or humid and fertile mid-mountain slopes in high-altitude alpine zones, showcasing exceptional ecological adaptability [24]. Unless affected by drought, pests, nutrient deficiency, or other anomalies, P. koraiensis needles can remain dark green for several years [25].
This study sampled needles over 12 months and examined physiological indicators to understand annual needle growth management. Six periods were selected for transcriptome and metabolomics sequencing using a time gradient to investigate key regulatory factors in the seasonal adaptation of P. koraiensis needles. This approach reveals the dynamic response of needles to external environmental changes and the molecular mechanisms of temporal adaptation strategies.
Materials and methods
Plant material and sampling
Materials were selected from three healthy, pest-free P. koraiensis trees of the same clone at Jilin Agricultural University (43°48ʹ46.2ʺN, 125°24ʹ16.74ʺE). Mature needles from the current year were collected monthly from October 2022 to September 2023, precisely at noon on the 15th of each month (between 10:00 and 12:00). Thirty bundles were collected from each tree as a biological replicate, with a total of twelve times. All samples were promptly frozen in liquid nitrogen for subsequent physiological index determination and multi-omics sequencing.
Determination of physiological index
The extraction method for chlorophyll (Chl) and carotenoids (Car) was adapted from Chen [26] and Li [27] with some modifications. After collection, samples were immediately immersed in liquid nitrogen and crushed. A 0.1 g powder sample was weighed and placed in a 10 mL centrifuge tube containing 95% anhydrous ethanol. The test tube was wrapped in tin foil and stored in the dark for 24 h, with oscillation every 6 h. The supernatant was then collected, and its absorbance at 663, 646, and 470 nm was measured using a spectrophotometer. Chlorophyll a (Chl a), chlorophyll b (Chl b), and Car concentrations were calculated using the following formulas: Chl a = (12.21 × A663–2.81 × A646) × V/1000 × W; Chl b = (20.13 × A646–5.03 × A663) × V/1000 × W; Car = (4.4 × A470–0.01 × Chl a – 0.45 × Chl b) × V/1000 × W [28], where A represents absorbance, V denotes volume (mL), and W is the fresh needle weight (g). Each treatment contained three technical replicates.
SS was determined using the method of Wang and Zhao et al., with significant parameter adjustments [29, 30]. A 0.1 g needle powder sample was placed in a test tube with 8 mL of distilled water, sealed with plastic film, and immersed in boiling water for 30 min. After cooling to room temperature, the solution was centrifuged twice, and the supernatant was extracted and diluted in a 25 mL volumetric flask. A 0.5 mL extraction solution was added to a 10 mL test tube, followed by 1.5 mL of distilled water, 0.5 mL of anthrone ethyl acetate, and 5 mL of concentrated sulfuric acid. After thorough mixing, the sample was immersed in boiling water for 1 min, then removed and cooled to moderate moisture, with absorbance measured at 630 nm. Furthermore, Coomassie brilliant blue G-250 and bovine serum albumin were utilized as reagents to assess SP concentration [31]. Proline (Pro), POD, and malondialdehyde (MDA) levels in needles were evaluated using the acidic ninhydrin colorimetric method [32], phosphate buffer method [33], and thiobarbituric acid method [34], respectively.
Transcriptome sequencing and assembly
To create an RNA library, 3 µg of total RNA was extracted. The cDNA synthesis kit was used to product 2 × 150 bp paired-end reads, adhering to the manufacturer’s instructions. Reads with unknown nucleotides and over 20% low-quality bases were eliminated, leaving high-quality reads for sequencing on the Illumina HiSeq platform (Illumina, San Diego, CA) [35, 36]. All raw RNA-seq data have been uploaded to NCBI under BioProject ID PRJNA1139366.
To ensure high-quality clean reads, the raw reads were filtered using fastp (version 0.12) software with default settings [37]. Clean reads were then spliced and de novo assembled using Trinity software [38]. Additionally, DIAMOND BLASTX software matched the assembled unigenes to the Gene nonredundant (GO), Kyoto Encyclopedia of Genes and Genomes (KEGG), Eukaryotic Ortholog Groups (KOG), and NCBI nonredundant protein sequences (Nr) databases for functional annotation [39, 40].
Identification and analysis of differentially expressed genes (DEGs)
Gene expression levels for each sample were computed and normalized to fragments per kilobase of transcript per million fragments mapped reads (FPKM) using the bowtie2 tool in the RSEM software [41]. Differential expression levels between groups were evaluated using the DESeq2 R package (1.20.0) [42, 43]. The Benjamini-Hochberg method was applied to correct the P-value through multiple hypothesis testing, and the false discovery rate (FDR) was calculated. DEGs were identified with the criteria of |log2Fold Change| ≥ 1 and p-adjust value < 0.05. GO and KEGG enrichment pathways for all DEGs were analyzed using the GOseq R package and KOBAS 2.0 software [44].
Sample extraction and metabolomic analysis
To determine the composition and content of metabolites in needles at various stages, all samples were sent to MetWare Biotechnology Co., Ltd. (Wuhan, China) for extraction and analysis. After freezing and crushing, 50 mg of each sample was weighed and deposited in a test tube, followed by the addition of 1200 µL of 70% methanol internal standard extract precooled to -20℃. Following centrifugation at 12,000 rpm, the supernatant was collected for UPLC-MS/MS (Ultra Performance Liquid Chromatography, Tandem mass spectrometry) analysis. The UPLC mobile phase was 0.1% formic acid in deionized water (solvent A) and 0.1% formic acid in acetonitrile (solvent B), elution gradients was 0 min, 5% B; 9 min, 95% B; followed by a reduction back to 5% B within one minute and maintained at this level for three minutes. The flow rate was 0.35 mL/min at a temperature of 40 ℃. Furthermore, the quantification of metabolites was analyzed using the Multiple Reaction Monitoring mode of triple quadrupole mass spectrometry, and the analysis of mass spectrometry data was completed using Analyst software (1.6.3v). The precise procedures and steps have been detailed in previous studies [45, 46].
Quantitative real-time PCR (qRT-PCR) analysis
To ensure the accuracy of RNA-seq data, the CDS sequences of nine candidate genes were selected, and specialized primers for qRT-PCR analysis were designed using the INTEGRATED DNA TECHNOLOGIES website (https://sg.idtdna.com/pages) (Table S1). The internal reference gene sequence is given below: F-GAGGTAGCTTCGGGCGCAACT, R-GCAGGTTAGCGAAATGCGATAC [22, 25]. Besides, total RNA from all samples was reverse transcribed using a cDNA Synthesis Kit (Takara, Kyoto, Japan) and then detected on the CFX Opus 96 system (Bio-Rad, USA). The qRT-PCR reaction setup included 20 µL of a mixture, consisting of 10 µL of TB Green® Premix Ex Taq™ (Tli RNaseH Plus), ROX Plus (Takara, Kyoto, Japan), 1.6 µL of cDNA, 0.4 µL each of forward and reverse primers, and 7.6 µL of ddH2O. The qRT-PCR procedure involved an initial denaturation at 95℃ for 30 s, followed by 40 cycles at 95℃ for 5 s and 60℃ for 30 s, and a final stage at 95℃ for 10 s, 65℃ for 5 s, and 95 ℃ for 5 s. In this experiment, each sample underwent three technical replicates, and the relative expression of each gene was calculated using the 2−ΔΔCT method [47].
Statistical analysis
Basic data were statistically analyzed and filtered using the Excel 2019, and one-way ANOVA was performed with IBM SPSS Statistics v26.0 software [48]. Moreover, TBtools was used to create Venn diagrams and heatmap. The correlation network diagram was generated using the STIRING (https://cn.string-db.org/) website and then visualized with Cytoscape (v3.9.1) [49].
Results
Physiological changes in Pine needles by seasonal succession
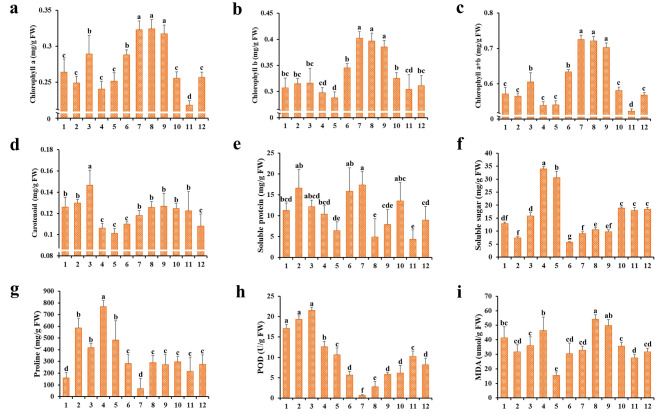
During the annual growth cycle of P. koraiensis needles, fluctuation in Chl and Car concentrations over the 12 months were significant variations. The general pattern revealed that Chl a and Chl b levels peaked in July, August, and September, whereas Car was most abundant in March, coinciding with the onset of spring. Throughout the year, SP content was highest in June and July, while SS level was higher in April and May, implying a significant role in needle formation. Furthermore, Pro and POD content increased during the first half of the year, while the trend of MDA also remained significant variation throughout the period, indicating that these physiological indicators were helpful to resist environmental factors such as abiotic stress during the annual growth cycle of needles (Fig. 1). Significantly, this study selected samples from the months of February, April, June, August, October, and December, based on temporal trends of physiological indicators and with comprehensive consideration of the temperature and humidity conditions on the day of sampling (Fig. S1), for subsequent transcriptome and metabolome sequencing.
Fig. 1.
Changes in physiological traits during the needle annual cycle. (a) Chlorophyll a content, (b) Chlorophyll b content, (c) total Chlorophyll content, (d) Carotenoids content, (e) Soluble protein content, (f) Soluble sugar content, (g) Proline content, (h) Peroxidase activity, (i) Malondialdehyde content. The column diagrams depict mean values, while the error bars represent the standard deviation (SD) of the means (n = 9). Different lowercase letters indicate significant differences between months (p < 0.05)
Novo assembly and functional annotation of unigenes
Eighteen transcriptome libraries were generated from six stages of needle samples and sequenced using the Illumina HiSeq 2500 platform. This process generated 906,039,714 raw reads, and after filtering and screening, 843,071,238 clean reads remained, with memory sizes ranging from 6.18 to 8.74 GB. The average Q20 and Q30 contents were 98.80% and 96.43%, respectively. As shown in Table S2, the average GC content was 45.43%, with a range from 45.12 to 45.73%. Trinity software was used to assemble 94,799 unigenes de novo from the clean reads (Table S3). The length of N50 was 736, and 27,634 clean reads exceeded 2000 bp, accounting for 29.15% of the total (Table S4).Furthermore, the average mapping rate to the reference sequence was 67.29% (Table S5).
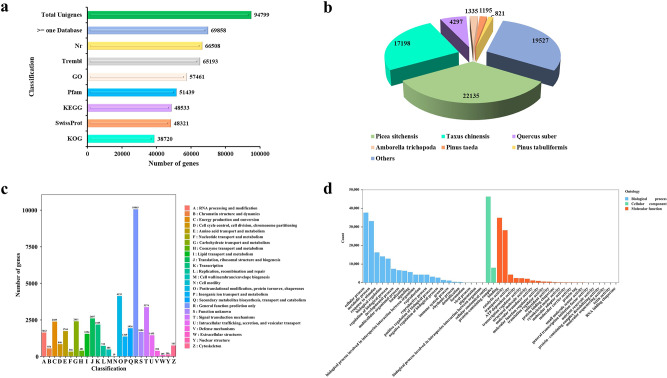
To elucidate the biological functions of the identified unigenes, all unigene sequences were aligned with functional databases. The analysis revealed that 69,858 out of 94,799 unigenes were annotated to at least one commonly used database, such as Nr, Trembl, GO, Protein families (Pfam), KEGG, SwissProt, and KOG. The Nr database had the most annotated unigenes (66,508, 70.16%), followed by Trembl (65,193, 68.77%), GO (57,461, 60.61%), Pfam (51,439, 54.26%), KEGG (48,533, 51.2%), SwissProt (48,321, 50.97%), and KOG (38,720, 40.84%) (Table S6, Fig. 2a). Figure 2b illustrates the degree of matching between unigene sequences and gene sequences from different species. The highest matches were with Picea sitchensis (22,135, 33.28%), Taxus chinensis (17,198, 25.86%), Quercus suber (4,297, 6.46%), Amborella trichopoda (1,335, 2.01%), Pinus taeda (1,195, 1.8%), and Pinus tabuliformis (821, 1.23%). The KOG database divided all unigenes into 25 categories, with the top three being General function prediction only (R, 10,063, 23.23%), Posttranslational modification, protein turnover, chaperones (O, 4,135, 9.54%), and Signal transduction mechanisms (T, 3,374, 7.79%) (Fig. 2c). GO analysis classified all unigenes into 46 functional categories based on biological process (BP), cellular component (CC), and molecular function (MF) [50]. In BP, the most abundant functions were cellular process, metabolic process, response to stimulus, biological regulation, and regulation of biological process. In MF, the highest numbers of unigenes were associated with binding, catalytic activity, transporter activity, ATP-dependent activity, and transcription regulator activity. Notably, unigenes from CC were primarily distributed within cellular anatomical entities and protein-containing complexes (Fig. 2d).
Fig. 2.
Identification and annotation of unigenes. (a) Unigene annotations from specific public databases. (b) Identification and statistics on species distribution in the Nr database. (c) Histogram of KOG function annotation for unigenes. (d) Distribution of unigenes based on GO function annotation
Identification and enrichment analysis of DEGs
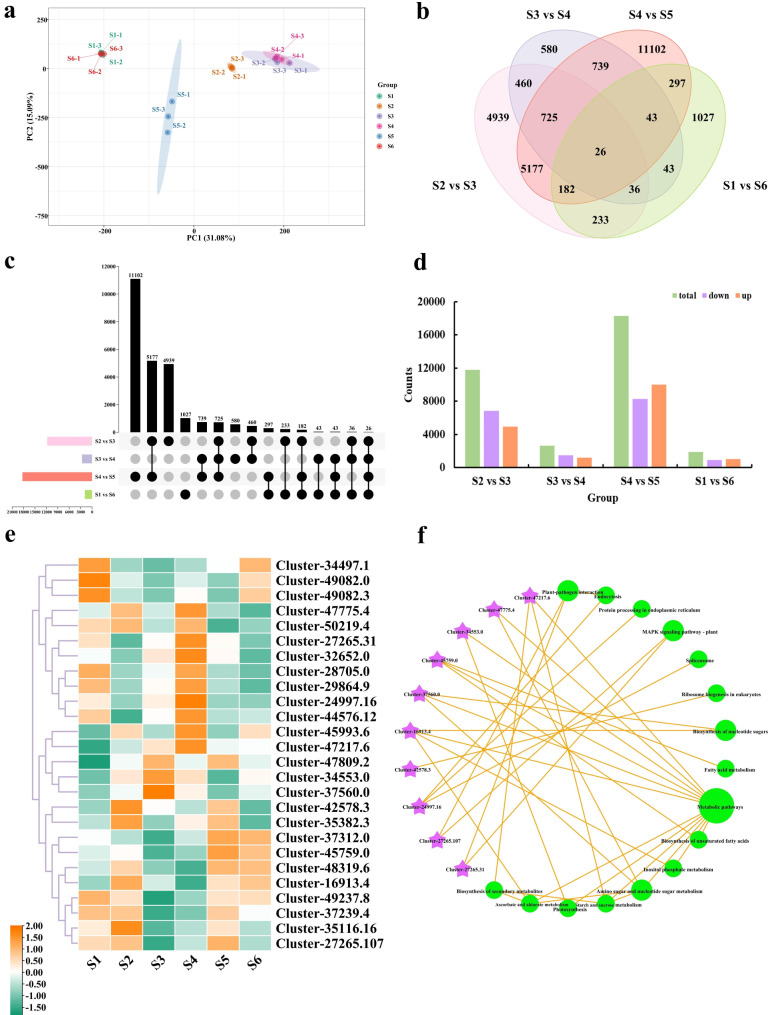
The principal component analysis (PCA) results effectively illustrated the degree of difference between samples, with the six-stage samples clearly separated into four sections. Here, this study identifies S1 and S6 as winter, S2 as spring, S3 and S4 as summer, and S5 as autumn, demonstrating excellent PCA results (Fig. 3a). Then, a total of 1,887, 11,778, 2,652, and 18,291 DEGs were identified between S1 vs. S6 (winter), S2 vs. S3 (spring), S3 vs. S4 (summer), and S4 vs. S5 (autumn), respectively (Fig. 3b, Table S7). Of these, 1,010, 4,952, 1,195, and 10,003 DEGs were up-regulated, while 877, 6,826, 1,457, and 8,288 DEGs were down-regulated (Fig. 3c-d).
Fig. 3.
Changes in differentially expressed genes between stages. (a) Principal component analysis of DEGs across samples. (b) Venn diagram of DEGs comparing S2 vs. S3, S3 vs. S4, S4 vs. S5 and S1 vs. S6 groups. (c) UpSet plot of DEGs for S2 vs. S3, S3 vs. S4, S4 vs. S5, and S1 vs. S6 groups. (d) Statistical comparison of upregulated and downregulated DEGs between S2 vs. S3, S3 vs. S4, S4 vs. S5, and S1 vs. S6. (e) Heatmap analysis of 26 common DEGs among the S2 vs. S3, S3 vs. S4, S4 vs. S5, and S1 vs. S6 groups. The color scale from green to orange shows the expression values ranging from low to high. (f) KEGG enrichment analysis network diagram of 26 common DEGs between S2 vs. S3, S3 vs. S4, S4 vs. S5, and S1 vs. S6 groups. Purple shapes represent genes, while green shapes reflect metabolic pathways. The size of the circle is proportional to the number of enriched genes in the pathway
GO annotation and KEGG enrichment analysis were utilized to determine the biological roles of DEGs in the four comparison groups. In S2 vs. S3, the most enriched functions were plant organ senescence, flavonoid biosynthetic process, flavonoid metabolic process, and response to UV. In S3 vs. S4, unfolded protein binding, response to hydrogen peroxide, protein self-association, and anion transmembrane transport showed the highest enrichment. For S4 vs. S5, the most enriched functions were flavonoid biosynthetic process, flavonoid metabolic process, pigment biosynthetic process, and response to light intensity. Finally, ethylene-activated signaling pathway, cellular response to ethylene stimulus, protein dephosphorylation, and myosin phosphatase activity were the most enriched in S1 vs. S6 (Table S8, Fig. S2). On the other hand, KEGG enrichment analysis revealed vital metabolic pathways implicated in DEGs at various phases. A total of 141, 128, 141, and 118 pathways were found in S2 vs. S3, S3 vs. S4, S4 vs. S5, and S1 vs. S6, respectively. Among the top 20 enrichment pathways, biosynthesis of secondary metabolites, plant-pathogen interaction, and metabolic pathways were the most prevalent and highly enriched across the four comparison groups. Notably, the KEGG enrich analysis indicated that the MAPK signaling pathway-plant pathway was present in all four comparisons (Table S9, Fig. S3). Interestingly, the four comparison groups shared 26 common DEGs, which exhibited high expression levels during the S1 and S4 periods (Fig. 3e). In addition, these DEGs were highly enriched in metabolic pathways, plant-pathogen interaction, and the MAPK signaling pathway-plant (Fig. 3f). To verify the reliability of the RNA-seq data, nine genes were selected from the 26 common genes for qRT-PCR. The results showed that the relative expression levels of candidate genes were well correlated with the FPKM values, which demonstrated that the expression profile results of RNA-seq were reliable (Fig. S4).
Identification and enrichment analysis of DEMs
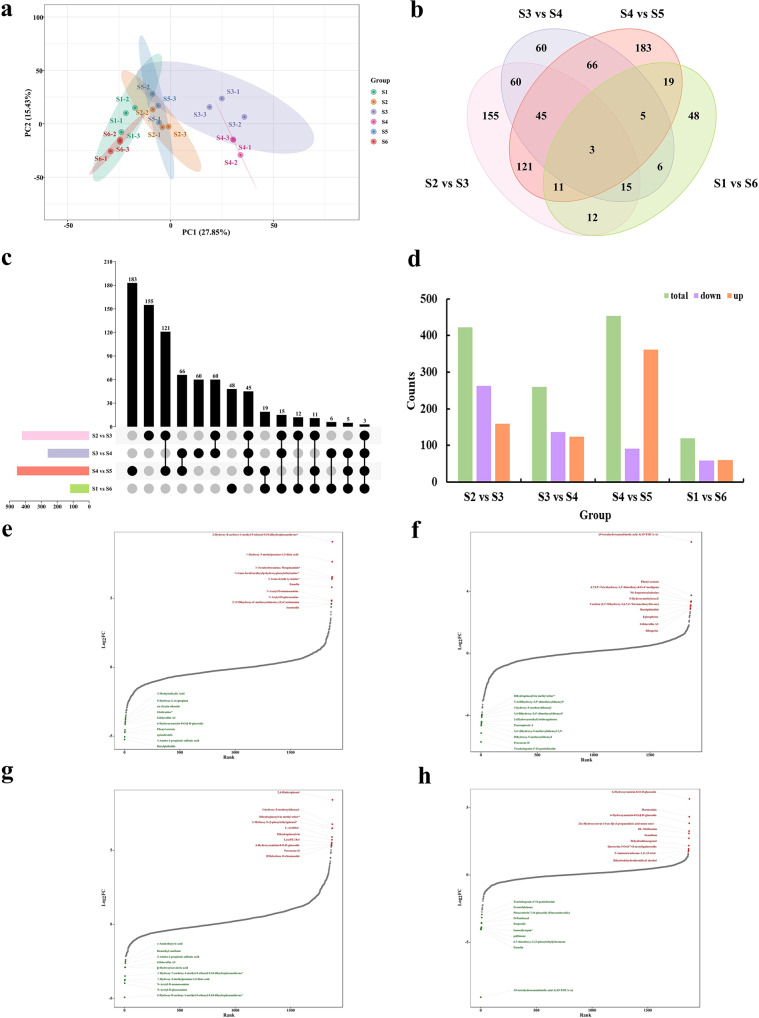
This study also employed LC-MS/MS widely targeted metabolomics analysis to identify changes in the content and abundance of metabolites during different stages of needle development (Table S10). A total of 1,882 metabolites were identified, predominantly flavonoids (469, 24.92%), terpenoids (211, 11.21%), phenolic acids (182, 9.67%), lipids (146, 7.76%), alkaloids (142, 7.55%), lignans and coumarins (139, 7.39%), and other metabolites (593, 31.5%). Besides, the results of PCA demonstrated a clear separation of samples from the six periods, with high repeatability within each period (Fig. 4a). Figure 4b-d illustrated the number of differentially expressed metabolites (DEMs) between the four groups, including total, up-regulated, and down-regulated DEMs. Among the comparison groups S2 vs. S3, S3 vs. S4, S4 vs. S5, and S1 vs. S6, three common DEMs were identified, namely glucoacetosyringone, Demethyl-erythro-Guaiacylglycerol β-Coniferyl Ether, Trachelogenin-4’-O-gentiobioside. Statistical analysis of metabolite fold changes indicated that the top ten up-regulated and down-regulated metabolites in the four comparison groups had heterogeneous compositions (Fig. 4e-h). Additionally, KEGG enrichment analysis revealed that these metabolites were primarily enriched in metabolic pathways, biosynthesis of secondary metabolites, ABC transporters, and flavonoid biosynthesis, mirroring the enrichment results of the DEGs (Fig. S5). To summarize, the annual cycle of needle development involves a complex regulatory network.
Fig. 4.
Changes in differentially accumulated metabolites between stages. (a) Principal component analysis of DEMs across samples. (b) Venn diagram of DEMs comparing S2 vs. S3, S3 vs. S4, S4 vs. S5 and S1 vs. S6 groups. (c) UpSet plot of DEMs for S2 vs. S3, S3 vs. S4, S4 vs. S5, and S1 vs. S6 groups. (d) Statistical comparison of upregulated and downregulated DEMs between S2 vs. S3, S3 vs. S4, S4 vs. S5, and S1 vs. S6 groups. (e-h) The top 20-fold-change DEMs between S2 vs. S3, S3 vs. S4, S4 vs. S5, and S1 vs. S6 groups
Summary of transcription factors (TFs)
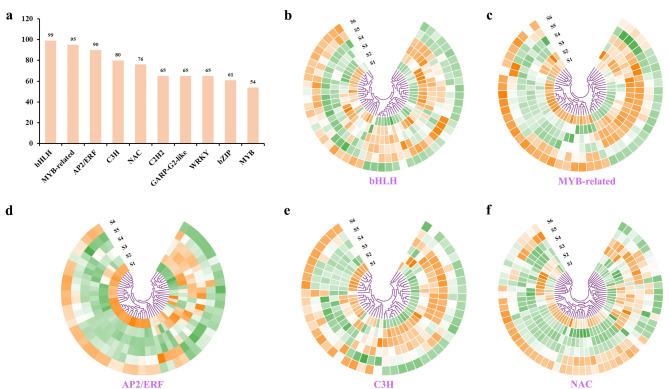
This study discovered 66 TF families were from the transcriptome of needles, comprising a total of 1,350 TFs (Table S11). The ten most abundant TFs were bHLH, MYB-related, AP2/ERF, C3H, NAC, C2H2, GARP-G2-like, WRKY, bZIP, and MYB, with counts of 99, 95, 90, 80, 76, 65, 65, 65, 61, and 54, respectively. The expression levels of genes corresponding to the five most abundant TFs were screened and presented as heat maps (Fig. 5). The results demonstrated that bHLH, MYB-related, C3H, and NAC TF genes were significantly expressed at various stages, while AP2/ERF was predominantly expressed during the S1 and S6 stages (Table S12).
Fig. 5.
Identification and statistics of TFs. (a) Statistics of the identified TFs. (b-f) Expression profiling of DEGs within the bHLH, MYB-related, AP2/ERF, C3H, and NAC families. The color scale from green to orange indicates expression values ranging from high to low
Expression profile of antioxidant enzyme-related genes
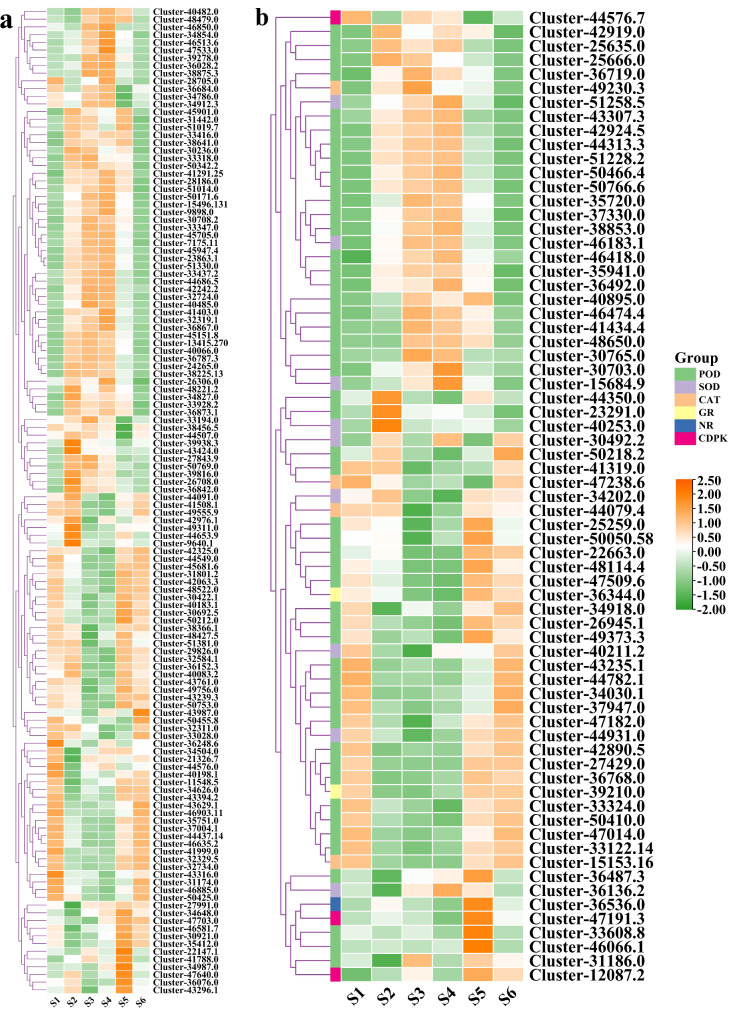
The number and expression of antioxidant enzyme-related genes exhibited monthly variation. In this study, genes encoding Pro (128), POD (50), SOD (9), CAT (4), GR (2), NR (1), and CDPK (3) were analyzed, revealing significant fluctuations in gene levels over time (Fig. 6). Most Pro genes showed higher expression levels from the S2 to S4 periods, while other antioxidant enzyme genes had elevated expression levels during the S3 and S4 periods. This pattern likely corresponds to the peak periods of needle growth and development. At the same time, the expression patterns of these genes in the S1 and S6 periods, as well as in the S3 and S4 periods, were notably similar (Table S13).
Fig. 6.
Expression levels of the DEGs related to antioxidant enzymes. (a) Pro: Proline. (b) POD: Peroxidase; SOD: Superoxide dismutase; CAT: Catalase; GR: Glutathione reductase; NR: Nitrate reductase; CDPK: Calcium-dependent protein kinase. The color scale from green to orange indicates expression values ranging from low to high
Genes involved in chlorophyll and carotenoid metabolism
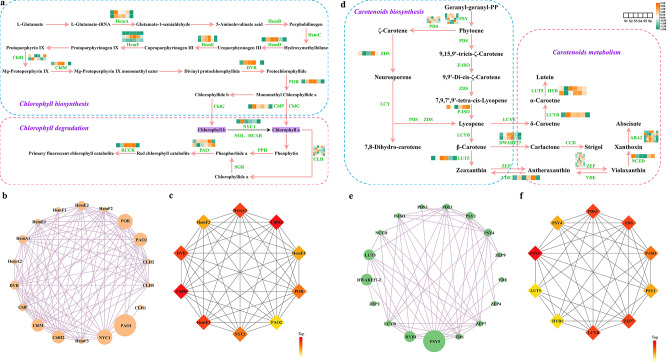
Evergreen conifers depend heavily on chlorophyll biosynthesis and degradation. This study found 23 genes encoding 13 enzymes involved in chlorophyll metabolism. HemA, ChlM, HemE, HemD, DVR, POR, and ChlP genes exhibited higher expression levels during the S2-S4 period of chlorophyll biosynthesis (Fig. 7a, Table S14). In particular, the POR gene (Cluster-45487.5) demonstrated a fivefold higher relative expression compared to other genes. In the chlorophyll degradation pathway, RCCR and PAO genes were overexpressed during the S3-S5 phase. Besides, a protein interaction network for these genes was constructed, and the CytoNCA analysis revealed that PAO1 (Cluster-28937.2), NYC1 (Cluster-33571.0), and POR were central genes in the network (Fig. 7b). The CytoHubba algorithm identified the top ten potential genes, including HemA1 (Cluster-31444.3), ChlH2 (Cluster-49535.2), HemE1 (Cluster-33222.0), POR, PAO2 (Cluster-46790.0), NYC1, HemE2 (Cluster-37778.0), ChlM (Cluster-37145.2), DVR (Cluster-37454.0), and HemF2 (Cluster-5208.2). These results speculated that POR genes may be essential in the chlorophyll biosynthesis and degradation pathways (Fig. 7c).
Fig. 7.
Panoramic expression levels of differentially expressed genes involved in chlorophyll and carotenoid metabolism. (a) Chlorophyll biosynthetic and degradative pathway. (b) Regulatory network of chlorophyll biosynthesis and degradation based on the CytoNCA algorithm. (c) The top 10 hub genes in the regulatory network of chlorophyll biosynthesis and degradation based on the CytoHubba algorithm. (d) Carotenoid biosynthetic and metabolic pathway. (e) Regulatory network of carotenoid biosynthesis and metabolism based on the CytoNCA algorithm. (f) The top 10 hub genes in the regulatory network of carotenoid biosynthesis and metabolism based on the CytoHubba algorithm. The color scale from green to orange indicates expression values ranging from low to high
In the carotenoid biosynthesis and metabolism process, 33 genes encoding 12 enzymes were identified (Fig. 7d, Table S14). DWARF27, LUT5, HYB, LCYB, and ABA2 genes showed higher expression at the S3 and S4 stages, whereas P-ISO and NCED genes had elevated expression levels at later stages, such as S5 and S6. According to the CytoNCA algorithm, PSY5 (Cluster-50735.3) emerged as the central gene in the network diagram (Fig. 7e). The Cytohubba algorithm ranked PSY5, ZEP7 (Cluster-48403.3), LCYB (Cluster-37752.0), and PDS3 (Cluster-37669.0) as the top genes (Fig. 7f). In conclusion, PSY5 likely plays a significant role in carotenoid biosynthesis and metabolism.
Genes and metabolites related to galactose, starch, and sucrose metabolism
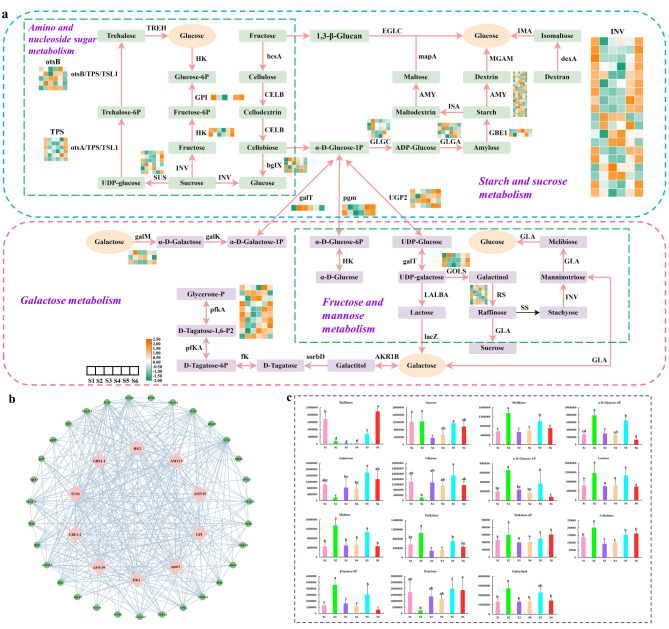
In this study, 23 DEGs were identified in galactose metabolism, and 82 DEGs were identified in starch and sucrose metabolism, indicating their involvement in a complex regulatory network (Fig. 8a, Table S15). Besides, 15 DEMs were identified in these pathways, with Melibiose, α-D-Glucose-6P, α-D-Glucose-1P, Lactose, Maltose, Trehalose, Trehalose-6P, Cellobiose, Fructose-6P, and Galactinol being most abundant in the S2 and S5 stages, while Raffinose, Galactose, Glucose, and Fructose were more prevalent during the S1 and S6 periods (Fig. 8c, Table S16). Furthermore, a protein interaction network map was constructed using 105 DEGs in this metabolic pathways, and the CytoHubba algorithm were utilized to identify the top ten hub genes, namely HK2 (Cluster-49013.1), AMY13 (Cluster-37114.0), AMY15 (Cluster-38152.6), GPI (Cluster-42872.2), pgm1 (Cluster-46022.0), HK1 (Cluster-30268.0), AMY19 (Cluster-42817.5), GBE1-2 (Cluster-48268.1), SUS4 (Cluster-44028.0), and GBE1-1 (Cluster-27884.0) (Fig. 8b). Importantly, the expression levels of AMY13 and pgm1 were 2 to 10 times higher than those of other genes, suggesting their pivotal roles as regulatory signals in starch and sucrose metabolism, as well as fructose and mannose metabolism.
Fig. 8.
Expression levels of differentially expressed genes related to galactose, starch and sucrose metabolism. (a) The biosynthetic and metabolic pathway for galactose, starch and sucrose. (b) Regulatory network of galactose, starch and sucrose biosynthesis and metabolism. The pink circle shows the top 10 genes identified by the CytoHubba algorithm. (c) Determination and characterization of DEMs content implicated in galactose, starch and sucrose biosynthesis and metabolism. The color scale from green to orange demonstrates expression values ranging from low to high. The column diagram depicts the mean metabolite content, with error bars reflecting the standard deviation (SD) of the means at n = 3. Different lowercase letters denote significant differences between months (p < 0.05)
Genes involved in MAPK signaling pathway
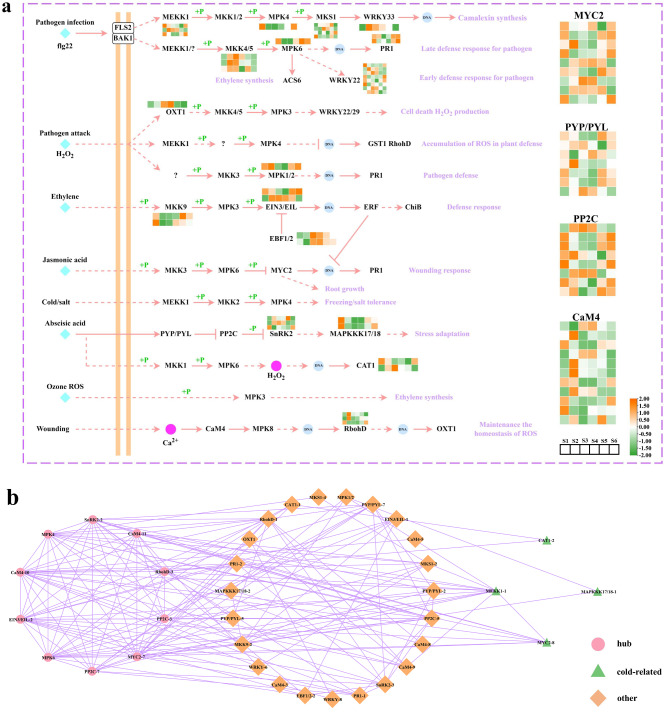
The MAPK cascade is pivotal in regulating plant growth and cold resistance. In this study, the MAPK signaling pathway (ko04016) was annotated in the KEGG enrichment pathway of DEGs, highlighting its role as a multifunctional and complex signaling system. This pathway encompassed 76 interconnected genes distributed across various signaling pathways, including H2O2, Ethylene, Cold/salt, and others (Fig. 9a). In the Cold/salt specifically, four genes were identified, with three (MEKK1-1, cluster-33069.0; MEKK1-3, cluster-49368.0; and MPK4, cluster-43241.2) showing significant expression during the S1 and S6 periods, suggesting their key role in growth regulation during the cold winter (Table S17). Besides, a protein interaction network was constructed using these MAPK signaling pathway genes, and the CytoHubba algorithm identified 12 crucial hub genes, potentially aiding P. koraiensis needles in growth and stress response (Fig. 9b). Furthermore, GO annotation of the four genes in the network indicated their association with cold response, specifically MEKK1-1 (cluster-33069.0), MYC2-8 (cluster-50288.0), CAT1-2 (cluster-49230.3), and MAPKKK17/18 − 1 (cluster-25013.4) (Table S18). In conclusion, MEKK1-1 (cluster-33069.0) appears to be a key structural gene that enables needles to remain green during winter.
Fig. 9.
Expression profile of DEGs related to the MAPK signaling pathway. (a) MAPK signaling pathway. (b) Regulatory network of the MAPK signaling pathway. The color scale from green to orange represents to the expression values ranging from low to high. The pink rhombus shows the top 10 genes identified by the CytoHubba algorithm, while the green triangle denotes a gene related to cold resistance
Weighted gene co-expression network analysis (WGCNA)
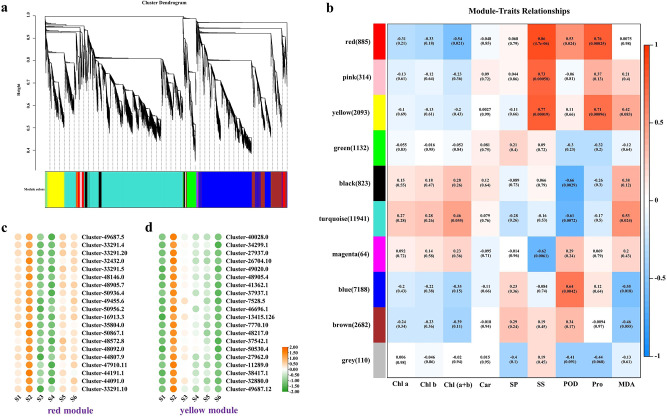
WGCNA was conducted on all genes and physiological indexes, identifying 10 co-expressed gene modules (Fig. 10a). The analysis revealed that the red and yellow modules showed a strong correlation with physiological indexes such as SS, POD, Pro, and MDA (Fig. 10b). Further evaluation of the genes in the red and yellow modules led to the selection of the top 20 genes based on kWithin value, and a gene expression heat map was created (Fig. 10c-d, Table S19-S20). The heat map indicated that the expression levels of these 40 genes were significantly higher during the S2 period, suggesting that these genes may be one of the primary causes influencing changes in physiological markers.
Fig. 10.
WGCNA results. (a) Clustering gene dendrograms and module division. (b) Correlation heatmap between physiological traits and modules. (c) Expression profile of the top 20 hub DEGs in the red module. (d) Expression profile of the top 20 hub DEGs in the yellow module. The color scale from green to orange indicates expression values from high to low
Discussion
Coniferous trees exhibit the unique natural phenomenon of maintaining their needles and retaining an evergreen appearance throughout severe winter conditions. While only Picea abies has been extensively studied for its annual growth cycle [51], this study provides a comprehensive analysis of P. koraiensis needles by integrating transcriptome data, physiological indicators, and metabolomic profiles to establish a high-quality database. This methodology facilitates a deeper understanding of the seasonal adaptation of coniferous species.
Samples were gathered over a span of an entire year, providing a comprehensive temporal scale that holds significant scientific value. Generally, pigment concentration within chloroplasts serves as a primary determinant of leaf color variation throughout a plant’s life cycle [52, 53]. This study found that chlorophyll concentration peaked during July, August, and September, aligning with the most vigorous developmental period of plant. This finding suggests that needles may increase chlorophyll content to fulfill growth demands [54]. Besides, genes involved in chlorophyll production and degradation, such as HemE, HemD, DVR, ChlM, POD, RCCR, and PAO, were upregulated during the S4 phase, aligning with findings in Fig. 1. These genes likely contribute to the efficient accumulation of chlorophyll in needles [55]. Although carotenoids were more abundant during summer, their most active phase occurred in March before beginning to decline, which possibly indicating a transition from dormancy to the growth cycle [56]. POR (Cluster-45487.5) and PSY5 (Cluster-50735.3) were identified as essential hub genes in chlorophyll and carotenoid metabolism pathways, as confirmed through protein interaction networks and gene expression data. Their functional roles have been previously validated in A. thaliana and Fortunella hindsii Swingle [57, 58], suggesting a potential use in future genetic transformation research of P. koraiensis.
SS, SP, and Pro are considered essential indications of plant osmotic regulation [59]. This study observed that SS, SP, and Pro accumulated throughout the year, with peak levels occurring from April to July, indicating that needles may maintain cellular osmotic balance and promote development by augmenting these compounds during the spring [60]. POD and MDA play pivotal roles in regulating the accumulation of ROS within cells [61]. Notably, POD and MDA levels remained high throughout the year, except during summer, implying that needles respond to adverse conditions by elevating POD and MDA activity to balance ROS production and scavenging [62]. Transcriptome analysis identified 197 genes encoding antioxidant enzymes, a significantly higher number than previously reported by Yu et al. [63], demonstrating that these genes may regulate enzyme content and needle growth throughout the annual cycle.
Carbohydrates, encompassing glucose, sucrose, starch and cellulose, play pivotal roles not only as energy sources and carbon skeletons in the plant life cycle but also as significant signal molecules [64, 65]. It is well documented that metabolism and transport of sugars within the annual needle cycle involve complex process such as amino and nucleoside sugar metabolism, starch and sucrose metabolism, galactose metabolism, fructose and mannose metabolism [66]. Previous research has shown that SUS and INV genes exhibit elevated expression levels during the early stages of Juglans mandshurica inflorescence development, potentially augmenting flower bud differentiation [67]. In this study, 19 INV and 6 SUS genes were identified, which exhibited differential expression across the S1-S6 phases. These genes may facilitate conversions in amino and nucleoside sugar metabolism, thereby contributing to stability of needle growth. Furthermore, protein interaction network analysis pinpointed 10 critical hub genes, with pgm1 exhibiting a 10-fold higher expression level across the six periods in comparison to the other genes. The pgm gene, which was essential for the metabolic process involving the transformation from starch to starch and sucrose metabolism, as well as for fructose and mannose, exhibited significant expression during S5 and S6 in this study, potentially enhancing the adaptability of needles during overwintering [68].
During the periods of S4 vs. S5 and S1 vs. S6, the number of upregulated genes was significantly greater than that of downregulated genes, a phenomenon that was also observed in studies on P. abies [51]. This provides grounds for the speculation that a complex gene regulatory process occurred internally in the plant at this stage to cope with the subsequent dormancy phase. In addition, the MAPK cascade serves a pivotal signaling pathway in regulating plant stress tolerance [69, 70]. In this study, KEGG enrichment analysis was utilized to identify DEGs and assigned to the MAPK signaling pathway, marking a milestone in cold resistance research for needles. Besides, the cold/salt signaling pathway include three MEKK1 and one MPK4 gene, with MEKK1-1, MEKK1-3, and MPK4 genes showing significant expression during the S1 and S6 periods, which suggested that these genes may aid needle survival during winter. Protein interaction network analysis revealed 10 major hub genes and identified four cold-related genes based on GO annotation: CAT1-2, MEKK1-1, MYC2-8, and MAPKKK17/18 − 1. In conclusion, MEKK1-1 appears to be a crucial factor in needle adaptation to low-temperature stress during winter.
Conclusions
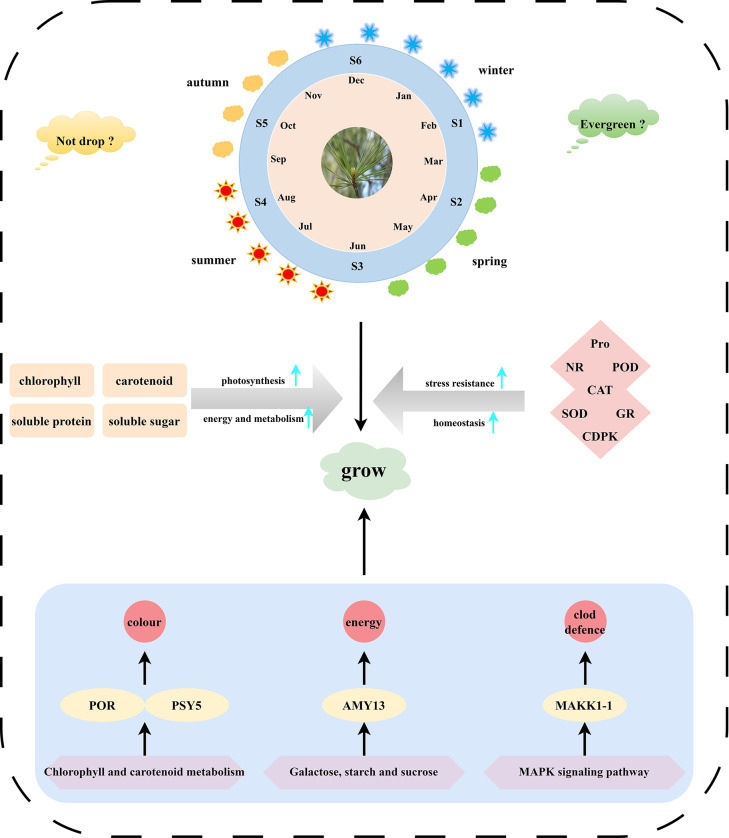
This study investigated the variations in physiological markers, gene expression levels, and metabolite content within needles across different months/seasons (Fig. 11). The results indicated that chlorophyll content increased during summer, whereas carotenoids accumulated prior to spring. Notably, significant seasonal fluctuations were observed in soluble sugar, soluble protein, Pro, POD, and MDA levels. Moreover, the genes PSY5 (Cluster-50735.3), AMY13 (Cluster-37114.0), pgm1 (Cluster-46022.0), and MEKK1-1 (Cluster-33069.0) were identified as crucial regulators in chlorophyll and carotenoid metabolism, sugar metabolism and the MAPK signaling pathway. These genes are deemed essential for maintaining the evergreen nature and needle retention of coniferous trees throughout the year, providing a foundation for subsequent research endeavors. In conclusion, this work has created an extensive and comprehensive dataset pertaining to the physiology, gene expression, and metabolite profiles of P. koraiensis. This database serves as a valuable resource for future genetic improvement and molecular biology research on conifers.
Fig. 11.
Schematic diagram of the regulatory mechanism for needle seasonal adaptability in P. koraiensis
Electronic supplementary material
Below is the link to the electronic supplementary material.
Acknowledgements
Thanks to the members of the College of Forestry and Grassland Science of Jilin Agricultural University and State Key Laboratory of Tree Genetics and Breeding for their assistance during laboratory works and for fruitful discussions; and Bullet Edits Limited for the linguistic editing and proofreading of the manuscript.
Author contributions
YL and XYZ conceived and designed the research. XL, DP and JXL performed the experiments. SZ, HBD and XNL analyzed the data. JM and JFZ contributed to sample collection. YL, XNP and XYZ wrote and revised the paper. All authors have read and approved the manuscript for publication.
Funding
This work was supported by the Central Financial Forestry Science and Technology Popularization and Demonstration Project (No. JLT2023-17), and the Innovation Project of State Key Laboratory of Tree Genetics and Breeding (Northeast Forestry University) (No. 2021A01).
Data availability
The datasets generated and analysed during the current study are available in this article and its supplementary information files. All raw RNA-seq data have been uploaded to NCBI under BioProject ID PRJNA1139366.
Declarations
Ethics approval and consent to participate
The experiments did not involve endangered or protected species.
Consent for publication
Not applicable.
Competing interests
The authors declare no competing interests.
Footnotes
Publisher’s note
Springer Nature remains neutral with regard to jurisdictional claims in published maps and institutional affiliations.
Yan Li, Xin Li and Dan Peng contributed equally to this work and share the first authorship.
References
- 1.Wu J, Albert LP, Lopes AP, Restrepo-Coupe N, Hayek M, Wiedemann KT, et al. Leaf development and demography explain photosynthetic seasonality in Amazon evergreen forests. Science. 2016;351:972–6. [DOI] [PubMed] [Google Scholar]
- 2.Migliavacca M, Musavi T, Mahecha MD, Nelson JA, Knauer J, Baldocchi DD, et al. The three major axes of terrestrial ecosystem function. Nature. 2021;598:468–72. [DOI] [PMC free article] [PubMed] [Google Scholar]
- 3.Medlyn BE, De Kauwe MG, Lin YS, Knauer J, Duursma RA, Williams CA, et al. How do leaf and ecosystem measures of water-use efficiency compare? New Phytol. 2017;216:758–70. [DOI] [PubMed] [Google Scholar]
- 4.Cernusak LA, Barbour MM, Arndt SK, Cheesman AW, English NB, Field TS, et al. Stable isotopes in leaf water of terrestrial plants. Plant Cell Environ. 2016;39:1087–102. [DOI] [PubMed] [Google Scholar]
- 5.Ding YT, Shen JJ, Li HX, Sun Y, Jiang TB, Kong XB, et al. Physiological and molecular mechanism of Populus pseudo-cathayana × Populus deltoides response to Hyphantria cunea. Pesticide Biochem Physiol. 2024;202:105969. [DOI] [PubMed] [Google Scholar]
- 6.Liesche J, Vincent C, Han XY, Zwieniecki M, Schulz A, Gao C, et al. The mechanism of sugar export from long conifer needles. New Phytol. 2021;230:1911–24. [DOI] [PubMed] [Google Scholar]
- 7.Li L, Nelson CJ, Trösch J, Castleden I, Huang SB, Millar AH. Protein degradation rate in Arabidopsis thaliana leaf growth and development. Plant Cell. 2017;29:207–28. [DOI] [PMC free article] [PubMed] [Google Scholar]
- 8.Jeong ML, Jiang HY, Chen HS, Tsai CJ, Harding SA. Metabolic profiling of the sink-to-source transition in developing leaves of quaking aspen. Plant Physiol. 2004;136:3364–75. [DOI] [PMC free article] [PubMed] [Google Scholar]
- 9.Lang T, Ke XR, Wei J, Hussain M, Li MD, Gao CJ, et al. Dynamics of tannin variations in mangrove leaf litter decomposition and their effects on environmental nitrogen and microbial activity. Sci Total Environ. 2024;908:168150. [DOI] [PubMed] [Google Scholar]
- 10.Paul MJ, Pellny TK. Carbon metabolite feedback regulation of leaf photosynthesis and development. J Exp Bot. 2003;24:539–47. [DOI] [PubMed] [Google Scholar]
- 11.Poucet T, González-Moro MB, Cabasson C, Beauvoit B, Gibon Y, Dieuaide-Noubhani M, et al. Ammonium supply induces differential metabolic adaptive responses in tomato according to leaf phenological stage. J Exp Bot. 2021;72:3185–99. [DOI] [PubMed] [Google Scholar]
- 12.Guo YY, An LZ, Yu HY, Yang MM. Endogenous hormones and biochemical changes during flower development and florescence in the buds and leaves of Lycium Ruthenicum Murr. Forests. 2022;13:763. [Google Scholar]
- 13.Li Y, Song RX, Cai KW, Pang ZY, Qian CY, Xu SJ, et al. Exploring the molecular mechanisms of melatonin-induced tolerance to salt-alkali stress in Populus cathayana × canadansis ‘Xinlin 1’. Ind Crop Prod. 2024;215:118638. [Google Scholar]
- 14.Wang FB, Liu JC, Zhou LJ, Pan G, Li ZW, Zaidi SHR, et al. Senescence-specific change in ROS scavenging enzyme activities and regulation of various SOD isozymes to ROS levels in psf mutant rice leaves. Plant Physiol Bioch. 2016;109:248–61. [DOI] [PubMed] [Google Scholar]
- 15.Du F, Guan CM, Jiao YL. Molecular mechanisms of leaf morphogenesis. Mol Plant. 2018;11:1117–34. [DOI] [PubMed] [Google Scholar]
- 16.Liu ZX, Wang JJ, Zhou YP, Zhang YX, Qin AZ, Yu XL, et al. Identification of novel regulators required for early development of vein pattern in the cotyledons by single-cell RNA-sequencing. Plant J. 2022;110:7–22. [DOI] [PMC free article] [PubMed] [Google Scholar]
- 17.Dai HJ, Huang XY, Wang YR, Zhu SJ, Li JQ, Xu ZS, et al. Overexpression of forage millet (Setaria italica) SiER genes enhances drought resistance of Arabidopsis thaliana. Funct Plant Biol. 2024;51:FP23238. [DOI] [PubMed] [Google Scholar]
- 18.Hao YY, Chu LW, He XJ, Zhao ST, Tang F. PagEXPA1 combines with PagCDKB2; 1 to regulate plant growth and the elongation of fibers in Populus alba × Populus glandulosa. Int J Biol Macromol. 2024;268:131559. [DOI] [PubMed] [Google Scholar]
- 19.Li X, Liu XT, Wei JT, Li Y, Tigabu M, Zhao XY. Genetic improvement of Pinus koraiensis in China: current situation and future prospects. Forests. 2020;11:148. [Google Scholar]
- 20.Aizawa M, Kim ZS, Yoshimaru H. Phylogeography of the Korean pine (Pinus koraiensis) in northeast Asia: inferences from organelle gene sequences. J Plant Res. 2012;125:713–23. [DOI] [PubMed] [Google Scholar]
- 21.Wang F, Chen S, Liang DY, Qu GZ, Chen S, Zhao XY. Transcriptomic analyses of Pinus koraiensis under different cold stresses. BMC Genomics. 2020;21:10. [DOI] [PMC free article] [PubMed] [Google Scholar]
- 22.Li Y, Zhao MH, Cai KW, Liu L, Han R, Pei XN, et al. Phytohormone biosynthesis and transcriptional analyses provide insight into the main growth stage of male and female cones Pinus koraiensis. Front Plant Sci. 2023;14:1273409. [DOI] [PMC free article] [PubMed] [Google Scholar]
- 23.Shi SL, Yan SL, Zhao C, Zhang P, Yang L, Wang C et al. Deep sequencing and analysis of transcriptomes of Pinus koraiensis Sieb. & Zucc. Forests. 2020;11:350.
- 24.Wei JT, Li X, Xu HZ, Wang YL, Zang CH, Xu JW, et al. Evaluation of the genetic diversity of Pinus koraiensis by EST-SSR and its management, utilization and protection. For Ecol Manag. 2021;505:119882. [Google Scholar]
- 25.Zhao X, Liu ZL, Jin GZ. Effects of nitrogen addition and leaf age on needle traits and the relationships among traits in Pinus koraiensis. Environ Exp Bot. 2024;223:105795. [Google Scholar]
- 26.Chen Z, Lu X, Xuan Y, Tang F, Wang J, Shi D, et al. Transcriptome analysis based on a combination of sequencing platforms provides insights into leaf pigmentation in Acer rubrum. BMC Plant Biol. 2019;19:240. [DOI] [PMC free article] [PubMed] [Google Scholar]
- 27.Li YX, Zhang XX, Zhu Y, Cai KW, Li HX, Zhao QS, et al. Physiological and transcriptomic analysis revealed the molecular mechanism of Pinus koraiensis responses to light. Int J Mol Sci. 2022;23:13608. [DOI] [PMC free article] [PubMed] [Google Scholar]
- 28.Li X, Li Y, Zhao MH, Hu YB, Meng FJ, Song XS, et al. Molecular and metabolic insights into anthocyanin biosynthesis for leaf color change in Chokecherry (Padus virginiana). Int J Mol Sci. 2021;22:10697. [DOI] [PMC free article] [PubMed] [Google Scholar]
- 29.Wang YZ, Xing ML, Gao XR, Wu M, Liu F, Sun LL, et al. Physiological and transcriptomic analyses reveal that phytohormone pathways and glutathione metabolism are involved in the arsenite toxicity response in tomatoes. Sci Total Environ. 2023;899:165676. [DOI] [PubMed] [Google Scholar]
- 30.Zhao W, Chen ZB, Yang XQ, Sheng LY, Mao H, Zhu SX. Integrated transcriptomics and metabolomics reveal key metabolic pathway responses in Pistia stratiotes under cd stress. J Hazard Mater. 2023;452:131214. [DOI] [PubMed] [Google Scholar]
- 31.Gao JF, Sun Q, Cao CL, Liang ZS, Wang YG. Experimental guidance for plant physiology, first ed, Beijing. 2006.
- 32.Duan YP, Zhang Y, Zhao B. Lead, zinc tolerance mechanism and phytoremediation potential of Alcea rosea (Linn.) Cavan. and Hydrangea macrophylla (Thunb.) Ser. and ethylenediaminetetraacetic acid effect. Environ Sci Pollut R. 2022;29:41329–41343. [DOI] [PubMed]
- 33.Hu HC, Liu YH, He BB, Chen X, Ma L, Luo YL, et al. Integrative physiological, transcriptome, and metabolome analysis uncovers the drought responses of two Zanthoxylum bungeanum cultivars. Ind Crop Prod. 2022;189:115812. [Google Scholar]
- 34.Zhang YY, Song ZY, Zhao HQ, Chen H, Zhao B. Integrative physiological, transcriptomic and metabolomic analysis reveals how the roots of two ornamental Hydrangea macrophylla cultivars cope with lead (pb) toxicity. Sci Total Environ. 2024;910:168615. [DOI] [PubMed] [Google Scholar]
- 35.Li X, Cai KW, Fan ZY, Wang JY, Wang LF, Wang Q, et al. Dissection of transcriptome and metabolome insights into the isoquinoline alkaloid biosynthesis during stem development in Phellodendron amurense (rupr). Plant Sci. 2022;325:111461. [DOI] [PubMed] [Google Scholar]
- 36.Li Y, Xu YJ, Han R, Liu L, Pei XN, Zhao XY. Widely targeted metabolomic profiling combined with transcriptome analysis provides new insights into lipid biosynthesis in seed kernels of Pinus koraiensis. Int J Mol Sci. 2023;24:12887. [DOI] [PMC free article] [PubMed] [Google Scholar]
- 37.Chen S, Zhou Y, Chen Y, Gu L. Fastp: an ultra-fast all-in-one FASTQ preprocessor. Bioinformatics. 2018;34:i884–90. [DOI] [PMC free article] [PubMed] [Google Scholar]
- 38.Grabherr MG, Haas BJ, Yassour M, Levin JZ, Thompson DA, Amit I, et al. Full-length transcriptome assembly from RNA-Seq data without a reference genome. Nat Biotechnol. 2011;29:644–U130. [DOI] [PMC free article] [PubMed] [Google Scholar]
- 39.Buchfink B, Xie C, Huson DH. Fast and sensitive protein alignment using DIAMOND. Nat Methods. 2015;12:59–60. [DOI] [PubMed] [Google Scholar]
- 40.Buchfink B, Reuter K, Drost HG. Sensitive protein alignments at tree-of-life scale using DIAMOND. Nat Methods. 2021;18:366. [DOI] [PMC free article] [PubMed] [Google Scholar]
- 41.Dewey CN, Li B, RSEM. Accurate transcript quantification from rna-seq data with or without a reference genome. BMC Bioinformatics. 2011;12:323. [DOI] [PMC free article] [PubMed] [Google Scholar]
- 42.Love MI, Huber W, Anders S. Moderated estimation of Fold change and dispersion for RNA-seq data with DESeq2. Genome Biol. 2014;15:550. [DOI] [PMC free article] [PubMed] [Google Scholar]
- 43.Varet H, Brillet-Guéguen L, Coppée JY, Dillies MA, SARTools:. A DESeq2- and EdgeR-based r pipeline for comprehensive differential analysis of RNA-seq data. PLoS ONE. 2016;11:e0157022. [DOI] [PMC free article] [PubMed] [Google Scholar]
- 44.Li YX, Zhang TT, Kang YQ, Wang P, Yu WG, Wang J, et al. Integrated metabolome, transcriptome analysis, and multi-flux full-length sequencing offer novel insights into the function of lignin biosynthesis as a Sesuvium portulacastrum response to salt stress. Int J Biol Macromol. 2023;237:124222. [DOI] [PubMed] [Google Scholar]
- 45.Zou SC, Wu JC, Shahid MQ, He YH, Lin SQ, Liu ZH, et al. Identification of key taste components in loquat using widely targeted metabolomics. Food Chem. 2020;323:126822. [DOI] [PubMed] [Google Scholar]
- 46.Huang X, Chu GM, Wang J, Luo HH, Yang ZN, Sun LP, et al. Integrated metabolomic and transcriptomic analysis of specialized metabolites and isoflavonoid biosynthesis in Sophora alopecuroides L. under different degrees of drought stress. Ind Crop Prod. 2023;197:116595. [Google Scholar]
- 47.Livak KJ, Schmittgen TD. Analysis of relative gene expression data using real-time quantitative PCR and the 2–∆∆CT method. Methods. 2001;25:402–8. [DOI] [PubMed] [Google Scholar]
- 48.Wu YQ, Zhang CH, Huang ZJ, Lyu LF, Li WL, Wu WL. Integrative analysis of the metabolome and transcriptome provides insights into the mechanisms of flavonoid biosynthesis in blackberry. Food Res Int. 2022;153:110948. [DOI] [PubMed] [Google Scholar]
- 49.Ju FY, Pang JL, Sun LY, Gu JJ, Wang Z, Wu XY, et al. Integrative transcriptomic, metabolomic and physiological analyses revealed the physiological and molecular mechanisms by which potassium regulates the salt tolerance of cotton (Gossypium hirsutum L.) roots. Ind Crop Prod. 2023;193:116177. [Google Scholar]
- 50.Ashburner M, Ball CA, Blake JA, Botstein D, Cherry JM. Gene ontology: Tool for the unification of biology. The gene ontology consortium. Nat Genet. 2000;25:25–9. [DOI] [PMC free article] [PubMed] [Google Scholar]
- 51.Bag P, Lihavainen J, Delhomme N, Riquelme T, Robinson KM, Jansson S. An atlas of the Norway spruce needle seasonal transcriptome. Plant J. 2021;108:1815–29. [DOI] [PubMed] [Google Scholar]
- 52.Zhang Q, Wang LL, Liu ZG, Zhao ZH, Zhao J, Wang ZT, et al. Transcriptome and metabolome profiling unveil the mechanisms of Ziziphus jujuba Mill. Peel coloration. Food Chem. 2020;312:125903. [DOI] [PubMed] [Google Scholar]
- 53.Deikman J, Hammer PE. Induction of anthocyanin accumulation by cytokinins in Arabidopsis thaliana. Plant Physiol. 1995;108:47–57. [DOI] [PMC free article] [PubMed] [Google Scholar]
- 54.Qi XY, Chen SS, Wang HD, Feng J, Chen HJ, Qin ZY, et al. Comparative physiology and transcriptome analysis reveals that chloroplast development influences silver–white leaf color formation in Hydrangea macrophylla var. Maculate. BMC Plant Biol. 2022;22:345. [DOI] [PMC free article] [PubMed] [Google Scholar]
- 55.Luo T, Luo S, Araújo WL, Schlicke H, Rothbart M, Yu J, et al. Virus-induced gene silencing of pea CHLI and CHLD affects tetrapyrrole biosynthesis, chloroplast development and the primary metabolic network. Plant Physiol Bioch. 2013;65:17–26. [DOI] [PubMed] [Google Scholar]
- 56.Campen JC, Yaapar MN, Narawatthana S, Lehmeier C, Wanchana S, Thakur V, et al. Combined chlorophyll fluorescence and transcriptomic analysis identifies the P3/P4 transition as a key stage in rice leaf photosynthetic development. Plant Physiol. 2016;170:1655–74. [DOI] [PMC free article] [PubMed] [Google Scholar]
- 57.Reinbothe S, Pollmann S, Springer A, James RJ, Tichtinsky G, Reinbothe C. A role of Toc33 in the protochlorophyllide-dependent plastid import pathway of NADPH: protochlorophyllide oxidoreductase (POR) A. Plant J. 2005;42:1–12. [DOI] [PubMed] [Google Scholar]
- 58.Zhang JC, Tao NG, Xu Q, Zhou WJ, Cao HB, Xu JA, et al. Functional characterization of Citrus PSY gene in Hongkong kumquat (Fortunella hindsii Swingle). Plant Cell Rep. 2009;28:1737–46. [DOI] [PubMed] [Google Scholar]
- 59.Chen ZQ, Liu Y, Yin YJ, Liu Q, Li N, Li X, et al. Expression of AtGA2ox1 enhances drought tolerance in maize. Plant Growth Regul. 2019;89:203–15. [Google Scholar]
- 60.Lei HX, Zhang HF, Zhang ZH, Sun H, Li MJ, Shao C, et al. Physiological and transcriptomic analyses of roots from Panax ginseng C. A. Meyer under drought stress. Ind Crop Prod. 2023;191:115858. [Google Scholar]
- 61.Zhang XS, Zeng QH, Yang Q, Luo XL, Feng Y, Wang Q, et al. DgHDA6 enhances the cold tolerance in chrysanthemum by improving ROS scavenging capacity. Ecotox Environ Safe. 2024;269:115737. [DOI] [PubMed] [Google Scholar]
- 62.Shi PB, Gu MF. Transcriptome analysis and differential gene expression profiling of two contrasting quinoa genotypes in response to salt stress. BMC Plant Biol. 2020;20:568. [DOI] [PMC free article] [PubMed] [Google Scholar]
- 63.Yu YL, Qiu HH, Wang HF, Wang CC, He CM, Xu MF, et al. Melatonin improves saponin biosynthesis and primary root growth in Psammosilene tunicoides hairy roots through multiple hormonal signaling and transcriptional pathways. Ind Crop Prod. 2023;200:116819. [Google Scholar]
- 64.Zhao C, He YC, Yu Y, Zhou MQ, Zhao LF, Xia XY, et al. Transcriptomic analysis of seasonal gene expression and regulation during xylem development in Shanxin Hybrid Poplar (Populus davidiana × Populus bolleana). Forests. 2021;12:451. [Google Scholar]
- 65.Hu XG, Zhuang HB, Lin EP, Borah P, Du MQ, Gao SY, et al. Full-length transcriptome sequencing and comparative transcriptomic analyses provide comprehensive insight into molecular mechanisms of cellulose and lignin biosynthesis in Cunninghamia lanceolata. Front Plant Sci. 2022;13:883720. [DOI] [PMC free article] [PubMed] [Google Scholar]
- 66.Guo FY, Yu WW, Fu FF, Hou HF, Zhang JJ, Guo J, et al. Physiological, transcriptome and metabolome analyses provide molecular insights to seasonal development in Ginkgo biloba xylem. Ind Crop Prod. 2024;208:117930. [Google Scholar]
- 67.Li X, Han R, Cai KW, Guo RX, Pei XN, Zhao XY. Characterization of phytohormones and transcriptomic profiling of the female and male inflorescence development in Manchurian Walnut (Juglans mandshurica Maxim). Int J Mol Sci. 2022;23:5433. [DOI] [PMC free article] [PubMed] [Google Scholar]
- 68.Rubio S, Noriegaa X, P´erez FJ. ABA promotes starch synthesis and storage metabolism in dormant grapevine buds. J Plant Physiol. 2019; 234–5: 1–8. [DOI] [PubMed]
- 69.Zhang SQ, Klessig DF. MAPK cascades in plant defense signaling. Trends Plant Sci. 2001;6:520–7. [DOI] [PubMed] [Google Scholar]
- 70.Nakagami H, Pitzschke A, Hirt H. Emerging MAP kinase pathways in plant stress signalling. Trends Plant Sci. 2005;10:339–46. [DOI] [PubMed] [Google Scholar]
Associated Data
This section collects any data citations, data availability statements, or supplementary materials included in this article.
Supplementary Materials
Data Availability Statement
The datasets generated and analysed during the current study are available in this article and its supplementary information files. All raw RNA-seq data have been uploaded to NCBI under BioProject ID PRJNA1139366.


