Abstract
Background
Oscillometry devices allow quantification of respiratory function at tidal breathing but device-specific reference equations are scarce: the present study aims to create sex-specific oscillometric reference values for children and adolescents using the Resmon PRO FULL device.
Methods
Healthy participants (n=981) aged 6 to 17 years of the Austrian LEAD general population cohort were included. Subjects had normal weight (body mass index ≤99th percentile) and normal lung volumes (total lung capacity (TLC) ≥ lower limit of normal). Oscillometry data were collected using a single frequency mode of 8 Hz. Sex-specific prediction equations were developed for total, inspiratory and expiratory resistance (R) and reactance (X) as well as for the modulus of impedance (Z) value using the LMS (lambda, mu, sigma) method. Height was used as a single covariate.
Results
Reference equations for all oscillometry parameters were created for Caucasian children aged 6 to 17 years with a height span from 101 to 183 cm and a lung volume span from 1.7 to 8.8 L TLC. R and Z values progressively decrease and X values increase with increasing height. Oscillometry parameters versus lung volume curves differ from those versus height curves. Stratified for lung size, no sex differences are found for oscillometry parameters.
Conclusion
Our study provides reference values for oscillometry parameters in children and adolescents using strictly defined criteria for weight and lung volumes. No sex-related differences in oscillometry parameters corrected for height or lung size are found.
Shareable abstract
This study provides sex-specific oscillometry reference values for children and adolescents aged 6–17 years https://bit.ly/3Wd0dSy
Introduction
Oscillometry also known as forced oscillation technique is a noninvasive method to measure respiratory impedance (Zrs) by applying small-amplitude pressure oscillations during spontaneous breathing [1, 2]. Zrs is usually presented by the resistive properties of the respiratory system or resistance (R) and the elastic and inertial properties of the system or reactance (X) [3]. This technique is well suited to assess respiratory mechanics especially in young children [4].
The applicability of existing reference equations remains problematic due to differences in measurement and computational techniques across different devices and manufacturers and due to small cohorts and differences in ethnicity [4]. Initial small-scale studies report that R changes inversely with height independent of sex [5]. The negative frequency dependence of R becomes more pronounced with decreasing age [5]. By applying impulse oscillometry, it was also reported that R was negatively and X positively correlated with height [6–8]. However, large population-based studies providing reliable reference values based on standardised methodology are highly recommended to improve clinical applicability of oscillometry in children and adolescents.
The aim of this study is to establish reference values for oscillometry in a large cohort of healthy children and adolescents in the age range of 6 to 17 years, taking into account lung size. In addition, we aimed to investigate the relationship between Zrs and total lung capacity (TLC).
Methods
We conducted a cross-sectional study using data of the Austrian LEAD (Lung, hEart, sociAl, boDy) Study. A detailed description of the study has been published previously [9]. Oscillometry measurements conducted in children and adolescents aged 6–17 years between November 2017 and October 2021 were used for the current analysis. Care was taken to ensure that no coronavirus SARS-CoV-2 infections from the declared pandemic from 2020 to 2023 were included. The LEAD Study was approved by the ethics committee of Vienna (EK-11-117-0711; NCT01727518). Informed consent was obtained from parents or legal representatives.
Study subjects
Included participants fulfilled the following inclusion criteria: absence of respiratory symptoms (including coughing, sputum production, breathlessness, wheezing, dyspnoea, symptoms of asthma); doctor's diagnosis of any chronic respiratory disease (including asthma, allergy and chronic bronchitis); and never-smoking. All these parameters were assessed by questionnaires. Additionally valid lung volume measurements by body plethysmography were obtained in each participant [10, 11]. Participants with a TLC less than lower limit of normal (LLN) (Global Lung Function Initiative) were excluded as well as those with a body mass index (BMI) >35 kg·m−2 and a BMI >99th percentile [8, 9].
Measurements
Impedance measurement
Z, R and X were measured at 8 Hz with the Resmon PRO FULL® Forced Oscillation Technique device (Restech srl, Milan, Italy) according to European Respiratory Society (ERS) technical standards [3]. Each participant sat upright on a chair and wore a nose clip. The mouthpiece was firmly enclosed and the patient's cheeks were supported by the technician [3]. The mean values of inspiratory, expiratory and total resistance (R) and reactance (X) parameters as well as the total impedance (Z) were determined. At least 10 artefact-free breaths automatically selected by the oscillometry device were analysed after excluding the first three breathing cycles, ensuring a recording time >30 s for breathing frequencies up to 20 breaths·min−1 as well as the inclusion of only complete breathing cycles. The device performs automatic quality control of breathing cycles and excludes those caused by inefficient breathing or coughing. For reasons of data quality, Rtot measurements with a coefficient of variation (CoV) >0.3 and an absolute value <1 were removed to exclude measurement artefacts.
Lung volume measurement
TLC was measured by whole body plethysmography (BT-MasterScope Body 0478, Jaeger, Germany; SentrySuite software version 3.20.1). Calibration of the body plethysmograph was carried out daily using a 3-L syringe. Lung volume indices were expressed in body temperature pressure saturated conditions. TLC resulted from adding the best achieved vital capacity to residual volume. All measurements were carried out according to international guidelines by trained technicians according to standard operating procedures [10]. The reference values used were those published by the Global Lung Function Initiative (GLI) [11, 12].
Body composition
BMI was calculated by weight (kg)/height (m2). Body weight was measured by a scale and height was measured in metres.
Statistical analysis
SPSS statistics version 27 from International Business Machines Corporation (IBM) and R version 4.3.1 (The R Foundation for Statistical Computing, Vienna, Austria) were used for the analyses. Mean±sd for metric and ordinal variables and absolute and relative values for categorical variables were used to calculate descriptive statistics. Comparisons of baseline characteristics between males and females were calculated with t-test for continuous or metrically scaled variables and with chi-square/Mann–Whitney U test for ordinally scaled variables to test for potential sex differences. Zrs parameters of male and female children and adolescents were compared by t-test corrected for both height and TLC. For the height-corrected comparisons, six groups were created, each with 10-cm ranges. For the TLC-corrected comparisons, eight groups were generated, each with 0.5-L ranges. These ranges were chosen to keep the respective range as small as possible and still allow a reasonable display.
Pearson correlation coefficients and collinearity tests for the parameters age, weight, BMI and height regarding all oscillometry parameters were performed. Height clearly showed the strongest correlation indices for both sexes. Therefore, height was applied as a single covariate. This is also in line with previous literature [13–15]. Individual z-scores and reference values resulting in look up tables and percentile curves were created.
Percentile curves and look up tables for oscillometry parameters were created using the lambda, mu, sigma (LMS) method described by Cole and Green [16] (see supplementary material). The parameter curves (L, M and S) of the selected LMS model were used to construct percentile curves (5th, 10th, 50th, 90th and 95th) for the original data [16]. By using the variable-specific parameters L, M and S, individuals’ z-scores of each Zrs parameter can be calculated using the following formula:
 |
Since X almost always occurs in the range of negative values, it was necessary to preliminarily shift all X parameters with the following function: f(x)=X × (−1)+0.1.
To assess the susceptibility of the derived equations to measurement artefacts, we conducted a sensitivity analysis to analyse the effects of breathing flow and residual artefacts not filtered by the device (see supplementary material).
The created reference values of the current study were compared with the existing ones from Ducharme et al. 2022 [17].
Results
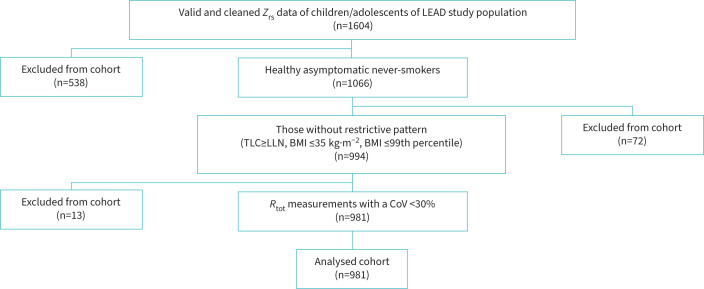
Valid oscillometry data were collected from 1604 children and adolescents of the Austrian LEAD Study cohort: figure 1 summarises the flow chart to finally include 981 children and adolescents, of whom 335 (34.1%) were male and 646 (65.9%) were female. The baseline characteristics can be found in table 1. The distribution of participants according to age, height and TLC is illustrated in supplementary figure S1. A height span between 101 cm and 183 cm is covered; TLC ranged from 1.7 L to 8.8 L.
FIGURE 1.
Flow chart of sample size used in the analysis. Zrs: respiratory impedance; R: respiratory resistance; Rtot: respiratory resistance (total part); TLC: total lung capacity; LLN: lower limit of normal; BMI: body mass index; CoV: coefficient of variation.
TABLE 1.
Baseline characteristics children and adolescents
| Parameter | Total | Males | Females | p-value |
|---|---|---|---|---|
| Subjects, n (%) | 981 (100) | 335 (34.1) | 646 (65.9) | - |
| Age years | 10.0±2.6 | 10.3±2.7 | 9.9±2.6 | 0.01 |
| Height cm | 140.3±15.7 | 143.0±16.7 | 138.9±15.0 | <0.001 |
| Weight kg | 35.9±13.4 | 38.0±14.6 | 34.9±12.6 | <0.001 |
| BMI kg·m−2 | 17.6±3.1 | 17.8±3.1 | 17.5±3.1 | 0.056 |
| Lung function values | ||||
| X8 insp | −1.3±0.8 | −1.2±0.7 | −1.4±0.9 | 0.001 |
| X8 exp | −2.0±1.5 | −2.0±1.6 | −2.0±1.4 | 0.319 |
| X8 tot | −1.7±1.1 | −1.7±1.1 | −1.7±1.1 | 0.590 |
| R8 insp | 5.6±1.8 | 5.3±1.7 | 5.7±1.9 | <0.001 |
| R8 exp | 6.5±2.2 | 6.3±2.2 | 6.6±2.2 | 0.034 |
| R8 tot | 6.1±2.0 | 5.8±2.0 | 6.2±2.0 | 0.006 |
| Z8 tot | 6.3±2.2 | 6.1±2.2 | 6.5±2.2 | 0.017 |
| TLC % pred | 117.8±16.1 | 115.9±17.1 | 118.8±15.5 | 0.011 |
| FVC % pred | 105.5±12.3 | 104.9±13.2 | 105.8±11.8 | 0.256 |
| FEV1 % pred | 104.9±12.1 | 105.0±12.6 | 104.8±11.9 | 0.887 |
| FEV1/FVC % pred | 99.0±6.6 | 99.7±6.9 | 98.6±6.4 | 0.011 |
Data are presented as mean±sd unless indicated otherwise. X, R and Z parameters measured in cmH2O·L−1·s−1; TLC, FVC, FEV1 measured in litres. BMI: body mass index; X8 insp: inspiratory reactance at 8 Hz; X8 exp: expiratory reactance at 8 Hz; X8 tot: total reactance at 8 Hz; R8 insp: inspiratory resistance at 8 Hz; R8 exp: expiratory resistance at 8 Hz; R8 tot: total resistance at 8 Hz; Z8 tot: total impedance (overall impedance) at 8 Hz; TLC: total lung capacity; FVC: forced vital capacity; FEV1: forced expiratory volume in 1 s.
Figure 2 illustrates the curvilinear relationship between TLC and height stratified by sex (r2=0.808 for males, r2=0.798 for females). In general, TLC was slightly higher in males than in females in absolute values (4.0±1.3 L in males versus 3.5±1.0 L in females, p<0.001), whereas TLC was significantly higher in females in terms of % predicted values (115.9±17.1 in males versus 118.8±15.5 in females, p=0.011).
FIGURE 2.
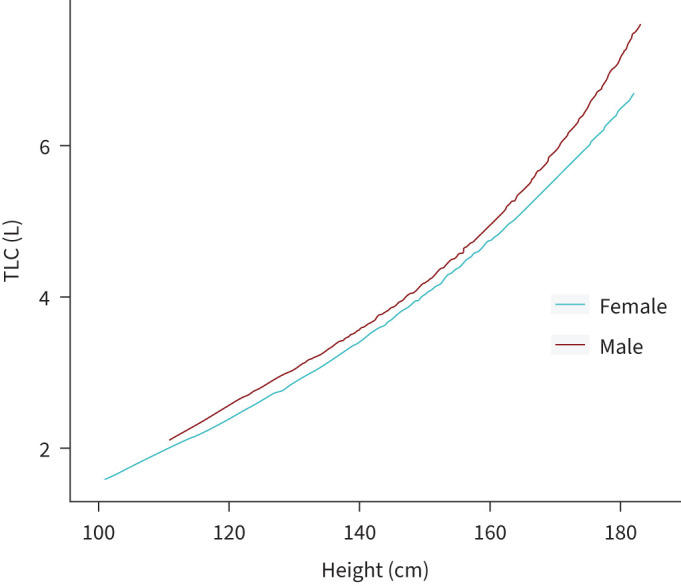
Relationship between TLC and height stratified by sex. r2=0.808 for boys, r2=0.798 for girls. TLC: total lung capacity.
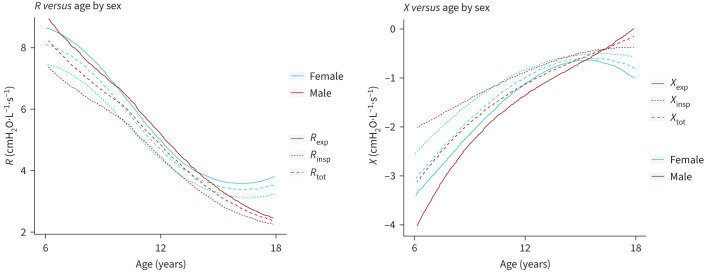
R and X in relation to age stratified for sex is illustrated in figure 3. R progressively decreases with age while X increases. Remarkedly, while R and X flattens in older boys, the opposite was found in girls.
FIGURE 3.
Relationship between Rrs/Xrs and age stratified by sex. R: respiratory resistance; X: respiratory reactance; Rrs: respiratory resistance; Xrs: respiratory reactance; Rexp: expiratory resistance; Rinsp: inspiratory resistance; Rtot: total resistance; Xexp: expiratory reactance; Xinsp: inspiratory reactance; Xtot: total reactance.
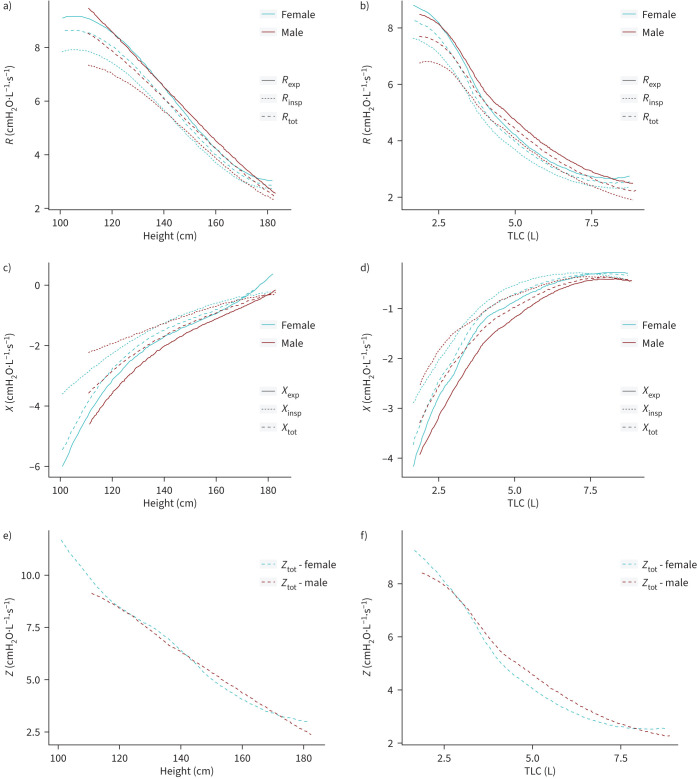
The relationship between R, X and Z and height and TLC stratified by sex is illustrated in figure 4a–f. Rtot, Rinsp and Rexp as well as Ztot decrease with increasing height, whereas Xtot, Xinsp and Xexp increase with increasing height. Notably is the more curvilinear relationship between R and Ztot and TLC with the onset of a slight flattening of R and Ztot above a TLC >5 L, with a more hyperbolic relationship between X and TLC with the onset of a slight flattening of the curve above TLC starting from 7.5 L. Accordingly, while Z linearly decreases with height, figure 4f confirms the curvilinear pattern between Z and TLC.
FIGURE 4.
Relationship between R, X and Z and height and TLC stratified by sex. a) Rexp, Rinsp, Rtot versus height (cm) by sex, b) Rexp, Rinsp, Rtot versus TLC (L) by sex, c) Xexp, Xinsp, Xtot versus height (cm) by sex, d) Xexp, Xinsp, Xtot versus TLC (L) by sex, e) Ztot versus height (cm) by sex, and f) Ztot versus TLC (L) by sex. R: respiratory resistance; X: respiratory reactance; Rrs: respiratory resistance; Xrs: respiratory reactance; Rexp: expiratory resistance; Rinsp: inspiratory resistance; Rtot: total resistance; Xexp: expiratory reactance; Xinsp: inspiratory reactance; Xtot: total reactance; TLC: total lung capacity; Ztot: total impedance.
Examining sex-related differences in X and R, no differences were found after stratification for different height and lung size strata (supplementary table S1 and S2). Only in the 120–130 cm height group, there was a significant difference for Xinsp while Xexp differed for a lung size between 2 and 2.5 L.
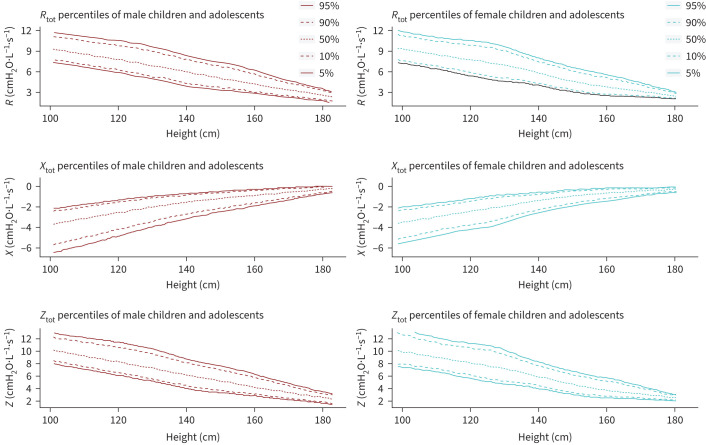
Figure 5 shows centiles of height adapted reference values for R, X and Z for boys and girls. Look up tables for every parameter in a range from 101 to 183 cm showing the percentiles and the L, M and S values to calculate individual z-scores are presented in supplementary tables S3–S16. The Pearson correlation coefficient of age, weight, BMI and height with all oscillometry parameters showed the highest correlation for height (age=0.67, weight=0.59, BMI=0.36, height=0.69). A detailed overview of all Pearson correlation coefficients can be found in supplementary table S17.
FIGURE 5.
Centiles of height adapted reference values for Rtot, Xtot and Ztot for male and female children and adolescents. X parameters were preliminarily shifted with the following function: f(x)=X × (−1)+0.1. Rtot: total resistance at 8 Hz; Xtot: total reactance at 8 Hz; Ztot: total impedance (overall impedance) at 8 Hz.
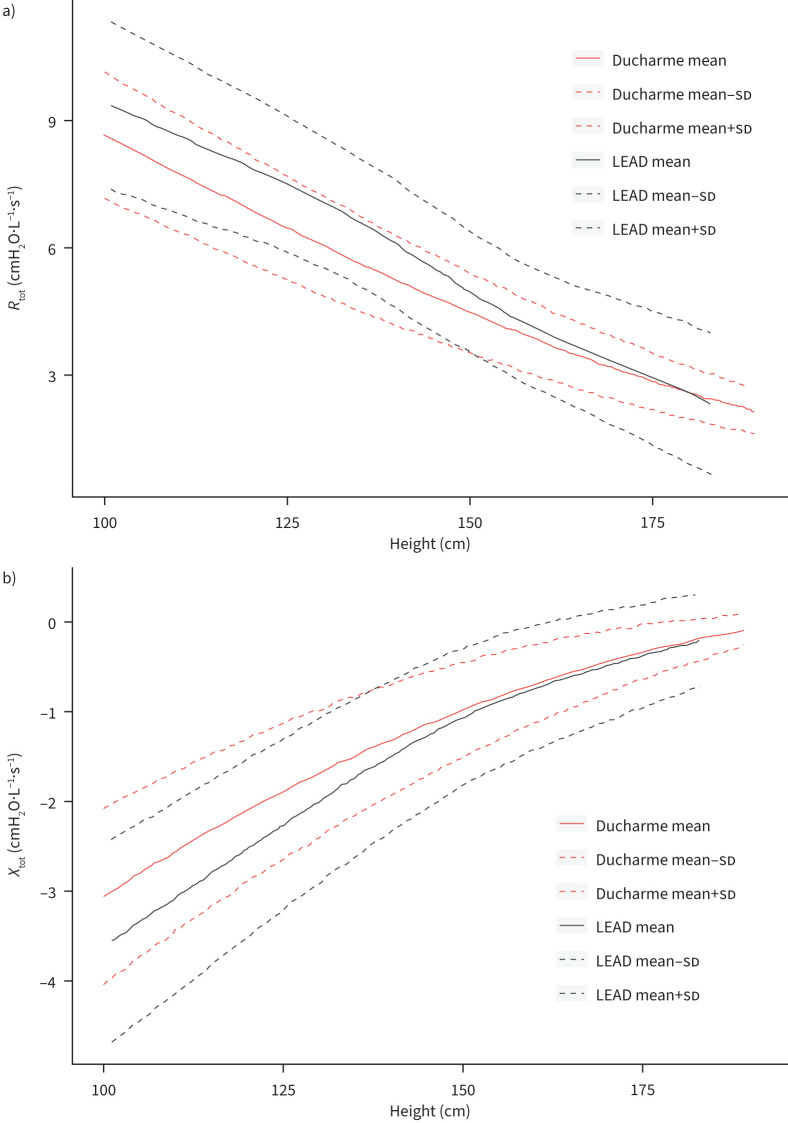
In figure 6 the comparison between mean and sd of the oscillometry reference values from the current LEAD cohort and those from Ducharme et al. 2022 are depicted. Mean values of R and X are markedly higher and lower, respectively, between 100 and 150 cm of height. Supplementary figure S2 summarises the reference values of Ducharme et al. from 2022 applied to the current cohort. Calculations show 1.4% below the LLN and 22.1% above the upper limit of normal (ULN) for Rtot values and 0.4% below the LLN and 14.8% above the ULN for Xtot values.
FIGURE 6.
Comparison of mean and sd of a) Rtot and b) Xtot parameters at 8 Hz of the current reference values and those from already published reference values (Ducharme et al. 2022 [17]). Rtot: total resistance; Xtot: total reactance.
Discussion
The current study presents reference values for total, inspiratory and expiratory R and X parameters and total Z at 8 Hz derived from a large cohort of well-characterised children and adolescents. All R values decrease, and X values increase with increasing age, height and lung size. R and X values versus TLC show a more curvilinear and hyperbolic relationship respectively in comparison with height. The pattern of R versus height and TLC is confirmed by analysis of Z. No sex-related differences in R and X values were found when corrected for height or lung size except for Xinsp and Xexp at lowest height and lowest lung size respectively.
Reference equations of different ethnical cohorts for children and adolescents have been published before. In general, studies differ in applied methodology and frequency spectrum and reference data are derived from small cohorts and participants of a specific ethnicity. De et al. [18] reported reference equations using a multi-frequency mode consisting of 5, 11 and 19 Hz. Calogero et al. [19] reported reference equations for total R and X at 6, 8 and 10 Hz in 163 Italian children from an age of 2.9 to 6.1 years applying a pseudo-random noise signal between 4 and 48 Hz. The authors recommended reporting R and X at a single frequency of 8 Hz because these data can be collected reproducibly in a very short term in the majority of children. Ducharme et al. reported device-specific reference equations data from 299 asymptomatic multi-ethnic Canadian children and adolescents aged 3 to 17 years with a BMI <97th percentile: significant within-person differences were found for two devices justifying the need for derivation of device-specific reference equations [17]. To analyse the effects of high expiratory flows (>18 L·min−1) and coefficients of variation (Xtot_sd/abs(Ztot_mean) >30%) reference equations were compared with and without these values (see supplementary material). Minimal to no affection of the prediction equations is observable. However, the created curves are susceptible to border effects at low heights due to a lower number of datapoints.
The current study examined a cohort from Austria with a mixture of rural and urban populations in an age range of 6 to 17 years with a single measurement frequency of 8 Hz. Compared with the Ducharme equations, a high number of our participants lie above the ULN (14.8% for Xtot and 22.1% for Rtot). The differences with the Ducharme equations may be due to several factors including genetic and enviromental factors. Future studies should use the equations obtained on the most similar population as stated in the technical standards for oscillometry [3].
Single measurements with a frequency of 8 Hz for all oscillometry parameters were used to achieve easier discrimination between respiratory rate and stimulation frequency and to ensure a good signal-to-noise ratio in a cohort with higher respiratory rates and smaller lungs caused by the proportion of children included. There is currently no generally accepted recommendation for specific frequencies for specific age groups [3]. However, it is recommended to choose a frequency appropriate to the cohort and their respiratory rate [3]. As the mean age of our cohort was 10.6 years and most of our participants were 11 years old and younger (76%), we decided to choose a frequency that seemed appropriate primarily for children. This approach has also been used in previously performed oscillometry analyses in children [17, 20]. Despite the good fit between the frequency chosen and the cohort studied, it should be noted that by using a single frequency, frequency dependence could not be determined. However, by recording R in combination with X, a comprehensive recording of the respiratory tract and its function is ensured. Reference values were created not only for total but also for inspiratory and expiratory parameters. This offers the possibility to analyse the breathing cycle even more selectively since the R and X can be recorded individually over the whole breathing cycle or only during inhalation or exhalation. By recording the inspiratory and expiratory phases separately, pathophysiological mechanisms can probably be detected and interpreted in a more differentiated manner [21–23].
This study is the first to include lung volume measurements measured by body plethysmography and compares R, X and Z versus height and lung size. Intriguingly, while R and Z showed a progressive decrease and X a progressive increase with height, this relationship markedly differs with lung size: R and Z show a more curvilinear and X a more hyperbolic curve versus TLC starting from a lung volume between 5 and 7.5 L. Data of volume or age cut-offs for dysanaptic growth or airway morphometry are limited. Comparing the ratio of flow measurements, reflecting airway growth, and TLC, reflecting lung growth, Hibbert et al. [24] reported that in the age span between 12 and 20 years TLC increased more than expiratory flow, suggesting increased dysanaptic growth. Combined, our data could indicate a dis-congruency between lung growth and changes in airway dimensions starting from a threshold lung volume of around 5 L.
Interesting is the finding of absence of differences in oscillometry parameters between males and females after correction for height and TLC. Indeed, it is still generally assumed that airways and lung dimensions are significantly different between males and females. Mead [25] showed that the ratio of maximal expiratory flow divided by the static recoil pressure at 50% of vital capacity was smaller at a given size between males and females indicating that females have smaller airways relative to lung size than men. These data were confirmed by direct measurement of the tracheal area using an acoustic reflection technique or chest radiograph [26, 27]. Using computed tomography, larger airway dimensions are reported in men and current smokers besides ethnicity without correction for lung size or height [28].
Corrected for height and TLC, reactance curves behave similarly between males and females: reactance progressively increases with height and lung growth. Originally, it was reported that X was significantly lower at all ages between males and females [29]. As X reflects the apparent elasticity of the total communicating lung volume and is sensitive to peripheral airway closure, our data indicate progressive changes in the peripheral airway compartment with growing of the lungs.
In current clinical practice, reference values of Z are usually expressed by the real part of Z (R) and the imaginary part of Z (X). As Z reflects the total opposition posed in an alternative current circuit and contains resistant as well as reactive forces, it seems logical to evaluate Z of the respiratory system at a certain frequency on itself. Here we report reference values for children and adolescents. Z behaves in a very similar way to R in terms of height and lung size. Further studies should analyse the diagnostic accuracy of Z versus R and/or X.
Some strengths and limitations of our study need to be considered. First, only single measurements of oscillometry were performed of 10 acceptable breaths and not triplicate measurements as stated by the ERS recommendations [4]. This study was largely conducted prior to publishing those recommendations. Second, a CoV <0.3 of Rtot for within measurements was applied instead of the recommended CoV <0.15 for between measurements in children. We chose this approach to still comply with the ERS Task Force recommendation to exclude outliers with significantly higher variability. Third, participants younger than 6 years of age were not included in the study because of the Austrian LEAD Study inclusion protocol. Fourth, the LEAD study cohort largely reflects a European ancestry. Fifth, respiratory symptoms as well as history of respiratory diseases were collected with questionnaires. It is crucial to note that our prediction curves are susceptible to border effects at low heights. The limited number of data with a height <115 cm makes this part of the curves more sensitive to slight changes. Therefore, careful consideration of these factors is imperative when applying these equations to children smaller than 115 cm. The strength of our study is certainly the size of the study as well as the in-depth characterisation using body plethysmography as well as strictly defined body weight criteria.
Conclusion
In summary, this study provides reference values for clinically useful oscillometry parameters for children and adolescents aged 6 to 17 years using the Resmon PRO FULL® device for respiratory sinusoidal oscillometry. To the best of our knowledge, this is the largest study in terms of an enrolled cohort investigating oscillometry reference values in children and adolescents and the relation between oscillometry measurements and lung volumes.
Supplementary material
Please note: supplementary material is not edited by the Editorial Office, and is uploaded as it has been supplied by the author.
Supplementary material 00278-2024.SUPPLEMENT (3.5MB, pdf)
Footnotes
Provenance: Submitted article, peer reviewed.
Conflict of interest: P.P. Pompilio and A. Gobbi are co-founders and serve as board members of RESTECH s.r.l., a company that designs, manufactures and sells devices for lung function testing based on the forced oscillation technique. The other authors have nothing to declare.
Support statement: The Austrian LEAD Study is supported by the Ludwig Boltzmann Society, the Municipal Department of Health and Environment of Vienna, the Federal State Governmental Department of Health of Lower Austria, and unrestricted scientific grants from AstraZeneca, Boehringer Ingelheim, Chiesi Pharma, GlaxoSmithKline and Menarini Pharma. None of the supporting parties had any participation in the data, nor did they contribute to the design or the content of the present manuscript. Funding information for this article has been deposited with the Crossref Funder Registry.
References
- 1.Dandurand RJ, Lavoie J-P, Lands LC, et al. Comparison of oscillometry devices using active mechanical test loads. ERJ Open Res 2019; 5: 00160-2019. doi: 10.1183/23120541.00160-2019 [DOI] [PMC free article] [PubMed] [Google Scholar]
- 2.Sly PD, Shackleton C, Czovek D, et al. Systematic error in respiratory impedance using commercial equipment calibrated according to the manufacturer's instructions. Am J Respir Crit Care Med 2018; 197: 532–534. doi: 10.1164/rccm.201704-0713LE [DOI] [PubMed] [Google Scholar]
- 3.King GG, Bates J, Berger KI, et al. Technical standards for respiratory oscillometry. Eur Respir J 2020; 55: 1900753. doi: 10.1183/13993003.00753-2019 [DOI] [PubMed] [Google Scholar]
- 4.Kaminsky DA, Simpson SJ, Berger KI, et al. Clinical significance and applications of oscillometry. Eur Respir Rev 2022; 31: 210208. doi: 10.1183/16000617.0208-2021 [DOI] [PMC free article] [PubMed] [Google Scholar]
- 5.Oostveen E, MacLeod D, Lorino H, et al. The forced oscillation technique in clinical practice: methodology, recommendations and future developments. Eur Respir J 2003; 22: 1026–1041. doi: 10.1183/09031936.03.00089403 [DOI] [PubMed] [Google Scholar]
- 6.Kastelik JA, Aziz I, Ojoo JC, et al. Evaluation of impulse oscillation system: comparison with forced oscillation technique and body plethysmography. Eur Respir J 2002; 19: 1214–1215. doi: 10.1183/09031936.02.01922001 [DOI] [PubMed] [Google Scholar]
- 7.Frei J, Jutla J, Kramer G, et al. Impulse oscillometry: reference values in children 100 to 150 cm in height and 3 to 10 years of age. Chest 2005; 128: 1266–1273. doi: 10.1378/chest.128.3.1266 [DOI] [PubMed] [Google Scholar]
- 8.Park JH, Yoon JW, Shin YH, et al. Reference values for respiratory system impedance using impulse oscillometry in healthy preschool children. Korean J Pediatr 2011; 54: 64–68. doi: 10.3345/kjp.2011.54.2.64 [DOI] [PMC free article] [PubMed] [Google Scholar]
- 9.Breyer-Kohansal R, Hartl S, Burghuber OC, et al. The LEAD (Lung, Heart, Social, Body) study: objectives, methodology, and external validity of the population-based cohort study. J Epidemiol 2019; 29: 315–324. doi: 10.2188/jea.JE20180039 [DOI] [PMC free article] [PubMed] [Google Scholar]
- 10.Miller MR, Hankinson J, Brusasco V, et al. Standardisation of spirometry. Eur Respir J 2005; 26: 319–338. doi: 10.1183/09031936.05.00034805 [DOI] [PubMed] [Google Scholar]
- 11.Quanjer PH, Stanojevic S, Cole TJ, et al. Multi-ethnic reference values for spirometry for the 3–95-yr age range: the global lung function 2012 equations. Eur Respir J 2012; 40: 1324–1343. doi: 10.1183/09031936.00080312 [DOI] [PMC free article] [PubMed] [Google Scholar]
- 12.Hall GL, Filipow N, Ruppel G, et al. Official ERS technical standard: Global Lung Function Initiative reference values for static lung volumes in individuals of European ancestry. Eur Respir J 2021; 57: 2000289. doi: 10.1183/13993003.00289-2020 [DOI] [PubMed] [Google Scholar]
- 13.Ducharme FM, Davis GM, Ducharme GR. Pediatric reference values for respiratory resistance measured by forced oscillation. Chest 1998; 113: 1322–1328. doi: 10.1378/chest.113.5.1322 [DOI] [PubMed] [Google Scholar]
- 14.Gochicoa-Rangel L, Torre-Bouscoulet L, Martínez-Briseño D, et al. Values of impulse oscillometry in healthy Mexican children and adolescents. Respir Care 2015; 60: 119–127. doi: 10.4187/respcare.03374 [DOI] [PubMed] [Google Scholar]
- 15.Dencker M, Malmberg LP, Valind S, et al. Reference values for respiratory system impedance by using impulse oscillometry in children aged 2–11 years. Clin Physiol Funct Imaging 2006; 26: 247–250. doi: 10.1111/j.1475-097X.2006.00682.x [DOI] [PubMed] [Google Scholar]
- 16.Cole TJ, Green PJ. Smoothing reference centile curves: the LMS method and penalized likelihood. Stat Med 1992; 11: 1305–1319. doi: 10.1002/sim.4780111005 [DOI] [PubMed] [Google Scholar]
- 17.Ducharme FM, Smyrnova A, Lawson CC, et al. Reference values for respiratory sinusoidal oscillometry in children aged 3 to 17 years. Pediatr Pulmonol 2022; 57: 2092–2102. doi: 10.1002/ppul.25984 [DOI] [PubMed] [Google Scholar]
- 18.De S, Banerjee N, Tiwari RR. Regression equations of respiratory impedance measured by forced oscillation technique for Indian children. Indian J Pediatr 2019; 37: 30–36. [DOI] [PubMed] [Google Scholar]
- 19.Calogero C, Parri N, Baccini A, et al. Respiratory impedance and bronchodilator response in healthy Italian preschool children. Pediatr Pulmonol 2010; 45: 1086–1094. doi: 10.1002/ppul.21292 [DOI] [PubMed] [Google Scholar]
- 20.Zannin E, Nyilas S, Ramsey KA, et al. Within-breath changes in respiratory system impedance in children with cystic fibrosis. Pediatr Pulmonol 2019; 54: 737–742. doi: 10.1002/ppul.24281 [DOI] [PubMed] [Google Scholar]
- 21.Paredi P, Goldman M, Alamen A, et al. Comparison of inspiratory and expiratory resistance and reactance in patients with asthma and chronic obstructive pulmonary disease. Thorax 2010; 65: 263–267. doi: 10.1136/thx.2009.120790 [DOI] [PubMed] [Google Scholar]
- 22.Johnson MK, Birch M, Carter R, et al. Measurement of physiological recovery from exacerbation of chronic obstructive pulmonary disease using within-breath forced oscillometry. Thorax 2007; 62: 299–306. doi: 10.1136/thx.2006.061044 [DOI] [PMC free article] [PubMed] [Google Scholar]
- 23.Downie SR, Salome CM, Verbanck S, et al. Effect of methacholine on peripheral lung mechanics and ventilation heterogeneity in asthma. J Appl Physiol 2013; 114: 770–777. doi: 10.1152/japplphysiol.01198.2012 [DOI] [PubMed] [Google Scholar]
- 24.Hibbert M, Lannigan A, Raven J, et al. Gender differences in lung growth. Pediatr Pulmonol 1995; 19: 129–134. doi: 10.1002/ppul.1950190208 [DOI] [PubMed] [Google Scholar]
- 25.Mead J. Dysanapsis in normal lungs assessed by the relationship between maximal flow, static recoil, and vital capacity. Am Rev Respir Dis 1980; 121: 339–342. [DOI] [PubMed] [Google Scholar]
- 26.Hoffstein V. Relationship between lung volume, maximal expiratory flow, forced expiratory volume in one second, and tracheal area in normal men and women. Am Rev Respir Dis 1986; 134: 956–961. doi: 10.1164/arrd.1986.134.5.956 [DOI] [PubMed] [Google Scholar]
- 27.Collins DV, Cutillo AG, Armstrong JD, et al. Large airway size, lung size, and maximal expiratory flow in healthy nonsmokers. Am Rev Respir Dis 1986; 134: 951–955. doi: 10.1164/arrd.1986.134.5.951 [DOI] [PubMed] [Google Scholar]
- 28.Oelsner EC, Smith BM, Hoffman EA, et al. Prognostic significance of large airway dimensions on computed tomography in the general population. The Multi-ethnic Study of Atherosclerosis (MESA) Lung Study. Ann Am Thorac Soc 2018; 15: 718–727. doi: 10.1513/AnnalsATS.201710-820OC [DOI] [PMC free article] [PubMed] [Google Scholar]
- 29.Duiverman EJ, Clement J, van De Woestijne KP, et al. Forced oscillation technique. Reference values for resistance and reactance over a frequency spectrum of 2–26 Hz in healthy children aged 2.3–12.5 years. Clin Respir Physiol 1985; 21: 171–178. [PubMed] [Google Scholar]
Associated Data
This section collects any data citations, data availability statements, or supplementary materials included in this article.
Supplementary Materials
Please note: supplementary material is not edited by the Editorial Office, and is uploaded as it has been supplied by the author.
Supplementary material 00278-2024.SUPPLEMENT (3.5MB, pdf)


