. 2024 Dec 18;13:RP92418. doi: 10.7554/eLife.92418

Figure 4. Binding free energies and pocket properties.

Figure 4.

(A) Calculated (yellow) versus experimental (blue) binding free energies for four agonists (structures in Figure 2A, top) (Figure 4—source data 1). Poisson-Boltzmann Surface Area (PBSA) calculations were done on clusters selected from m1 and m3 minima of principal component analysis (PCA) plots (Figure 3; Figure 3—figure supplement 2). Left, absolute ΔG, and right, efficiency (1-ΔGL/ΔGH). The agreement in efficiencies supports the hypothesis that m1 represents ACL and m3 represents ACH (B) In L→H (red→blue), VdW interactions (left) increase, pocket volume (center) decreases, and the number of water molecules in the pocket (right) decreases. Overall, the pocket stabilizes, compacts, and de-wets.

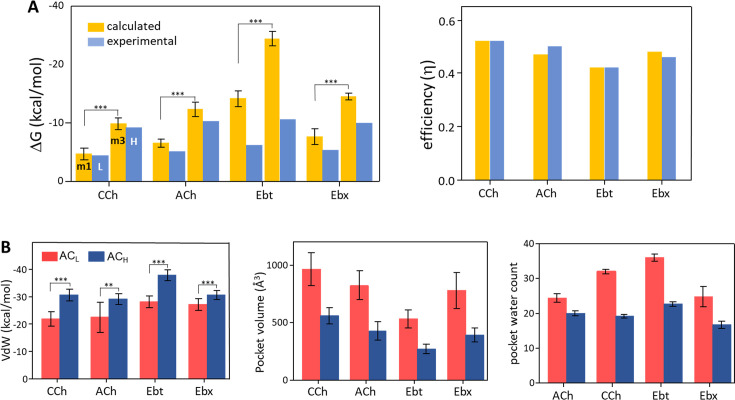
Figure 4—source data 1. Table of calculated and experimental binding energies (kcal/mol).
Agonists, see Figure 2A. In silico (calculated) values were from frames from each principal component analysis (PCA) population (m1, m2, and m3; Figure 3) after cluster analysis of ligand orientation. In vitro (experimental) values were from electrophysiology measurements. Window, frame times for each population; n frames, number of simulation frames from three prominent clusters chosen for MM-PBSA analysis;ΔH, change in binding enthalpy; ΔS change in binding entropy (T, absolute temperature);ΔH, change in Gibbs free energy (ΔG=ΔH-TΔS); η, efficiency (1-ΔGLA/ΔGHA). SD, standard deviation; SEM, standard error of the mean. Data are shown as bar graphs in Figure 4.
Figure 4—source data 2. MM-Poisson-Boltzmann Surface Area (PBSA) components of the free energy calculation (see Figure 4).
EEL, electrostatic; VdW, van der Waals; EPB, electrostatic Poisson-Boltzmann; ENPOLAR, nonpolar solvation energy; ΔG gas, gas-phase free energy; ΔG solv, solvation free energy; SD, standard deviation; SEM, standard error of the mean.