Abstract
The inhalation-exhalation (I:E) ratio, known to be an indicator of respiratory disease, is the ratio between the inhalation phase and exhalation phase of each breath. Here, we report on results from a non-contact monitoring method for the determination of the I:E ratio. This employs a depth sensing camera system that requires no sensors to be physically attached to the patient. A range of I:E ratios from 0.3 to 1.0 over a range of respiratory rates from 4 to 40 breaths/min were generated by healthy volunteers, producing a total of 3,882 separate breaths for analysis. Depth information was acquired using an Intel D415 RealSense camera placed at 1.1 m from the subjects’ torso. This data was processed in real-time to extract depth changes within the subjects’ torso region corresponding to respiratory activity. This was further converted into a respiratory signal from which the I:E ratio was determined (I:E
 ). I:Edepth was compared to spirometer data (I:E
 ). A Bland Altman analysis produced a mean bias of –0.004, with limits of agreement [–0.234, 0.227]. A linear regression analysis produced a line of best fit given by I:E
 I:Espiro – 0.006, with 95% confidence intervals for the slope [0.988, 1.019] and intercept [–0.017, 0.004]. We have demonstrated the viability of a non-contact monitoring method for determining the I:E ratio on healthy subjects breathing without mechanical support. This measure may be useful in monitoring the deterioration in respiratory status and/or response to therapy within the patient population. Clinical and Translational Impact Statement - The I:E ratio is an indicator of disease severity in COPD and asthma. Non-contact continuous monitoring of I:E ratio will offer the clinician a powerful new tool for respiratory monitoring
Keywords: Inhalation-exhalation ratio, respiratory disease, non-contact monitoring, depth sensing camera
I. Introduction
One of the most ubiquitous vital signs measured in the clinical setting is respiratory rate. A significant change in respiratory rate is often an early indication of a major complication such as respiratory tract infection, respiratory depression associated with opioid consumption, and impending respiratory failure [1], [2], [3]. Hence, many early warning scores incorporate respiratory rate within the scoring system [4]. We may, however, derive another parameter from the same waveform from which respiratory rate is derived: the I:E ratio. This is the ratio of the period of the inhalation phase to the exhalation phase of each breath and is known to change with disease state.
In a study of the prolongation of the expiratory phase in COPD patients, Murphy et al. [5] found that the ratio of the duration of inhalation period to exhalation period was significantly lower in COPD patients than for those without respiratory disease. A similar observation was made by Yamauchi et al. [6] in a study of respiratory resistance during the inspiratory and expiratory phases in patients with COPD, where the ratio of the inspiratory to expiratory phase of breathing was found to be significantly lower in moderate COPD than mild COPD. Some textbooks even state that ratios of 1:4 and 1:6 are possible in COPD patients, whereas healthy subjects tend to have ratios closer to 1:1 [7], [8]. Although a prolonged expiratory time may be associated with COPD or asthma, Sills [9] recommends investigating any abnormal I:E ratio for other causes manifesting as, for example, Kussmaul’s respiration, Cheynes-Stokes respiration or Biot’s respiration.
In a study of athletes using slow-paced breathing self-regulation to influence cardiac vagal activity, it was observed that vagal activity increased as the exhalation phase grew resulting in a lower I:E ratio [10]. This is in agreement with findings in healthy volunteers where increased relaxation and stress reduction were observed at lower I:E ratios [11]. The authors concluded that the I:E ratio was thus an important modulator of the autonomic system. The effect of I:E ratio on heart rate variability (HRV) was investigated by Wang et al. [12] who demonstrated that changing I:E ratio from 1:1 to 1:3 did not affect the resulting HRV in a group of young healthy adult volunteers.
The effect of I:E ratio on the performance of medical devices has also been a topic of investigation. Mitchel et al. [13] reported that the delivered medication dosage of two commercially available jet nebulizers changed with differing I:E ratios. They observed that significantly less medication was delivered per treatment by the nebulizers with increasing I:E ratio and identified this as a potential cause of under-dosing in patients with obstructive lung disease. Further data suggests a relationship between internal target volume using free-breathing cone-beam computed tomography (FB-CBCT) and I:E ratio, with internal target volume decreasing with decreases in I:E ratio from unity [14]. Using capnography data, Adams et al. [15] reported a small but statistically significant rise in EtCO2 due to reduction in I:E ratio in breathing patterns reproduced in an anatomically correct adult upper airway model.
Depth sensing camera systems are emerging as a robust tool for the provision of continuous measures of a range of respiratory parameters without the need to physically attach a sensor to the patient: these include respiratory rate, apnea events, respiratory patterns and respiratory volume information [16]. A particular focus of recent research activity in the space has been on non-contact, or ‘touchless’, monitoring of respiratory rate [17], [18], [19], [20], [21], including work by our own group [22], [23], [24], [25]. We have found the depth respiratory signal to be relatively robust to background signal noise, patient posture, bedclothes and sheets, and room lighting. A detailed account of non-contact respiratory monitoring using depth sensing cameras is provided in [16]. Here, we report on the performance of a depth-sensing camera system for the continuous non-contact monitoring of I:E ratio across a range of respiratory rates.
II. Methods
A. Data Acquisition
Institutional review board (IRB) approved informed consent was obtained for each participant covering the essential information stated in the protocol, as required elements according to 21 CFR 812.150 for a non-significant risk medical device investigation. The purpose of the study was the evaluation of respiratory rate performance in the touchless system. We selected from this study all the datasets for which a coached I:E ratio protocol was performed while acquiring a spirometer reference, encompassing a total of five healthy volunteers. Each volunteer undertook controlled breathing over a range of respiratory rates (4 to 40 breaths/min) and I:E ratios (0.3 to 1.0) in 192 separate respiratory rate / I:E experimental tasks, resulting in a total of 3,882 breaths for analysis (total recording time ~286 minutes). Depth information was acquired from the scene using an Intel RealSense™ D415 camera connected to a laptop at a frame rate of 15 fps and processed using an in-house application written in C++. The camera was mounted on a tripod and placed at approximately 1.1 m above the torso of the subject.
During the test runs, each subject was instructed to follow a screen-based metronome where inhalation and exhalation periods were dictated by a colored bar filling and emptying across the screen. The timing of the bar during inhalation and exhalation could be varied independently thus a wide range of respiratory rates and I:E ratios could be generated. The subjects were instructed to breathe at ratios of around 0.3 to 1.0 over the range 4 to 40 breaths/min.
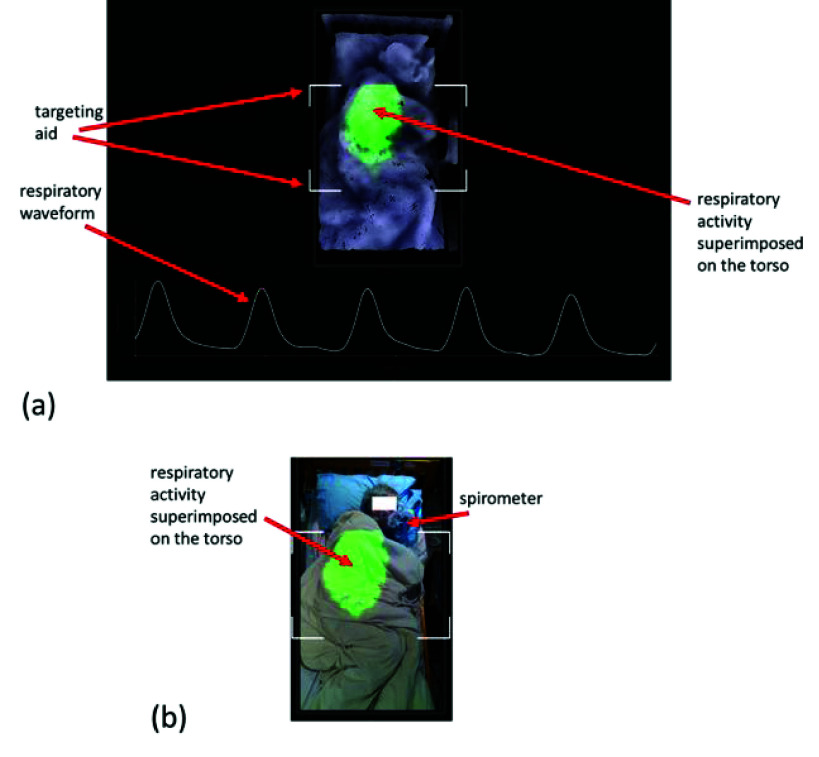
We found this to produce breathing tasks that could be followed by the subjects, while maintaining low I:E ratios at high respiratory rates proved difficult. The protocol also produced a wide variation in tidal volumes across respiratory rates and I:E ratios. Subjects adhered to the protocol as best they could which resulted in a natural variation across this range. The respiratory signal of Fig. 1(a) was captured during one of the breathing regimes undertaken by the subject with an extended expiratory period obvious in the waveform.
FIGURE 1.
Display of respiratory visualization, waveform and RR. (a) A still from the screen output of our depth system. An example video is provided in the video contained in the supplementary material associated with this paper. (b) Equivalent RGB image of (a). Note that the subject is under covers and lying on his side.
B. Data Processing and Analysis
To obtain respiratory information using a depth camera, a respiratory signal must first be derived from the respiratory motion of the patient. This respiratory activity manifests itself as a change in distances from the camera to the surface of the patient’s torso over time. Fig. 1(a) contains a rendered depth image of a subject lying in a bed, where the region of respiratory activity is highlighted by a colored patch superimposed back onto the image. The intensity of this patch is directly related to the change in depth and varies throughout the respiratory cycle. An example video sequence of the real-time respiratory activity detected and displayed by the depth camera system can be found in the supplementary material associated with this paper. The change in depth between consecutive frames (performed across the region of interest) is summed to produce a volume change. This volume change is then incrementally added at each frame to produce the volume signal. The addition of the volume change is repeated at each frame, i.e., the volume signal is a cumulative sum of the frame-to-frame volume changes. The region of interest is contained within the targeting box shown on the display in Fig. 1(a) together with the derived respiratory signal. Fig. 1(b) shows the equivalent RGB image of the scene where the subject, lying on his left-hand side under covers, can be seen. A targeting box is also included on the display to make it easier to position the camera above the subject in the correct location, allowing for consistent quality in the captured data. This is indicated by the four white-line box corners that can be seen in both images of Fig. 1 and in the video in the supplementary material. Various coverings were used during the test including heavier blankets (99 tasks), sheets (67 tasks), and uncovered (22 tasks) subjects (the coverings are not known for 4 tasks due to a failure to collect concurrent RGB data). Subjects wore sweaters or t-shirts during the captures and both regular and memory foam mattresses were used. The subjects varied their postures in bed. Of the 192 respiratory tasks, the splits according to posture were: supine=42, prone=11, side=135 and sitting=4.
A spirometer (SpiroFlo, SpiroSonic, Uscom Kft, Budapest), which can also be seen in the figure, was used to acquire a respiratory signal to be compared with the non-contact respiratory signal derived from our depth system. The spirometer was attached through a breathing tube to a facial mask covering both mouth and nose, which allowed for all air flow to be directed into the spirometer-breathing tube. The sampling rate of the spirometer was 100 Hz and collected via USB by a laptop synchronized with the depth camera system.
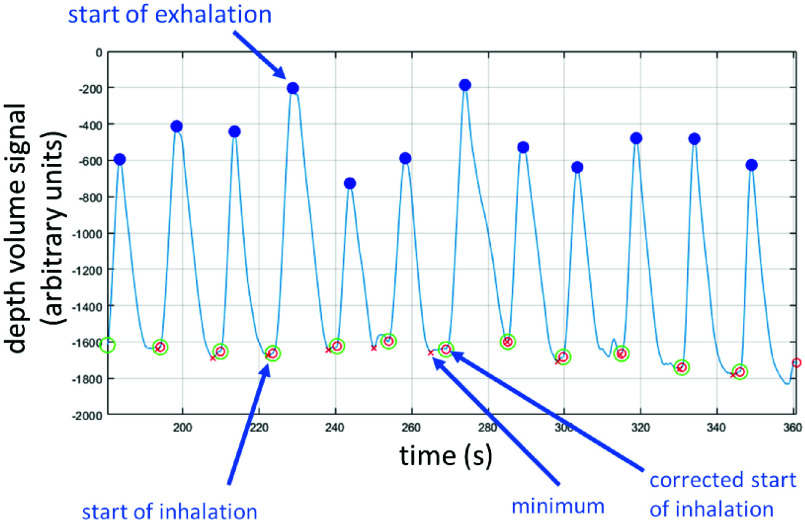
This respiratory signal generated from the depth camera was processed to determine the characteristic, or fiducial, points corresponding to the start of inhalation and the start of exhalation of each breath, from which the inhalation (TI) and exhalation periods (TE) could be determined. The process is as follows: initially, a peak finding algorithm is used to find peaks in the depth volume signal. These peaks occur at the maximum inhalation volume and hence correspond to the start-of-exhalation. The troughs between each peak are calculated as the minimum of the volume signal between two consecutive peaks. Examples of these are shown in the signal segment in Fig. 2. However, as illustrated in the figure, at the end of inhalation we often see noise in the form of small fluctuations in the volume. We therefore identify inhalation as the start of the distinct and lasting increase in the volume signal as follows: we calculate the start-of-inhalation point for each breath by taking the interval between the start of exhalation in the previous breath and the start-of-exhalation of the current breath (i.e. the period between breath peaks). We then identify the maximum upslope of the current breath inhalation phase (defined as the peak in the derivative of the volume signal, the flow). The start of inhalation is then defined as the sample point before the maximum of the upslope where the derivative is at less than 5% of the maximum upslope value. An example of trough location adjustment can be seen in the middle of the signal segment in Fig. 2. We have found that this approach is robust to small fluctuations in the signal that may occur in-between breaths. A fiducial point corrected in this way is indicated in the plot of Fig. 2. Once we derived the fiducial points, we calculated the inspiration period, TI, and expiration period, TE, where TI is the period from the start-of-inhalation to start-of-exhalation in the breath and TE is the period from the start-of-exhalation to the start-of-inhalation of the subsequent breath. The I:E ratio is the ratio TI/TE. We compared the I:E ratios from depth (I:Edepth) with the I:E ratios generated using the same method for a spirometer signal (I:Espiro).
FIGURE 2.
The depth respiratory waveform indicating the fiducial points used to determine I:E ratios (I:Edepth).
Note that the nomenclature for I:E ratio varies in the literature. For example, the I:E ratio may be denoted as e.g. 1:3, 1:4, 1:5, etc. or as a common fraction, e.g. 1/3, 1/4, 1/5, etc., or decimal fraction, e.g. 0.33, 0.25, 0.2, etc. We have also noted that some authors refer to sequence of ratios such as 1:3,1:4,1:5, etc. as increasing, whereas we follow the norm herein and consider these as the fractions 0.33, 0.25, 0.20, etc., and hence as a decreasing sequence in this text.
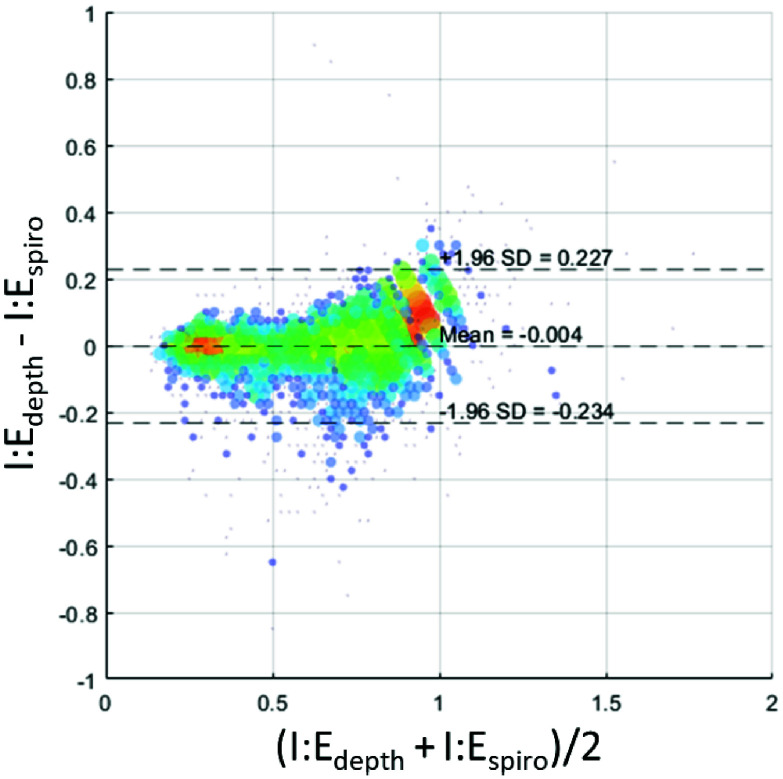
We employed Bland-Altman analysis and linear regression to perform a comparative analysis of the results from the depth camera and spirometer systems. The Bland-Altman analysis of the data, including mean bias and limits of agreement was performed using the method of Bland and Altman [26], and the results plotted in Fig. 4. The line of best fit for the linear regression was evaluated with associated 95% confidence intervals for the intercept and slope. Applying both Bland-Altman and linear regression can provide a more extensive evaluation of data. The complimentary application of statistical methods in this way has been advocated in order to provide a more extensive evaluation of performance characteristics [27]. MATLAB version: 24.1.0 (R2024a), Natick, Massachusetts, was used to perform the statistical analysis.
FIGURE 4.
Bland-Altman plot of I:E ratios from the depth and spirometer respiratory signals. Size of markers and color associated with number of data points at that location on the grid. (Grid resolution: I:E 0.25 both axes).
III. Results
A. Review Stage
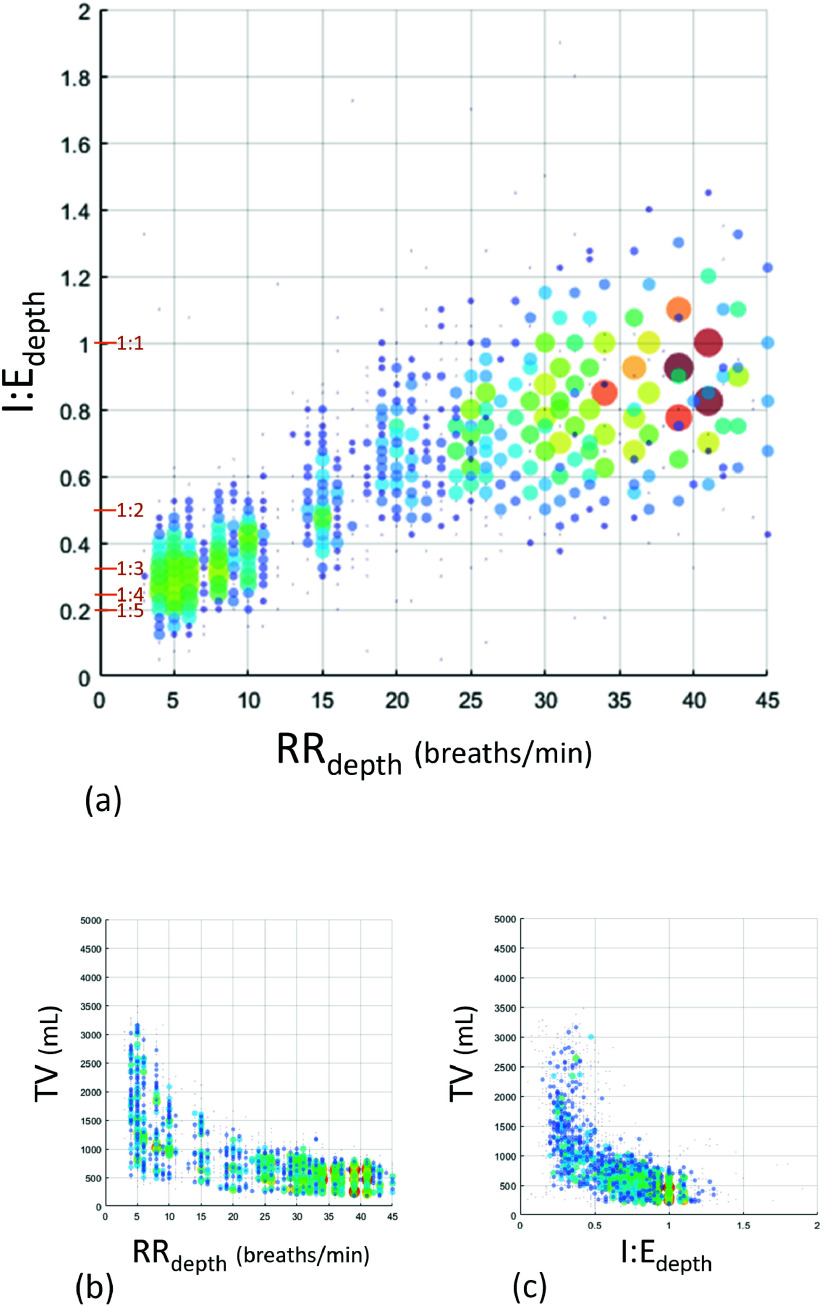
Fig. 3(a) contains a plot of the I:E ratios from the depth camera system which were generated across a range of respiratory rates from 4 to 40 breaths/min. Note that there is a natural variation around each specified I:E ratio and respiratory rate resulting in the scatter in the plot. Consequently, the I:E ratio corresponding to an individual breath is plotted against a localized measure or respiratory rate based on the inverse of the individual breath period (i.e., RR =60/(TI+TE) breaths/min), whereas, in practice, a respiratory rate calculation for clinical use would normally include a number of breaths and filtering to smooth the resulting output. The corresponding tidal volumes against RR and I:E ratio parameters are shown in Fig. 3(b) and 3(c) highlighting the range of tidal volumes generated across each parameter range.
FIGURE 3.
Depth I:E ratio against respiratory rate. Size of markers proportional to number of data points at that location on the grid. (Grid resolution: I:E 0.25 & RR 1.0) Marker color also associated with size to make viewing clearer.
Fig. 4 contains the Bland Altman plot where a mean bias and limits of agreement of –0.004 [–0.234, 0.227] were calculated.
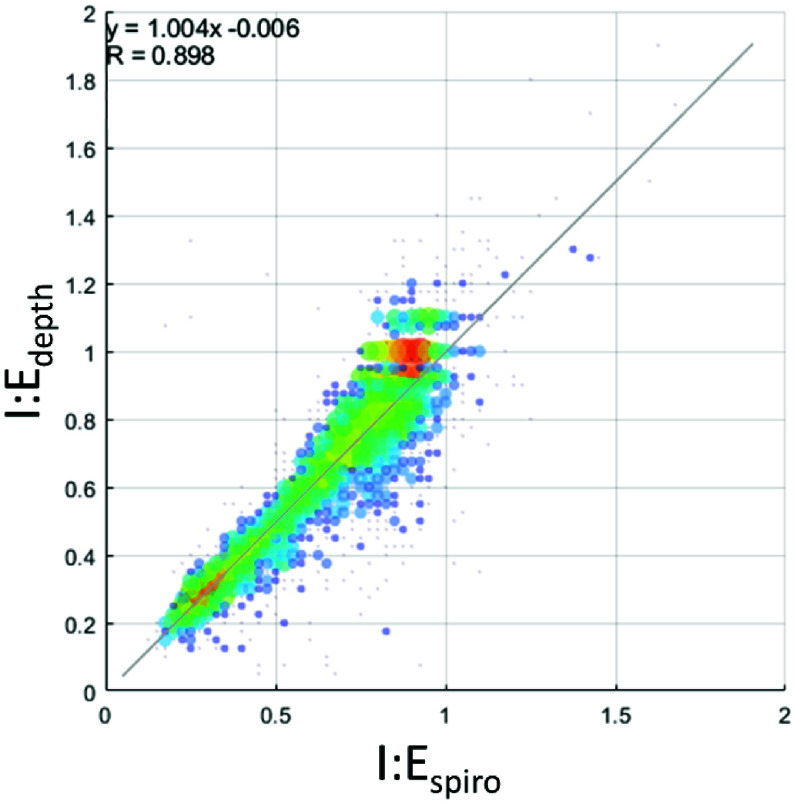
Fig. 5 contains the scatter plot of I:Edepth against I:Espiro for all experimental runs. Using regression analysis, the line of best fit was found to be I:E
 I:Espiro – 0.006, with a 95% confidence interval for the slope of [0.988, 1.019] and for the intercept [–0.017, 0.004].
FIGURE 5.
Scatterplot of I:E ratios from the depth and spirometer respiratory signals with associated regression analysis. Size of markers and color associated with number of data points at that location on the grid. (Grid resolution: I:E 0.25 both axes).
IV. Discussion
We have developed a non-contact monitoring method, based on a depth camera system, for determining the periods of the inhalation and exhalation phases of respiration and deriving the associated inhalation to exhalation ratio. We have demonstrated a clear relationship between our non-contact I:E ratio parameter and the I:E ratio determined by spirometer measured using a mask and breathing tube, with a linear relationship very close to unity. This is demonstrated in Fig. 5. A possible source of the error around the line of best fit in the measured I:E ratio may be due to the natural variation of the volunteers in adhering to the prescribed I:E ratio, but further tests would have to be carried out with a much stricter protocol to draw firm conclusions.
There are a number of limitations to this study. A small number of participants (N=5) took part, as the study was conducted during the COVID pandemic and access to more subjects was limited at that time. The study participants were healthy volunteers instructed to breathe at set respiratory rates and I:E ratios resulting in a large number of individual breaths generated for analysis. Further studies in spontaneously breathing patients across a range of respiratory conditions within the clinical environment are needed to further understand and refine this technology for use in clinical practice. For example, we know that asynchronies in expansion across the upper rib cage, lower rib cage and abdomen can exist in COPD patients, and that these may be significantly influenced by body position [28]. The effect that this would have on determining I:E ratio would have to be further investigated in that patient population. The resolution of the calculated I:E ratio is limited by the sampling frequency (frame rate). The target range for our device is 4–40 breaths/min. Therefore, the shortest breath is 1.5 seconds, equal to 22.5 samples (at the current 15 Hz frame rate). Assuming that the inhalation and exhalation times are equal would result in around 11 samples per phase (I or E). Thus, around a 10% difference per phase. However, we currently sample at 15 Hz, but this could be increased if necessary in future iterations of the device. In addition, the study did not investigate the effect of motion noise on the respiratory signal and its effect on the derived ratio, which we are planning to address in future studies. The study had several strengths. The system and setup used are accessible, with an off-the-shelf depth camera was employed (Intel D415 RealSense™), with no hardware changes or elaborate set-up required. In addition, a comprehensive range of I:E ratios and respiratory rates were interrogated, resulting in a dataset comprising measurements from 3,882 separate breaths.
Our current non-contact respiratory monitoring system provides a range of respiratory information including a real-time visualization of breathing, a breathing waveform, a measure of respiratory rate and a relative measure of respiratory volume [16]. As such, we believe that it has potential application across various areas of care including the acute care unit, post-anesthesia care unit, non-vented patients in the ICU, elderly care facilities, sleep facilities, and at-home sleep studies. As a continuous monitor it will allow for tracking the patient’s status over time as they deteriorate and/or respond to therapy. The technology also fits well with remote and non-contact monitoring of the patient at home, an area which has gained impetus from the recent global COVID pandemic [29], [30] as more sick patients were sent home but still required monitoring of their respiratory status. We envisage the I:E ratio as a valuable additional respiratory parameter available within our non-contact monitoring system, providing further information to aid the clinician in assessing the evolving respiratory status of the patient. A particular area where the continuously monitored I:E ratio may hold promise is in the monitoring of the COPD patient. The ‘textbook’ view on I:E ratio is that the prolongation of the expiration phase caused by COPD manifests as a change in the ratio from a normal value for a spontaneously breathing patient of 1:2, to a value of 1:4 [7], [9, 31] or possibly ratios in excess of 1:6 [8]. The method we have developed for I:E ratio monitoring will, we believe, lead to its use in the clinical setting: not just for the occurrence of the disease state, but its onset, progression and response to therapy. Future work will aim to further test the technology through clinical trials with patients from pertinent areas of care.
V. Conclusion
The results reported here indicate the viability of continuous non-contact monitoring for the determination of I:E ratio which we believe could become a powerful new feature in respiratory monitoring as non-contact patient monitoring methods become more widely available.
Supplementary Materials
References
- [1].Dahan A., Aarts L., and Smith T. W., “Incidence, reversal, and prevention of opioid-induced respiratory depression,” Anesthesiology, vol. 112, no. 1, pp. 226–238, Jan. 2010, doi: 10.1097/ALN.0b013e3181c38c25. [DOI] [PubMed] [Google Scholar]
- [2].Bergese S. D., et al. , “Multicenter study validating accuracy of a continuous respiratory rate measurement derived from pulse oximetry: A comparison with capnography,” Anesth. Analg., vol. 124, no. 4, pp. 1153–1159, 2017, doi: 10.1213/ANE.0000000000001852. [DOI] [PMC free article] [PubMed] [Google Scholar]
- [3].Michard F., Gan T., and Bellomo R., “Protecting ward patients: The case for continuous monitoring,” ICU Manag. Pract., vol. 19, no. 1, pp. 10–14, 2019. [Google Scholar]
- [4].Smith M. E. B., et al. , “Early warning system scores for clinical deterioration in hospitalized patients: A systematic review,” Ann. Amer. Thoracic Soc., vol. 11, no. 9, pp. 1454–1465, Nov. 2014, doi: 10.1513/AnnalsATS.201403-102OC. [DOI] [PubMed] [Google Scholar]
- [5].Murphy R. L., Vyshedskiy A., Paciej R., Wong-Tse A., and Bana D., “Prolongation of the expiratory phase in chronic obstructive lung disease,” Chest, vol. 128, no. 4, p. 251, Oct. 2005, doi: 10.1378/chest.128.4meetingabstracts.251s. [DOI] [Google Scholar]
- [6].Yamauchi Y., Kohyama T., Jo T., and Nagase T., “Dynamic change in respiratory resistance during inspiratory and expiratory phases of tidal breathing in patients with chronic obstructive pulmonary disease,” Int. J. Chronic Obstructive Pulmonary Disease, vol. 7, pp. 259–269, Apr. 2012, doi: 10.2147/COPD.S30399. [DOI] [PMC free article] [PubMed] [Google Scholar]
- [7].Hough A., Physiotherapy in Respiratory Care: An Evidence-based Approach to Respiratory and Cardiac Management. Cheltenham, U.K.: Nelson Thornes, 2001. [Google Scholar]
- [8].Hoeman S. P., Rehabilitation Nursing: Prevention, Intervention, and Outcomes, 4th ed., Amsterdam, The Netherlands: Elsevier, 2008. [Google Scholar]
- [9].Sills J. R., The Comprehensive Respiratory Therapist Exam Review E-Book. Amsterdam, The Netherlands: Elsevier, 2020. [Google Scholar]
- [10].Laborde S., et al. , “Slow-paced breathing: Influence of inhalation/exhalation ratio and of respiratory pauses on cardiac vagal activity,” Sustainability, vol. 13, no. 14, p. 7775, Jul. 2021, doi: 10.3390/su13147775. [DOI] [Google Scholar]
- [11].Van Diest I., Verstappen K., Aubert A. E., Widjaja D., Vansteenwegen D., and Vlemincx E., “Inhalation/exhalation ratio modulates the effect of slow breathing on heart rate variability and relaxation,” Appl. Psychophysiol. Biofeedback, vol. 39, nos. 3–4, pp. 171–180, Dec. 2014, doi: 10.1007/s10484-014-9253-x. [DOI] [PubMed] [Google Scholar]
- [12].Wang Y.-P., Kuo T. B. J., Lai C.-T., Chu J.-W., and Yang C. C. H., “Effects of respiratory time ratio on heart rate variability and spontaneous baroreflex sensitivity,” J. Appl. Physiol., vol. 115, no. 11, pp. 1648–1655, Dec. 2013, doi: 10.1152/japplphysiol.00163.2013. [DOI] [PubMed] [Google Scholar]
- [13].Mitchell J., Coppolo D., Nagel M., Schneider H., and Suggett J., “Under-dosing of inhaled medication delivered by continuous nebulizers is possible as the result of changes to inspiratory/expiratory (I/E) ratio brought about by obstructive lung disease,” Chest, vol. 146, no. 4, p. 519A, Oct. 2014, doi: 10.1378/chest.1989578. [DOI] [Google Scholar]
- [14].Vergalasova I., Maurer J., and Yin F., “Potential underestimation of the internal target volume (ITV) from free-breathing CBCT,” Med. Phys., vol. 38, no. 8, pp. 4689–4699, Aug. 2011, doi: 10.1118/1.3613153. [DOI] [PMC free article] [PubMed] [Google Scholar]
- [15].Adams C. F., Jermy M. C., Geoghegan P. H., and Spence C. J. T., “Effect of variation in the COPD breathing flow pattern on end-tidal CO2 tension: An in vitro study,” Med. Clin. Arch., vol. 1, no. 3, pp. 1–5, 2017, doi: 10.15761/mca.1000114. [DOI] [Google Scholar]
- [16].Addison A. P., Addison P. S., Smit P., Jacquel D., and Borg U. R., “Noncontact respiratory monitoring using depth sensing cameras: A review of current literature,” Sensors, vol. 21, no. 4, pp. 1–16, 2021. [DOI] [PMC free article] [PubMed] [Google Scholar]
- [17].L’Her E., Nazir S., Pateau V., and Visvikis D., “Accuracy of noncontact surface imaging for tidal volume and respiratory rate measurements in the ICU,” J. Clin. Monitor. Comput., vol. 36, no. 3, pp. 775–783, Jun. 2022, doi: 10.1007/s10877-021-00708-x. [DOI] [PMC free article] [PubMed] [Google Scholar]
- [18].Martinez M. and Stiefelhagen R., “Breathing rate monitoring during sleep from a depth camera under real-life conditions,” in Proc. IEEE Winter Conf. Appl. Comput. Vis. (WACV), Mar. 2017, pp. 1168–1176, doi: 10.1109/WACV.2017.135. [DOI] [Google Scholar]
- [19].Yu M. C., Wu H., Liou J. L., Lee M. S., and Hung Y. P., “Breath and position monitoring during sleeping with a depth camera,” in Proc. Int. Conf. Health Inform., 2012, pp. 12–22, doi: 10.5220/0003702000120022. [DOI] [Google Scholar]
- [20].Seppänen T. M., Kananen J., Noponen K., Alho O.-P., and Seppänen T., “Accurate measurement of respiratory airflow waveforms using depth data,” in Proc. 37th Annu. Int. Conf. IEEE Eng. Med. Biol. Soc. (EMBC), Aug. 2015, pp. 7857–7860, doi: 10.1109/EMBC.2015.7320213. [DOI] [PubMed] [Google Scholar]
- [21].Bernacchia N., Scalise L., Casacanditella L., Ercoli I., Marchionni P., and Tomasini E. P., “Non contact measurement of heart and respiration rates based on Kinect™,” in Proc. IEEE Int. Symp. Med. Meas. Appl. (MeMeA), Jun. 2014, pp. 4–8. [Google Scholar]
- [22].Addison P. S., Antunes A., Montgomery D., Smit P., and Borg U. R., “Robust non-contact monitoring of respiratory rate using a depth camera,” J. Clin. Monitor. Comput., vol. 37, no. 4, pp. 1003–1010, Aug. 2023, doi: 10.1007/s10877-023-01003-7. [DOI] [PMC free article] [PubMed] [Google Scholar]
- [23].Addison P. S., Smit P., Jacquel D., and Borg U. R., “Continuous respiratory rate monitoring during an acute hypoxic challenge using a depth sensing camera,” J. Clin. Monitor. Comput., vol. 34, no. 5, pp. 1025–1033, Oct. 2020, doi: 10.1007/s10877-019-00417-6. [DOI] [PMC free article] [PubMed] [Google Scholar]
- [24].Addison P. S., Smit P., Jacquel D., Addison A. P., Miller C., and Kimm G., “Continuous non-contact respiratory rate and tidal volume monitoring using a depth sensing camera,” J. Clin. Monitor. Comput., vol. 36, no. 3, pp. 657–665, Mar. 2021, doi: 10.1007/s10877-021-00691-3. [DOI] [PMC free article] [PubMed] [Google Scholar]
- [25].Addison P. S., Cohen C., Borg U. R., Antunes A., Montgomery D., and Batchelder P., “Accurate and continuous respiratory rate using touchless monitoring technology,” Respiratory Med., vol. 220, Dec. 2023, Art. no. 107463, doi: 10.1016/j.rmed.2023.107463. [DOI] [PubMed] [Google Scholar]
- [26].Bland J. M. and Altman D. G., “Agreement between methods of measurement with multiple observations per individual,” J. Biopharmaceutical Statist., vol. 17, no. 4, pp. 571–582, Jul. 2007, doi: 10.1080/10543400701329422. [DOI] [PubMed] [Google Scholar]
- [27].Priori R., Aliverti A., Albuquerque A. L., Quaranta M., Albert P., and Calverley P. M. A., “The effect of posture on asynchronous chest wall movement in COPD,” J. Appl. Physiol., vol. 114, no. 8, pp. 1066–1075, Apr. 2013, doi: 10.1152/japplphysiol.00414.2012. [DOI] [PubMed] [Google Scholar]
- [28].Mihalj M., et al. , “Telemedicine for preoperative assessment during a COVID-19 pandemic: Recommendations for clinical care,” Best Pract. Res. Clin. Anaesthesiol., vol. 34, no. 2, pp. 345–351, Jun. 2020, doi: 10.1016/j.bpa.2020.05.001. [DOI] [PMC free article] [PubMed] [Google Scholar]
- [29].Massaroni C., Nicolò A., Schena E., and Sacchetti M., “Remote respiratory monitoring in the time of COVID-19,” Frontiers Physiol., vol. 11, pp. 1–4, May 2020, doi: 10.3389/fphys.2020.00635. [DOI] [PMC free article] [PubMed] [Google Scholar]
- [30].Robert A. H., Kacmarek M., and Stoller J. K., Egan’s Fundamentals of Respiratory Care. Maryland Heights, MO, USA: Mosby, 2016. [Google Scholar]
Associated Data
This section collects any data citations, data availability statements, or supplementary materials included in this article.


