Abstract
The study of human body shape using classical anthropometric techniques is often problematic due to several error sources. Instead, 3D models and representations provide more accurate registrations, which are stable across acquisitions, and enable more precise, systematic, and fast measuring capabilities. Thus, the same person can be scanned several times and precise differential measurements can be established in an accurate manner. Here we present 3DPatBody, a dataset including 3D body scans, with their corresponding 3D point clouds and anthropometric measurements, from a sample of a Patagonian population (female=211, male=87, other=1). The sample is of scientific interest since it is representative of a phenotype characterized by both its biomedical meaning as a descriptor of overweight and obesity, and its population-specific nature related to ancestry and/or local environmental factors. The acquired 3D models were used to compare shape variables against classical anthropometric data. The shape indicators proved to be accurate predictors of classical indices, also adding geometric characteristics that reflect more properly the shape of the body under study.
Subject terms: Image processing, Databases, Anatomy, Interdisciplinary studies, Computational models
Background & Summary
During 2016 and 2018, the Human Evolutionary Biology Research Group carried out the Patagonia 3D Lab Project (2016) and Raíces Project (2018)1, whose objective was to collect a reference sample of phenotypic and associated metadata on admixed Patagonian individuals. The main objective is to investigate phenotypic variables of medical interest, combining 3D body images with genetic and lifestyle data of the adult population in the city of Puerto Madryn, Argentina. The compiled data contains 299 samples composed by anthropometric measurements like height, mass, waist/hip circumference, a full body 3D reconstruction computed from smartphone videos using digital photogrammetry, and a 3D LiDAR scan. The call for volunteers to participate in these projects was made through social networks and mass media. Volunteers over 18 years who agreed to participate signed a Free and Informed Consent Form, and then underwent the scanning process to be described below. The full dataset was collected in two different acquisition dates: first, in July 2016 (154 individuals), and then in April 2018 (145 individuals). The data collection was conducted in accordance with the Declaration of Helsinki2 and approved by the Ethics Committee of the Puerto Madryn Regional Hospital (further details are provided in Ethics statements).
All faces in the 3D models were removed, and personal data will not be published in compliance with the Data Protection Act and to preserve the volunteers’ privacy. These data were collected as a predecessor sample for the Programa PoblAr (reference program and genomic biobank of the argentine population)3 which represents the first phenotypic model in 3D for the Argentine population.
Methods
3D Point Clouds
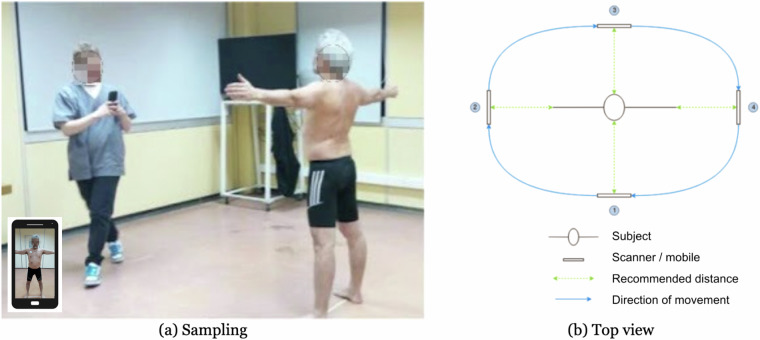
Videos were recorded in a single take, completely surrounding the volunteer while they stood in underwear or tight clothes with their arms extended and legs shoulder-width apart (see Fig. 1). Before the takes, participants were instructed about the overall acquisition procedure, a proper location in the center of the scanning site was also marked with tape, and they were requested to keep their position and posture during the capture during the take, while the person doing the take moves around the participant. The video takes were about 35 s long, encoded in MPEG-4, 1920 × 1080 @ 30 fps. The body2vec workflow4 was used to obtain a clean point cloud by means of a specifically designed deep learning model used for background removal. This model then generates a per frame 2D segmentation of the human body. With all the frames processed this way, a structure-from-motion (SfM) procedure is applied to generate a 3D point cloud reconstruction of the body.
Fig. 1.
Video recording and body scanning protocol.
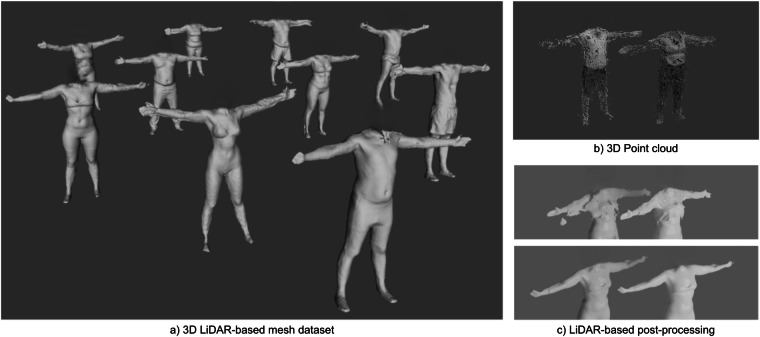
The use of SfM makes certain an accurate 3D body reconstruction using mid-range smartphone or tablet videos. This technique is known to be robust with respect to quality loss due to camera movements during video recording5. In some cases, the recording space was limited, preventing parts of the subjects’ extremities (primarily the arms) from being captured in the video frames. As a result, some point clouds are dense and precise in the trunk area, which is our region of interest for analyzing obesity and overweight, but are sparser in the limbs. Each 3D point cloud has on average 37673 points (see Table 1), represented in .ply format with color texture (see the reference above for details). Some samples of the dataset can be seen in Fig. 2(b).
Table 1.
Size distribution of the meshes and the point clouds.
| LiDAR-based Meshes | Point Clouds | ||
|---|---|---|---|
| points | faces | points | |
| mean | 99613.31 | 199276.27 | 37673.15 |
| std | 251.12 | 512.03 | 12770.53 |
| min | 98672 | 197356 | 8019 |
| max | 100187 | 200402 | 79469 |
Fig. 2.
Some samples taken from the dataset, including mesh-based and point-cloud based. (a) 3D meshes acquired with the Structure scanner and post-processed, (b) 3D point cloud acquired with the segmented video frames and the SfM technique, and (c) examples of post-processing of the 3D meshes (top: denoising, bottom: Laplacian smoothing).
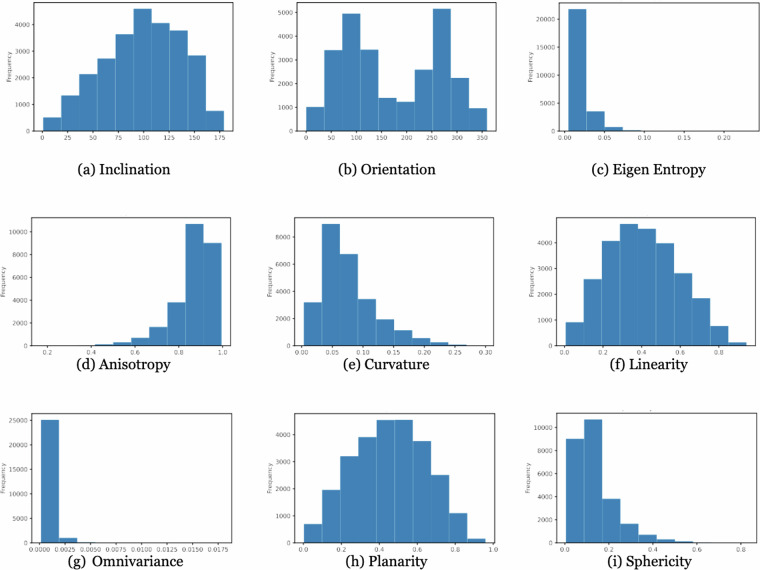
The distribution of some shape parameters of the point clouds in this dataset can be seen in Fig. 3. These descriptors provide insights about the geometric properties of the point clouds. The distributions indicate the frequency of occurrence for each descriptor value across the dataset, highlighting the common features of the 3D body reconstructions. Each shape descriptor has been selected for its relevance to the analysis of body morphology and the quality of 3D reconstructions:
- Inclination (a) and Orientation (b): these parameters are crucial for understanding body posture and alignment. The uniform distribution of these descriptors indicates a consistent capture of body orientation in different subjects6–8.
1
In Equation (1), Nz represents all values associated with the Z-axis of the point cloud. In Equation (2), Nx denotes all values associated with the X-axis of the point cloud, while Ny represents the values corresponding to the Y-axis.2 - Eigen-entropy (c): Measures the complexity of the shape. Low values observed indicate that the captured body shapes are relatively smooth and simple, which is desirable for medical and anthropometric analysis9.
The eigen entropy is calculated after performing a k-neighbor analysis or using a k-dimensional tree (kd-tree). From this method, the eigenvalues or eigenvalues are obtained, represented as λ, which are the scalar values associated with a particular transformation. Once the eigenvalues are obtained, a specific formula (Equation (3)) is used to calculate the eigen entropy, which measures the amount of disorder or uncertainty in the point cloud, based on these eigenvalues.3
Fig. 3.
Distribution of some shape descriptors of the 3D point clouds. Inclination and orientation are in degrees, while the others are dimensionless, normalized between 0 and 1.
Overall, these distributions indicate that the 3D reconstructions are of high quality and capture the relevant morphological features needed to analyze obesity and overweight in the trunk region. The chosen parameters are effective in assessing the consistency and accuracy of the 3D models, and the observed distributions conform to expected human body shapes. This contextualization demonstrates that the collected data are adequate and reliable for the intended anthropometric analysis.
3D LiDAR-based meshes
We used the first Structure™ sensor scanner model. This scanner was our best choice to achieve LiDAR quality with a handheld device able to perform quick, non invasive captures, at an affordable price. Other scanners such as the Creaform GoScan!3D (which was tested) has higher accuracy and provides more detail, but requires the scanner to be very close to the body, causing discomfort and requiring longer acquisition times. To take 3D LiDAR-based meshes we applied the same protocol as with the video takes (see Fig. 1). Once the scans were produced, the obtained meshes require several post-processing steps. The Close Holes method was used to eliminate holes in the acquisitions (perhaps requiring different parameters in each mesh), using the algorithms presented in Meshlab15. Then, we used a Laplacian smooth filter16,17 to soften the mesh roughness, configured with 10 smoothing steps, 1D Boundary Smoothing and Cotangent Weighting setting. In addition, in some cases, cut-out and clean tools were used in Meshlab15 to eliminate vertices that did not make part of the human silhouette (mostly due to person’s movement during the acquisitions). In Fig. 2(c) we present an example of each of these LiDAR mesh post-processing procedures. The meshes are included in this dataset without texture, and in all cases with an additional head removal post-processing to grant data anonymization. Each mesh in average consists of 99613 points and 199276 faces (see Table 1).
Anthropometric measurements
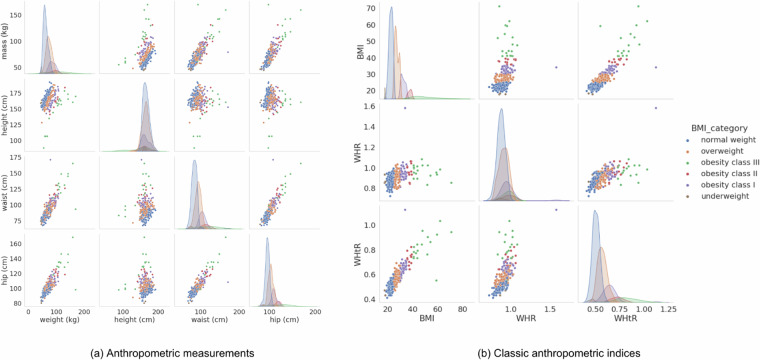
Anthropometric measurements were acquired by trained bio-anthropologists using the standard protocol18. Height was measured with a measuring rod fixed to the wall. The volunteer was placed under it with the head placed in the horizontal Frankfurt plane (with the view directed to the horizon) and the chin straight. The measuring rod was lowered until it reached the top of the head (vertex). Mass and body composition (lean mass fat mass, muscle mass, fat-free, body fat mass, and percentages thereof) were estimated with a bioimpedance scale (Tanita BC 1100F)19. Waist and hip circumferences were measured with a flexible and retractable ergonomic measuring tape Seca 201 (Seca GmBH & Co Kg, Hamburg, Germany) the former at the umbilicus level or just 1 cm below and the latter at the trochanters level (used for the estimation of usual nutritional status indexes, including body mass index (BMI), waist-to-hip ratio (WHR), and waist-to-height ratio (WHtR)). Following standard protocols20, all measurements were taken on the right side of the body. In order to control for possible intra-observer error, the measurements were repeated twice, with a 0.1 cm difference tolerance criterion, and the average of the two measurements was used for subsequent analyses. Figure 4(a) presents the scatter and density plots of some anthropometric measurements such as mass, height, waist and hip, revealing the correlations between these measurements, such as the positive correlation between mass and waist circumference.
Fig. 4.
Anthropometric dataset. Pairwise scatter plots and density distributions of anthropometric measurements (a) and classic anthropometric indices (b). Diagonal plots represent the density distribution of each variable.
Anthropometric indices
The usual anthropometric indices were calculated21. These indices have a wide use (medicine, nutrition, sportology, etc.) in relation to nutritional health. The most widespread is the Body Mass Index (BMI = mass/height2) which gives an indication of the overall person’s thickness or thinness, but not about the distribution of adiposity. BMI is divided into ranges that classify people according to their value (underweight, normal, overweight, obese)22. The other two indices, the waist-to-hip ratio (WHR), and waist-to-height ratio (WHtR)23 are better indicators of the distribution of body fat, especially in the abdominal area which serves to predict arterial hypertension and cardiovascular risk, both indices are also divided into ranges that indicate nutritional status (see Table 2). Figure 4(b) shows the scatter and density plots of anthropometric indices calculated as BMI, WHR and WHtR, highlighting the variations according to BMI categories, where a higher BMI is associated with higher WHR and WHtR values, indicating greater central adiposity.
Table 2.
Descriptive statistics for anthropometric measurements.
| mass (kg) | height (cm) | waist (cm) | hip (cm) | BMI | WHR | WHtR | ||||||||
|---|---|---|---|---|---|---|---|---|---|---|---|---|---|---|
| female | male | female | male | female | male | female | male | female | male | female | male | female | male | |
| mean | 67.70 | 84.34 | 158.67 | 174.08 | 91.66 | 95.36 | 102.22 | 102.94 | 27.27 | 27.85 | 0.89 | 0.92 | 0.58 | 0.55 |
| std | 16.28 | 17.27 | 10.79 | 6.86 | 16.11 | 11.62 | 12.13 | 7.72 | 8.02 | 5.69 | 0.08 | 0.06 | 0.11 | 0.07 |
| min | 44.30 | 63.40 | 88.10 | 161.70 | 67.25 | 78.40 | 80.00 | 91.75 | 17.61 | 20.64 | 0.72 | 0.80 | 0.41 | 0.45 |
| max | 159.20 | 169.50 | 178.30 | 192.00 | 171.00 | 144.90 | 168.40 | 134.75 | 70.99 | 59.00 | 1.58 | 1.08 | 1.12 | 0.84 |
Ethics statements
The study was conducted in accordance with the Declaration of Helsinki, and the procedure was approved by the Ethics Committee of the Puerto Madryn Regional Hospital under protocol number 10/16 (approved 9 June 2016) and re-evaluated under protocol number 19/17 (approved 4 September 2018). All participants gave informed consent to participate, to record their body scans and metrics, and to release the anonymized records in this dataset. The research project was publicized through local media, including radio, print press, and social media channels, to reach a diverse and representative sample of the target population. All participants were over 18 years of age.
Data Records
The dataset comprises 299 post-processed meshes, point clouds, and anthropometric metadata from adult volunteers, including 211 females, 87 males, and 1 individual of another gender. The average age is 40 with a standard deviation of 12. Anthropometric data covers various parameters such as gender, age, mass, height, waist and hip measurements, BMI, WHR, WHtR, body fat percentage, and more. 3D Meshes were acquired using the Structure Sensor Pro scanner, and 3D Point Clouds was generated through the utilization of the body2vec method as described in Trujillo et al.4 and are available in .ply format. Anthropometric measurements were taken by expert bioanthropologists using measurement instruments and was presented in tables (.csv and .json formats). To ensure accuracy, measurements were repeated twice, with a tolerance criterion of 0.1 cm. The dataset is available in the Repositorio Institucional CONICET Digital24 under the identifier: URI: http://hdl.handle.net/11336/161809.
Technical Validation
Our data collection is complemented by previous research articles, including:
Trujillo-Jiménez et al.4: “Body2vec: 3D point cloud reconstruction for precise anthropometry with handheld devices”4.
Navarro et al.25: “Body shape: Implications in the study of obesity and related traits”25.
These articles provide additional insights into the methodologies employed and the implications of body shape analysis. This comprehensive data collection, spanning multiple types and formats, forms the foundation for our exploration into 3D shape modeling and its applications in human body biometrics. The detailed information provided here ensures transparency and replicability in future research endeavors.
Usage Notes
The following delineation provides an insightful overview of some primary applications of the 3DPatBody:
This dataset may be used in 3D outfit design and Ergonomy applications in general.
3D body models could be employed as realistic avatars for humans and in the design of characters in videogame development.
This dataset can help training automatic methods capable of regressing or classifying body characteristics (i.e. artificial neural networks).
3D models could be used to compare shape variables with anthropometric data26. This approach also could facilitate diagnosis and therapy monitoring through the use of accessible 3D technology27– 29.
It can support a broad range of health and medical applications, since human body morphometry is a robust predictor of phenotypes related to conditions such as obesity and overweight30.
This dataset may serve as a basis for investigating adequate feature spaces for human body shape and form.
Acknowledgements
Authors would like to thank the Centro Nacional Patagónico CCT-CENPAT, Primary Health Care Centers CAPS Favaloro and CAPS Fontana of the Puerto Madryn Regional Hospital for allowing us to use this places, and for its hospitality during the data collection phase. Besides, would like to thank the volunteer participants who took part in this research. We would also like to show our gratitude to Emmanuel Iarussi (Torcuato Di Tella University) and Celia Cintas (IBM Research) for sharing their thoughts and reviews with us during the course of this research. Funding: This research was funded by grant from Centro de Innovación Tecnológica, Empresarial y Social (CITES), 2016, and by CONICET Grant PIP 2015-2017 ID 11220150100878CO CONICET D.111/16.
Author contributions
M.A.T.-J. and C.D. conceived the original idea. M.A.T.-J., B.P. and L.M. made the collection of videos and 3D images. V.R., C.P., S.D.A., A.R. O.P. and T.T. took the anthropometric data. M.A.T.-J., C.D. and R.G.-J. wrote the manuscript. All authors have read and agreed to the published version of the manuscript.
Code availability
The complete method for the generation of 3D point clouds is available at body2vec4. BRemNet, the neural network with the objective of pre-processing by frames the videos taken specifically for the 3D photogrammetric reconstruction of the body is available at https://github.com/aletrujim/BRemNet.
A segment of the technical validation pertaining to the data is accessible through PointCloud-ICC: https://github.com/aletrujim/PointCloud-ICC and PointCloud-Descriptors: https://github.com/aletrujim/PointCloud-Descriptors.
Competing interests
The authors declare no competing interests.
Footnotes
Publisher’s note Springer Nature remains neutral with regard to jurisdictional claims in published maps and institutional affiliations.
Contributor Information
Magda Alexandra Trujillo-Jiménez, Email: mtrujillo@cenpat-conicet.gob.ar.
Claudio Delrieux, Email: cad@uns.edu.ar.
Rolando González-José, Email: rolando@cenpat-conicet.gob.ar.
References
- 1.Paschetta, C. et al. RAICES: una experiencia de muestreo patagónico (in Spanish), vol. 1 (Libro de Resúmenes de las Decimocuartas Jornadas Nacionales de Antropología Biológica, 2019), 1 edn.
- 2.Williams, J. R. The declaration of Helsinki and public health. Bulletin of the World Health Organization86, 650–652 (2008). [DOI] [PMC free article] [PubMed] [Google Scholar]
- 3.PoblAr: Programa de referencia y biobanco genómico de la población argentina. https://www.argentina.gob.ar/ciencia/planeamiento-politicas/poblar Accessed: 2024-05-14.
- 4.Trujillo-Jiménez, M. A. et al. body2vec: 3D point cloud reconstruction for precise anthropometry with handheld devices. Journal of Imaging6, 94 (2020). [DOI] [PMC free article] [PubMed] [Google Scholar]
- 5.Wu, C. et al. VisualSFM: A visual structure from motion system (2011).
- 6.Xu, T. et al. 3d joints estimation of the human body in single-frame point cloud. IEEE Access8, 178900–178908 (2020). [Google Scholar]
- 7.Itakura, K. & Hosoi, F. Estimation of leaf inclination angle in three-dimensional plant images obtained from lidar. Remote Sensing11, 344 (2019). [Google Scholar]
- 8.Steer, P., Guerit, L., Lague, D., Crave, A. & Gourdon, A. Size, shape and orientation matter: fast and semi-automatic measurement of grain geometries from 3d point clouds. Earth Surface Dynamics10, 1211–1232 (2022). [Google Scholar]
- 9.Bai, C., Liu, G., Li, X., Yang, Y. & Li, Z. Robust and accurate normal estimation in 3d point clouds via entropy-based local plane voting. Measurement Science and Technology33, 095202 (2022). [Google Scholar]
- 10.Miyazaki, R., Yamamoto, M. & Harada, K. Line-based planar structure extraction from a point cloud with an anisotropic distribution. International Journal of Automation Technology11, 657–665 (2017). [Google Scholar]
- 11.Trujillo Jiménez, M. A. et al. Descriptores de forma para nubes de puntos 3D, vol. 1 (Libro de Resúmenes: Quinto Encuentro Nacional de Morfometría, 2019), 1 edn.
- 12.Farella, E. M., Torresani, A. & Remondino, F. Sparse point cloud filtering based on covariance features. The International Archives of the Photogrammetry, Remote Sensing and Spatial Information Sciences42, 465–472 (2019). [Google Scholar]
- 13.Gressin, A., Mallet, C., Demantké, J. & David, N. Towards 3d lidar point cloud registration improvement using optimal neighborhood knowledge. ISPRS journal of photogrammetry and remote sensing79, 240–251 (2013). [Google Scholar]
- 14.Bueno, M., Martínez-Sánchez, J., González-Jorge, H. & Lorenzo, H. Detection of geometric keypoints and its application to point cloud coarse registration. The International Archives of the Photogrammetry, Remote Sensing and Spatial Information Sciences41, 187–194 (2016). [Google Scholar]
- 15.Cignoni, P. et al. Meshlab: an open-source mesh processing tool. In Eurographics Italian chapter conference, vol. 2008, 129–136 (Salerno, 2008).
- 16.Vyas, K., Jiang, L., Liu, S. & Ostadabbas, S. An efficient 3D synthetic model generation pipeline for human pose data augmentation. In Proceedings of the IEEE/CVF Conference on Computer Vision and Pattern Recognition, 1542–1552 (2021).
- 17.Kirana Kumara, P. & Ghosal, A. A procedure for the 3D reconstruction of biological organs from 2D image sequences. Proceedings of BEATS2010 (2010).
- 18.Preedy, V. R. Handbook of anthropometry: physical measures of human form in health and disease (Springer Science & Business Media, 2012).
- 19.Peine, S. et al. Generation of normal ranges for measures of body composition in adults based on bioelectrical impedance analysis using the seca mbca. International journal of body composition research11 (2013).
- 20.Cabañas, M. & Esparza, F. Compendio de cineantropometría (cto editor) (2009).
- 21.A healthy lifestyle: WHO recommendations. https://www.who.int/europe/news-room/fact-sheets/item/a-healthy-lifestyle---who-recommendations. Accessed: 2024-05-17.
- 22.Organization, W. H. et al. Waist circumference and waist-hip ratio: report of a WHO expert consultation, geneva, 8-11 december 2008. report of a WHO expert consultation (2011).
- 23.Ruderman, A. et al. Obesity, genomic ancestry, and socioeconomic variables in Latin American mestizos. American Journal of Human Biology31, e23278 (2019). [DOI] [PubMed] [Google Scholar]
- 24.Trujillo Jiménez, M. A. et al. Base de datos antropométricos y modelos 3d del proyecto: Ancestría, características corporales y salud en una muestra de la población de la ciudad de puerto madryn. Consejo Nacional de Investigaciones Científicas y Técnicas http://hdl.handle.net/11336/161809 (2022).
- 25.Navarro, P. et al. Body shape: Implications in the study of obesity and related traits. American Journal of Human Biology32, e23323 (2020). [DOI] [PubMed] [Google Scholar]
- 26.Braganca, S., Arezes, P. & Carvalho, M. An overview of the current three-dimensional body scanners for anthropometric data collection. Occupational safety and hygiene III 149–154 (2015).
- 27.Kroh, A. et al. 3D optical imaging as a new tool for the objective evaluation of body shape changes after bariatric surgery. Obesity Surgery30, 1866–1873 (2020). [DOI] [PMC free article] [PubMed] [Google Scholar]
- 28.Barnes, R. The body volume index (bvi): Using 3D scanners to measure and predict obesity. In Proc. of 1st Int. Conf. on 3D Body Scanning Technologies, Lugano, Switzerland, 147–157 (2010).
- 29.Medina-Inojosa, J., Somers, V. K., Ngwa, T., Hinshaw, L. & Lopez-Jimenez, F. Reliability of a 3D body scanner for anthropometric measurements of central obesity. Obesity, open access2 (2016). [DOI] [PMC free article] [PubMed]
- 30.Phillips, C. M. Metabolically healthy obesity: definitions, determinants and clinical implications. Reviews in Endocrine and Metabolic Disorders14, 219–227 (2013). [DOI] [PubMed] [Google Scholar]
Associated Data
This section collects any data citations, data availability statements, or supplementary materials included in this article.
Data Availability Statement
The complete method for the generation of 3D point clouds is available at body2vec4. BRemNet, the neural network with the objective of pre-processing by frames the videos taken specifically for the 3D photogrammetric reconstruction of the body is available at https://github.com/aletrujim/BRemNet.
A segment of the technical validation pertaining to the data is accessible through PointCloud-ICC: https://github.com/aletrujim/PointCloud-ICC and PointCloud-Descriptors: https://github.com/aletrujim/PointCloud-Descriptors.


