Abstract
TNBC, the most aggressive form of breast cancer, lacks accurate and effective therapeutic targets. Immunotherapy presents a promising approach for addressing TNBC. Anxiety and depression are frequently concurrent symptoms in TNBC patients. MDD affects the tumor immune microenvironment of TNBC, with its characteristic genes affecting the pathophysiology of MDD and potentially increasing the risk of TNBC recurrence and metastasis. This study reveals significant differences in T lymphocyte infiltration between high-risk and low-risk TNBC groups based on MDD feature genes. This finding aids in identifying TNBC patients who may benefit from immunotherapy, providing new insights for future TNBC immunotherapy strategies. Our aim is to identify MDD-related genes involved in the pathogenesis of TNBC and to provide predictive biomarkers for TNBC immunotherapy.
Supplementary Information
The online version contains supplementary material available at 10.1007/s12672-024-01562-4.
Keywords: Triple-negative breast cancer, Major depressive disorder, Immune cell infiltration, Prognostic value, Single-cell sequencing
Introduction
According to data from GLOBOCAN, breast cancer (BC) ranks as the most prevalent cancer among women worldwide, with approximately 2.30 million cases worldwide in 2022 [1, 2]. Triple-negative breast cancer (TNBC) is negative for the progesterone receptor, estrogen receptor, and human epidermal growth factor receptor 2, accounting for 15–20% of all BC cases. TNBC is characterized by an aggressive nature, unfavorable prognosis, and high recurrence rate, typically affecting younger women and resulting in increased mortality rates [3–5]. Approximately 45% of TNBC patients develop metastases to the brain or other sites [4]. What’s worse, TNBC is resistant to both hormonal and targeted therapies [6], and chemotherapy is virtually the sole treatment, but it soon develops resistance. Finding precise and effective targets for TNBC therapy is a difficult yet critical clinical issue. In recent years, immunotherapy has shed light on TNBC patients. TNBC possesses several critical attributes that increase its responsiveness to immunotherapy compared to other subtypes. Firstly, TNBC has a greater presence of tumor-infiltrating lymphocytes (TILs) [7], which are associated with better responses to immune checkpoint (ICP) inhibitors (ICIs). High levels of TILs in early TNBC are associated with improved outcomes [8]. Secondly [9], TNBC has higher levels of PD-L1 expression in tumor and immune cells, providing direct targets for ICIs. Finally, TNBC is characterized by a higher prevalence of non-synonymous mutations [10], resulting in the production of tumor-specific neoantigens. These neoantigens activate T cells to produce anti-tumor immune responses [11], which can be enhanced by ICIs [12]. These findings indicate that TNBC has a higher response rate to ICIs than hormone receptor-positive and HER2-positive BC types, making it the most promising subtype for immunotherapy research.
The Global Burden of Disease Study 2019 shows that depression is among the top ten contributors to increased global disease burden [13]. In the U.S., major depressive disorder (MDD) has a lifetime prevalence of 21% among women [14]. MDD may significantly shorten life expectancy, in part due to suicide and an increased risk of cardiovascular disease, stroke, autoimmune diseases, and cancer [15–17]. MDD not only exacerbates the course of the above medical disorders but also diminishes treatment efficacy [18]. Currently, there are no reliable indicators of depression clinically, and the lack of such biomarkers raises concern since chronic depression can lead to greater treatment resistance to treatment and higher risks of substance abuse and suicide. Notably, individuals with autoimmune disorders are more likely to experience depression, and depressed patients with increased inflammatory markers may be less responsive to treatments [19]. Research reveals the involvement of immune-related genes in the pathophysiology of MDD and the contribution of enhanced cerebral pro-inflammatory levels to depression. Recent genome-wide studies have demonstrated that MDD patients have significantly enriched immune response-related pathways(e.g., IL-6 signaling or natural killer cell pathways) [20]. Numerous investigations have confirmed that MDD impairs the function of the immune system (cellular and humoral immunity), increases the risk of BC recurrence and metastasis, reduces survival time, and enhances mortality rates [21, 22].
Chronic inflammation and immune responses are two core element that characterize the tumor microenvironment [23]. The link among depression, anxiety, and systemic inflammatory markers has been extensively revealed [24], which may lead to worse outcomes in cancer patients. For instance, chronic stress in BC patients is associated with accelerated disease progression [16]. Multiple studies have revealed the association among chronic stress, exposure to stressful events, and inflammatory markers in BC patients [25–27]. Notably, BC patients exposed to childhood trauma had far greater levels of depressive symptoms and fatigue, higher NF-kB pathway activation in peripheral blood mononuclear cells, and higher baseline levels of C-reactive protein, IL-6, and IL-1 in the plasma [26]. Additionally, BC patients with high postoperative stress had increased levels of myeloid-derived suppressor cells (MDSCs) in their blood [27]. These cells reshape the immune tumor microenvironment (TME) through various mechanisms (e.g., chemokine-regulated recruitment, excessive cytokine production, and T cell induction) and reduce the response of tumor antigen-specific T cells [28]. Additionally, depression affects IL-6 levels [27] and lymph node positivity [29] in BC patients. Research has found a positive correlation between depressive symptoms and macrophage infiltration in the TME. M1 macrophages are significant contributors to the neuroinflammatory processes associated with severe depressive symptoms [30]. According to one study based on the social signal transduction theory of depression [3], the innate immune response to bodily predatory threats can be activated by modern social, symbolic, anticipatory, and imagined threats, as well as responses to contemporary chronic social environmental adversities (such as physical abuse), leading to systemic inflammation [24]. These findings confirm that depressive symptoms play a role in modulating the immune TME in BC [31]. Uncovering potential biomarkers for both diseases would be of great significance. Thus, determining distinct clustering features and MDD characteristic genes can effectively predict the prognosis and response to immunotherapies in TNBC patients.
In this article, we first identified MDD characteristic genes through differential analysis based on the MDD scRNA dataset GSE144136. TNBC samples were obtained from the TCGA, GEO, and METABRIC databases. The expression and mutation profiles of MDD characteristic genes were analyzed in TNBC and an MDD-related prognostic signature was constructed based on the METABRIC database, which was validated using the GSE58812 and TCGA databases. Simultaneously, the differences in functional enrichment, cancer stemness, immune cell infiltration, immune therapy response, mutation frequency, and chemotherapy resistance were analyzed between the high-risk and low-risk groups. Finally, the characteristic genes were validated through immunohistochemical analysis of patient pathological specimens. The results indicate that MDD-related characteristic genes are associated with immune cell infiltration and can predict treatment response and outcomes in TNBC patients.
Materials and methods
Study design and data collection
Single-cell mRNA sequence (scRNA-seq) data from 17 MDD patients and 17 controls were downloaded from the GSE144136 dataset in the GEO database (www.ncbi.nlm.nih.gov/geo) [32]. RNA-seq data and clinical annotations of TNBC patients were obtained from the METABRIC (http://www.cbioportal.org/) and served as the training cohort. The GSE58812 microarray dataset was downloaded from GEO [33] and the RNA-Seq data of TNBC samples were procured from the TCGA database (https://portal.gdc.cancer.gov/repository). Detailed information is exhibited in Table 1. The expression of MDD characteristic genes in TNBC cell lines was obtained from the Cancer Cell Line Encyclopedia (CCLE) database (https://sites.broadinstitute.org/ccle/). Detailed results can be found in Supplementary File 1.
Table 1.
Information of datasets
| Dataset | Platform | Origin | Sample | Species | |
|---|---|---|---|---|---|
| Experimental | Control | ||||
| GSE144136 | GPL20301 | Post-mortem dorsolateral prefrontal cortex | 17 | 17 | Homo sapiens |
| GSE58812 | GPL570 | Neoplasms | 107 | / | Homo sapiens |
| TCGA TNBC | Illumina | Invasive Ductal Carcinoma of Breast | 112 | / | Homo sapiens |
| METABRIC | Illumina | Invasive Ductal Carcinoma of Breast | 320 | / | Homo sapiens |
Differential expression analysis of MDD-related genes
MDD scRNA-seq data from the GSE144136 dataset were analyzed by Seurat (https://github.com/satijalab/seurat) [32]. Cells with less than 200 genes or more than 2500 genes and more than 5% of mitochondrial gene fragments were screened. Seurat’s functions of NormalizeData and ScaleData were utilized for the normalization and scaling of count data, and the remaining cells were merged into one gene expression matrix. RunUMAP and Findclusters functions were utilized for dimension reduction and cell cluster identification. After that, cell clusters were annotated using the SingleR R package. “FindAllMarkers” and “FindMarkers” functions were applied for Wilcoxon tests in astrocytes between MDD patients and controls to find differentially expressed genes (DEGs). Afterward, a protein-protein interaction (PPI) network was established for DEGs using the STRING database [34]. The R package “clusterProfiler” [35] was adopted for KEGG and Gene Ontology (GO) functional enrichment analyses, with a cutoff value of p < 0.05.
Identification of a MDD gene-related prognostic signature in TNBC
The prognostic performance of dysregulated MDD genes was estimated via univariate Cox regression analysis (p < 0.05) in the METABRIC dataset. Subsequently, the stepwise Akaike information criterion (stepAIC) method from the MASS package (version 26) was utilized to refine the prognostic gene set and construct a prognostic model. The risk score was graded based on the normalized expression levels of genes (Expi) and regression coefficients (Coei):
TNBC patients were categorized into high- and low-risk groups based on the median cutoff. The prognostic performance of novel gene signatures was appraised via Kaplan–Meier and ROC curve analyses using the ‘survminer’, ‘survival’, and ‘survivalROC’ R packages. Cox regression analyses were conducted to evaluate the prognostic independence of MDD-related risk scores, along with other clinical indexes in TNBC patients. A survival prediction nomogram that incorporated significant risk factors was established and its accuracy was assessed with the calibration curves and decision curve analysis (DCA).
Functional enrichment analysis
DEGs between the high- and low-risk patients were determined by |logFC| > 0.5 and P < 0.05 and then selected for GO analysis with the ‘clusterProfiler’ R package [36]. Gene Set Enrichment Analysis (GSEA) of the KEGG pathway was performed using the “clusterProfiler” R package [37], with the threshold of |NES| > 1, NOM p-value < 0.05, and q-value < 0.25.
Relationship of MDD prognostic signature with TME in TNBC
The ‘ESTIMATE’ R package was employed to determine the stromal score, immune score, and ESTIMATE score to estimate the TME compositions. For further analysis, ICPs and HLA-related genes were extracted for differential analysis. To identify the mutational profiles of TNBC patients, the mutation annotation format was created using the “maftools” package [38].
Immune infiltration analysis
The proportion of immune cells was determined for patients in the low-risk and high-risk groups using CiberSort, a computational method that identifies different immune cell proportions by tissue gene expression profiles. The TIMER database (https://cistrome.shinyapps.io/timer/), including 10 of 32 cancer types from the TCGA database and 897 samples, was utilized to estimate the abundance of immune infiltrates (26). Immune cell infiltration was analyzed using the “CiberSort” R script and the TIMER 2.0 database. The infiltration of 28 immune cells was shown in a heatmap using the heatmap R package. The differences in the proportion of different types of immune cells were visualized between the high- and low-risk groups in the box plots. We analyzed whether there was a relationship between the model genes and immune cells by CIBERSORT algorithm. For correlation analysis, we calculated the Pearson correlation coefficient, as indicated. P values < 0.05 were considered significant.
Stemness signatures analysis
According to the most comprehensive and up-to-date set of published stemness signatures defined by RNAi screening, gene expression profiling, target gene sets of transcription factors, literature, and computational summaries (Additional file 1: Supplementary file 2), 26 stemness gene sets were recruited from StemChecker (http://stemchecker.sysbiolab.eu/). Next, ssGSEA was applied for quantifying stemness enrichment scores via the GSVA R package and for differential analysis.
Drug sensitivity prediction
The ‘pRRophetic’ R package [39] was employed for estimating drug sensitivity. The ridge regression was implemented to calculate the IC50 value based on the GDSC database.
Immunohistochemistry
We selected pathological specimens from two TNBC patients for immunohistochemical analysis. One patient was diagnosed with severe depression, and the other with mild depression (depression diagnosis was made by professionals using the Hamilton Depression Scale). Upon further analysis, PTGDS, PKM, and RHOB exhibited absolute logFC values greater than 1 (results shown in Supplementary file 3, 4) and showed significant differential expression compared to adjacent normal tissues.
Immunohistochemical staining was performed on 3 μm thick paraffin-embedded sections using PTGDS Rabbit Anti (10754-2-AP, Proteintech), RHOB Rabbit Anti (14326-1-AP, Proteintech), PKM Rabbit Anti (15822-1-AP, Proteintech) and.
Goat Anti-Rabbit IgG H&L (ab205718, abcam). The entire process, including deparaffinization, antigen retrieval, blocking, antibody incubation, DAB staining, hematoxylin counterstaining, dehydration, and mounting, was completed using an automated immunohistochemistry machine (BENCHMARK ULTRA, Roche).
Statistical analysis
All statistical analyses except pathological immunohistochemistry data were done using R software (v4.3.1). Wilcoxon test was utilized for pairwise comparisons (*p ≤0.05; **p ≤ 0.01; ***p ≤0.001; ****p≤ 0.0001). Kaplan–Meier method and log-rank test were applied for survival analyses. The optimal cutoff value of the stemness and risk scores was examined with the “surv_cutpoint” function of the survminer R package (v0.4.6). P value ≤ 0.05 presented statistical significance.
Results
scRNA-seq analysis of marker genes for MDD
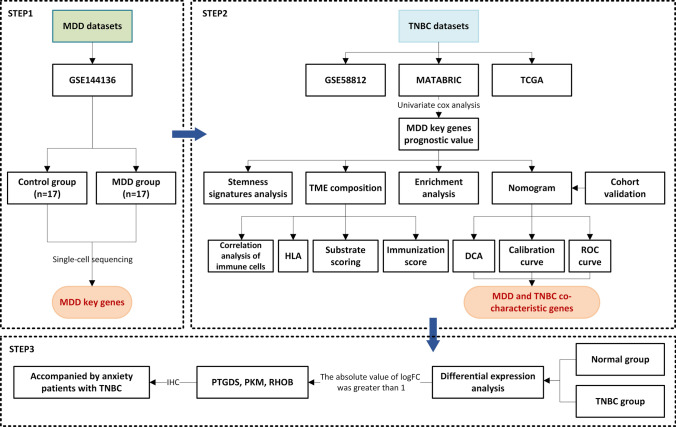
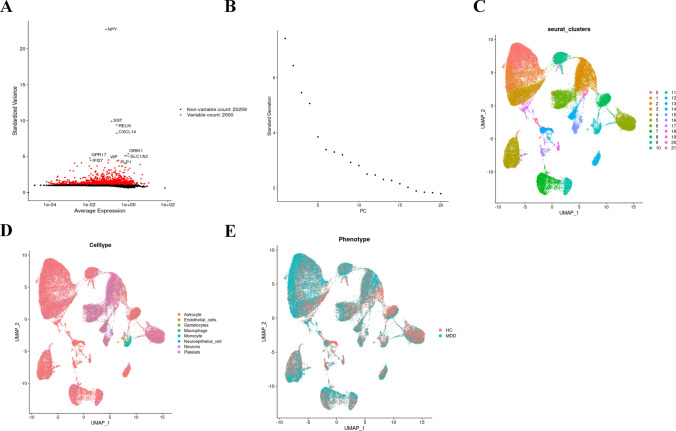
The flow chart of the study design is exhibited in Fig. 1. After the removal of the batch effect, the first 2000 highly variable genes in the cells were obtained (Fig. 2A). Principal component (PC) values were determined with the elbow plot function (Fig. 2B), which indicated that the optimal PC value was 10 because it was the last point where the percentage change in variation exceeded 0.1%. A resolution of 0.5 was confirmed by clustree. Dimensionality reduction by UMAP visualized individual cells into 22 clusters (Fig. 2C), which were then annotated into 8 cell types by SingleR annotation (Fig. 2D). Among them, 298 genes were characterized genes because their levels differed significantly from those in normal cell types (Fig. 2E), with astrocytes being the predominant cells in MDD tissues. Astrocytes are the major type of glial cells in the mammalian central nervous system (CNS) and are strongly associated with depression.
Fig. 1.
Flow chart of this study design
Fig. 2.
Single-cell cluster analysis of MDD and key gene expression in each cluster. A Variable characterization plot, 2000 MDD genes with highly variable expression values were selected to represent the cell spectrum. B Principal component analysis was performed on 2000 genes (C) The first 10 principal components were selected for cluster analysis, and 22 clusters were obtained by co-clustering; D Cellular subgroups were annotated using SingleR, and different colors represented different cell types. E Differential expression was done in normal diseases and a total of 298 differentially expressed genes were obtained. Detailed differentially expressed genes are shown in Appendix A. *p ≤ 0.5; **p ≤ 0.01; ***p ≤ 0.001; ****p ≤ 0.0001
MDD key genes mutated and expressed in TNBC
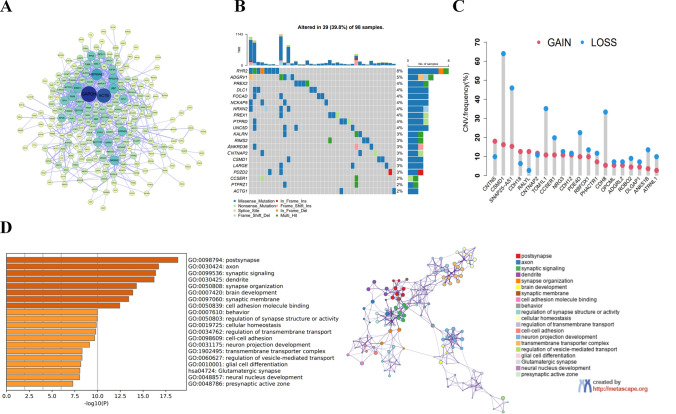
298 DEGs were obtained and then subjected to PPI analysis, which showed that the core genes were densely connected and closely related (Fig. 3A). Summary analysis in the TCGA-TNBC cohort revealed a high incidence of mutations in the first 20 core MDD genes (Fig. 3B). In the TCGA cohort, 39 out of 98 samples (39.8%) had significant gene alterations, and the gene RYR2 exhibited the highest mutation frequency. One study reported that LINC01194 activated the Wnt/β-catenin pathway and accelerated TNBC progression by recruiting NUMA1 to stabilize UBE2C mRNA and enhance RYR2 ubiquitination. Additionally, 20 key MDD genes exhibited significant changes in copy number variation (CNV) in TNBC patients (Fig. 3 C). The GO and KEGG pathway analyses uncovered that MDD gene modules were correlated with neurological class functions such as brain and behavior (Fig. 3D).
Fig. 3.
MDD core gene function and expression in TNBC (A) PPI analysis of key MDD genes. B Frequency of the first 20 MDD core gene expression mutations in 98 TNBC patients in the TCGA database. C Frequencies of CNV gain, loss, and non-CNV among TNBC patients on MDD core genes. D Gene ontology analysis and KEGG pathway analysis of MDD gene interaction networks from the brown module
Prognostic characteristics and value of MDD signature genes in TNBC patients
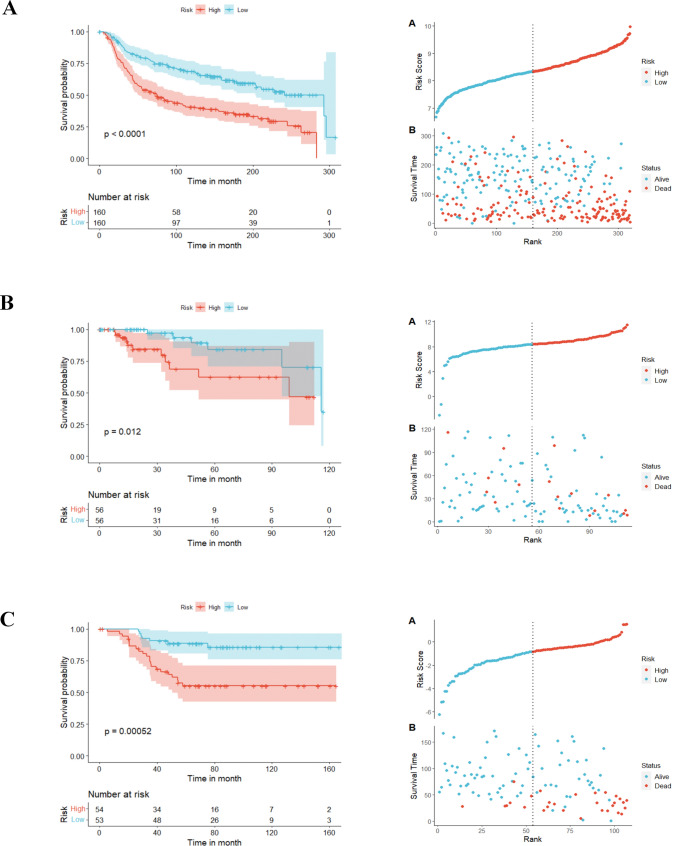
Univariate Cox regression analysis unveiled 28 genes with significant prognostic significance (p ≤ 0.05). To streamline the model with fewer genes, stepAIC analysis ultimately selected 10 MDD genes to construct the prognostic model. The formulation was as follows: Risk score = (− 0.2062) *PTGDS + (1.8077) *FGF14 + (0.4844) *CRLF3 + (− 0.2984) *ST6GALNAC5 + (0.1002) *CKB + (1.0944) *CDH12 + (0.4444) *PKM + (0.3172) *RHOB+ (0.3462) *GNB2 + (0.2333) *HIP1R. Kaplan-Meier method revealed that TNBC patients with high-risk scores had poorer overall survival (OS) probabilities than low-risk individuals from the METABRIC-TNBC dataset (median time = 75.3 months vs. 292.7 months, P < 0.0001, Fig. 4A). Risk score distribution and survival outcomes are presented in Fig. 4A. To verify the robustness of the model, two independent validation groups: the TCGA-TNBC cohort and the GSE58812 cohort were employed. In both validation cohorts, patients with high-risk scores had poorer OS than those with low-risk scores (TCGA-TNBC: median time = 98.8 months vs. 115.7 months, P = 0.012, Fig. 4B; GSE58812: median time = 54.5 months vs. 77.2 months, P = 0.00052, Fig. 4C). These data affirm the robust performance of the 10-gene prognostic model in predicting TNBC prognosis across multiple datasets.
Fig. 4.
Prognostic characteristics of MDD signature genes in TNBC patients and their prognostic value (A) Kaplan-Meier survival curves and Risk Score plots of OS of patients in the high-risk and low-risk groups in the METABRIC-TNBC cohort. B Kaplan-Meier survival curves and Risk Score plots of OS of patients in the high-risk and low-risk groups in the TCGA-TNBC cohort. C Kaplan-Meier survival curves and Risk Score plots of OS of patients in the high-risk and low-risk groups in the GSE55812 cohort. *p ≤ 0.5; **p ≤ 0.01; ***p ≤ 0.001; ****p ≤ 0.0001
Clinical characteristics of TNBC and applicability of the nomogram
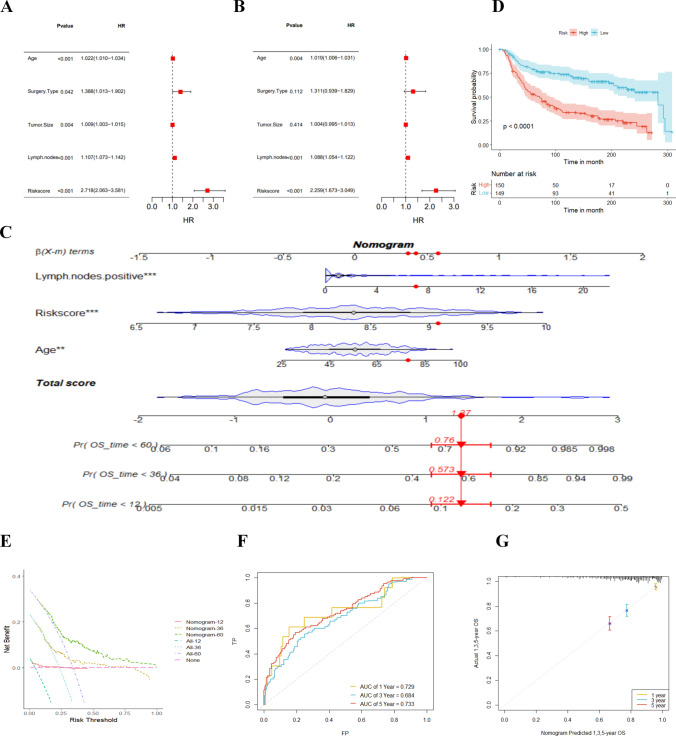
Univariate and multivariate Cox analyses identified age, lymph node, and risk score as independent prognostic indicators for TNBC patients (Fig. 5A, B). To make the model clinically applicable and feasible, we established a Nomogram based on the METABRIC cohort with age, lymph node, and risk score as predictors of OS (Fig. 5C). The Nomogram-based low-risk group manifested a better prognosis (Fig. 5D). The AUC of the combined model for 1-, 3- and 5 year OS were 0.729, 0.684, and 0.753, respectively (Fig. 5F), which were all roughly at 0.7. Furthermore, the calibration curve manifested the prediction accuracy of the nomogram (Fig. 5G). Additionally, DCA (Fig. 5E) elicited that the nomogram better predicted the 3- and 5 year OS, providing more net clinical benefits than the 1 year OS. Overall, our developed nomogram demonstrates prognostic power and clinical applicability for TNBC patients based on these important clinical parameters.
Fig. 5.
Prognostic impact of risk score and clinical characteristics of TNBC patients. A Univariate and (B) multivariate Cox analyses assessing prognosis and clinical characteristics including age, type of surgery, tumor size, lymph nodes, and risk score. C Column line plot of risk scores and clinical characteristics predicting 1-, 3-, and 5 year survival in the TCGA-TNBC cohort. D Kaplan-Meier survival curves based on column-line plots defining overall survival in high and low-risk patients with a validation set of the METABRIC cohort population. E Decision curve analysis, a specific method developed to assess the prognostic value of a column line plot strategy, where the column line plot with the greatest net benefit would be the most preferred model. F Survival ROC plots to determine the sensitivity and specificity of TNBC survival-related genes as indicators for determining survival. G Calibration curves of the TNBC risk factors nomogram. *p ≤ 0.5; **p ≤ 0.01; ***p ≤ 0.001; ****p ≤ 0.0001
MDD prognostic signature genes are expressed in immune cells and promote TNBC development
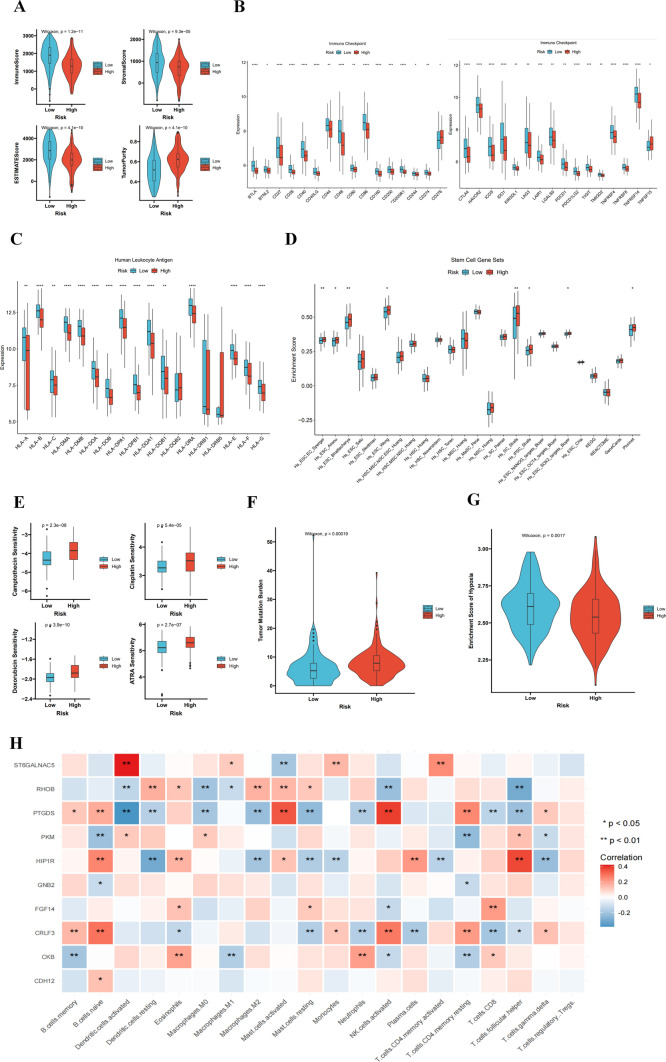
In the TME, the ratio of immune and stromal cells could significantly affect the prognosis. The results verified that the low-risk group had a better prognosis than the high-risk group, the low-risk group had higher stromal score, immune score, and estimate score than the high-risk group (Fig. 6A). Our research shows that there is a significant difference between the low-risk group and the high-risk group. Patients in the low-risk group have higher levels of immune checkpoints, making them more suitable for immunotherapy (Fig. 6B). HLA phenotypes have great influences on the efficacy of immunotherapy drugs. The greater the HLA diversity, the more types of neoantigens can be delivered. Our study found 12 significant differences in phenotypes (Fig. 6C), HLA phenotypes play a critical role in determining the effectiveness of immunotherapy. Increased HLA diversity correlates with a broader array of neoantigens. This study found 12 significant differences in phenotypes (Fig. 6C), suggesting that immunotherapy is more effective in low-risk patients. The stemness index was elevated in high-risk patients, suggesting higher intratumor heterogeneity (Fig. 6D). The GDSC dataset demonstrated that high-risk patients had higher IC50 values for the four drugs, suggesting less sensitivity to chemotherapeutic agents, Camptothecin, and ARTA (Fig. 6E). This implies that the high-risk patients are resistant to conventional therapeutic modalities, highlighting a need for the development of completely new therapeutic approaches. Of note, increased levels of stemness-related factors are correlated with tumor recurrence, drug resistance, and cell proliferation. Tumor-loaded mutation scores were also markedly higher in high-risk patients (Fig. 6F). In addition, the low-risk group had greater immune cell infiltration than the high-risk group (Fig. 6G), suggesting that the low-risk group is more likely to benefit from immunotherapy. Additionally, the results show that 10 MDD characteristic genes are closely related to immune cells in triple-negative breast cancer (Fig. 6H), with red indicating a positive correlation with immune cell infiltration and blue indicating a negative correlation. Among these, the following genes exhibit a strong correlation with immune cells in the TNBC tumor microenvironment: ST6GLNAC5, PTGDS, HIP1R, and RHOB, especially with cytotoxic CD8 + T cells, antigen-presenting dendritic cells, and natural killer cells. These analyses suggest that MDD characteristic genes play a role in regulating the immune microenvironment of TNBC.
Fig. 6.
Immune microenvironment analysis of MDD signature genes in TNBC. A Differences in TME scores between high- and low-risk groups (B) Differences in immune cell infiltration between high- and low-risk groups. C Differences in human leukocyte antigen cells between high- and low-risk groups. D Differences between high- and low-risk groups in tumor stem cell expression. E Sensitivity of high- and low-risk groups to different anticancer drugs (F) Differences in tumor mutation load between high- and low-risk groups. G Immune cell infiltration in high- and low-risk scoring groups. H Heatmap of the association between MDD characteristic genes and TNBC immune cells. MDD-TNBC refers to TNBC patients with major depressive disorder, while MD-TNBC refers to TNBC patients with mild depressive disorder. *p ≤ 0.5; **p ≤ 0.01; ***p ≤ 0.001; ****p ≤ 0.0001
Expression and mutations of MDD characteristic genes in TNBC
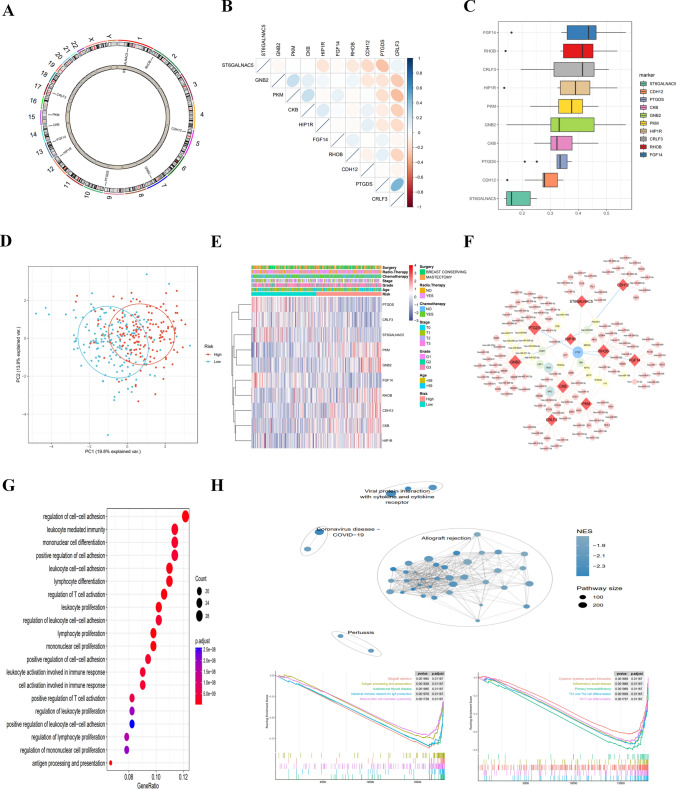
The localization of the 10 characteristic genes on human chromosomes is displayed in (Fig. 7A). Pearson analysis indicated that PTGDS expression was strongly and positively correlated with CRLF3 expression and negatively correlated with ST6GALNAC5 expression, and PKM expression was strongly and negatively correlated with CRLF3 expression (Fig. 7B). GO semantic similarity analysis showed that FGF14 had the highest functional similarities (Fig. 7C), indicating the more important role of FGF14 in the function. The PCA plot revealed quite different gene expression patterns between the high-risk and low-risk groups (Fig. 7D). The expression differences of 10 characteristic genes were comprehensively evaluated to explore the molecular characteristics. The results exhibited differences in the characteristic gene expression profiles and clinical features between the high-risk and low-risk groups (Fig. 7E). To further elucidate the molecular mechanism of 10 characteristic genes, the Network analyst online tool was used to predict the interaction network of miRNA-characteristic genes-transcription factors (Fig. 7F).
Fig. 7.
Transcriptional alterations and expression of MDD marker genes in TNBC disease and enrichment pathway analysis of risk genes. A Localization of CNV alterations on MDD marker genes on chromosome 23. B Correlation study of the expression of 10 MDD marker genes (C) Correlation visualization plot of 10 MDD marker genes in TNBC disease. D Principal component analysis showing significant differences between MDD marker high-risk and low-risk cohorts (E) Heatmap showing differences in clinical information and expression between MDD marker high-risk and low-risk cohorts (F) Regulatory network map of miRNA-transcription factors for 10 key genes. G Bubble diagram showing the results of KEGG enrichment analysis. H GSEA analyses of different KEGG pathways were clustered in the high-risk and low-risk groups. *p ≤ 0.5; **p ≤ 0.01; ***p ≤ 0.001; ****p ≤ 0.0001
Functional enrichment analysis of low-risk and high-risk populations
Using differential gene GO BP analysis between the high-risk group and the low-risk group, the results showed that the differential genes were focused on immune functions (Fig. 7G). To figure out the potential differences in biological functions, GSEA identified the 10 most enriched pathways (Fig. 7H). The low-risk populations were mainly related to immune function, including allograft rejection, antigen processing and presentation, intestinal immune network for IgA production, autoimmune thyroid disease, natural killer cell-mediated cellular toxicity, primary immunodeficiency, cytokine-cytokine receptor interactions, inflammatory bowel disease, Th1 and Th2 cell differentiation, and Th17 cell differentiation.
Expression of some MDD characteristic genes in TNBC patients
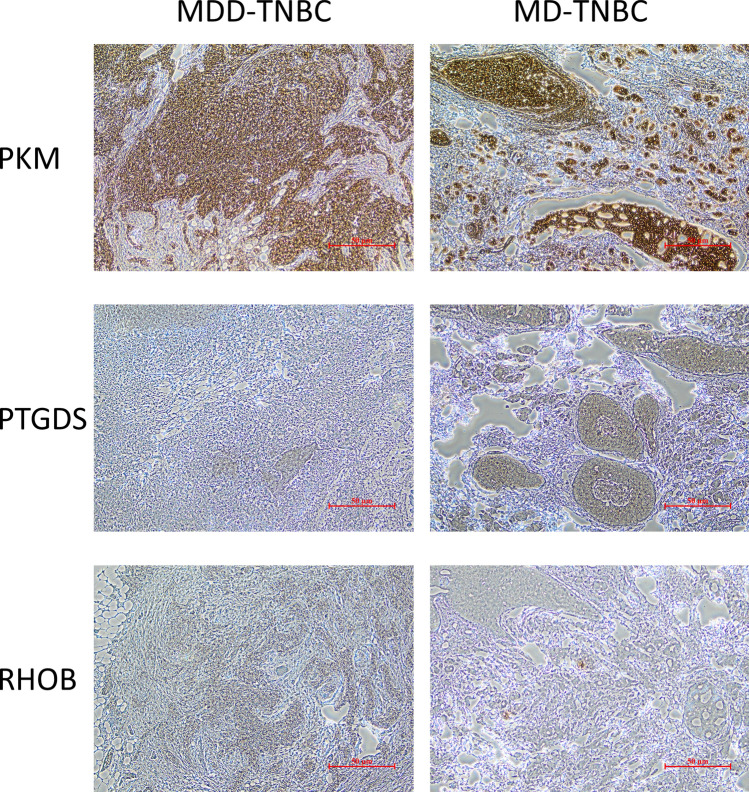
The immunohistochemical staining results (Fig. 8) show that PKM, RHOB, and PTGDS genes are expressed in both major depressive disorder (MDD) TNBC patients and mild depressive disorder (MD) TNBC patients. These results validate the expression of MDD characteristic genes in triple-negative breast cancer patients. Interestingly, compared to mild depressive disorder patients, PKM and RHOB are highly expressed in major depressive disorder patients, while PTGDS is lowly expressed. However, since the patient sample size is only two, these results may be coincidental. We will further explore and validate these findings in future studies.
Fig. 8.
Representative images of immunohistochemical staining for MDD characteristic genes proteins (PTGDS, PKM, and RHOB) in tumor tissues from TNBC patients. (Bar = 50 μm)
Discussion
TNBC is recognized as the most aggressive type of BC, with a considerable incidence of distant metastases and a lack of accurate and effective therapeutic targets. To date, many studies have suggested an extremely high incidence of BC and anxiety-depressive disorders, and approximately 84% of patients with advanced BC experience anxiety-depression [40]. Mutations in the genetic region of the FKBP5 allele have been identified in MDD individuals, leading to dysfunctions of the hypothalamic-pituitary-adrenal (HPA) axis and enhanced blood cortisol and plasma adrenocorticotropic hormone [41]. Enhanced cortisol levels and impaired inhibitory mechanisms disrupt the communication between the HPA axis and/or the CNS and the immune system [42], ultimately inducing an inflammatory response [43]. Chronic inflammation and immune responses are two core element that characterize the tumor microenvironment. A large number of immune/inflammatory cells (including tumor associated macrophages, neutrophils and myeloid derived suppressor cells) as well as cytokines (such as IL-6, IL-10, TGF-β) are present in the tumor microenvironment, which results in both a chronic inflammatory state and immunosuppression [23]. Immunization processes are associated with the pathophysiology of both MDD and TNBC. Few studies have delved into the relevance of MDD and TNBC in terms of pathogenesis. We propose that MDD signature genes may be expressed in immune cells and promote TNBC progression, thus affecting patient prognosis and immunotherapy responses. In recent years, integrated bioinformatics analysis based on massive data has been increasingly used to uncover new genes and potential diagnostic or prognostic biomarkers, providing additional insights into disease pathogenesis and potential treatment options [44, 45].
The heterogeneous nature of TNBC leads to different clinical outcomes and treatment sensitivities [46]. Hence, we developed a new MDD-related model to facilitate risk stratification and personalized treatment. Brain nuclear tissues were annotated from 34 MDD suicide patients from the GSE144136 dataset. Twenty-two cell clusters were classified into eight cell types, namely Astrocytes, Endothelial cells, Gametocytes, Macrophages, Neuroepithelial cells, Neurons, and Platelets. Our analysis suggested that astrocytes are the major cell type and the characteristic cells in MDD. Astrocytes can promote inflammatory signals and regulate numerous physiological and pathological processes in the CNS [47]. Emerging evidence suggests the implication of astrocyte dysfunction in MDD pathogenesis. Activated astrocytes facilitate the production of pro-inflammatory cytokines like interleukin IL-1β and TNF-α to induce depressive symptoms [48–52]. Of note, 298 genes were identified as signature genes due to their substantially differential levels from those in normal cell types. These 298 MDD signature genes had significant (39.8%) genetic alterations in the TCGA-TNBC cohort. A higher frequency of mutations in tumor cells is linked to an increased likelihood of generating aberrant proteins, which in turn enhances the immune system’s recognition and activates the body’s immune response [53]. These data suggest that TNBC populations characterized by MDD signature genes may benefit from immunotherapy.
The risk scores of the patients were calculated and 320 samples of the METABRIC dataset were categorized into high- and low-risk groups as a training set. The survival of low-risk patients was visibly longer than that of high-risk patients, similar to the result in the TCGA and GSE55812 datasets. Further clinical analyses in both univariate and Cox analyses confirmed age, lymph nodes, and risk scores as independent prognostic factors for TNBC, which further validated our inference. TNBC is recognized as an early-onset subtype of BC due to its significant ability to evade immune responses [54, 55].
The inflammatory hypothesis of MDD, also known as the monocyte/macrophage theory, posits that these cells are primary producers of pro-inflammatory cytokines [56, 57]. Research findings have shown that inflammatory genes are overexpressed in monocytes of MDD patients [58, 59]. In the context of solid tumors, patients who respond to treatment typically display a ‘hot’ (‘immune-inflamed’) phenotype, characterized by T lymphocyte infiltration, whereas non-responders may exhibit a ‘cold’ (‘immune-desert’/‘immune-excluded’) phenotype, characterized by the absence or exclusion of T cells in the tumor parenchyma [60]. TNBC high- and low-risk groups distinguished by MDD characteristic inflammatory genes exhibited significant differences in T-lymphocyte infiltration, which are critical for identifying potential benefits from immunotherapy. Consistently, our results showed higher stromal score, immune score, and proportion of immune cells in the low-risk group. The TME of BC is an intricate system that can be classified into an immune cells-dominated TME and a fibroblasts-dominated non-immune TME. In this regard, the genetic profiles of immune cells (genes related to gene transcription and proliferation) and TILs may be particularly important for tumor progression, therapeutic response, and prognostic value for TNBC patients with limited therapeutic options and unfavorable outcomes [61]. We detected the immune infiltration of various types of immune cells and observed that the low-risk group had a higher percentage of immune infiltration, indicating that they might be more sensitive to immunotherapy. TNBC is characterized by high proliferation and therefore high levels of TILs, partly due to increased genomic instability and mutational load, thus affecting the immune system to clear cells carrying non-self-antigens [62]. Unsurprisingly, the present study revealed that CD8T and T cells were predominantly enriched in low-risk populations, with cytotoxic T cells suggesting a favorable prognosis in early TNBC.
Finally, an important philosophical cognitive difference persists within the field. Descartes’s interactionism holds that the mind and body are mutually independent entities that can interact with each other. Contemporary neuroscientists are now increasingly aware of the influence of mental states on peripheral physiological processes. Nevertheless, a significant portion of people still believe that immune and inflammatory markers are merely incidental phenomena without any causal relationship to the physiology and pathology of mental diseases [19].
Conclusion
In this study, we used transcriptomics to identify previously undiscovered molecular links between MDD and TNBC. The characteristic genes of MDD can regulate the immune microenvironment of TNBC. Based on MDD characteristic genes, the TNBC population was divided into high-risk and low-risk groups. The low-risk group exhibited higher immune cell infiltration and might benefit more from immunotherapy. These results not only help in identifying biomarkers for TNBC prognosis and sensitivity to immunotherapy but also provide potential therapeutic targets for MDD.
Supplementary material
Supplementary Material 1. The expression levels of MDD characteristic genes in human-derived triple-negative breast cancer cell lines were obtained from the Cancer Cell Line Encyclopedia database (https://sites.broadinstitute.org/ccle).
Supplementary Material 2. According to the most comprehensive and up-to-date set of published stemness signatures defined by RNAi screening, gene expression profiling, target gene sets of transcription factors, literature, and computational summaries.
Supplementary Material 3. Significant differential expression of 10 MDD feature genes in TNBC.
Supplementary Material 4. Differential expression of 10 MDD feature genes in normal tissues and TNBC.
Acknowledgements
We sincerely acknowledge the contributions from the GEO database (www.ncbi.nlm.nih.gov/geo), Molecular Taxonomy of Breast Cancer International Consortium (METABRIC) ((http://www.cbioportal.org/), The Cancer Genome Atlas (TCGA) (https://portal.gdc.cancer.gov/repository), and the Cancer Cell Line Encyclopedia database(https://sites.broadinstitute.org/ccle/).
Abbreviations
- TNBC
Triple-negative breast cancer
- MDD
Major depressive disorder
- ScRNA-seq
Single-cell mRNA sequence
- GEO
Gene expression omnibus
- TCGA
The Cancer Genome Atlas
- DO
Disease ontology
- KEGG
Kyoto encyclopedia of genes and genomes
- GDSC
Genomics of drug sensitivity in cancer
- TME
Tumor microenvironment
- DCA
Decision curve analysis
- ROC
Receiver operating characteristic curve
- HLA
Human leukocyte antigen
- MDSCs
Myeloid-derived suppressor cells
- PTGIS
Prostaglandin I2 synthase
- FGF14
Fibroblast growth factor 14
- CRLF3
Cytokine receptor like factor 3
- ST6GLNAC
St6 n-acetylgalactosaminide alpha-2,6-sialyltransferase
- CKB
Creatine kinase b
- CDH12
Cadherin 12
- PKM
Pyruvate kinase m1/2
- RHOB
Ras homolog family member b
- GNB2
G protein subunit beta 2
- HIP1R
Huntingtin interacting protein 1 related
Author contributions
Zhili Zhuo has made major contributions to this manuscript, designed the research, wrote the main part of the manuscript, and performed bioinformatics analysis. Wenping Lu supported and guided this study, and contributed to the language modification and manuscript revision. Ling Zhang performed the pathological examination and participated in the discussion of the analysis. Xiaoqing Wu and Lei Chang conducted statistical analysis, Yongjia Cui and Dongni Zhang edited the figures. Heting Mei and Qingya Song contributed to reference search. All authors contributed to the article and approved the submitted version.
Funding
High Level Chinese Medical Hospital Promotion Project - Special Project on Formulation R&D and New Drug Translation for Medical Institutions (HLCMHPP2023037). Upgrading the development and promotion of about 30 integrated Chinese and Western medicine diagnosis and treatment programs (Guidelines for the Diagnosis and Treatment of Breast Cancer with the Combination of Traditional Chinese Medicine and Western Medicine) (ZYZB-2022-798).
Data availability
The datasets analyzed during the current study are available in the GEO database (www.ncbi.nlm.nih.gov/geo), Molecular Taxonomy of Breast Cancer International Consortium (METABRIC) ((http://www.cbioportal.org/), and The Cancer Genome Atlas (TCGA) (https://portal.gdc.cancer.gov/repository). The accession numbers of GEO datasets are GSE58812 and GSE144136. The expression of MDD characteristic genes in TNBC cell lines was obtained from the Cancer Cell Line Encyclopedia database(https://sites.broadinstitute.org/ccle/).
Declarations
Ethics approval and consent to participate
This study was approved by the Ethics Committee of Guang’anmen Hospital, China Academy of Chinese Medical Sciences, ethics approval number 2022-179-KY. This protocol was reviewed and approved by the Ethics Committee of Guang’anmen Hospital, China Academy of Chinese Medical Sciences, in accordance with the ethical guidelines of the World Medical Association’s Declaration of Helsinki (2013), the Council for International Organizations of Medical Sciences (CIOMS), and the World Health Organization (WHO) International Ethical Guidelines for Health-Related Research Involving Humans. Informed consent was obtained from all participants.
Consent for publication
Not applicable.
Competing interests
The authors declare no competing interests.
Footnotes
Publisher’s note
Springer Nature remains neutral with regard to jurisdictional claims in published maps and institutional affiliations.
References
- 1.Bray F, et al. Global cancer statistics 2022: GLOBOCAN estimates of incidence and mortality worldwide for 36 cancers in 185 countries. Cancer J Clin. 2024;74(3):229–63. [DOI] [PubMed] [Google Scholar]
- 2.Sung H, et al. Global cancer statistics 2020: GLOBOCAN estimates of incidence and mortality worldwide for 36 cancers in 185 countries. Cancer J Clin. 2021;71(3):209–49. [DOI] [PubMed] [Google Scholar]
- 3.Kumar P, Aggarwal R. An overview of triple-negative breast cancer. Arch Gynecol Obstet. 2016;293(2):247–69. [DOI] [PubMed] [Google Scholar]
- 4.Lin NU, et al. Clinicopathologic features, patterns of recurrence, and survival among women with triple-negative breast cancer in the national comprehensive cancer network. Cancer. 2012;118(22):5463–72. [DOI] [PMC free article] [PubMed] [Google Scholar]
- 5.Waks AG, Winer EP. Breast cancer treatment. Rev JAMA. 2019;321(3):288–300. [DOI] [PubMed] [Google Scholar]
- 6.Schmid P, et al. Atezolizumab and nab-paclitaxel in advanced triple-negative breast cancer. N Engl J Med. 2018;379(22):2108–21. [DOI] [PubMed] [Google Scholar]
- 7.Denkert C, et al. Tumour-infiltrating lymphocytes and prognosis in different subtypes of breast cancer: a pooled analysis of 3771 patients treated with neoadjuvant therapy. Lancet Oncol. 2018;19(1):40–50. [DOI] [PubMed] [Google Scholar]
- 8.Fehrenbacher L, et al. Atezolizumab versus docetaxel for patients with previously treated non-small-cell lung cancer (POPLAR): a multicentre, open-label, phase 2 randomised controlled trial. Lancet (London England). 2016;387(10030):1837–46. [DOI] [PubMed] [Google Scholar]
- 9.Loi S, et al. Tumor-infiltrating lymphocytes and prognosis: a pooled individual patient analysis of early-stage triple-negative breast cancers. J Clin Oncol Off J Am Soc Clin Oncol. 2019;37(7):559–69. [DOI] [PMC free article] [PubMed] [Google Scholar]
- 10.Topalian SL, et al. Safety, activity, and immune correlates of anti-PD-1 antibody in cancer. N Engl J Med. 2012;366(26):2443–54. [DOI] [PMC free article] [PubMed] [Google Scholar]
- 11.Luen S, et al. The genomic landscape of breast cancer and its interaction with host immunity. Breast (Edinburgh Scotland). 2016;29:241–50. [DOI] [PubMed] [Google Scholar]
- 12.Schumacher TN, Schreiber RD. Neoantigens in cancer immunotherapy. Science. 2015. 348(6230): 69–74. [DOI] [PubMed]
- 13.Diseases GBDaI. Global burden of 369 diseases and injuries in 204 countries and territories, 1990–2019: a systematic analysis for the global burden of disease study 2019. Lancet (London, England). 2020;396(10258):1204–22. [DOI] [PMC free article] [PubMed] [Google Scholar]
- 14.Belmaker RH, Agam G. Major depressive disorder. N Engl J Med. 2008;358(1):55–68. [DOI] [PubMed] [Google Scholar]
- 15.Benros ME, et al. Autoimmune diseases and severe infections as risk factors for mood disorders: a nationwide study. JAMA Psychiatry. 2013;70(8):812–20. [DOI] [PubMed] [Google Scholar]
- 16.Bortolato B, et al. Depression in cancer: the many biobehavioral pathways driving tumor progression. Cancer Treat Rev. 2017;52:58–70. [DOI] [PubMed] [Google Scholar]
- 17.Windle M, Windle RC. Recurrent depression, cardiovascular disease, and diabetes among middle-aged and older adult women. J Affect Disord. 2013;150(3):895–902. [DOI] [PMC free article] [PubMed] [Google Scholar]
- 18.Katon WJ. Epidemiology and treatment of depression in patients with chronic medical illness. Dialog Clin Neurosci, 2011. 13(1). [DOI] [PMC free article] [PubMed]
- 19.Beurel E, Toups M, Nemeroff CB. The bidirectional relationship of depression and inflammation: double trouble. Neuron. 2020;107(2):234–56. [DOI] [PMC free article] [PubMed] [Google Scholar]
- 20.Gonzales EL, et al. Correlation between immune-related genes and depression-like features in an animal model and in humans. Behav Immun. 2023;113:29–43. Brain. [DOI] [PubMed] [Google Scholar]
- 21.Anuk D, et al. The characteristics and risk factors for common psychiatric disorders in patients with cancer seeking help for mental health. BMC Psychiatry. 2019;19(1):269. [DOI] [PMC free article] [PubMed] [Google Scholar]
- 22.Maass SWMC et al. Long-term psychological distress in breast cancer survivors and their matched controls: a cross-sectional study. Maturitas. 2019. 10.1016/j.maturitas.2019.09.003 [DOI] [PubMed]
- 23.Li L, et al. Effects of immune cells and cytokines on inflammation and immunosuppression in the tumor microenvironment. Int Immunopharmacol. 2020;88:106939. [DOI] [PubMed] [Google Scholar]
- 24.Slavich GM, Irwin MR. From stress to inflammation and major depressive disorder: a social signal transduction theory of depression. Psychol Bull. 2014;140(3):774–815. [DOI] [PMC free article] [PubMed] [Google Scholar]
- 25.Berraondo P, et al. Innate immune mediators in cancer: between defense and resistance. Immunol Rev. 2016;274(1):290–306. [DOI] [PubMed] [Google Scholar]
- 26.Han TJ, et al. Association of childhood trauma with fatigue, depression, stress, and inflammation in breast cancer patients undergoing radiotherapy. Psycho-oncology. 2016;25(2):187–93. [DOI] [PMC free article] [PubMed] [Google Scholar]
- 27.Mundy-Bosse BL, et al. Psychological stress is associated with altered levels of myeloid-derived suppressor cells in breast cancer patients. Cell Immunol. 2011;270(1):80–7. [DOI] [PMC free article] [PubMed] [Google Scholar]
- 28.Nakamura K, Smyth MJ. Myeloid immunosuppression and immune checkpoints in the tumor microenvironment. Cell Mol Immunol, 2020. 17(1). [DOI] [PMC free article] [PubMed]
- 29.Renzi C, et al. Stress exposure in significant relationships is associated with lymph node status in breast cancer. PLoS ONE. 2016;11(2):e0149443. [DOI] [PMC free article] [PubMed] [Google Scholar]
- 30.Man YG, et al. Tumor-infiltrating immune cells promoting tumor invasion and metastasis: existing theories. J Cancer. 2013;4(1):84–95. [DOI] [PMC free article] [PubMed] [Google Scholar]
- 31.Castro-Figueroa EM, et al. Depression, anxiety, and social environmental adversity as potential modulators of the immune tumor microenvironment in breast cancer patients. Med Sci. 2021; 9: 2. [DOI] [PMC free article] [PubMed]
- 32.Nagy C, et al. Single-nucleus transcriptomics of the prefrontal cortex in major depressive disorder implicates oligodendrocyte precursor cells and excitatory neurons. Nat Neurosci. 2020;23(6):771–81. [DOI] [PubMed] [Google Scholar]
- 33.Jézéquel P, et al. Gene-expression molecular subtyping of triple-negative breast cancer tumours: importance of immune response. Breast Cancer Res BCR. 2015;17:43. [DOI] [PMC free article] [PubMed] [Google Scholar]
- 34.Szklarczyk D, et al. The STRING database in 2021: customizable protein-protein networks, and functional characterization of user-uploaded gene/measurement sets. Nucl Acid Res. 2021;49(D1):D605-12. [DOI] [PMC free article] [PubMed] [Google Scholar]
- 35.Newman AM, et al. Robust enumeration of cell subsets from tissue expression profiles. Nat Methods. 2015;12(5):453–7. [DOI] [PMC free article] [PubMed] [Google Scholar]
- 36.The Gene Ontology Consortium. The gene ontology resource: 20 years and still GOing strong. Nucl Acid Res. 2019. 47(D1): D330–8. [DOI] [PMC free article] [PubMed]
- 37.Kanehisa M, Goto S. KEGG: kyoto encyclopedia of genes and genomes. Nucl Acid Res. 2000;28(1):27–30. [DOI] [PMC free article] [PubMed] [Google Scholar]
- 38.Xu Q, et al. Landscape of immune microenvironment under immune cell infiltration pattern in breast cancer. Front Immunol. 2021;12:711433. [DOI] [PMC free article] [PubMed] [Google Scholar]
- 39.Geeleher P, Cox N, Huang RS. pRRophetic: an R package for prediction of clinical chemotherapeutic response from tumor gene expression levels. PLoS ONE. 2014;9(9):e107468. [DOI] [PMC free article] [PubMed] [Google Scholar]
- 40.Mitchell AJ, et al. Depression and anxiety in long-term cancer survivors compared with spouses and healthy controls: a systematic review and meta-analysis. Lancet Oncol. 2013;14(8):721–32. [DOI] [PubMed] [Google Scholar]
- 41.Hennings JM, et al. Polymorphisms in the BDNF and BDNFOS genes are associated with hypothalamus-pituitary axis regulation in major depression. Prog Neuro-psychopharmacol Biol Psychiatry. 2019;95:109686. [DOI] [PubMed] [Google Scholar]
- 42.Ramírez LA, et al. A new theory of depression based on the serotonin/kynurenine relationship and the hypothalamicpituitary- adrenal axis. Biomedica Revista Del Instituto Nacional De Salud; 2018. 38: 437–50. 3. [DOI] [PubMed]
- 43.Maes M, Noto C, Brietzke E. Omics-based depression and inflammation research. Revista Brasileira De Psiquiatria (Sao Paulo, Brazil: 1999). 2015. 37(1): 1–2. [DOI] [PubMed]
- 44.Cao C, et al. Deep learning and its applications in biomedicine. Genom Proteom Bioinform. 2018;16(1):17–32. [DOI] [PMC free article] [PubMed] [Google Scholar]
- 45.Tran KA, et al. Deep learning in cancer diagnosis, prognosis and treatment selection. Genome Med. 2021;13(1):152. [DOI] [PMC free article] [PubMed] [Google Scholar]
- 46.Jiang Y-Z, et al. Molecular subtyping and genomic profiling expand precision medicine in refractory metastatic triple-negative breast cancer: the FUTURE trial. Cell Res. 2021;31(2):178–86. [DOI] [PMC free article] [PubMed] [Google Scholar]
- 47.Linnerbauer M, Wheeler MA, Quintana FJ. Astrocyte crosstalk in CNS inflammation. Neuron. 2020;108(4):608–22. [DOI] [PMC free article] [PubMed] [Google Scholar]
- 48.Cao X, et al. Astrocyte-derived ATP modulates depressive-like behaviors. Nat Med. 2013;19(6):773–7. [DOI] [PubMed] [Google Scholar]
- 49.Kaufmann FN, Menard C. Inflamed astrocytes: a path to depression led by Menin. Neuron. 2018;100(3):511–3. [DOI] [PubMed] [Google Scholar]
- 50.Leng L, et al. Menin deficiency leads to depressive-like behaviors in mice by modulating astrocyte-mediated meuroinflammation. Neuron. 2018;100(3). [DOI] [PubMed]
- 51.Liu J, et al. Astrocyte dysfunction drives abnormal resting-state functional connectivity in depression. Sci Adv. 2022;8(46):eabo2098. [DOI] [PMC free article] [PubMed] [Google Scholar]
- 52.Nagy EE, et al. Neuroinflammation and microglia/macrophage phenotype modulate the molecular background of post-stroke depression: a literature review. Exp Therapeutic Med. 2020;20(3):2510–23. [DOI] [PMC free article] [PubMed] [Google Scholar]
- 53.Chan TA, et al. Development of tumor mutation burden as an immunotherapy biomarker: utility for the oncology clinic. Ann Oncol Off J Eur Soc Med Oncol. 2019;30(1):44–56. [DOI] [PMC free article] [PubMed] [Google Scholar]
- 54.Dixon-Douglas J, Loi S. Immunotherapy in early-stage triple-negative breast cancer: where are we now and where are we headed? Curr Treat Opt Oncol. 2023;24(8):1004–20. [DOI] [PMC free article] [PubMed] [Google Scholar]
- 55.Kudelova E et al. Genetic heterogeneity, tumor microenvironment and immunotherapy in triple-negative breast cancer. Int J Mol Sci, 2022. 10.3390/ijms232314937. [DOI] [PMC free article] [PubMed]
- 56.Simon MS, et al. Monocyte mitochondrial dysfunction, inflammaging, and inflammatory pyroptosis in major depression. Prog Neuro-psychopharmacol Biol Psychiatry. 2021;111:110391. [DOI] [PubMed] [Google Scholar]
- 57.Smith RS. The macrophage theory of depression. Med Hypotheses. 1991;35(4):298–306. [DOI] [PubMed] [Google Scholar]
- 58.Chiang JJ, et al. Depressive symptoms and immune transcriptional profiles in late adolescents. Brain Behav Immun. 2019;80:163–9. [DOI] [PMC free article] [PubMed] [Google Scholar]
- 59.Hasselmann H, et al. Pro-inflammatory monocyte phenotype and cell-specific steroid signaling alterations in unmedicated patients with major depressive disorder. Front Immunol. 2018;9:2693. [DOI] [PMC free article] [PubMed] [Google Scholar]
- 60.Zhang J, et al. Turning cold tumors hot: from molecular mechanisms to clinical applications. Trend Immunol. 2022;43(7):523–45. [DOI] [PubMed] [Google Scholar]
- 61.Derakhshan F, Reis-Filho JS. Pathogenesis of triple-negative breast cancer. Ann Rev Pathol. 2022;17:181–204. [DOI] [PMC free article] [PubMed] [Google Scholar]
- 62.Ribeiro R, et al. Immunotherapy in triple-negative breast cancer: insights into tumor immune landscape and therapeutic opportunities. Front Mol Biosci. 2022;9:903065. [DOI] [PMC free article] [PubMed] [Google Scholar]
Associated Data
This section collects any data citations, data availability statements, or supplementary materials included in this article.
Supplementary Materials
Supplementary Material 1. The expression levels of MDD characteristic genes in human-derived triple-negative breast cancer cell lines were obtained from the Cancer Cell Line Encyclopedia database (https://sites.broadinstitute.org/ccle).
Supplementary Material 2. According to the most comprehensive and up-to-date set of published stemness signatures defined by RNAi screening, gene expression profiling, target gene sets of transcription factors, literature, and computational summaries.
Supplementary Material 3. Significant differential expression of 10 MDD feature genes in TNBC.
Supplementary Material 4. Differential expression of 10 MDD feature genes in normal tissues and TNBC.
Data Availability Statement
The datasets analyzed during the current study are available in the GEO database (www.ncbi.nlm.nih.gov/geo), Molecular Taxonomy of Breast Cancer International Consortium (METABRIC) ((http://www.cbioportal.org/), and The Cancer Genome Atlas (TCGA) (https://portal.gdc.cancer.gov/repository). The accession numbers of GEO datasets are GSE58812 and GSE144136. The expression of MDD characteristic genes in TNBC cell lines was obtained from the Cancer Cell Line Encyclopedia database(https://sites.broadinstitute.org/ccle/).


