Abstract
Background
Stomach adenocarcinoma (STAD) represents a significant global health burden, accounting for a considerable proportion of cancer-related mortalities, and NUAK1, a protein kinase, plays a crucial role in cellular metabolism, cell cycle regulation, migration, and tumor progression. However, its relationship with prognosis and immune infiltration in STAD has not been thoroughly investigated.
Methods
RNA sequencing data from the Cancer Genome Atlas (TCGA) and Genotypic Tissue Expression Project (GTEx) databases were employed to assess disparities in NUAK1 expression between STAD tumour and normal tissues. Additionally, we investigated the correlation between NUAK1 expression and patient prognosis, in addition to the level of immune cell infiltration. The potential functions were elucidated through an examination of the Gene Ontology (GO) Encyclopedia, the Kyoto Encyclopedia of Genes and Genomes (KEGG), and an enrichment analysis (GSEA). The GeneMANIA was used to validate the functions of nuak1-related genes.
Results
Our analysis demonstrated that NUAK1 expression in tumour tissues exhibited a notable disparity from that observed in normal tissues, with elevated levels detected in STAD tissues. We used the GeneMANIA database to identify functionally similar genes with significantly higher expression for some genes in the unpaired group samples. An elevated NUAK1 expression level was found to correlate with a poorer overall survival (OS), disease-specific survival (DSS), and progression-free intervals (PFI). Additionally, immune infiltration analysis indicated a significant positive correlation between NUAK1 expression and various tumor-infiltrating immune cells, while a negative correlation was observed with T helper cell 17(Th17) cells. Furthermore, enrichment analysis was conducted to identify relevant biological features and pathways.
Conclusion
The expression levels of NUAK1 are significantly increased in STAD, and this heightened expression correlates with diminished OS, DSS, and PFI among affected patients. These observations indicate that NUAK1 has the potential to function as a prognostic biomarker for STAD and may represent a viable therapeutic target for intervention in its management.
Keywords: NUAK1, STAD, Prognostic value, Immune infiltration
Introduction
It is established that STAD is one of the most frequently observed malignant neoplasms of the gastrointestinal tract, with a trend in incidence that is ranked fifth among all tumour types and the third highest among cancer-related fatalities. Tumors that are diagnosed and treated at this stage have a five yearend point survival rate of between ninety percent to ninety seven percent. In contrast, when the disease has reached the later stages or has metastasized, five-year mortality stands at less than 30% [1, 2]. There is therefore need to enhance the survival of STAD through early diagnosis of the STAD and by more identification of biomarkers and targets.
Recombinant NUAK Family SNF1 Like Kinase 1 (NUAK1) is a member of the AMP-activated protein kinases (AMPK) family, specifically categorised as an AMPK-related kinase (ARK5). It plays a crucial role in the survival of cancer cells during oxidative stress and is associated with the development of tumours and disease progression [3]. It has been demonstrated that NUAK1 facilitates gastric cancer cell proliferation and chemotherapy resistance via the activation of the STAT5/GLI1/SOX2 signalling pathway [4].
Further investigations are required to elucidate the role of NUAK1 in STAD, its impact on prognosis and its relationship with immune infiltration. The present study adopted a comprehensive approach to examine the disparities in NUAK1 expression between tumour tissues from individuals with STAD and those from healthy individuals. A correlation between this factor and the prognosis of patients was investigated by utilising RNA sequencing data from the TCGA and GTEx databases. Moreover, we investigated the correlation between NUAK1 expression and the extent of immune cell infiltration to ascertain the potential mechanisms through which NUAK1 contributes to the pathogenesis of STAD. Finally, we revealed its potential functions through GO, KEGG and GSEA.
Materials and methods
Data collection and analysis of NUAK1
Transcriptome gene expression data and clinical information from TCGA (https://portal.gdc.cancer.gov) and GTEx (https://gtexportal.org/) were downloaded from the UCSC Xena database (https://xenabrowser.net/datapages/). Differential gene expression analysis was performed on 33 types of tumors [5] (Table 1).
Table 1.
List of 33 types of tumors
| Adrenocortical carcinoma | ACC |
| Bladder urothelial carcinoma | BLCA |
| Breast invasive carcinoma | BRCA |
| Colorectal adenocarcinoma | COAD |
| Cervical squamous cell carcinoma | CESC |
| Cholangiocarcinoma | CHOL |
| Diffuse large B-cell lymphoma | DLBCL |
| Esophageal carcinoma | ESCA |
| Glioblastoma multiforme | GBM |
| Head and neck squamous cell carcinoma | HNSC |
| Kidney infiltrative chromatosis | KICH |
| Kidney infiltrative clear cell carcinoma | KIRC |
| Kidney infiltrative rectal pancreatic carcinoma | KIRP |
| Acute myeloid leukemia | LAML |
| Low-grade glioma | LGG |
| Liver hepatocellular carcinoma | LIHC |
| Lung adenocarcinoma | LUAD |
| Lung squamous cell carcinoma | LUSC |
| Mesothelioma | MESO |
| Ovarian serous cystadenocarcinoma | OV |
| Pancreatic adenocarcinoma | PAAD |
| Pheochromocytoma and paraganglioma | PCPG |
| Prostate adenocarcinoma | PRAD |
| Rectal adenocarcinoma | READ |
| Sarcoma | SARC |
| Skin cutaneous melanoma | SKCM |
| Stomach adenocarcinoma | STAD |
| Testicular germ cell tumors | TGCT |
| Thyroid carcinoma | THCA |
| Thymoma | THYM |
| Uterine corpus endometrial cancer | UCEC |
| Uterine carcinosarcoma | UCS |
| Uveal melanoma | UVM |
The differences in NUAK1 expression between tumour and normal tissues were analysed using the TCGA database, the combined TCGA + GTEx database, and both paired and unpaired samples from the TCGA database. The R packages "stats" and "car" were used for statistical analysis, while the "ggplot2" package was employed for data visualization. We applied Log2 (value + 1) transformation along with the Wilcoxon rank sum test to the expression data in TPM format.
The value of NUAK1 in the prognosis of gastric cancer
We conducted proportional risk hypothesis testing using the R "survival" package, employing Cox regression analysis. We visualized the results with a forest plot using "ggplot2" to assess the impact of NUAK1 expression on pan-cancer prognosis [6]. We performed Kaplan–Meier (KM) survival analysis to compare OS, DSS and PFI between high and low NUAK1 expression groups in STAD samples.
Correlation of NUAK1 with clinical features
We selected clinical variables, including gender, age, pathological T-stage, N-stage, M-stage, histologic grading, H. pylori infection, pathological stage, and histologic type, to examine their correlation with NUAK1 expression.
Analysis of tumor immune cell infiltration
The infiltration of immune cells in STAD was evaluated through the utilisation of single-sample gene set enrichment analysis (ssGSEA), employing the R package “GSVA” [7, 8]. Additionally, a Spearman’s correlation analysis was conducted to investigate the potential correlation between NUAK1 expression levels and immune cell infiltration. The Wilcoxon rank-sum test was employed for the purpose of assessing the discrepancies in the level of immune infiltration between the groups with high and low NUAK1 expression.
Functional enrichment analysis
Based on NUAK1 expression levels, we divided the STAD samples into high and low expression groups. We then analyzed the differences between these two groups using the “DESeq2” software package. We collected DEGs based on the criteria of absolute log fold change greater than 1.5 and adjusted p-value less than 0.05. We performed GO, KEGG, and GSEA analyses on the DEGs between the high and low NUAK1 expression groups. This analysis was conducted using the R package “clusterProfiler” [9].
Gene interaction network analysis
The interactions and functions of the NUAK1 gene were analyzed using GeneMANIA (http://genemania.org) [10].
Statistical analysis
Statistical analyses were conducted using R software (version 4.2.1). Wilcoxon rank sum test, t-test, and one-way ANOVA were used to compare differences between two or more groups. Correlation was assessed using Spearman’s correlation coefficient, and all data were visualized using the “ggplot2” software package. A P-value of less than 0.05 was considered statistically significant.
Results
Correlation of NUAK1 with pan-cancer
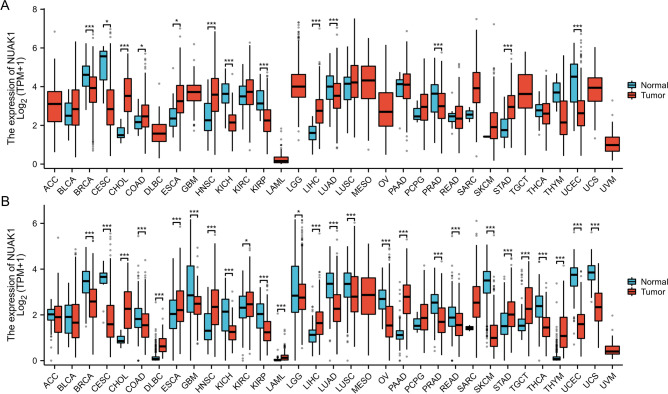
To elucidate the potential role of NUAK1 in cancer, we analyzed its expression across 33 tumor types. Gene expression data was extracted from the TCGA database. The box plots revealed a statistically significant elevation in NUAK1 expression levels in 13 tumour types, including BRCA, CESC, ESCA, CHOL, HNSC, COAD, KICH, LIHC, KIRP, PRAD, LUAD, STAD and UCEC, when compared with normal tissues (Fig. 1A). The lack of certain standard tissue data in the TCGA database has impeded the integrated analysis of certain tumours. Therefore, we combined TCGA and GTEx for a more thorough analysis. The results showed that NUAK1 expression in tumor tissues was significantly different from normal tissues in most tumors, including 27 tumor types: BRCA, CHOL, CESC, DLBC, COAD, ESCA, HNSC, KICH, GBM, KIRC, THCA, LAML, KIRP, LGG, OV, THYM, LIHC, PAAD, LUAD, PRAD, READ, SKCM, LUSC, STAD, TGCT, UCEC and UCS (Fig. 1B). The expression of CHOL, HNSC, DLBC, KIRC, LIHC, LAML, PAAD, TGCT, STAD and THYM was found to be elevated in cancerous tissues in comparison to normal tissues.
Fig. 1.
Expression levels of NUAK1 across 33 different human cancers in TCGA. A Expression levels of NUAK1 across 33 different human cancers in TCGA. B Expression levels of NUAK1 in 33 different human cancers in TCGA + GTEx. *P < 0.05; **P < 0.01; ***P < 0.001
Upregulation of NUAK1 in STAD
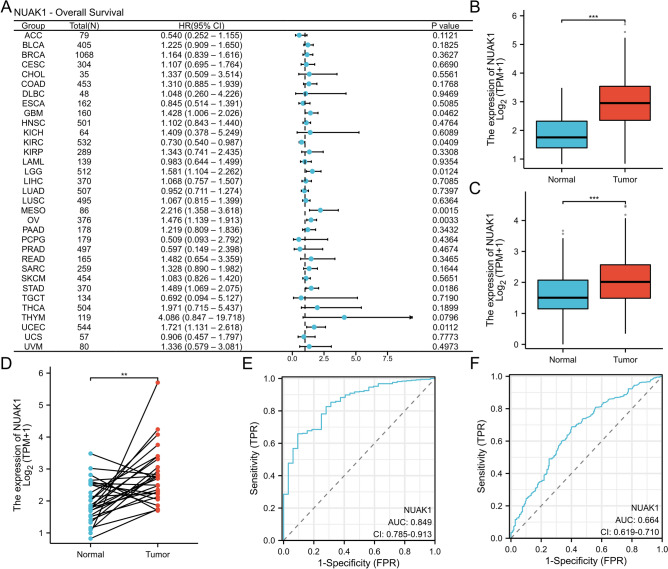
Next, we examined the role of NUAK1 in pan-cancer prognosis and found it to be a high-risk adverse prognostic factor for STAD (P < 0.05, hazard ratio (HR) > 1, 95% confidence interval (CI)) (Fig. 2A). In both the TCGA cohort and the TCGA + GTEx cohort, NUAK1 levels were observed to be elevated in STAD samples relative to normal samples (Fig. 2B, C). In the TCGA cohort, NUAK1 expression was found to be significantly elevated in STAD tissues in comparison to paired adjacent normal tissues (P < 0.01) (Fig. 2D). Furthermore, the receiver operating characteristic (ROC) curve demonstrated the predictive and diagnostic capabilities of NUAK1. In the TCGA cohort, the area under the curve (AUC) was 0.849 (95% CI = 0.785–0.913) (Fig. 2E). In the TCGA + GTEx cohort, the AUC was 0.664 (95% CI = 0.619–0.710) (Fig. 2F).
Fig. 2.
Expression of NUAK1 in STAD. A Forest plot illustrating OS associations across 33 tumor types. B NUAK1 expression levels in 375 STAD tissues compared to 32 normal tissues from the TCGA STAD dataset. C NUAK1 expression levels in 414 STAD tissues and 210 normal tissues from the combined TCGA and GTEx datasets. D Comparison of 27 paired STAD tissues and normal tissues from the TCGA and GTEx datasets. E Diagnostic ROC curves generated from the TCGA dataset. F Diagnostic ROC curves from the combined TCGA and GTEx datasets. *P < 0.05; **P < 0.01; ***P < 0.001
NUAK1 is a potential prognostic biomarker in STAD
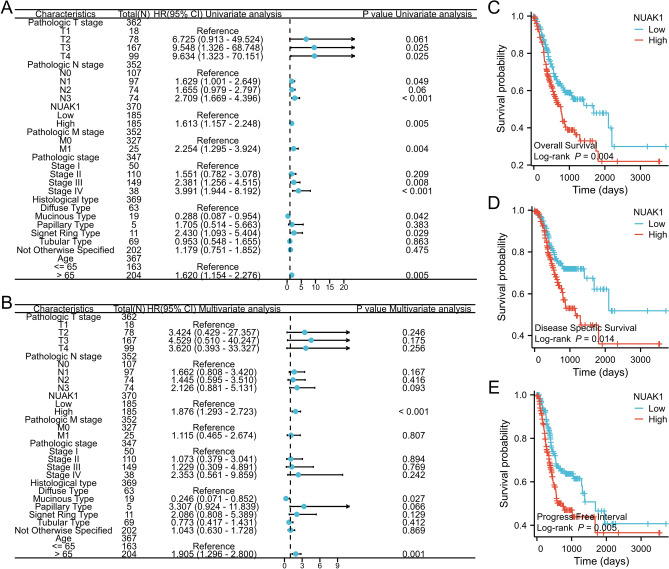
In this study, We employed univariate and multivariate Cox regression analyses to ascertain prognostic factors associated with clinicopathologic stage, T stage, N stage, M stage, histologic type, age, and NUAK1 expression level. The forest plot demonstrated that NUAK1 acts as a risk factor for OS and serves as an independent prognostic indicator in patients diagnosed with STAD (refer to Fig. 3A, B). Following this, the relationship between NUAK1 expression levels and the prognosis of STAD patients was assessed utilizing the KM method. The patients were separated into two distinct groups, based on the median expression threshold, with one group exhibiting high NUAK1 expression and the other exhibiting low NUAK1 expression. The KM survival analysis indicated that the OS, DSS, and PFI were significantly prolonged in the low NUAK1 expression cohort compared to their high-expression counterparts. These findings imply that NUAK1 is associated with an unfavorable prognosis in STAD and may play a role as an oncogene (see Fig. 3C–E).
Fig. 3.
Prognostic significance in STAD. A Univariate Cox regression model. B Multivariate Cox regression model. C-E KM survival curves for patients with high and low NUAK1 expression in OS, DSS and PFI
NUAK1 expression and clinicopathological characteristics
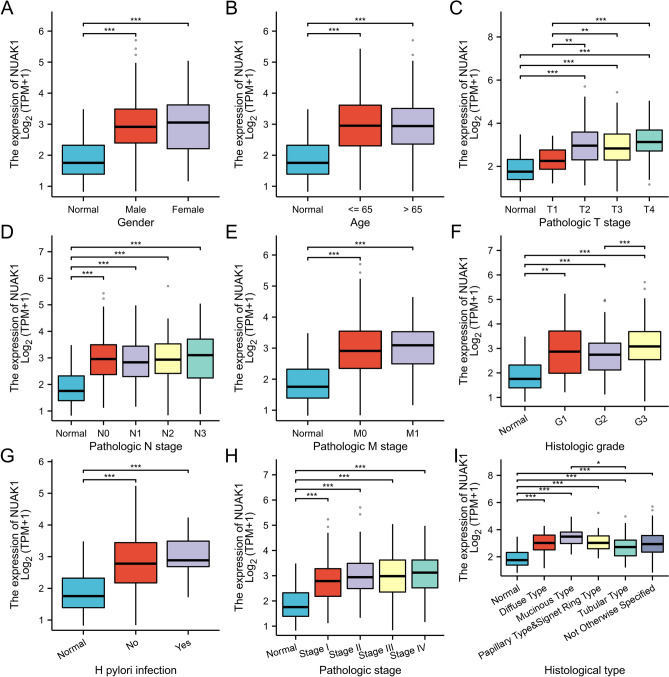
In patients with STAD, NUAK1 expression levels significantly correlated with several clinical parameters. These include gender, age, pathological T-stage, N-stage, M-stage, histological grading, H. pylori infection, pathological stage, and histological type. Significant differences were also observed among the groups in T1 vs. T2, T1 vs. T3, T1 vs. T4 staging, as well as in G2 vs. G3 staging and between mucinous and tubular adenocarcinomas (Fig. 4A–I).
Fig. 4.
The association of NUAK1 expression with various clinical features, including gender (A), age (B), Pathologic T stage (C), Pathologic N stage (D), Pathologic M stage (E), histologic grade (F), and H. pylori infection (G) Pathologic stage (H) , Histologic type (I) is presented. *P < 0.05; **P < 0.01; ***P < 0.001
Association between NUAK1 expression and tumor immune cell infiltration
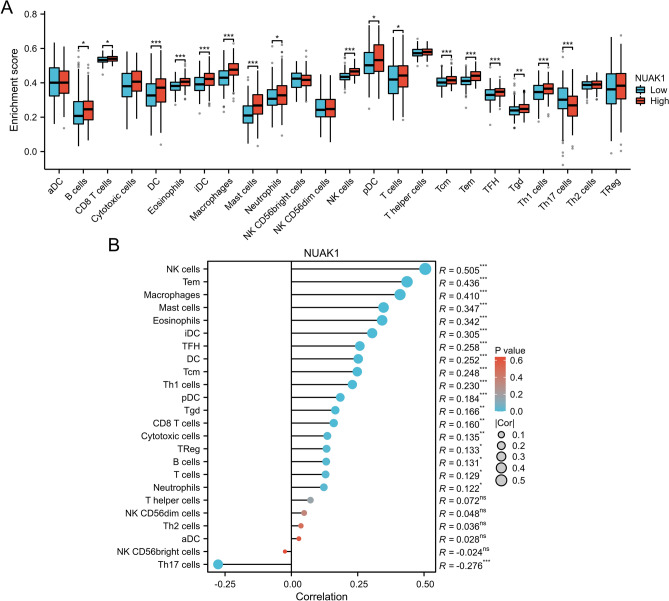
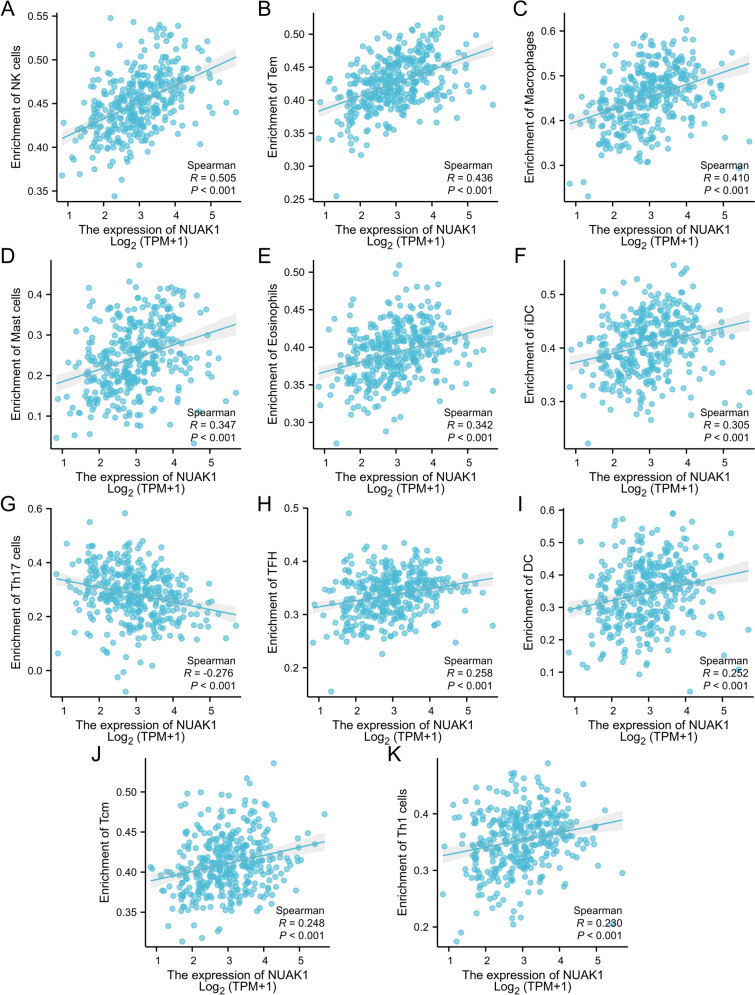
Subsequently, we assessed the extent of immune cell infiltration in STAD patients. Using the ssGSEA algorithm, we explored the distribution of 24 immune cell types in STAD tissues categorized by high and low NUAK1 expression levels. Notably, a total of 16 distinct immune cell subtypes, including B cells, CD8 T cells, and macrophages, demonstrated significantly greater infiltration levels in the high-expression group in contrast to the low-expression group, as evidenced by statistically significant differences (Fig. 5A). Additionally, we conducted a correlation analysis to clarify the relationship between NUAK1 expression and specific immune cell types (Fig. 5B). NUAK1 expression showed significant positive correlations with several immune cell types, including NK cells (r = 0.505, P < 0.001; Fig. 6A), Tem (r = 0.436, P < 0.001; Fig. 6B), and macrophages (r = 0.410, P < 0.001; Fig. 6C). Other positively correlated cell types included mast cells (r = 0.347, P < 0.001; Fig. 6D), eosinophils (r = 0.342, P < 0.001; Fig. 6E), iDC (r = 0.305, P < 0.001; Fig. 6F), TFH (r = 0.258, P < 0.001; Fig. 6H), DC (r = 0.252, P < 0.001; Fig. 6I), Tcm (r = 0.248, P < 0.001; Fig. 6J), and Th1 cells (r = 0.230, P < 0.001; Fig. 6K). In contrast, NUAK1 expression was negatively correlated with Th17 cells (r = − 0.276, P < 0.001; Fig. 6G).
Fig. 5.
NUAK1 is significantly linked to the infiltration of immune cells in STAD. A Comparison of enrichment scores for 24 immune cells between patients with high and low NUAK1 levels. B The relationship between NUAK1 expression and the infiltration levels of 24 immune cells in LIHC. Statistical significance was determined as follows: *P < 0.05, **P < 0.01, ***P < 0.001. The minimum P-value reported was 0.001, indicating a highly significant correlation
Fig. 6.
The association between NUAK1 expression levels and various immune cells, including NK cells (A), Tem cells (B), Macrophages (C), Mast cells (D), Eosinophils (E), iDC cells (F), Th17 cells (G), TFH cells (H), DC cells (I), Tcm cells (J), and Th1 cells (K). *P < 0.05; **P < 0.01; ***P < 0.001
Co-expressed genes and functional enrichment analysis
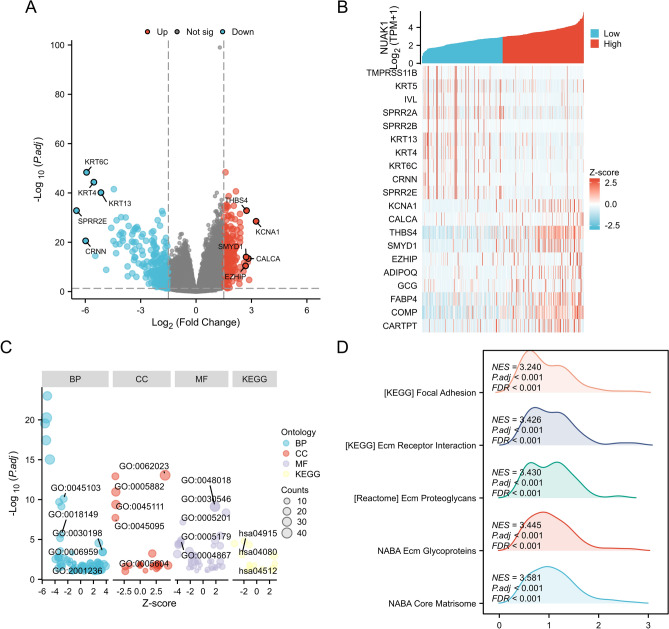
By categorising STAD patients into groups based on NUAK1 expression levels, we were able to distinguish between those with differentially expressed genes (DEGs), as evidenced by the presence of statistically significant differences in their gene expression profiles. A total of 193 up-regulated genes and 414 down-regulated genes were revealed through volcano plots (Fig. 7A). The correlation between NUAK1 and the top 20 DEGs was visualized by heatmap (Fig. 7B). Subsequently, we applied functional and pathway enrichment analyses to gain a comprehensive understanding of the DEGs (Fig. 7C), which revealed that the biological processes (BP) included intermediate filament-based processes, peptide cross-linking, extracellular matrix(ECM) organization, humoral immune response, and regulation of the extrinsic apoptotic signaling pathway. Enriched cellular components (CC) are associated with collagen-containing ECM, intermediate filaments, intermediate filament cytoskeleton, keratin filaments, and basement membrane. In terms of molecular function (MF), they are associated with receptor ligand activity.
Fig. 7.
Identification and functional annotation of DEGs. A Volcano map showing the DEGs between NUAK1 high and low expression groups. B Heatmap displaying the top 10 positively and negatively correlated genes associated with NUAK1 in the LIHC dataset. C Function enrichment analysis based on four aspects, including BP, CC, MF, and KEGG. GSEA enrichment plots showing the top five D positively associated HALLMARK pathways
The KEGG pathway enrichment analysis indicated that high NUAK1 expression was primarily associated with the Estrogen signaling pathway, Neuroactive ligand-receptor interaction, and ECM-receptor interaction. To further understand the expression of NUAK1 in STAD involving signaling pathways, we performed GSEA analysis. Among them, the top 5 signature-related annotations positively associated with high NUAK1 expression were NABA_CORE_MATRISOME, NABA_ECM_GLYCOPROTEINS, REACTOME_ECM_PROTEOGLYCANS, KEGG_ECM_RECEPTOR_INTERACTION, and KEGG_FOCAL_ADHESION (Fig. 7D).
Gene interaction network related to NUAK1
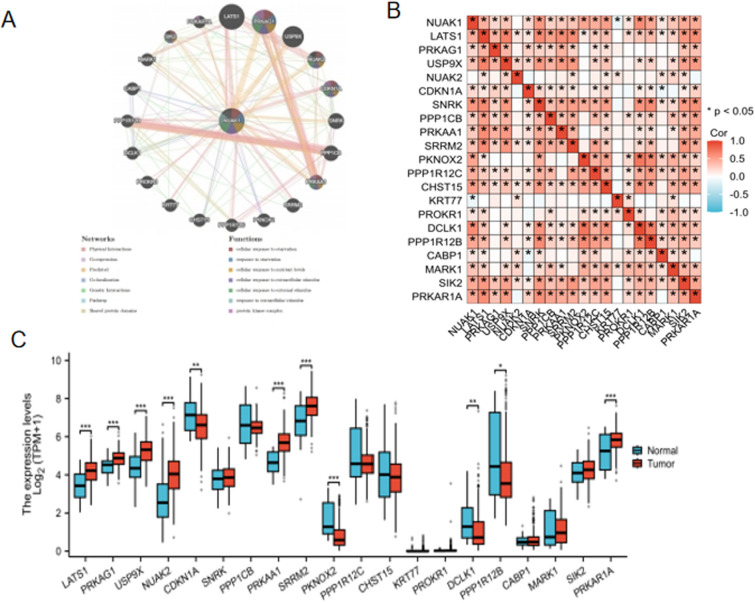
The GeneMANIA database, which facilitates the discovery of functionally similar genes and the prediction of gene function using extensive genomics and proteomics data [11], was employed to validate the functions of NUAK1-related genes, thereby confirming their involvement in the aforementioned biological functions(Fig. 8A). The analysis in unpaired group samples revealed the genes most significantly associated with NUAK1 were identified as LATS1, PRKAG1, USP9X, NUAK2, CDKN1A, SNRK, PPP1CB, PRKAA1, SRRM2, PKNOX2, PPP1R12C, CHST15, KRT77, PROKR1, DCLK1, PPP1R12B, CABP1, MARK1, SIK2, and PRKAR1A (Fig. 8B). A comparative expression analysis of these genes revealed that several related genes, including LATS1, PRKAG1, USP9X, NUAK2, PRKAA1, SRRM2, and PRKAR1A, exhibited significantly elevated expression levels compared to adjacent non-tumour tissues (P < 0.001) (Fig. 8C).
Fig. 8.
Gene interaction network related to NUAK1. A GeneMANIA Gene Interaction Network related to NUAK1. B Correlation between NUAK1 and related genes. C Expression of NUAK1-related genes. *P < 0.05; **P < 0.01; ***P < 0.001
Discussion
STAD is a common malignant tumour of the gastrointestinal tract, representing a significant cause of cancer-related mortality. In the year 2020 alone, approximately 1.09 million new cases of the disease were diagnosed worldwide, resulting in 768,000 deaths [12]. Despite advances in diagnostic and therapeutic strategies such as surgery, chemotherapy, and targeted therapies, the prognosis for STAD is still poor. Survivability of up to 5 years for ovarian cancer is only seen in less than 30% of the patients [1]. The increased mortality of the sufferers is mainly brought about by the late diagnosis of the disease, as well as the voracity of the disease, which highlights the essentiality of identifying new biomarkers for the disease and also the creation of target spots for the disease.
As a serine/threonine protein kinase, NUAK1 has only recently been placed in the spotlight, with its many variations curiously connected to several cancer types like the colon, breast, and lungs being mentioned [13–15]. Such actual outcomes confirm the fact that NUAK1 is needed in various key cell functions, such as proliferation of cells, cell death (apoptosis), cell migration [16]. Therefore, NUAK1 could be one of the potential targets for the medicine development to treat cancer. On the other hand, it is of relevance to point out that the high levels of NUAK1 expressed in ovarian cancer give women with the diagnosis low chances of survival (poor prognosis) [17]. Nevertheless, additional research regarding the relationship between NUAK1 expression and STAD investigated is required. The foresight of this project is to justify the liabilities of the potential routes which are regulated with NUAK1 for the tumorigenesis. We will verify the overexpression of NUAK1 in the tumor adjacent and normal tissue in patients with gastric cancer and reveal the correlation between NUAK1 level and some clinical characteristics, analyze the correlation between NUAK1 level with immune cell infiltration, moreover, some bioinformatics analysis (GO term and KEGG pathway). Hence, it is possible to conclude that overexpression of it is involved in cancer development to a significant extent. Moreover, we note a synergistic relationship between that overexpression and worse OS, DSS, and PFI which implies that increased NUAK1 expression is related to poor prognosis. Additional evidence suggested that the levels of NUAK1 counteract with respect to some clinical manifestations. To the same extent, it is possible to agree with the information on the presence of a strong connection between NUAK1 overexpression and the immune context of the STAD. The analysis of immune infiltration indicated that the types of immune cells that are positively correlated with NUAK1 include macrophage. Since we consider macrophages to be the versatile immune cells the host uses to survive with infection of different pathogenic microorganisms, preserving regular internal conditions and taking part in the repair of tissues. Macrophages are highly heterogenic and can change their phenotypes; they are present in several subtypes with different abilities and functions that are influenced by the local immunological niche [18]. The Tumour associated macrophages (TAMs) is the macrophage population in the tumour tissues, which is a prominent component of the tumour microenvironment [19]. New statistical measures like quantities and functional aspects of TAMs have a massive impact on tumor formation and progression. TAM drastically regulate cancer cell destiny during assorted stages of cancer advancement. At first, TAMs can also exist in an anti-tumor status by synthesizing inflammation mediators and directly eliminating cancer cells at the tumorogenesis stage [20]. For instance, M1 can in a position to produce nitric oxide (NO), reactive oxygen species (ROS), along with pro-inflammatory cytokines and eliminate tumor cells in such a manner. From this, tumour progression is made possible while at the same time, M2-type TAMs secrete immunosuppressive factors, growth factors and cause immune tolerance in the surrounding environment in order to promote survival and growth of the tumour suppressing the presence of lymphocytes. It is pointed out that the ability of T cells to grow and to be active can be controlled by M2 type tumor-associated macrophages. Besides, they have also been realized to promote differentiation of the immune response towards Type 2 (Th2) hence comprising the immune context that is permissive for the cancer cells growth. [21]. Moreover, based on the secretion of angiogenic (for example, VEGF) and lymphangiogenic factors (such as VEGF-C), TAMs engage in the formation of tumour blood vessels and lymphatic vessels to provide nutrients for tumour growth and metastatic channels [22, 23]. The aforementioned factors contribute to an understanding of the unfavourable prognosis observed in patients with elevated NUAK1 expression. Our findings indicate that NUAK1 could be a promising therapeutic target for STAD. Targeting NUAK1 can not only inhibit tumor growth and metastasis but also regulate the immune microenvironment of tumors and enhance anti-tumor immunity. This dual approach could improve the efficacy of existing therapies and provide a new strategy to combat STAD.
Additionally, the GO analysis indicated that several BPs are linked to intermediate filament-based processes, peptide cross-linking, ECM organization, humoral immune response, and the regulation of the extrinsic apoptotic signaling pathway. The enriched CC are associated with the collagen-containing ECM, intermediate filaments, intermediate filament cytoskeleton, keratin filaments, and basement membrane. Regarding MF, the relevant activities include receptor-ligand activity, signaling receptor activator activity, ECM structural constituents, hormone activity, and serine-type endopeptidase inhibitor activity. Intermediate filament-based processes involve intermediate fibers, which are crucial components of the cytoskeleton, influencing cell morphology, movement, and stability [24]. The reorganization of the ECM is relevant to tumor invasion and metastatic processes in the body. These are degradation and remodeling of ECM, which are the ways that the tumor cell uses to move and invade other tissues [25, 26]. Deregulation and recombination with the intermediate fiber cytoskeleton may endanger the shape and motility and hence the invasiveness and metastasis of many tumor cells [27]. Thus, the basement membrane has functions that are very essential for the structural support and integrity of epithelial cells as well as the mesenchyma. Basement membrane degradation is another critical event in cancer promotion, as well as cancer invasion and metastasis [28]. The binding of ECM and receptor is another significant aspect regarding the linking up of tumor cells with ECM. It is, therefore, evident from the current interaction that the process of adhesion, migration and invasion of tumor cells is likely to be promoted. [29].
In addition, GSEA analysis showed that high expression of NUAK1 was positively correlated with multiple pathways. They include NABA_CORE_MATRISOME, NABA_ECM_GLYCOPROTEINS, REACTOME_ECM_PROTEOGLYCANS, KEGG_ECM_RECEPTOR_INTERACTION, and KEGG_FOCAL_ADHESIO N (Fig. 7D). The GO/KEGG functional enrichment test was performed and according to the test result we obtained the pathways associated with NUAK1. These selected pathways were the following ones: A reaction is known as ECM-receptor interaction. The molecular interaction processes resident in the physical contact of ECM and cell surface receptors or the subsequent signaling following this contact of the receptors has been explained [30]. Besides the above macromolecules, the network of collagen, fibritin, laminin etc. is called the ECM, which is released by the cell into a fully open extracellular space. These ECM elements pass messages/signals to the cells by binding with cell surface receptors, for instance, integrin and proteoglycans; this directs cell growth, maturation, mobility, even death, and other such functions [31]. Currently, there are many papers concerning the connection of ECM, receptor interaction pathway and tumor. First, some of the components forming the ECM; for instance, growth factors, have been revealed of activating growth of cells that form tumors. This is accomplished by initiating cell signals, by interaction of the above components with cell surface receptors [32]. Secondly, there also exists the rearrangement of extracellular matrix which is involved in the process of invasion and migration of tumor cells. Tumor cells can also secrete enzymes such as matrix metalloproteinases (MMP) for the degradation of ECM and on the other hand; specific parts of the ECM can be utilized by the tumor cells as tracks to follow. Besides, this communication might affect positively or negatively on the adhesion and deadhesion phases of the tumor cells and hence affect their migration capability [32]. Third, soluble angiogenic factors in the ECMs illustrating vascular endothelial growth factor will adhere to the cell surface receptors and prompt the tumor angiogenesis. The aforementioned process can therefore be regarded as one of the conditions for growth as well as metastases of tumours [31, 32]. Fourth, the ECM-receptor interaction pathway might also control the invasion and function of immune cell in the tumor immunity microenvironment [33]. For example, some of the nowadays identified components of ECM are able to prevent activation of the immune cells and thereby immune evasion from the tumor. Moreover, the procedure that controls the interaction of extracellular matrix and receptor is significant in tumour therapy. The development of anti-tumor drugs targeting key molecules such as integrins and MMPs may inhibit the proliferation, invasion and migration of tumor cells [34]. The regulation of the ECM-receptor interaction pathway may improve the tumor immune microenvironment, thereby increasing the invasion and function of immune cells and improving the efficacy of immunotherapy. It can be reasonably concluded that the ECM-receptor interaction pathway plays a crucial role in the process of tumorigenesis, development, invasion and metastasis. A comprehensive study of the molecular mechanisms and regulatory networks of this pathway will contribute to the development of novel cancer diagnosis and treatment strategies. The findings suggest that targeting NUAK1 may impede tumor growth and metastasis, while also altering the tumor’s immune microenvironment and enhancing anti-tumor immunity. This dual approach has the potential to enhance the efficacy of existing treatments and provide a new strategy for fighting STAD. Future studies would ideally develop specific NUAK1 inhibitors and evaluate their therapeutic potential in combination with immunotherapy.
However, it should be noted that an important limitation of this study is the lack of laboratory validation. While our bioinformatics analysis yielded valuable insights, experimental validation is essential to confirm the biological significance of NUAK1 in STAD. In addition, although the sample size is large, it may not be enough to fully reflect the diversity of the disease. Another limiting factor is the lack of clinical validation. By providing a correlation between NUAK1 expression and clinical outcomes, further research on this topic may help improve the reliability of our findings.
In addition, utilizing different data sets may lead to the introduction of batch effects, which may affect the robustness of the study results. Future studies must address these limitations through experimental validation, increasing sample sizes, and clinical validation. This will ensure the reliability and applicability of the findings.
Conclusion
Thus, this study intended to examine the levels and prognosis of NUAK1 in STAD and assess the relationships of NUAK1 with clinicopathological features and immunological infiltrating cells. These findings might be useful in elaborating the role of NUAK1 as a biomarker and new target for the diagnosis and therapy of STAD.
Acknowledgements
We gratefully acknowledge the financial support provided by Affiliated Hospital of Jiangsu University’s "Beigu Yingcai" Cultivation Programme.
Abbreviations
- NUAK1
Recombinant NUAK Family SNF1 Like Kinase 1
- TCGA
The Cancer Genome Atlas
- GTEx
Genotype tissue expression
- OS
Overall survival
- DSS
Disease-specific survival
- PFI
Progression-free intervals
- HR
Hazard ratio
- CI
Confidence interval
- ROC
Receiver operating characteristic
- AUC
Area under the curve
- DEGs
Differentially expressed genes
- Tem
Effect memory T cells
- DC
Dendriticcells
- iDC
Immature dendritic cells
- Th1
T helper cell 1
- Th17
T helper cell 17
- NK
Natural killer
- Tregs
Regula tory T cells
- Tgd
T gamma delta
- Tcm
Central memory T cells
- GO
Gene ontology
- KEGG
Kyoto encyclopedia of genes and genomes
- GSEA
Gene set enrichment analyses
- BP
Biological process
- CC
Cellular components
- MF
Molecular function
- TAMs
Tumor-associated macrophages
- TME
Tumor microenvironment
- ROS
Reactive oxygen species
- NO
Nitric oxide
- ECM
Extracellular matrix
- MMPs
Matrix metalloproteinases
Author contributions
ZhangWei participated in the design of the study. NiXin conceived the study. LangYaKun and PanFan participated in its design and coordination and helped to draft the manuscript. All authors read and approved the final manuscript.
Funding
This work was supported by Affiliated Hospital of Jiangsu University’s “Beigu Yingcai” Cultivation Programme.
Data availability
The datasets analyzed for this study can be found in the TCGA database (https://portal.gdc.cancer.gov/) and GTEx(https://gtexportal.org/) .
Declarations
Ethics approval and consent to participate
Not applicable.
Consent for publication
Not applicable.
Competing interests
The authors declare no competing interests.
Footnotes
Publisher's Note
Springer Nature remains neutral with regard to jurisdictional claims in published maps and institutional affiliations.
References
- 1.Ren N, Liang B, Li Y. Identification of prognosis-related genes in the tumor microenvironment of stomach adenocarcinoma by TCGA and GEO datasets. Biosci Rep. 2020;40(10):BSR20200980. 10.1042/BSR20200980. [DOI] [PMC free article] [PubMed] [Google Scholar]
- 2.Zeng Q, Zhao Y, Yang Y, Chen XX, Wang G, Zhang P, Cui Y, Su S, Li K. Expression of Cystatin C in human stomach neoplasms. Mol Med Rep. 2010;3(4):607–11. 10.3892/mmr_00000304. [DOI] [PubMed] [Google Scholar]
- 3.Skalka GL, Whyte D, Lubawska D, Murphy DJ. NUAK: never underestimate a kinase. Essays Biochem. 2024. 10.1042/EBC20240005. [DOI] [PMC free article] [PubMed] [Google Scholar]
- 4.Cao L, Lin G, Fan D, Weng K, Chen Y, Wang J, Li P, Zheng C, Huang C, Xie J. NUAK1 activates STAT5/GLI1/SOX2 signaling to enhance cancer cell expansion and drives chemoresistance in gastric cancer. Cell Rep. 2024;43(7):114446. 10.1016/j.celrep.2024.114446. [DOI] [PubMed] [Google Scholar]
- 5.Vivian J, Rao AA, Nothaft FA, Ketchum C, Armstrong J, Novak A, Pfeil J, Narkizian J, Deran AD, Musselman-Brown A, Schmidt H, Amstutz P, Craft B, Goldman M, Rosenbloom K, Cline M, O’Connor B, Hanna M, Birger C, Kent WJ, Patterson DA, Joseph AD, Zhu J, Zaranek S, Getz G, Haussler D, Paten B. Toil enables reproducible, open source, big biomedical data analyses. Nat Biotechnol. 2017;35:314–6. [DOI] [PMC free article] [PubMed] [Google Scholar]
- 6.Liu J, et al. An integrated TCGA pan-cancer clinical data resource to drive high-quality survival outcome analytics. Cell. 2018;173(2):400–16. [DOI] [PMC free article] [PubMed] [Google Scholar]
- 7.Hänzelmann S, Castelo R, Guinney J. GSVA: gene set variation analysis for microarray and RNA-seq data. BMC Bioinformatics. 2013;14:7. [DOI] [PMC free article] [PubMed] [Google Scholar]
- 8.Bindea G, Mlecnik B, Tosolini M, Kirilovsky A, Waldner M, Obenauf AC, Angell H, Fredriksen T, Lafontaine L, Berger A, Bruneval P, Fridman WH, Becker C, Pagès F, Speicher MR, Trajanoski Z, Galon J. Spatiotemporal dynamics of intratumoral immune cells reveal the immune landscape in human cancer. Immunity. 2013;39:782–95. [DOI] [PubMed] [Google Scholar]
- 9.Yu G, Wang LG, Han Y, He QY. clusterProfiler: an R package for comparing biological themes among gene clusters. OMICS. 2012;16:284–7. [DOI] [PMC free article] [PubMed] [Google Scholar]
- 10.Theodorou M, Speletas M, Mamara A, Papachristopoulou G, Lazou V, Scorilas A, Katsantoni E. Identification of a STAT5 target gene, Dpf3, provides novel insights in chronic lymphocytic leukemia. PLoS ONE. 2013;8(10): e76155. 10.1371/journal.pone.0076155. [DOI] [PMC free article] [PubMed] [Google Scholar]
- 11.Warde-Farley D, Donaldson SL, Comes O, Zuberi K, Badrawi R, Chao P, Franz M, Grouios C, Kazi F, Lopes CT, Maitland A, Mostafavi S, Montojo J, Shao Q, Wright G, Bader GD, Morris Q. The GeneMANIA prediction server: biological network integration for gene prioritization and predicting gene function. Nucleic Acids Res. 2010;38:W214–20. 10.1093/nar/gkq537. [DOI] [PMC free article] [PubMed] [Google Scholar]
- 12.Lee SS, Jung WT, Kim CY, Ha CY, Min HJ, Kim HJ, Kim TH. The synchronous prevalence of colorectal neoplasms in patients with stomach cancer. J Korean Soc Coloproctol. 2011;27(5):246–51. 10.3393/jksc.2011.27.5.246. [DOI] [PMC free article] [PubMed] [Google Scholar]
- 13.Port J, Muthalagu N, Raja M, Ceteci F, Monteverde T, Kruspig B, Hedley A, Kalna G, Lilla S, Neilson L, Brucoli M, Gyuraszova K, Tait-Mulder J, Mezna M, Svambaryte S, Bryson A, Sumpton D, McVie A, Nixon C, Drysdale M, Esumi H, Murray GI, Sansom OJ, Zanivan SR, Murphy DJ. Colorectal tumors require NUAK1 for protection from oxidative stress. Cancer Discov. 2018;8(5):632–47. 10.1158/2159-8290.CD-17-0533. [DOI] [PMC free article] [PubMed] [Google Scholar]
- 14.Chang XZ, Yu J, Liu HY, Dong RH, Cao XC. ARK5 is associated with the invasive and metastatic potential of human breast cancer cells. J Cancer Res Clin Oncol. 2012;138(2):247–54. 10.1007/s00432-011-1102-1. [DOI] [PMC free article] [PubMed] [Google Scholar]
- 15.Shi L, Zhang B, Sun X, Lu S, Liu Z, Liu Y, Li H, Wang L, Wang X, Zhao C. MiR-204 inhibits human NSCLC metastasis through suppression of NUAK1. Br J Cancer. 2014;111(12):2316–27. 10.1038/bjc.2014.580. [DOI] [PMC free article] [PubMed] [Google Scholar]
- 16.Huang X, Lv W, Zhang JH, Lu DL. miR-96 functions as a tumor suppressor gene by targeting NUAK1 in pancreatic cancer. Int J Mol Med. 2014;34(6):1599–605. 10.3892/ijmm.2014.1940. [DOI] [PubMed] [Google Scholar]
- 17.Phippen NT, Bateman NW, Wang G, Conrads KA, Ao W, Teng PN, Litzi TA, Oliver J, Maxwell GL, Hamilton CA, Darcy KM, Conrads TP. NUAK1 (ARK5) is associated with poor prognosis in ovarian cancer. Front Oncol. 2016;27(6):213. 10.3389/fonc.2016.00213. [DOI] [PMC free article] [PubMed] [Google Scholar]
- 18.Cassetta L, Pollard JW. A timeline of tumour-associated macrophage biology. Nat Rev Cancer. 2023;23(4):238–57. 10.1038/s41568-022-00547-1. [DOI] [PubMed] [Google Scholar]
- 19.Vitale I, Manic G, Coussens LM, Kroemer G, Galluzzi L. Macrophages and metabolism in the tumor microenvironment. Cell Metab. 2019;30(1):36–50. 10.1016/j.cmet.2019.06.001. [DOI] [PubMed] [Google Scholar]
- 20.Pan Y, Yu Y, Wang X, Zhang T. Tumor-associated macrophages in tumor immunity. Front Immunol. 2020;3(11): 583084. 10.3389/fimmu.2020.583084. [DOI] [PMC free article] [PubMed] [Google Scholar]
- 21.Morad G, Helmink BA, Sharma P, Wargo JA. Hallmarks of response, resistance, and toxicity to immune checkpoint blockade. Cell. 2021;184(21):5309–37. 10.1016/j.cell.2021.09.020. [DOI] [PMC free article] [PubMed] [Google Scholar]
- 22.Fu LQ, Du WL, Cai MH, Yao JY, Zhao YY, Mou XZ. The roles of tumor-associated macrophages in tumor angiogenesis and metastasis. Cell Immunol. 2020;353: 104119. 10.1016/j.cellimm.2020.104119. [DOI] [PubMed] [Google Scholar]
- 23.Ran S, Montgomery KE. Macrophage-mediated lymphangiogenesis: the emerging role of macrophages as lymphatic endothelial progenitors. Cancers (Basel). 2012;4(3):618–57. 10.3390/cancers4030618. [DOI] [PMC free article] [PubMed] [Google Scholar]
- 24.Holle AW, Kalafat M, Ramos AS, Seufferlein T, Kemkemer R, Spatz JP. Intermediate filament reorganization dynamically influences cancer cell alignment and migration. Sci Rep. 2017;24(7):45152. 10.1038/srep45152. [DOI] [PMC free article] [PubMed] [Google Scholar]
- 25.Paolillo M, Schinelli S. Extracellular matrix alterations in metastatic processes. Int J Mol Sci. 2019;20(19):4947. 10.3390/ijms20194947. [DOI] [PMC free article] [PubMed] [Google Scholar]
- 26.He X, Lee B, Jiang Y. Cell-ECM interactions in tumor invasion. Adv Exp Med Biol. 2016;936:73–91. 10.1007/978-3-319-42023-3_4. [DOI] [PubMed] [Google Scholar]
- 27.Ciszewski WM, Wawro ME, Sacewicz-Hofman I, Sobierajska K. Cytoskeleton reorganization in EndMT-the role in cancer and fibrotic diseases. Int J Mol Sci. 2021;22(21):11607. 10.3390/ijms222111607. [DOI] [PMC free article] [PubMed] [Google Scholar]
- 28.Liu X, Qiao Y, Chen J, Ge G. Basement membrane promotes tumor development by attenuating T cell activation. J Mol Cell Biol. 2022;14(2):mjac006. 10.1093/jmcb/mjac006. [DOI] [PMC free article] [PubMed] [Google Scholar]
- 29.Zhang QJ, Li DZ, Lin BY, Geng L, Yang Z, Zheng SS. SNHG16 promotes hepatocellular carcinoma development via activating ECM receptor interaction pathway. Hepatobiliary Pancreat Dis Int. 2022;21(1):41–9. 10.1016/j.hbpd.2021.09.006. [DOI] [PubMed] [Google Scholar]
- 30.Bao Y, Wang L, Shi L, Yun F, Liu X, Chen Y, Chen C, Ren Y, Jia Y. Transcriptome profiling revealed multiple genes and ECM-receptor interaction pathways that may be associated with breast cancer. Cell Mol Biol Lett. 2019;6(24):38. 10.1186/s11658-019-0162-0. [DOI] [PMC free article] [PubMed] [Google Scholar]
- 31.Karamanos NK, Theocharis AD, Piperigkou Z, Manou D, Passi A, Skandalis SS, Vynios DH, Orian-Rousseau V, Ricard-Blum S, Schmelzer CEH, Duca L, Durbeej M, Afratis NA, Troeberg L, Franchi M, Masola V, Onisto M. A guide to the composition and functions of the extracellular matrix. FEBS J. 2021;288(24):6850–912. 10.1111/febs.15776. [DOI] [PubMed] [Google Scholar]
- 32.Jiang Y, Zhang H, Wang J, Liu Y, Luo T, Hua H. Targeting extracellular matrix stiffness and mechanotransducers to improve cancer therapy. J Hematol Oncol. 2022;15(1):34. 10.1186/s13045-022-01252-0. [DOI] [PMC free article] [PubMed] [Google Scholar]
- 33.Goenka A, Khan F, Verma B, Sinha P, Dmello CC, Jogalekar MP, Gangadaran P, Ahn BC. Tumor microenvironment signaling and therapeutics in cancer progression. Cancer Commun (Lond). 2023;43(5):525–61. 10.1002/cac2.12416. [DOI] [PMC free article] [PubMed] [Google Scholar]
- 34.Yuan Z, Li Y, Zhang S, Wang X, Dou H, Yu X, Zhang Z, Yang S, Xiao M. Extracellular matrix remodeling in tumor progression and immune escape: from mechanisms to treatments. Mol Cancer. 2023;22(1):48. 10.1186/s12943-023-01744-8. [DOI] [PMC free article] [PubMed] [Google Scholar]
Associated Data
This section collects any data citations, data availability statements, or supplementary materials included in this article.
Data Availability Statement
The datasets analyzed for this study can be found in the TCGA database (https://portal.gdc.cancer.gov/) and GTEx(https://gtexportal.org/) .


