Abstract
The Controls Over Mesopelagic Interior Carbon Storage (COMICS) cruise DY086 took place aboard the RRS Discovery in the South Atlantic during November and December, 2017. Physical, chemical, biogeochemical and biological data were collected during three visits to ocean observatory station P3, off the coast of South Georgia, during an austral spring bloom. A diverse range of equipment including CTD-rosette, Acoustic Doppler Current Profiler (ADCP), net deployments, marine snow catchers (MSCs), Stand Alone Pump System (SAPS) and PELAGRA Sediment Traps were used to produce a comprehensive, high-quality dataset. The data can provide excellent insight into regional biological carbon pump (BCP) processes; it is recommended for use by observational scientists and modellers to enhance understanding of ecosystem interactions relating to mesopelagic carbon storage.
Subject terms: Carbon cycle, Marine chemistry, Element cycles
Background & Summary
The ‘biological carbon pump’ (BCP) describes biogeochemical processes that contribute to organic carbon sequestration in the ocean. Organic matter originates from euphotic zone primary production and is transported to depth where it is remineralised. The BCP is a major control on Earth’s climate and models suggest it moderates atmospheric carbon dioxide levels by ~200 ppm1 relative to pre-industrial levels. Several processes that contribute to the vertical transfer of organic matter have been identified in the literature, including: the gravitational pump, the mesopelagic migrant pump, the seasonal lipid pump, the mixed-layer pump, the large-scale physical pump and the eddy-subduction pump2. Quantifying BCP processes simultaneously is difficult because a diverse range of scientific equipment is required and because of substantial temporal and spatial variability. However, synchronous measurements are essential if proportional contributions from individual BCP facets are to be accurately distinguished.
The Controls Over Mesopelagic Interior Carbon Storage (COMICS) project aimed to gain a greater understanding of transfer efficiency of organic carbon through the mesopelagic ocean3. Data collection was planned for site P3 (52.40 °S, 40.06 °W) in the South Atlantic, Northwest of South Georgia (Fig. 1). P3 is a long-term study site operated by the British Antarctic Survey (BAS) since 20064. P3 is situated in an area that experiences elevated primary production due to island-derived iron fertilisation. Gravitational carbon export and export efficiency are higher relative to another BAS study site (P2) situated 300 km to the south4. Further, low mesoscale variability means that the influence of the eddy-subduction pump is diminished; upwelling means that the large-scale physical pump is weak in the region5. Therefore, P3 permits a focus on the gravitational, mesopelagic migrant and mixed-layer pumps.
Fig. 1.
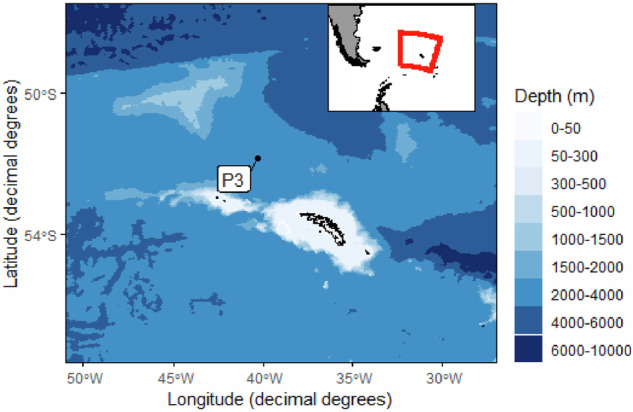
A map of the collection region: Long-term observation station ‘P3’ (52.4 °S, 40.1°W) in the vicinity of South Georgia.
Few examples exist in the literature of simultaneous measurements of the gravitational, mesopelagic migrant and mixed-layer pumps. Datasets containing these parameters can be integrated by models and used to enhance our understanding of how biological interactions affect carbon storage. In particular, the ecosystem services provided by mesopelagic fishes are of great interest due to the growing commercial viability of their exploitation6. Observational and model studies suggest the impact of mesopelagic fishes on carbon storage is significant7,8. Therefore, it is vital that the contribution of mesopelagic fishes to carbon storage is elucidated before stocks are affected.
To address the lack of simultaneous vertical organic matter flux measurements, we present data collected from P3 during the COMICS cruise in November and December, 2017. Dissolved organic carbon (DOC) and particulate organic carbon (POC) concentration and vertical flux data accompanied by acoustic- and net-derived active flux measurements allow simultaneous quantification of the relevant pumps. Most data presented here are held by British Oceanographic Data Centre (BODC); they have not been curated and can be downloaded as individual parameters. Data essential to investigating the BCP that are described elsewhere in the literature are outlined in the Methods section; the majority remained unavailable prior to this work. The PANGAEA dataset brings all the data together in five files to provide an opportunity to investigate BCP processes and their related ecosystem functions. The data are available in one convenient location for users and follow the FAIR principles9.
Methods
Data collection was carried out in November and December, 2017 as part of the COMICS project3. Site P3 was visited three times during the cruise with each visit approximately 7–8 days in duration: P3A (15–22nd November), P3B (29th November – 5th December), and P3C (9–15th December). Some data along with their collection and analysis methodologies have been described previously in the literature and are referenced herein. Details of sensors and equipment used for data collection are included with the data. All data were imported into R (version 4.3.1; see Code Availability for further information).
‘Ship-based CTD profile data’ (Table 1) contains data from the two CTD-rosettes that were used during the campaign: one made of stainless steel and the other made of titanium suitable for trace metal sampling (CTD Events 4, 7, 15, 19, 24, 29). CTD Event numbers 1, 11, 12, 13, 14 and 25 were removed as these deployments were not made at site P3. Sensors attached to each of the CTD-rosettes included: Sea-Bird SBE sensors (two 3Plus temperature; 4 C conductivity; 43 dissolved oxygen); Paroscientific Digiquartz with TC Depth sensor; WETLabs ECO-BB OBS Scattering Meter; Biospherical LICOR Photosynthetically Active Radiation (PAR) sensor; WET Labs C-Star Transmissometer; Chelsea Aquatracka MKIII fluorometer. Temperature, salinity, dissolved oxygen sensor and chlorophyll-a data were calibrated against in situ bottle measurements. Measurements from bottle samples also include nitrate (n = 224), phosphate (n = 223) and silicate (n = 224) which were determined by colorimetric analysis10; the method for POC bottle samples (n = 77) has been previously described in the literature along with other discrete POC samples (presented in ‘Discrete POC concentration and flux data’; Table 3)11. Other parameters in ‘Ship-based CTD profile data’ that have previously been described in the literature include: net primary productivity (NPP)12; turbulence, dissolved organic carbon (DOC, n = 5) and DOC flux (n = 1)13; ambient leucine assimilation (n = 31) and bacterial cell count14 (n = 34); chlorophyll-a10. ‘Ship-based meteorological data’ (Table 2) contains the ship’s weather presented in every minute for each P3 visit; anemometer data was not included because of inconsistencies identified by BODC.
Table 1.
Parameters included in ship-based CTD profile data file.
| Parameter | Column header | Unit | No. profiles |
|---|---|---|---|
| Event | Event | N/A | — |
| DateTime | Date/Time | YYYY-MM-DD HH:mm:ss | — |
| Latitude | Latitude | degrees North | — |
| Longitude | Longitude | degrees East | — |
| Site | Site | N/A | — |
| Depth | Depth water [m] (Barometer, Paroscientific, Di…) | metres | — |
| Temperature | Temp [°C] (Temperature sensor, SEA-BIRD…) | degrees C | 27 |
| Salinity | Sal (PSU, Conductivity sensor, SEA…) | PSU | 27 |
| SigmaTheta | Sigma-theta [kg/m**3] (Calculated according to UNESC…) | kg m−3 | 27 |
| Dissolved oxygen | O2 [µmol/l] (Dissolved Oxygen Sensor, Sea-…) | μmol L−1 | 27 |
| Dissolved oxygen saturation | O2 sat [%] (Calculated according to UNESC…) | % | 27 |
| Photosynthetically active radiation | PAR [µE/m**2/s] (PAR sensor, Biospherical, LI-…) | Photons m−2 s−1 | 19 |
| Turbidity | beta700 [m/sr] (Scattering meter, WET Labs, E…) | m sr−1 | 20 |
| Attenuation | Attenuation [1/m] (Transmissometer, WET Labs, C-…) | m−1 | 20 |
| Nitrate | [NO3]- [µmol/l] (Colorimetric analysis) | μmol L−1 | 15 |
| Phosphate | [PO4]3- [µmol/l] (Colorimetric analysis) | μmol L−1 | 15 |
| Silicate | Si(OH)4 [µmol/l] (Colorimetric analysis) | μmol L−1 | 15 |
| Particulate organic carbon | POC [µmol/l] (Organic Elemental Analyzer, T…) | mg C m−3 | 13 |
| Dissipation 1 | Diss rate [W/kg] (shear 150–300 m and strain 20…) | W kg−1 | 14 |
| Diffusivity 1 | K rho [m**2/s] (shear 150–300 m and strain 20…) | m−2 s−1 | 14 |
| Dissipation 2 | Diss rate [W/kg] (shear 70–200 m and strain 30-…) | W kg−1 | 14 |
| Diffusivity 2 | K rho [m**2/s] (shear 70–200 m and strain 30-…) | m−2 s−1 | 14 |
| Chlorophyll-a | Chl a [mg/m**3] (Fluorometer, Chelsea Instrume…) | mg m−3 | 27 |
| Net primary productivity | NPP C [mmol/m**3/day] (Liquid scintillation counter,…) | mmol C m−3 d−1 | 8 |
| Dissolved organic carbon | DOC [µmol/l] (High Temperature Catalytic Ox…) | μmol L−1 | 1 |
| DOC flux | DOC flux [mg/m**2/day] (Calculated) | mg C m−2 d−1 | 1 |
| Ambient leucine assimilation | Leu upt rate [pmol/l/h] (Radioassays, liquid scintilla…) | pmol L−1 h−1 | 6 |
| Bacterial cell count | Bact [#/ml] (Flow cytometer, Becton Dickin…) | cells mL−1 | 6 |
Table 3.
Parameters included in Discrete POC concentration and flux data file.
| Parameter | Column header | Unit |
|---|---|---|
| Event | Event | NA |
| DateTime | Date/Time | YYYY-MM-DD HH:mm:ss |
| Latitude | Latitude | degrees North |
| Longitude | Longitude | degrees East |
| Site | Site | P3A, P3B, P3C |
| Depth | Depth water [m] | metres |
| Particulate organic carbon concentration | POC [mg/m**3] | mg C m−3 |
| Fast MSC particulate organic carbon flux | POC flux [mg/m**2/day] (fast, Marine snow catcher) | mg C m−2 d−1 |
| Slow MSC particulate organic carbon flux | POC flux [mg/m**2/day] (slow, Marine snow catcher) | mg C m−2 d−1 |
| Total MSC particulate organic carbon flux | POC flux [mg/m**2/day] (total, Marine snow catcher) | mg C m−2 d−1 |
Table 2.
Parameters included in ship-based meteorlogical data file.
| Parameter | Column header | Units |
|---|---|---|
| DateTime | Date/Time | YYYY-MM-DD HH:mm:ss |
| Latitude | Latitude | degrees North |
| Longitude | Longitude | degrees East |
| Altitude | Altitude [m] | metres |
| Air pressure | PPPP [hPa] (Barometer, Vaisala, PTB 210) | mBar |
| Air temperature | TTT [°C] (Temperature and humidity sens…) | degrees celsius |
| Air humidity | RH [%] (Temperature and humidity sens…) | % |
| Port solar radiation | PISR [W/m**2] (port, Pyranometer, Kipp & Zon…) | W m−2 |
| Starboard solar radiation | PISR [W/m**2] (starboard, Pyranometer, Kipp…) | W m−2 |
| Port surface photosynthetically active radiation | PAR [W/m**2] (port, PAR sensor, Two Skye In…) | W m−2 |
| Starboard surface photosynthetically active radiation | PAR [W/m**2] (starboard, PAR sensor, Two Sk…) | W m−2 |
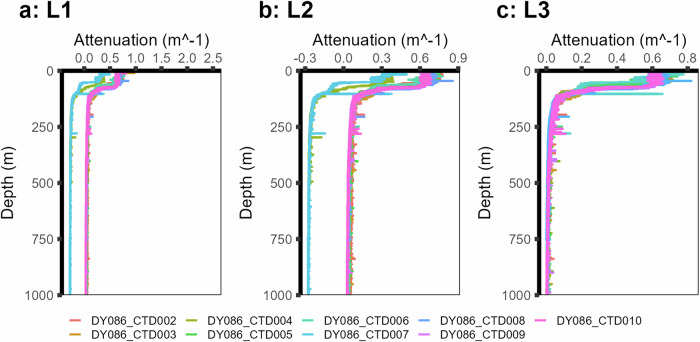
This work includes newly processed biogeochemical parameters PAR, turbidity and attenuation. PAR is presented as the mean of one-metre bins of raw downcast data (night-time profiles are included). Beam attenuation was calculated from factory-calibrated transmittance. Raw turbidity and attenuation data underwent the following: upcast removal and removal of CTD ‘dip’ data so that profiles begin at 5 metres on the downcast. Further, attenuation data showed a consistent divergence in signal between the two rosettes (Fig. 2a,b). To correct for this, a ‘deep blank’ was calculated for each profile and subtracted (Fig. 2c). The deep blank was set to a minimum value between the deepest 50 metres of a profile. However, profiles where the maximum depth was less than 600 metres were removed as the signal had not yet stabilised; data points below 1000 metres were removed as the focus of this dataset is the biological carbon pump through the mesopelagic region. Data were then binned onto 1-metre intervals.
Fig. 2.
Levels of processing and data cleaning in attenuation profiles from P3A displaying (a) raw data, (b) the removal of the CTD ‘dip’ (b) which clearly demonstrates the difference in data between the titanium (CTD004 and CTD007) and stainless steel (all others) rosettes, and (c) all profiles with deepest values subtracted to normalise the data between rosettes.
DateTime, Latitude and Longitude columns were added to files ‘Ship-based meteorological data’, ‘Discrete POC concentration and flux data’, ‘Net-derived biomass data’ (Table 4) and ‘Acoustic backscatter data’ (Table 5). Discrete POC concentration and flux data contains discrete ship-based measurements of POC and POC flux; these data were used to calibrate the simultaneous glider backscatter data collected as part of the GOCART project11,15,16. Versions of Discrete POC concentration and flux data were previously available on request from the author11 but have now been made instantly accessible, and event numbers were included. Net-derived biomass data constitutes a temporal average but first and last Event numbers from the ship’s Event Log were included for each data value. Data included in Net-derived biomass data were provided by Dr Kathryn Cook. Net-derived biomass data constitutes a summary of active flux values relevant for BCP investigation that are plotted in Figs. 2,4,5 (pages 7, 8 and 9, respectively)17. For Acoustic backscatter data, raw acoustic data were provided by Dr Sophie Fielding. The depth-zonal means of these data are described in the literature and plotted in Figures S1, S2 on Pages 7-8 of their Supplementary Data17, but the data remained unpublished prior to this work. Code containing the required analysis to produce their Supplementary Figures S1, S2 could not be made available. As such, any mean Sv values less than -100 decibels were removed before separating into day and night values. Then, using smooth.spline from R’s ‘stats’ package (version 3.6.2) with 10 degrees of freedom to recreate data in the plots, a new column was created on 10-metre depth bins for each frequency.
Table 4.
Parameters included in net-derived biomass data file.
| Parameter | Column header | Unit |
|---|---|---|
| Event | Event | NA |
| Latitude | Latitude | degrees North |
| Longitude | Longitude | degrees East |
| DateTime | Date/Time | YYYY-MM-DD HH:mm:ss |
| Site | Site | P3A, P3B, P3C |
| First event number | Run [#] (initial) | NA |
| Last event number | Run [#] (final) | NA |
| Event count | Runs [#] | NA |
| Day/night | Time of day | d/n |
| Depth mean | Depth water [m] (Mean values) | metres |
| Depth upper | Depth water top [m] | / |
| Depth lower | Depth water bot [m] | metres |
| Zooplankton biomass | Zoopl micronekton C [mmol/m**3] (Calculated) | mmol C m−3 |
| Zooplankton respiration | Zoopl micronekton resp C [mmol/m**3/day] (Calculated) | mmol C m−3 d−1 |
| Zooplankton ingestion | Zoopl micronekton IR C [mmol/m**3/day] (Calculated) | mmol C m−3 d−1 |
Table 5.
Parameters included in acoustic backscatter data file.
| Parameter | Column header | Unit |
|---|---|---|
| Event | Event | NA |
| DateTimeStart | Date/Time | YYYY-MM-DD HH:mm:ss |
| DateTimeEnd | Date/Time 2 | YYYY-MM-DD HH:mm:ss |
| Latitude | Latitude | degrees North |
| Longitude | Longitude | degrees East |
| Site | Site | N/A |
| Frequency | Frequency [kHz] | kHz |
| Day/night | Time of day | ‘d’ or ‘n’ |
| Depth | Depth water [m] | metres |
| Backscatter | Backsc [dB] | decibels |
Data Records
The dataset is available at PANGAEA18–22. PANGAEA follows FAIR data principles; in particular, data is more findable than comparable repositories. The fields for each data file are included below. A citation is included for data that have been described previously.
Ship-based CTD profile data (Major-etal_2023_CTD)
Data collected via sensors attached to the CTD rosette and subsequent bottle data analysis18. Data were averaged into 1-metre depth bins.
Ship-based meteorological data (Major-etal_2023_meteorology)
Meteorological data collected by ship-fitted systems; a reading was provided for every minute at each site19.
Discrete POC concentration and flux data (Major-etal_2023_POC_disc)
Discrete instrument data used to determine POC concentrations and calculate POC fluxes including MSCs, SAPS and PELAGRA Traps20.
Net-derived biomass data (Major-etal_2023_biomass)
Discrete net-derived data containing biomass, respiration and ingestion calculations17,21.
Acoustic backscatter data (Major-etal_2023_Sv)
Acoustic backscatter data in five frequencies (18, 38, 70, 120 and 200 kHz) separated into day and night profiles22. Backscatter profiles were averaged across each site visit17. First and last event numbers and event count (total deployments) for each data point are included.
Technical Validation
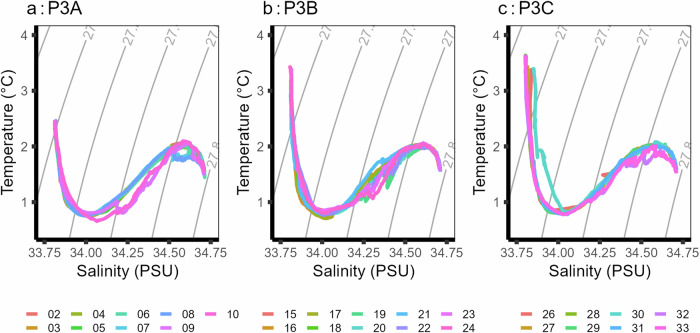
Data presented here achieve technical validation because all sensors were calibrated within the timescale recommended by manufacturers prior to deployment (see file ‘parameters_instruments_methods.csv‘ for calibration dates), expert knowledge went into data collection, and data have been plotted and visually checked for consistency (e.g. Figure 3). On top of this, much of the data has been described elsewhere and has successfully undergone the scientific review process. Water samples collected from the sample bottles were taken using standard best practices and methods are outlined in the cruise report23 and in the aforementioned literature. Further, methods for newly presented data PAR, turbidity and attenuation have been outlined and exemplified in Fig. 2.
Fig. 3.
Temperature-salinity plots across the three P3 site visits for individual CTD profiles. Grey lines denote Sigma-Theta density intervals. CTD profiles 1, 11, 12, 13, 14 and were taken at non-P3 sites and are thus not included.
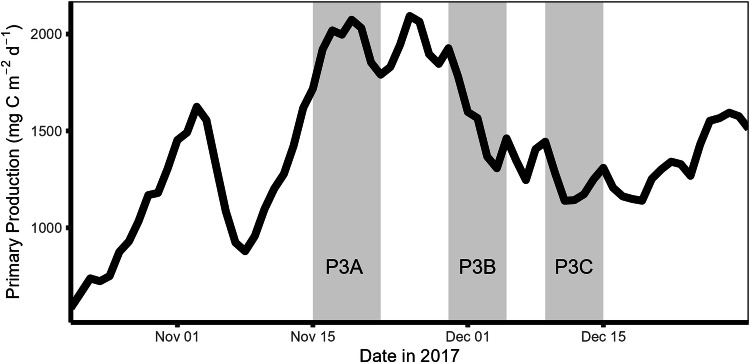
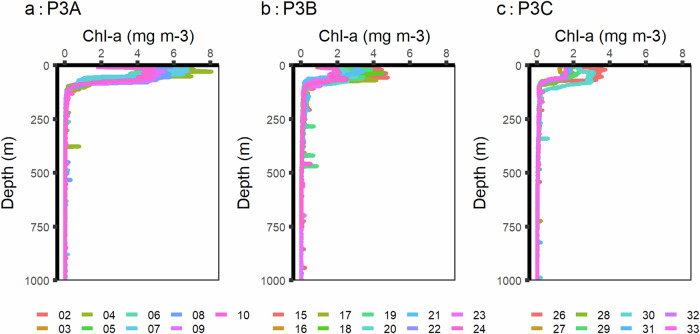
Available ship-based measurements are consistent with satellite data. Satellite data suggests the peak austral spring bloom (2093.1 mg C m−2 d−1) occurred over the course of the cruise (Fig. 4). Chlorophyll-a measurements presented here correlate with satellite measurements throughout the field campaign and demonstrate the decline in the bloom (Fig. 5). However, there are limitations of the POC concentration and flux data: PELAGRA traps may under sample small particles due to their conical shape24; MSCs may not represent the study site as a whole as they are instantaneous snapshots15; POC bottle and in situ pump data also come with accuracy complications25. Glider-derived backscatter generally represented the spread of POC concentration and flux data11 and was used to generate high-resolution POC data that have also been made available with PANGAEA16. For DOC data, the single profile did not permit statistical analysis of concentration and flux but these were consistent with other data collected in the region12. Moreover, uncertainties in DOC flux estimates are unlikely to impact the overall interpretation of the study site as diapycnal DOC flux contributed <0.1% to overall carbon flux during data collection, which was dominated by gravitational flux13.
Fig. 4.
Satellite primary productivity (mg C m−2 d−1) at site P3 across November and December, 2017, with the three visits to the site made by RRS Discovery highlighted in grey.
Fig. 5.
Chlorophyll-a plots across the three P3 site visits for individual CTD profiles. There is a decreasing trend in surface-level chlorophyll-a from P3A to P3C as the austral spring bloom subsides.
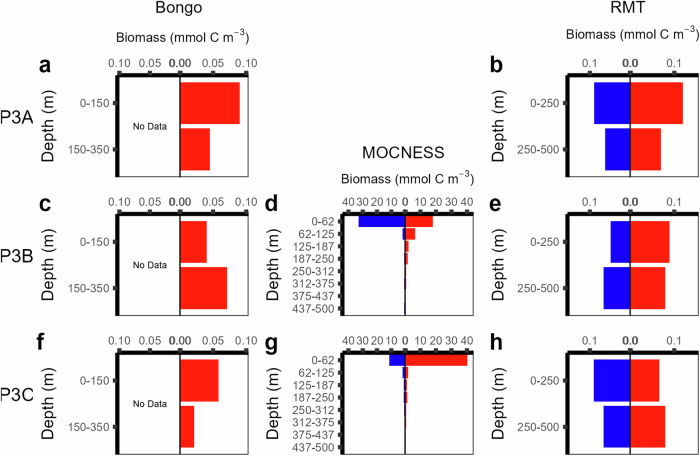
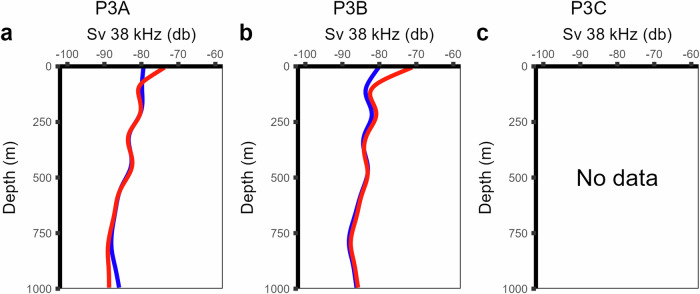
Data on active flux had several limitations: time limits meant that Bongo nets were not deployed during night-time hours and MOCNESS was not deployed at P3A17. Hence, diel vertically migrating copepods may not have been captured due to the lack of night-time Bongo net deployments. Furthermore, it is possible that organisms vertically migrated to depths greater than 500 metres; nets were deployed to a maximum of 500 metres depth. While diel vertical migration was observed in some species17, there was no consistent evidence of synchronised diel vertical migration in net-collected biomass data (Fig. 6). In line with observations of no diel vertical migration, day and night acoustic backscatter data (Fig. 7) supported the lack of evidence of synchronous migration between the surface and 1000 metres depth17. However, any active flux generated through asynchronous vertical migration is not detectable by standard acoustics and net sampling. The use of a bi-directional net from a nearby study site that elucidates asynchronous migration suggests active flux may be underestimated in this dataset26.
Fig. 6.
Profiles of zooplankton biomass. Zooplankton biomass was collected with Bongo (a,c,f), MOCNESS (d,g) and RMT25 (b,e,h) across the three P3 site visits. MOCNESS and RMT25 nets were deployed at night (blue) and day (red), but Bongo was deployed during daytime only. MOCNESS was not deployed at P3A. Reproduced after17.
Fig. 7.
Acoustic backscatter profiles at 38 kHz across two P3 site visits. Data were separated into night (blue) and day (red). Acoustic backscatter consistently shows little to no evidence of diel vertical migration. No acoustic data were available for site visit P3C.
Dissolved oxygen saturation data appear to be elevated nearer the surface relative to other data sources (e.g. ~110% in this study compared with ~100% from GLODAP data27). Bottle oxygen data from this study show reasonable agreement with GLODAP data. However, calibrated dissolved oxygen sensor data presented here show greater variation nearer the surface when compared with bottle measurements. Therefore, we recommend that caution is applied to findings that make use of dissolved oxygen saturation data from near the surface.
Usage Notes
These data can be used by observational scientists and modellers to investigate the processes contributing to organic carbon and related ecosystem interactions. The data can be used to further elucidate the effect of a phytoplankton bloom on the efficiency of the BCP. The study site P3 is characterised by elevated iron concentrations and low current speeds; hence, caution must be taken when applying findings derived from these data to different regions of the ocean.
We highly recommend making use of the following: high-resolution glider-derived backscatter POC concentration and flux data from the GOCART project that has been calibrated using ship-based measurements made during this cruise16; the BODC repository for physical, biogeochemical, meteorological parameters along with the cruise report (https://www.bodc.ac.uk/resources/inventories/cruise_inventory/report/16383/); ETS-derived respiration rates for micronekton and zooplankton from BODC (10.5285/b9f5c5ec-100a-7ff0-e053-6c86abc0f494)17; Rectangular Midwater Trawl net catch data from British Antarctic Survey (https://data.bas.ac.uk/full-record.php?id=GB/NERC/BAS/PDC/01337)17.
Acknowledgements
We would like to thank contributors to the data collection effort including all those listed on the PANGAEA data submission, along with the captain and crew of the RRS Discovery. Thank you to BODC and NERC for providing CTD and nutrient data and PANGAEA for storing our data.
Author contributions
Major: synthesis and curation of data; writing; plot creation. Giering: POC sample collection; data analysis; writing. Ainsworth: biogeochemical data collection and analysis. Belcher: zooplankton and micronekton sample collection and analysis. Blackbird: sample analysis. Bridger: cruise ship-fitted systems operations. Briggs: writing; sample collection; data analysis. Carvalho: sample collection; data analysis; satellite data acquisition. Clément: Turbulence data analysis; writing. Cook: zooplankton and micronekton sample collection and analysis; writing. Dumousseaud: sample analysis. Espinola: sample analysis. Evans: microbiology data collection and analysis. Fielding: zooplankton and micronekton sample collection and analysis; acoustic backscatter measurements. Hartmann: microbiology data collection and analysis. Henson: CTD data processing and calibration; data analysis; writing. Iversen: POC data collection. Kiriakoulakis: POC data collection. Lampitt: POC data collection. Lovecchio: DOC concentration and flux analysis. Martin: funding acquisition; writing. Mayor: zooplankton and micronekton sample collection and analysis. Moore: biogeochemical data collection and analysis. Pabortsava: sample analysis. Pedbody: sample analysis. Peel: sample analysis. Preece: zooplankton and micronekton sample analysis. Poulton: biogeochemical data collection and analysis. Rayne: microbiology data collection and analysis. Saw: POC sampling. Stinchcombe: chemical sampling and analysis. Stowasser: zooplankton and micronekton sample collection and analysis. Tarling: zooplankton and micronekton sample collection and analysis; writing. Villa-Alfageme: data analysis. Wolff: data analysis; writing. Sanders: funding acquisition; investigation.
Code availability
No custom code was used to produce data. All code used to synthesise and analyse data is available on GitHub: https://github.com/obg-wrm/COMICS_data.
Competing interests
The COMICS project (NERC NE/M020835/2) funded the data collection effort and data synthesis and submission was funded by the Sustainable Management of Mesopelagic Resources (SUMMER) project under grant agreement No 817806. The simultaenous glider mission was supported by a European Research Council Consolidator grant (GOCART, agreement number 724416) to S. Henson, as well as South Africa’s Department of Science and Innovation (DST/CON0182/2017) and the National Research Foundation (SANAP: SNA170522231782) grants; as such, these data are published separately. There is no conflict of interest in submitting this paper for consideration.
Footnotes
Publisher’s note Springer Nature remains neutral with regard to jurisdictional claims in published maps and institutional affiliations.
References
- 1.Parekh, P., Dutkiewicz, S., Follows, M. J. & Ito, T. Atmospheric carbon dioxide in a less dusty world. Geophys. Res. Lett.33, L03610 (2006). [Google Scholar]
- 2.Boyd, P. W., Claustre, H., Levy, M., Siegel, D. A. & Weber, T. Multi-faceted particle pumps drive carbon sequestration in the ocean. Nature568, 327–335 (2019). [DOI] [PubMed] [Google Scholar]
- 3.Sanders, R. J. et al. Controls over Ocean Mesopelagic Interior Carbon Storage (COMICS): Fieldwork, Synthesis, and Modeling Efforts. Front. Mar. Sci. 3 (2016).
- 4.Manno, C., Stowasser, G., Enderlein, P., Fielding, S. & Tarling, G. A. The contribution of zooplankton faecal pellets to deep-carbon transport in the Scotia Sea (Southern Ocean). Biogeosciences12, 1955–1965 (2015). [Google Scholar]
- 5.Matano, R. P., Combes, V., Young, E. F. & Meredith, M. P. Modeling the Impact of Ocean Circulation on Chlorophyll Blooms Around South Georgia, Southern Ocean. J. Geophys. Res. Oceans125 (2020).
- 6.Prellezo, R. Exploring the economic viability of a mesopelagic fishery in the Bay of Biscay. ICES J. Mar. Sci.76, 771–779 (2019). [Google Scholar]
- 7.Belcher, A., Saunders, R. & Tarling, G. Respiration rates and active carbon flux of mesopelagic fishes (Family Myctophidae) in the Scotia Sea, Southern Ocean. Mar. Ecol. Prog. Ser.610, 149–162 (2019). [Google Scholar]
- 8.Anderson, T. R. et al. Quantifying carbon fluxes from primary production to mesopelagic fish using a simple food web model. ICES J. Mar. Sci.76, 690–701 (2019). [Google Scholar]
- 9.Wilkinson, M. D. et al. The FAIR Guiding Principles for scientific data management and stewardship. Sci. Data3, 160018 (2016). [DOI] [PMC free article] [PubMed] [Google Scholar]
- 10.Ainsworth, J. et al. Iron cycling during the decline of a South Georgia diatom bloom. Deep Sea Res. Part II Top. Stud. Oceanogr.208, 105269 (2023). [Google Scholar]
- 11.Giering, S. L. C. et al. Vertical imbalance in organic carbon budgets is indicative of a missing vertical transfer during a phytoplankton bloom near South Georgia (COMICS). Deep Sea Res. Part II Top. Stud. Oceanogr.209, 105277 (2023). [Google Scholar]
- 12.Poulton, A. J. et al. Seasonal phosphorus and carbon dynamics in a temperate shelf sea (Celtic Sea). Prog. Oceanogr.177, 101872 (2019). [Google Scholar]
- 13.Lovecchio, E. et al. Export of Dissolved Organic Carbon (DOC) compared to the particulate and active fluxes near South Georgia, Southern Ocean. Deep Sea Res. Part II Top. Stud. Oceanogr. 105338, 10.1016/j.dsr2.2023.105338 (2023).
- 14.Rayne, R. R.-P. et al. Temporal shifts in prokaryotic metabolism in response to organic carbon dynamics in the mesopelagic ocean during an export event in the Southern ocean. Deep Sea Res. Part II Top. Stud. Oceanogr.214, 105368 (2024). [Google Scholar]
- 15.Henson, S. A. et al. A seasonal transition in biological carbon pump efficiency in the northern Scotia Sea, Southern Ocean. Deep Sea Res. Part II Top. Stud. Oceanogr.208, 105274 (2023). [Google Scholar]
- 16.Henson, S. A., Carvalho, F., Briggs, N. & Thomalla, S. J. Glider data collected in the Scotia Sea, October 2017-February 2018. PANGAEA10.1594/PANGAEA.967727 (2024).
- 17.Cook, K. B. et al. Carbon budgets of Scotia Sea mesopelagic zooplankton and micronekton communities during austral spring. Deep Sea Res. Part II Top. Stud. Oceanogr.210, 105296 (2023). [Google Scholar]
- 18.Major, W. et al. CTD sensor and related bottle data analyses from RRS Discovery cruise DY086 at site P3. PANGAEA10.1594/PANGAEA.963390 (2024).
- 19.Major, W., Giering, S. L. C., Bridger, M. & Sanders, R. J. Meteorological data from RRS Discovery cruise DY086 at site P3. PANGAEA10.1594/PANGAEA.963341 (2024).
- 20.Major, W. et al. Discrete particulate organic carbon (POC) concentration and flux data from three visits to site P3 in 2017. PANGAEA10.1594/PANGAEA.963391 (2024).
- 21.Major, W. et al. Net-derived biomass, respiration and ingestion data from three visits to site P3 during an austral spring bloom in 2017. PANGAEA10.1594/PANGAEA.963392 (2024).
- 22.Major, W., Giering, S. L. C., Fielding, S. & Sanders, R. J. Acoustic backscatter data from two visits to site P3 (P3A and P3B) during COMICS cruise DY086 in November to December, 2017. PANGAEA10.1594/PANGAEA.963389 (2024).
- 23.Giering, S. L. C. et al. RRS Discovery Cruise DY086, 12 November – 19 December 2017. Controls Over Mesopelagic Carbon Storage (COMICS). Southampton, UK: National Oceanography Centre, Southampton, 265pp. (National Oceanography Centre Cruise Report, No. 55) (2019).
- 24.Baker, C. A., Martin, A. P., Yool, A. & Popova, E. Biological Carbon Pump Sequestration Efficiency in the North Atlantic: A Leaky or a Long‐Term Sink? Glob. Biogeochem. Cycles36 (2022).
- 25.Turnewitsch, R. et al. Determination of particulate organic carbon (POC) in seawater: The relative methodological importance of artificial gains and losses in two glass-fiber-filter-based techniques. Mar. Chem.105, 208–228 (2007). [Google Scholar]
- 26.Dewar-Fowler, V., Robinson, C., Saunders, R. & Tarling, G. Detection of foray behaviour in zooplankton of the Antarctic Polar Front region. Mar. Ecol. Prog. Ser.715, 27–39 (2023). [Google Scholar]
- 27.Olsen, A. et al. The Global Ocean Data Analysis Project version 2 (GLODAPv2) – an internally consistent data product for the world ocean. Earth Syst. Sci. Data8, 297–323 (2016). [Google Scholar]
Associated Data
This section collects any data citations, data availability statements, or supplementary materials included in this article.
Data Citations
- Henson, S. A., Carvalho, F., Briggs, N. & Thomalla, S. J. Glider data collected in the Scotia Sea, October 2017-February 2018. PANGAEA10.1594/PANGAEA.967727 (2024).
- Major, W. et al. CTD sensor and related bottle data analyses from RRS Discovery cruise DY086 at site P3. PANGAEA10.1594/PANGAEA.963390 (2024).
- Major, W., Giering, S. L. C., Bridger, M. & Sanders, R. J. Meteorological data from RRS Discovery cruise DY086 at site P3. PANGAEA10.1594/PANGAEA.963341 (2024).
- Major, W. et al. Discrete particulate organic carbon (POC) concentration and flux data from three visits to site P3 in 2017. PANGAEA10.1594/PANGAEA.963391 (2024).
- Major, W. et al. Net-derived biomass, respiration and ingestion data from three visits to site P3 during an austral spring bloom in 2017. PANGAEA10.1594/PANGAEA.963392 (2024).
- Major, W., Giering, S. L. C., Fielding, S. & Sanders, R. J. Acoustic backscatter data from two visits to site P3 (P3A and P3B) during COMICS cruise DY086 in November to December, 2017. PANGAEA10.1594/PANGAEA.963389 (2024).
Data Availability Statement
No custom code was used to produce data. All code used to synthesise and analyse data is available on GitHub: https://github.com/obg-wrm/COMICS_data.


