Abstract
Background:
Cardiovascular disease (CVD) is associated with high mortality in the United States, but the burden of CVD mortality is unevenly distributed between demographic and geographic subgroups, with poor characterization of state-specific trends. In this study, the disparities in CVD-related mortality trends in Texas and the United States from 1999 to 2019 were assessed.
Methods:
Trends in CVD-related mortality were evaluated through analysis of the Multiple Causes of Death Files from the National Center for Health Statistics. Crude and age-adjusted mortality rates (AAMRs) per 100,000 population with associated annual percentage changes were determined. Joinpoint regression was used to assess trends in the CVD-related mortality rates.
Results:
Between 1999 and 2019, 29,455,193 CVD-related deaths were reported in the United States, of which 1,937,166 occurred in Texas. After an initial decline in the overall AAMR in Texas (annual percentage change, −2.5 [95% CI, −2.8 to −2.1]), a steady level was maintained from 2009 to 2019 (annual percentage change, 0.2 [95% CI, −0.5 to 0.2]). In the United States, after initial decline, AAMR plateaued from 2011 to 2019. Overall, CVD-related AAMR was slightly higher in Texas than in the overall United States (AAMR, 674.1 [95% CI, 673.2-675.1] vs 654 [95% CI, 653.8-654.3]). Men, non-Hispanic Black people, and people 85 years of age and older had the highest AAMRs in Texas and nationwide. Nonmetropolitan areas, both nationally and in Texas, consistently had higher mortality rates. The AAMRs also varied significantly by county within Texas.
Conclusion:
Despite an initial period of decline, CVD-related mortality rates have plateaued in Texas and the United States. Higher AAMRs were observed in Texas than in the overall United States. Prevalent disparities also exist based on demographic and geographic subgroups.
Keywords: Cardiovascular diseases, mortality, epidemiology
Key Points
The disparities in CVD-related mortality trends in Texas and the United States from 1999 to 2019 were assessed through analysis of the Multiple Causes of Death Files from the National Center for Health Statistics.
Despite an initial period of decline, CVD-related mortality rates have plateaued in Texas and the United States.
Higher AAMRs were observed in Texas than in the overall US population. Prevalent disparities also exist based on demographic and geographic subgroups, with the highest AAMRs reported in men, non-Hispanic Black people, and people 85 years of age and older in Texas and nationwide.
Further investigation of these disparities and targeted efforts are needed to equitably counter these varying levels of mortality.
Introduction
Cardiovascular disease (CVD) remains the leading cause of mortality in the United States.1–4 Despite a notable decline in age-standardized CVD mortality rates between the 1970s and 2010s, recent years, even before the COVID-19 pandemic, have seen stagnation and even a reversal of this trend in certain demographic groups.5–8 This shift may be explained partly by the simultaneous surge in the prevalence of obesity and diabetes.9 Nevertheless, it symbolizes a notable turning point in the century-old battle against heart disease. The distribution of CVD burden across the United States is uneven, with substantial variations based on geographic region, age, sex, race, and ethnicity.10 Evidence suggests that the southern region of the United States, historically associated with poor health outcomes, bears a sizeable portion of the CVD burden.3,11 In-depth understanding of CVD mortality trends at the state level is crucial for planning targeted interventions and policy-making efforts at the local level.
The aim of this study was to provide an analysis of CVD-related mortality in Texas, the second-largest state in the United States. In 2022, adults in Texas exhibited a 9.0% prevalence of CVD (unadjusted), close to the overall US prevalence of 9.1%.12 Furthermore, CVD prevalence in adults closely followed that of the overall United States in several preceding years. In addition, in 2021, heart disease hospitalizations were reported at a rate of 740.7 per 100,000 residents.13
To address the burden of CVD in Texas, which faces distinct challenges and implications regarding cardiovascular health, a nationwide database was queried for CVD-related mortality trends from 1999 to 2019. Subgroup analyses by sex, age, race, ethnicity, and geography were conducted. Trends within Texas were compared with overall trends in the United States during the same time period.
Patients and Methods
Deaths related to CVD occurring in Texas and the United States (including Texas) were extracted from the Centers for Disease Control and Prevention Wide-ranging ONline Data for Epidemiologic Research system.14 The Multiple Cause-of-Death Public Use record death certificates were used to analyze deaths in which CVD was mentioned as an underlying or contributing cause of death on nationwide death certificates. This database has previously been used in several other studies to determine trends in mortality of CVD.15,16 Cardiovascular disease was identified with International Classification of Diseases, Tenth Revision, Clinical Modification codes I00-I99 (diseases of the circulatory system) in people at least 25 years of age (people with age “not stated” were not included in this analysis; CVD-related deaths n = 1,261 between 1999 and 2019). Mortality contributed by CVD subgroups was also studied: heart disease (I00-I09, I11, I13, and I20-I51), ischemic heart disease (I20-I25), cerebrovascular disease (I60-I69), heart failure or cardiomyopathy (I11.0, I13.0, I13.2, I50, I42, 090.3), and hypertension (I10-I15). Institutional review board approval was not sought because the Centers for Disease Control and Prevention Wide-ranging ONline Data for Epidemiologic Research system contains publicly available, anonymized data.
Deaths related to CVD, population sizes, and location in which death occurred (including medical facilities [outpatient, emergency department, inpatient, death on arrival, or status unknown], home, hospice, and nursing home or long-term care facility) were extracted. Demographics (sex, race and ethnicity, and age) and regional information (metropolitan or nonmetropolitan and state) were extracted from 1999 to 2019. Race and ethnicity were defined as non-Hispanic White, non-Hispanic Black or African American, and Hispanic or Latino. In the analysis stratified by race and ethnicity, non-Hispanic Asian or Pacific Islander and non-Hispanic Native American or Alaska Native populations (the other categories available in the database during the entire study period) were not evaluated, but these populations and those with Hispanic origin “not stated” were not excluded in any other analysis. Age groups were categorized as 25 to 39, 40 to 54, 55 to 69, 70 to 84, or 85 years and older. For urban-rural classifications, the 2013 National Center for Health Statistics Urban-Rural Classification Scheme was used to divide the counties into metropolitan (large central metropolitan, large fringe metropolitan, medium metropolitan, and small metropolitan) and nonmetropolitan (micropolitan and noncore) categories.17 The data on CVD-related mortality in border (within 100 km [62 miles] of the US-Mexico border) and nonborder counties in Texas were abstracted.18
Statistical Analysis
Crude mortality rates and age-adjusted mortality rates (AAMRs) per 100,000 population were determined. The crude mortality rates were determined by dividing the number of CVD-related deaths by the corresponding Texas or US population of that year. The AAMRs were determined by standardizing the CVD-related deaths to the year 2000 population, as previously described.19 The Joinpoint Regression Program (version 4.9.1.0, National Cancer Institute) was used to determine trends in crude mortality rate and AAMR by using annual percentage change (APC).20 This method identifies temporal changes in crude mortality rate and AAMR over time by fitting a series of joined straight lines on a log scale. The APCs with 95% CIs for the crude mortality rate and AAMR were calculated at the identified line segments linking joinpoints. The APCs were considered increasing or decreasing if the slope describing the change in mortality was statistically significantly different from zero. Statistical significance was set at P < .05. The rate ratios for AAMRs were also calculated to demonstrate the mortality differences in several demographic subgroups in Texas and the United States.
Results
Between 1999 and 2019, a total of 29,455,193 CVD-related deaths were reported in the United States, of which 1,937,166 (6.6%) occurred in Texas (Supplemental Table I). In Texas, data for place of death were available for 1,869,185 deaths, of which 49.8% occurred in medical facilities, 20.6% occurred in nursing or long-term care facilities, 3.5% at hospice, and 26.1% at home. In the United States overall, of 28,173,194 deaths with data on place of death, 47.3% occurred in medical facilities, 23.8% in nursing or long-term care facilities, 3.2% in hospice, and 25.7% at home (Supplemental Table II).
Annual Trends in Mortality
Overall, the AAMR related to CVD in Texas was 802.5 per 100,000 (95% CI, 797.1-808.0) in 1999 and 615.2 in 2019 (95% CI, 611.5-618.8) (Table I). A decline in AAMR was noted from 1999 to 2009 (APC, −2.5 [95% CI, −2.8 to −2.1]), which appeared to plateau from 2009 to 2019 (APC, −0.2 [95% CI, −0.5 to 0.2]). Between 1999 and 2019, the overall AAMR related to CVD in Texas (674.1 [95% CI, 673.2-675.1]) was marginally higher than in the overall US population (654.0 [95% CI, 653.8-654.3]). In addition, Texas ranked 35th among all states in terms of CVD mortality, having the 17th-highest AAMR.
TABLE I.
CVD-Related Deaths and Mortality Rates, Stratified by Demographic and Geographic Subgroups, in Texas and the United States, 1999-2019
| Overall deaths | AAMRs in 1999 (95% CI) | AAMRs in 2019 (95% CI) | Overall AAMRs (95% CI) | |||||
|---|---|---|---|---|---|---|---|---|
| Texas | US | Texas | US | Texas | US | Texas | US | |
| Overall | 1,937,166 | 29,455,193 | 802.5 (797.1-808.0) |
798.5 (797.2-799.8) |
615.2 (611.5-618.8) |
595.6 (594.6596.5) |
674.1 (673.2-675.1) |
654.0 (653.8654.3) |
| Demographics | ||||||||
| Sex | ||||||||
| Male | 967,594 | 14,414,263 | 953.5 (943.7-963.3) |
963.6 (961.2-965.9) |
736.5 (730.4-742.6) |
715.6 (714.0-717.2) |
795.2 (793.6-796.9) |
779.4 (779.0-779.8) |
| Female | 969,572 | 15,040,930 | 690.4 (684.0-696.9) |
678.5 (676.9-680.0) |
514.1 (509.7-518.5) |
496.6 (495.5-497.7) |
577.3 (576.1-578.4) |
555.8 (555.5-556.0) |
| Race and ethnicity | ||||||||
| Non-Hispanic Black or African American | 244,453 | 3,484,590 | 1,097.0 (1,075.6-1,118.4) |
1,074.4 (1,069.0-1,079.7) |
801.8 (788.2-815.4) |
764.2 (760.7-767.7) |
900.3 (896.6-904.0) |
861.0 (860.0-861.9) |
| Non-Hispanic White | 1,314,140 | 23,510,590 | 791.1 (784.8-797.4) |
779.2 (777.8-780.6) |
643.3 (638.5-648.1) |
602.3 (601.2-603.4) |
683.3 (682.2-684.5) |
649.9 (649.7-650.2) |
| Hispanic or Latino | 347,432 | 1,612,249 | 702.0 (688.8-715.3) |
654.9 (649.1-660.7) |
517.6 (510.8-524.5) |
456.8 (454.0-459.6) |
575.5 (573.5-577.4) |
506.2 (505.4-507.0) |
| Age, y a | ||||||||
| 25-39 | 30,094 | 382,655 | 26.0 (24.6-27.5) |
29.9 (29.4-30.3) |
29.3 (28.0-30.7) |
31.9 (31.4-32.3) |
26.6 (26.3-26.9) |
29.1 (29.0-29.2) |
| 40-54 | 151,175 | 1,958,815 | 142.8 (139.1-146.4) |
148.6 (147.6-149.5) |
145.7 (142.5-148.9) |
146.9 (146.0-147.9) |
144.9 (144.1-145.6) |
146.6 (146.4-146.8) |
| 55-69 | 408,431 | 5,412,865 | 686.8 (675.7-697.8) |
683.6 (680.8-686.4) |
584.5 (577.4-591.5) |
546.9 (545.0-548.8) |
582.9 (581.1-584.7) |
546.1 (545.6-546.6) |
| 70-84 | 743,879 | 11,173,761 | 2,901.7 (2,871.4-2,932.1) |
2,887.4 (2,880.2-2,894.7) |
2,024.2 (2,004.8-2,043.6) |
1,896.9 (1,891.9-1,901.8) |
2,356.2 (2,350.8-2,361.5) |
2,267.4 (2,266.0-2,268.7) |
| ≥85 | 603,587 | 10,527,097 | 11,196.2 (11,060.5-11,331.8) |
11,141.4 (11,109.3-11,173.5) |
8,310.7 (8,222.3-8,399.2) |
8,479.1 (8,456.9-8,501.4) |
9,346.1 (9,322.5-9,369.7) |
9,327.9 (9,322.3-9,333.6) |
| Urbanization | ||||||||
| Metropolitan | 1,560,942 | 23,700,383 | 794.4 (788.2-800.6) |
789.6 (788.2-791.1) |
596.5 (592.6-600.4) |
576.7 (575.6-577.7) |
659.4 (658.3-660.4) |
638.9 (638.7-639.2) |
| Nonmetropolitan | 376,224 | 5,754,810 | 839.8 (827.6-852.0) |
837.1 (834.0-840.2) |
732.3 (721.9-742.7) |
695.6 (693.1-698.2) |
750.9 (748.5-753.3) |
727.0 (726.4-727.6) |
| CVD type | ||||||||
| Heart failure or cardiomyopathy | 489,278 | 7,209,839 | 203.5 (200.7-206.3) |
190.0 (189.3-190.6) |
170.2 (168.3-172.2) |
159.6 (159.1-160.1) |
174.4 (173.9-174.9) |
160.1 (160.0-160.2) |
| Ischemic heart disease | 802,617 | 12,173,206 | 402.7 (398.8-406.6) |
385.5 (384.6-386.4) |
220.5 (218.3-222.7) |
204.9 (204.4-205.5) |
278.6 (277.9-279.2) |
269.9 (269.7-270.0) |
| Cerebrovascular disease | 356,189 | 5,071,077 | 177.1 (174.5-179.7) |
159.9 (159.3-160.5) |
105.5 (104.0-107.0) |
97.1 (96.7-97.4) |
126.2 (125.8-126.7) |
113.0 (112.9-113.1) |
AAMR, age-adjusted mortality rate per 100,000; CVD, cardiovascular disease.
Crude mortality rate per 100,000 is used for age groups.
In the United States as a whole, AAMRs were 798.5 in 1999 (95% CI, 797.2-799.8) and 595.6 in 2019 (95% CI, 594.6-596.5). Mortality rates declined from 1999 to 2011 (APC, −2.4 [95% CI, −2.5 to −2.2]) before stabilizing in the 2011 to 2019 period (APC, −0.1 [95% CI, −0.4 to 0.1]) (Fig. 1, Supplemental Tables III and IV). The maps in Supplemental Figures 1A, 1B, and 1C and Figure 2 show CVD mortality rates across US states during the years 1999 to 2004, 2005 to 2009, 2009 to 2014, and 2015 to 2019, respectively.
Fig. 1.
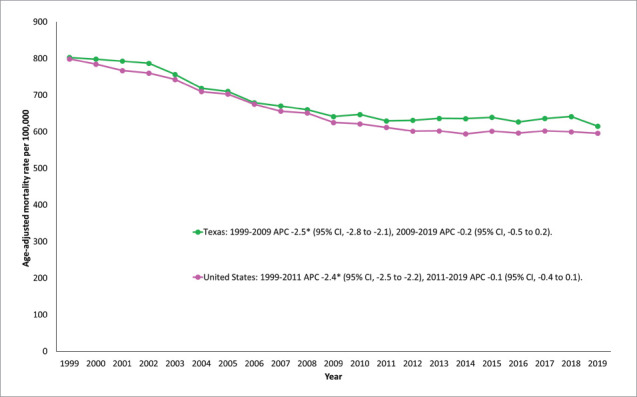
Trends in overall cardiovascular disease–related age-adjusted mortality rates in Texas and the United States, 1999 to 2019.
*Indicates that the annual percentage change (APC) is statistically significantly different from zero at α = .05.
Fig. 2.
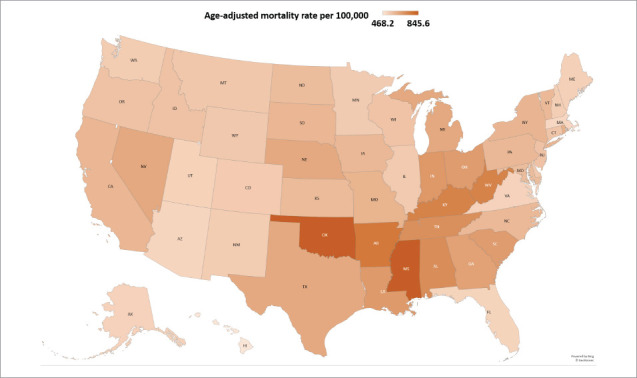
State-level cardiovascular disease–related age-adjusted mortality rates per 100,000 people in the United States, 2015 to 2019.
Mortality Trends Across Demographic Groups
Sex
In Texas, higher CVD-related AAMRs were observed in men (1999: 953.5 [95% CI, 943.7-963.3]; 2019: 736.5 [95% CI, 730.4-742.6]) than in women (1999: 690.4 [95% CI, 684.0-696.9]; 2019: 514.1 [95% CI, 509.7-518.5]) throughout the study period. In both men and women, the decline in the CVD AAMR was steeper between 1999 and 2009 (APC for men, −2.5 [95% CI, −2.9 to −2.2]; APC for women, −2.5 [95% CI, −2.9 to −2.1]), with flattening thereafter for men from 2009 to 2019 (APC, 0 [95% CI, −0.3 to 0.3]), and the decline in AAMR decreased for women from 2009 to 2019 (APC, −0.5 [95% CI, −0.9 to −0.1]) (Fig. 3, Supplemental Table IV).
Fig. 3.
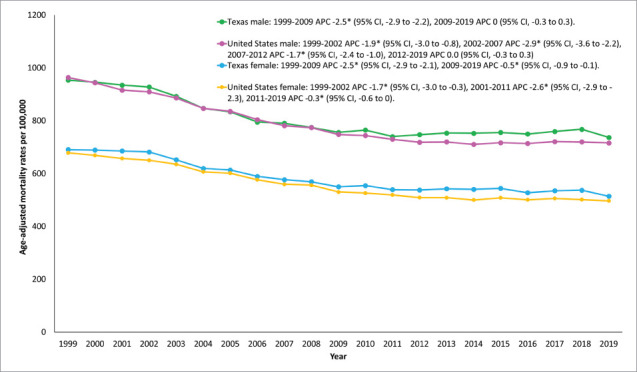
Cardiovascular disease–related mortality rates stratified by sex in Texas and the United States, 1999 to 2019.
*Indicates that the annual percentage change (APC) is statistically significantly different from zero at α = .05.
As in Texas, in the overall US population AAMRs were higher in men (1999: 963.6 [95% CI, 961.2-965.9]; 2019: 715.6 [95% CI, 714.0-717.2]) than in women (1999: 678.5 [95% CI, 676.9-680.0]; 2019: 496.6 [95% CI, 495.5-497.7]). In men, after the initial decline in CVD AAMR from 1999 to 2009, there was a subsequent flattening from 2009 to 2019 (APC for men, 0.0 [95% CI, −0.3 to 0.3]). In women, after the initial decline, the decrease in AAMR decelerated from 2011 to 2019 (APC, −0.3 [95% CI, −0.6 to 0]) (Supplemental Figure 2A, Supplemental Table IV).
Race and Ethnicity
When stratified by race and ethnicity, the highest AAMRs in Texas were reported among non-Hispanic Black or African American people (1999: 1,097 [95% CI, 1,075.6-1,118.4]; 2019: 801.8 [95% CI, 788.2-815.4]), followed by non-Hispanic White people (1999: 791.1 [95% CI, 784.8-797.4]; 2019: 643.3 [95% CI, 638.5-648.1]) and Hispanic or Latino populations (1999: 702.0 [95% CI, 688.8-715.3]; 2019: 517.6 [95% CI, 510.8-524.5]), aligning with the national trend. Trends in CVD-related mortality stratified by race and ethnicity in Texas and the United States are shown in Figure 4 and Supplemental Table V. Compared with the non-Hispanic White population in Texas and the United States, AAMRs were higher in the non-Hispanic Black population (rate ratio, 1.32 in Texas, 1.32 in the United States) and lower in the Hispanic population (rate ratio, 0.84 in Texas, 0.78 in the United States) (Supplemental Table VI). For all 3 groups, mortality was higher in Texas than in the United States.
Fig. 4.
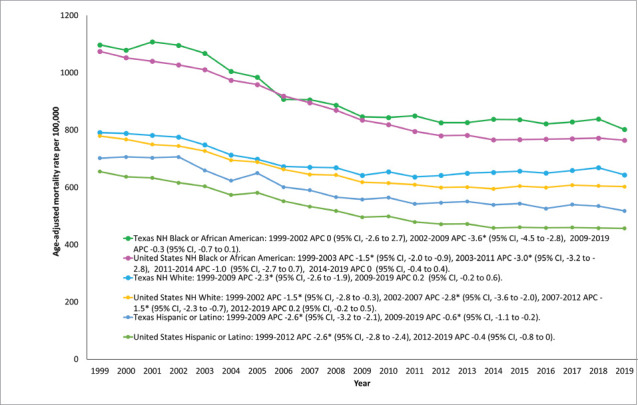
Cardiovascular disease–related mortality rates stratified by race and ethnicity in Texas and the United States, 1999 to 2019.
NH, non-Hispanic.
*Indicates that the annual percentage change (APC) is statistically significantly different from zero at α = .05.
Age
In Texas, CVD-related mortality escalated with increasing age. The highest mortality rates were reported in people 85 years of age and older (1999: 11,196.2 [95% CI, 11,060.5-11,331.8]; 2019: 8,310.7 [95% CI, 8,222.3-8,399.2]). After an initial decline in CMRs for most age groups, a significant rise in mortality rates was seen in the 25 to 39 year (APC, 1.6 [95% CI, 0.8-2.5]) and 55 to 69 year (APC, 1.2 [95% CI, 1.1-1.4]) age groups from 2010 to 2019 and 2011 to 2019, respectively. Similar patterns of mortality were seen nationwide (Fig. 5, Supplemental Figure 2B, Supplemental Table VII).
Fig. 5.
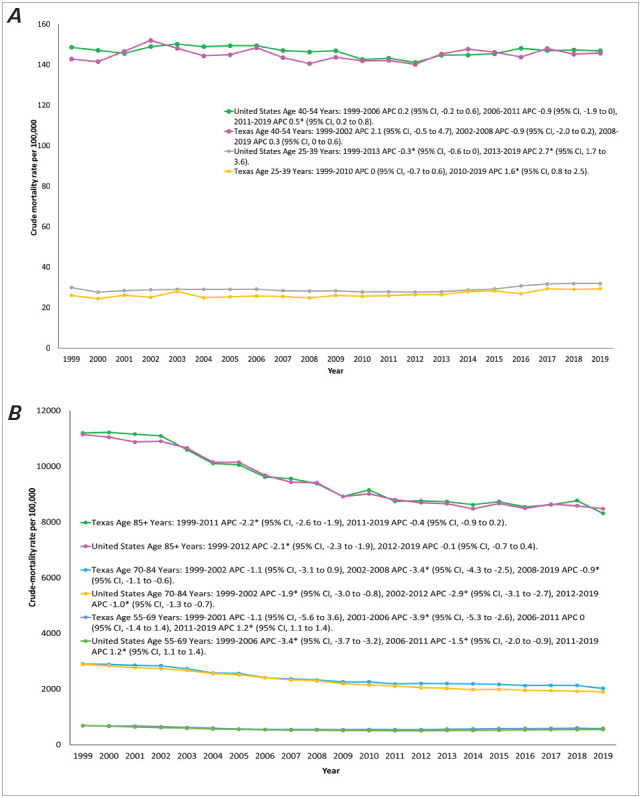
A) Cardiovascular disease–related mortality rates, stratified by age group, in Texas and the United States, 1999 to 2019. B) Cardiovascular disease–related mortality rates, stratified by age group, in Texas and the United States, 1999 to 2019.
*Indicates that the annual percentage change (APC) is statistically significantly different from zero at α = .05.
Geographic Trends in Mortality
Metropolitan and Nonmetropolitan
Cardiovascular disease–related AAMRs were persistently higher in nonmetropolitan areas (1999: 839.8 [95% CI, 827.6-852.0]; 2019: 732.3 [95% CI, 721.9-742.7]) of Texas as compared with metropolitan areas (1999: 794.4 [95% CI, 788.2-800.6]; 2019: 596.5 [95% CI, 592.6-600.4]). Greater overall mortality rates were noted in adults in Texas than in the United States, both in nonmetropolitan counties and in metropolitan counties (750.9 [95% CI, 748.5-753.3] vs 727.0 [95% CI, 726.4-727.6] and 659.4 [95% CI, 658.3-660.4] vs 638.9 (95% CI, 638.7-639.2], respectively). Despite an initial decline, a rise was observed in the AAMRs associated with nonmetropolitan areas from 2010 to 2019 in Texas (APC, 0.5 [95% CI, 0.2-0.9]) and from 2011 to 2019 in the United States (APC, 0.3 [95% CI, 0-0.7]). In contrast, after initial decline, AAMRs remained stable in metropolitan areas from 2009 to 2019 in Texas (APC, −0.3 [95% CI, −0.7 to 0.1]) and from 2011 to 2019 in the United States (APC, −0.2 [95% CI, −0.5 to 0.1]) (Fig. 6, Supplemental Table VIII).
Fig. 6.
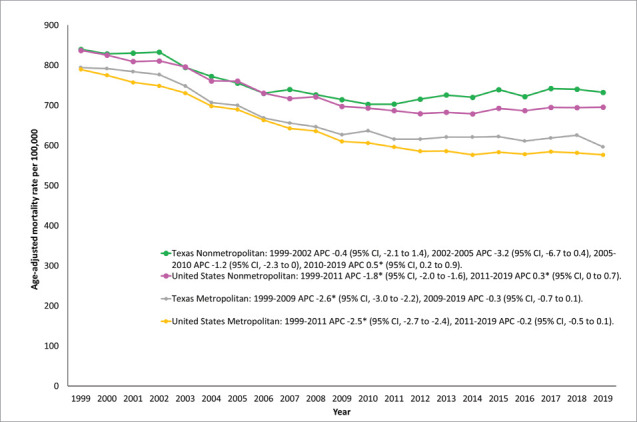
Cardiovascular disease–related mortality rates, stratified by urban-rural classification, in Texas and the United States, 1999 to 2019.
*Indicates that the annual percentage change (APC) is statistically significantly different from zero at α = .05.
States
A wide variation in AAMR was identified across states, with the rates ranging from 530.4 (95% CI, 528.9-531.9) in Arizona to 902.2 (95% CI, 899.3-905.2) in Mississippi. States included in the upper 90th percentile were Mississippi, Oklahoma, West Virginia, Alabama, Kentucky, and Arkansas. In contrast, Texas was positioned at the 68th percentile (17th highest), with an AAMR of 674.1 (95% CI, 673.2-675.1). Alternatively, states that fell in the lower 10th percentile were Arizona, Minnesota, Utah, Hawaii, Colorado, and Alaska (Fig. 7 and Fig. 8, Supplemental Table IX).
Fig. 7.
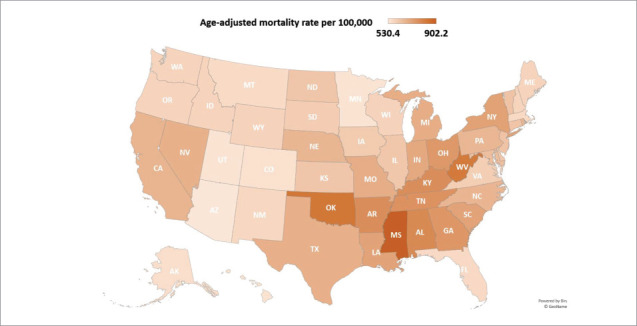
State-level cardiovascular disease–related age-adjusted mortality rates per 100,000 people in the United States, 1999 to 2019.
Fig. 8.
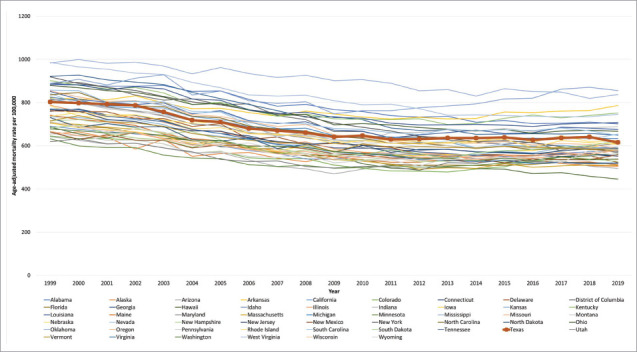
Cardiovascular disease–related age–adjusted mortality rates, stratified by state, in the United States, 1999 to 2019.
Counties
When stratified by counties in Texas, the AAMR varied from 359.9 (95% CI, 327.7-392.1) in Presidio County to 979.1 (95% CI, 958.3-999.9) in Liberty County. Notably, the 5 counties with the lowest AAMRs are Presidio, Borden, Glasscock, Jeff Davis, and Hudspeth. The 5 counties with the highest AAMRs are Orange, Red River, Newton, Winkler, and Liberty County (Fig. 9, Supplemental Table X).
Fig. 9.
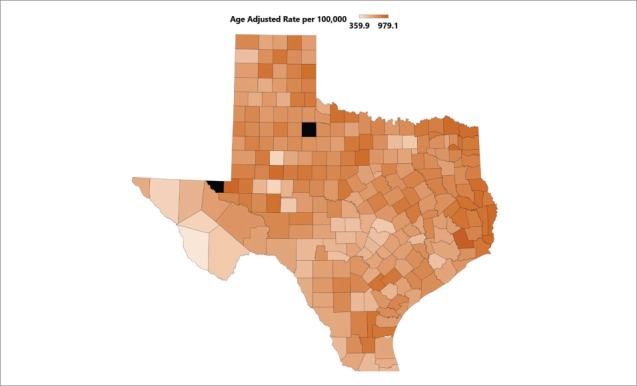
Cardiovascular disease–related age-adjusted mortality rates, stratified by county, in Texas, 1999 to 2019.
*King County (unreliable rates) and Loving County (suppressed rates)—the black boxes—are not shown.
Mortality Trends by CVD Type
In Texas, by evaluated disease categories, CVD deaths rates per 100,000 were highest for ischemic heart disease (1999: 402.7 [95% CI, 398.8-406.6]; 2019: 220.5 [95% CI, 218.3-222.7]), followed by heart failure or cardiomyopathy (1999: 203.5 [95% CI, 200.7-206.3]; 2019: 170.2 [95% CI, 168.3-172.2]) and cerebrovascular disease (1999: 177.1 [95% CI, 174.5-179.7]; 2019: 105.5 [95% CI, 104.0-107.0]). After an initial decrease, there was an upsurge in mortality rates associated with heart failure or cardiomyopathy from 2011 to 2019 (APC, 1.0 [95% CI, 0.6-1.4]). In both ischemic heart disease and cerebrovascular disease–related deaths, a decline in AAMRs was followed by a period of stabilization in 2016 to 2019 and 2011 to 2019, respectively. For all CVD subtypes, mortality rates were higher in Texas than in the overall US population (Supplemental Figs. 2C, 3A, 3B, and 3C, Supplemental Table XI).
AAMRs in Border and Nonborder Counties in Texas
Between 1999 and 2019, CVD-related AAMRs were 600.5 (95% CI, 597.6-603.3) in border counties and 682.3 (95% CI, 681.3-683.3) in nonborder counties in Texas.
AAMRs in 2020
Cardiovascular disease–related AAMR increased from 615.2 (95% CI, 611.5-618.8) in 2019 to 727.6 (95% CI, 723.7-731.6) in 2020 in Texas and from 595.6 (95% CI, 594.6-596.5) in 2019 to 691.0 (95% CI, 690.0-692.0) in 2020 in the United States. In 2020, a rise in CVD-related mortality was noted for all subgroups in Texas and the United States (Supplemental Table XII).
Discussion
This 20-year study of nationwide mortality data yielded multiple key findings. First, after an initial period of decline from 1999 to 2011, CVD-related mortality plateaued until 2019 in the United States. The CVD-related mortality stabilized in Texas from 2009 to 2019 after the initial decline. Texas had higher AAMRs than the United States, irrespective of demographic group. Second, higher AAMRs were noted in men nationwide, including in Texas. Third, non-Hispanic Black or African American people had the highest AAMRs compared with other ethnicities. In addition, nonmetropolitan counties had higher AAMRs than did metropolitan counties.
Despite an initial promising decline since 1999, the AAMRs started leveling out in 2009 in Texas and in 2011 in the United States. These results are congruent with the findings of Sydney et al,21 who first reported a deviation in the favorable downturn observed since the mid-1960s. This may be attributed in part to the surge in prevalence of CVD risk factors—namely, obesity and diabetes. Concern about the detrimental impact of obesity and diabetes on mortality rates has long been expressed, particularly in light of the national epidemiological data, which indicate a significant rise in adult obesity prevalence and a nearly 3-fold increase in diabetes prevalence around the same time.22,23
The data demonstrate strikingly higher mortality in Texas across all population groups. Historically, Texas has been ranked among the 20 unhealthiest states since 1990, according to America's Health Rankings.24 In 2017, Roth et al25 found that 19 counties in Texas were among the regions with the highest rates of age-standardized CVD mortality rates, placing them in the top 10% nationwide. Within the United States, marked disparities exist in the mortality associated with CVD and its major risk factors.7 A county-level CVD risk factor analysis using data from the Behavioral Risk Factor Surveillance Survey showed wide variation in levels of obesity, tobacco smoking, hypertension, and physical inactivity in nearly all states.26 Therefore, the relative difference in risk factor prevalence, social and environmental differences, and the care received across the country is a plausible explanation for these findings.
Throughout the study period, AAMRs were statistically significantly higher in men in Texas and the rest of the country. This finding correlates with previous research conducted on sex differences and hypertension prevalence in the United States. In most age groups, a higher prevalence of hypertension has been detected in men.27 Sex-based variations in telomerase activity and the influence of genes, particularly those regulating insulin resistance and fat distribution, could diminish men's tissue repair capacity and amplify their susceptibility to vascular disease.28,29 This finding, along with higher rates of cigarette smoking, alcohol consumption, and suboptimal dietary habits among men compared with women within the United States, may contribute to the noted sex differences in mortality rates in this study.30
In concordance with numerous national studies, these findings also indicate significant disparities between races. In the United States, including Texas, non-Hispanic Black patients had the highest mortality, which persisted throughout the study. Worse cardiovascular health markers in these people combined with an earlier age of disease onset and disparities in health care may provide an explanation for this difference. Furthermore, Black people have been found to have the lowest comprehensive cardiovascular health index scores.31–33 Moreover, in contrast to other racial groups, there was a slightly wider gap in the mortality rates among Hispanic people in Texas compared with the entire United States. Despite having a lower than average median household income and a higher prevalence of obesity and diabetes than non-Hispanic White people, Hispanic people had the lowest rates of CVD-associated mortality.34–36 The underlying cause remains unclear and mandates further research for clarification.
In contrast to other age groups in which the mortality rates have recently stabilized or even declined, there was an increase in crude mortality rates in adults aged 25 to 69 years in the latter part of the study nationally and in Texas (statistically significant in most age categories between 25 and 69 years). This concerning phenomenon was first observed in a cross-nation study of CVD mortality trends in Australia and the United States, where an increase was observed between 35 and 74 years of age. The United States was in the tier of nations with the highest prevalence of premature mortality.37 The concurrent, adverse trends in obesity and diabetes among young adults, along with increases in sedentary behavior, suggest that these trends play a key role in increasing premature mortality.38,39
In addition, there were substantial geographic variations in mortality rates on a national and state level in this study. Nonmetropolitan areas bear the highest burden of CVD-related deaths. In the United States, disparities in CVD mortality by geographic location, education level, and socioeconomic status have been pervasive,7,40a pattern that can be explained by the lack of uniformity in access to health care, the higher incidence of comorbidities, and a sedentary lifestyle.41 Similar to Texas, the states ranked in the upper 90th percentile are also located in the South. Notably, southern states demonstrate the highest prevalence of smoking, obesity, and physical inactivity, with increases in obesity rates more pronounced in this region.42,43
These findings underscore the need to address the higher mortality rates in Texas and indicate a need for more state-specific targeted interventions. Moreover, given the multitude of disparities in CVD mortality by age, sex, race, and geographic location, it is important to consider how prospective demographic changes could affect the composition of future CVD cases. These findings have critical policy-making implications because they highlight the need to develop tailored strategies and mindful allocation of resources to ensure equitable and effective prevention and management of CVD.
To reduce this national health burden, it is imperative to further evaluate the regional variation in risk factors that contribute to varying trends in CVD-related deaths. Future studies should aim to identify the interactions between these factors and their impact on CVD outcomes in Texas. It is recommended to develop multidisciplinary state-specific interventions tailored to the unique population of Texas.
Study Limitations
There are several limitations to be addressed. First, the reliance on International Classification of Diseases codes and death certificates increases the risk of misrepresentation of CVD as a cause of death. Second, the database does not furnish information on disease characteristics that could aid in better characterization of the diagnosis, such as laboratory findings or echocardiographic data. Third, data on medical treatments received are unavailable. Fourth, there was no information about socioeconomic determinants of health, which may influence access to care.
Conclusion
These results show that after the initial decline, CVD-related mortality has plateaued in the United States, including Texas. The AAMRs were higher in Texas than in the overall United States. Disparities also exist based on age, sex, race, and rural-urban designation. Further investigation of these disparities and targeted efforts are needed to equitably counter these varying levels of mortality.
Supplementary Material
Abbreviations
- AAMR
age-adjusted mortality rate
- APC
annual percentage change
- CVD
cardiovascular disease
Article Information
Open Access: © 2024 The Authors. Published by The Texas Heart Institute®. This is an Open Access article under the terms of the Creative Commons Attribution-NonCommercial License (CC BY-NC, https://creativecommons.org/licenses/by-nc/4.0/), which permits use and distribution in any medium, provided the original work is properly cited, and the use is noncommercial.
Author Contributions: M.S.U. and A.J. were co-primary first authors. M.S.U. and A.J.: drafting the manuscript. A.M.K.M.: conception and design of the manuscript, data abstraction, statistical analysis, critical revisions, and supervision. S.G., C.M.B., G.E.T., S.S.V., V.N., L.A.A., A.M., K.N., S.A.K., Z.C., M.A., and J.B.: critical revisions.
Conflict of Interest Disclosure: None.
Funding/Support: None.
References
- 1.Roger VL, Go AS, Lloyd-Jones DM, et al. Heart disease and stroke statistics—2012 update: a report from the American Heart Association. Circulation. 2012;125(1):e2–e220. doi: 10.1161/CIR.0b013e31823ac046. doi: [DOI] [PMC free article] [PubMed] [Google Scholar]
- 2.Mozaffarian D, Benjamin EJ, Go AS, et al. Heart disease and stroke statistics—2016 update: a report from the American Heart Association. Circulation. 2016;133(4):e38–360. doi: 10.1161/CIR.0000000000000350. doi: [DOI] [PubMed] [Google Scholar]
- 3.Mackay J, Mensah GA, Greenlund K. The Atlas of Heart Disease and Stroke. World Health Organization; 2004. [Google Scholar]
- 4.Wang H, Naghavi M, Allen C, et al. Global, regional, and national life expectancy, all-cause mortality, and cause-specific mortality for 249 causes of death, 1980-2015: a systematic analysis for the Global Burden of Disease Study 2015. Lancet. 2016;388(10053):1459–1544. doi: 10.1016/S0140-6736(16)31012-1. doi: [DOI] [PMC free article] [PubMed] [Google Scholar]
- 5.Morbidity and Mortality: 2012 Chart Book on Cardiovascular, Lung and Blood Diseases. National Heart, Lung and Blood Institute; 2012. [Google Scholar]
- 6.Virani SS, Alonso A, Benjamin EJ, et al. Heart disease and stroke statistics-2020 update: a report from the American Heart Association. Circulation. 2020;141(9):e139–e596. doi: 10.1161/CIR.0000000000000757. doi: [DOI] [PubMed] [Google Scholar]
- 7.Mensah GA, Wei GS, Sorlie PD, et al. Decline in cardiovascular mortality: possible causes and implications. Circ Res. 2017;120(2):366–380. doi: 10.1161/CIRCRESAHA.116.309115. doi: [DOI] [PMC free article] [PubMed] [Google Scholar]
- 8.Lopez AD, Adair T. Is the long-term decline in cardiovascular-disease mortality in high-income countries over? Evidence from national vital statistics. Int J Epidemiol. 2019;48(6):1815–1823. doi: 10.1093/ije/dyz143. doi: [DOI] [PubMed] [Google Scholar]
- 9.Mehta NK, Abrams LR, Myrskylä M. US life expectancy stalls due to cardiovascular disease, not drug deaths. Proc Natl Acad Sci U S A. 2020;117(13):6998–7000. doi: 10.1073/pnas.1920391117. doi: [DOI] [PMC free article] [PubMed] [Google Scholar]
- 10.Mensah GA, Mokdad AH, Ford ES, Greenlund KJ, Croft JB. State of disparities in cardiovascular health in the United States. Circulation. 2005;111(10):1233–1241. doi: 10.1161/01.CIR.0000158136.76824.04. doi: [DOI] [PubMed] [Google Scholar]
- 11.Pickle L. Atlas of United States Mortality. National Center for Health Statistics, Centers for Disease Control and Prevention, US Department of Health and Human Services; 1996. [Google Scholar]
- 12.America's Health Rankings analysis of CDC, Behavioral Risk Factor Surveillance System, United Health Foundation [Accessed May 16, 2023]; https://www.americashealthrankings.org [Google Scholar]
- 13.Texas Department of State Health Services. Health facts profiles: chronic disease Texas Department of State Health Services; [Accessed June 3, 2023]. https://healthdata.dshs.texas.gov/dashboard/surveys-and-profiles/health-facts-profiles/chronic-disease [Google Scholar]
- 14.National Center for Health Statistics (NCHS) [Accessed April 18, 2023];Multiple cause of death 1999-2020 on CDC WONDER Online Database. 2021 http://wonder.cdc.gov/mcd-icd10.html [Google Scholar]
- 15.Aggarwal R, Chiu N, Loccoh EC, Kazi DS, Yeh RW, Wadhera RK. Rural-urban disparities: diabetes, hypertension, heart disease, and stroke mortality among black and white adults, 1999-2018. J Am Coll Cardiol. 2021;77(11):1480–1481. doi: 10.1016/j.jacc.2021.01.032. doi: [DOI] [PMC free article] [PubMed] [Google Scholar]
- 16.Khan MS, Kumar P, Sreenivasan J, et al. Rural-urban differences in mortality from ischemic heart disease, heart failure, and stroke in the United States. Circ Cardiovasc Qual Outcomes. 2021;14(4):e007341. doi: 10.1161/CIRCOUTCOMES.120.007341. doi: [DOI] [PMC free article] [PubMed] [Google Scholar]
- 17.Ingram DD, Franco SJ. 2013 NCHS urban-rural classification scheme for counties. Vital Health Stat 2. 2014;166:1–73. [PubMed] [Google Scholar]
- 18.National Center for Health Statistics (NCHS) [Accessed February 18, 2023];Multiple Cause of Death with U.S.-Mexico Border Regions 1999-2020 on CDC WONDER Online Database. https://wonder.cdc.gov/ucd-border.html [Google Scholar]
- 19.Anderson RN, Rosenberg HM. Age standardization of death rates: implementation of the year 2000 standard. Natl Vital Stat Rep. 1998;47(3):1–16, 20. [PubMed] [Google Scholar]
- 20.Methodology National Cancer Institute Division of Cancer Control and Population Sciences Joinpoint regression program, version 4.7.0.0. Division of Cancer Controls & Population Sciences, National Cancer Institute; [Accessed March 21, 2023]. https://surveillance.cancer.gov/joinpoint/ [Google Scholar]
- 21.Sidney S, Quesenberry CP, Jaffe MG, et al. Recent trends in cardiovascular mortality in the United States and public health goals. JAMA Cardiol. 2016;1(5):594–599. doi: 10.1001/jamacardio.2016.1326. doi: [DOI] [PubMed] [Google Scholar]
- 22.Ogden CL, Carroll MD, Kit BK, Flegal KM. Prevalence of childhood and adult obesity in the United States, 2011-2012. JAMA. 2014;311(8):806–814. doi: 10.1001/jama.2014.732. doi: [DOI] [PMC free article] [PubMed] [Google Scholar]
- 23.CDC's Division of Diabetes Translation Long-term trends in diabetes. National Diabetes Surveillance System; [Accessed May 20, 2023]. http://www.cdc.gov/diabetes/statistics/slides/long_term_trends.pdf [Google Scholar]
- 24.America's Health Rankings United Health Foundation [Accessed May 5, 2023]; https://www.americashealthrankings.org/ [Google Scholar]
- 25.Roth GA, Dwyer-Lindgren L, Bertozzi-Villa A, et al. Trends and patterns of geographic variation in cardiovascular mortality among US counties, 1980-2014. JAMA. 2017;317(19):1976–1992. doi: 10.1001/jama.2017.4150. doi: [DOI] [PMC free article] [PubMed] [Google Scholar]
- 26.Ford E, Bloack PB. Explaining the decrease in US deaths from coronary artery disease: 1980-2000. Survey Anesthesiol. 2007;16(7):326. doi: 10.1097/sa.0b013e31815c1098. doi: [DOI] [Google Scholar]
- 27.Ramirez LA, Sullivan JC. Sex differences in hypertension: where we have been and where we are going. Am J Hypertens. 2018;31(12):1247–1254. doi: 10.1093/ajh/hpy148. doi: [DOI] [PMC free article] [PubMed] [Google Scholar]
- 28.Benetos A, Okuda K, Lajemi M, et al. Telomere length as an indicator of biological aging the gender effect and relation with pulse pressure and pulse wave velocity. Hypertension. 2001;37(2 pt 2):381–385. doi: 10.1161/01.hyp.37.2.381. doi: [DOI] [PubMed] [Google Scholar]
- 29.McCarthy JJ. Gene by sex interaction in the etiology of coronary heart disease and the preceding metabolic syndrome. Nutr Metabol Cardiovasc Dis. 2007;17(2):153–161. doi: 10.1016/j.numecd.2006.01.005. doi: [DOI] [PubMed] [Google Scholar]
- 30.Vartiainen E, Laatikainen T, Peltonen M, et al. Thirty-five-year trends in cardiovascular risk factors in Finland. Int J Epidemiol. 2010;39(2):504–518. doi: 10.1093/ije/dyp330. doi: [DOI] [PubMed] [Google Scholar]
- 31.Carnethon MR, Pu J, Howard G, et al. Cardiovascular health in African Americans: a scientific statement from the American Heart Association. Circulation. 2017;136(21):e393–e423. doi: 10.1161/CIR.0000000000000534. doi: [DOI] [PubMed] [Google Scholar]
- 32.Eberly LA, Day SM, Ashley EA, et al. Association of race with disease expression and clinical outcomes among patients with hypertrophic cardiomyopathy. JAMA Cardiol. 2020;5(1):83–91. doi: 10.1001/jamacardio.2019.4638. doi: [DOI] [PMC free article] [PubMed] [Google Scholar]
- 33.Pilkerton CS, Singh SS, Bias TK, Frisbee SJ. Changes in cardiovascular health in the United States, 2003-2011. J Am Heart Assoc. 2015;4(9):e001650. doi: 10.1161/JAHA.114.001650. doi: [DOI] [PMC free article] [PubMed] [Google Scholar]
- 34.Semega LJF, Fontenot KR, Kollar MA. Income and poverty in the United States 2016. [Accessed May 20, 2023];2017 https://www.census.gov/content/dam/Census/library/publications/2017/demo/P60-259.pdf [Google Scholar]
- 35.Fryar CD, Carroll MD, Afful J. National Health and Nutrition Examination Survey; [Accessed May 20, 2023]. Prevalence of overweight, obesity, and extreme obesity among adults: United States, trends 1960-1962 through 2009-2010.http://www.cdc.gov/nchs/data/hestat/obesity_adult_11_12/obesity_adult_11_12.pdf [Google Scholar]
- 36.Caballero AE. Diabetes in the Hispanic or Latino population: genes, environment, culture, and more. Curr Diab Rep. 2005;5(3):217–225. doi: 10.1007/s11892-005-0012-5. doi: [DOI] [PubMed] [Google Scholar]
- 37.Adair T, Lopez AD. The role of overweight and obesity in adverse cardiovascular disease mortality trends: an analysis of multiple cause of death data from Australia and the USA. BMC Med. 2020;18(1):199. doi: 10.1186/s12916-020-01666-y. doi: [DOI] [PMC free article] [PubMed] [Google Scholar]
- 38.Aggarwal R, Yeh RW, Joynt Maddox KE, Wadhera RK. Cardiovascular risk factor prevalence, treatment, and control in US adults aged 20 to 44 years, 2009 to March 2020. JAMA. 2023;329(11):899–909. doi: 10.1001/jama.2023.2307. doi: [DOI] [PMC free article] [PubMed] [Google Scholar]
- 39.Yang L, Cao C, Kantor ED, et al. Trends in sedentary behavior among the US population, 2001-2016. JAMA. 2019;321(16):1587–1597. doi: 10.1001/jama.2019.3636. doi: [DOI] [PMC free article] [PubMed] [Google Scholar]
- 40.Fretz A, Schneider ALC, McEvoy JW, et al. The association of socioeconomic status with subclinical myocardial damage, incident cardiovascular events, and mortality in the ARIC study. Am J Epidemiol. 2016;183(5):452–461. doi: 10.1093/aje/kwv253. doi: [DOI] [PMC free article] [PubMed] [Google Scholar]
- 41.Glynn PA, Molsberry R, Harrington K, et al. Geographic variation in trends and disparities in heart failure mortality in the United States, 1999 to 2017. J Am Heart Assoc. 2021;10(9):e020541. doi: 10.1161/JAHA.120.020541. doi: [DOI] [PMC free article] [PubMed] [Google Scholar]
- 42.Blackwell DL, Lucas JW, Clarke TC. Summary health statistics for US adults: national health interview survey 2012. Vital Health Stat 10. 2014;10(260):1–161. [PubMed] [Google Scholar]
- 43.Pickle LW, Su Y. Within-state geographic patterns of health insurance coverage and health risk factors in the United States. Am J Prev Med. 2002;22(2):75–83. doi: 10.1016/S0749-3797(01)00402-0. doi: [DOI] [PubMed] [Google Scholar]
Associated Data
This section collects any data citations, data availability statements, or supplementary materials included in this article.


