Abstract
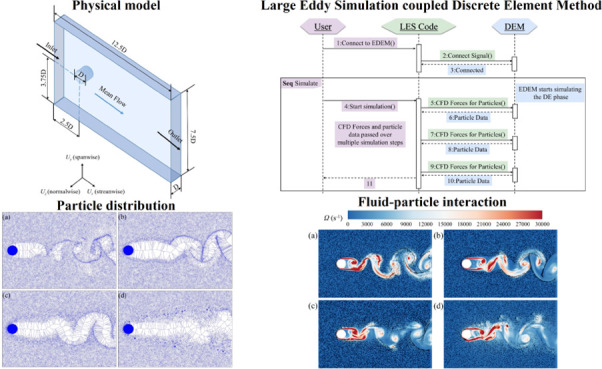
The fly ash generated by coal combustion is one of the main sources of PM2.5, so the particulate matter removal technology of coal-fired boilers is receiving increasing attention. Turbulent agglomeration has emerged as a powerful tool for improving the efficiency of removing fine particulates from environments, sparking interest in its study. Our research meticulously investigated the influence of cylindrical vortex wakes on particle flow, agglomeration patterns, and the dynamics between fluids and particles. By employing a novel hybrid computational approach that integrates the discrete element method (DEM) with large Eddy simulation (LES), we were able to accurately simulate particle–particle interactions. The study focused on understanding how particles with different diameters (2, 5, 10, and 20 μm), densities (2,500, 5,000, 7,500, and 10,000 kg·m–3), and surface energies (0.01, 0.1, and 1 J·m–2) behaved within transitioning shear layer flow conditions. Our findings revealed that particles tended to congregate in areas of lower vorticity, with larger and denser particles demonstrating greater agglomeration efficiency due to their resilience against turbulent forces. Conversely, particles of lower density formed smaller agglomerates as their susceptibility to shear forces increased. Additionally, the study discovered that higher surface energies enhance adhesion, leading to the formation of larger agglomerates.
1. Introduction
The agglomeration, movement, and deposition of microscopic particles under the influence of electrostatic and flow fields are critical dynamic phenomena across various disciplines, including environmental,1 energy,2−4 chemistry,5 and biological engineering.6 Many current methods for analyzing particulate matter, particularly in the context of environmental pollution, are limited by their inability to accurately model the interplay between particle dynamics and flow fields. For instance, environmental concerns exist regarding atmospheric pollution, primarily characterized by particulate matter, such as inhalable particles (PM10) and fine particles (PM2.5), which contribute to severe haze events.7 Fine particles readily penetrate the human body, causing extensive damage to the respiratory, cardiovascular, circulatory, and reproductive systems.8−10 Additionally, they have major impacts on air acidity, temperature, and atmospheric visibility.11−13 In the energy and power sectors, addressing air pollution from fine particles generated by combustion sources has led to increased interest in various particle removal techniques, including bag filters and electrostatic precipitators. Many dust removal methods rely on the manipulation of small particles through the application of external fields, such as electric, acoustic, and flow fields. This manipulation causes the particles to agglomerate, allowing them to be effectively captured and removed by dust collectors.
Several techniques have been developed to facilitate the agglomeration of fine particles, each with its unique mechanism and application contexts. These include electrostatic coagulation, acoustic agglomeration, turbulent agglomeration, chemical agglomeration, and condensation growth through phase changes. Electrostatic coagulation entails modifying the charging or polarization characteristics of fine particles and adjusting the applied electric field to augment particle agglomeration.14 Acoustic agglomeration relies on high-energy-density sound fields to enhance the likelihood of particle collisions, thereby fostering agglomeration. However, it has drawbacks, such as high energy consumption and elevated noise levels.15 Turbulent agglomeration enhances the relative velocity between particles of varying sizes by employing turbulent flow fields, thereby facilitating particle collisions and agglomeration.16,17 Conversely, chemical agglomeration entails the introduction of a small quantity of an agglomeration promoter into flue gas. This approach leverages forces such as liquid bridging and chemical bonding to increase the likelihood of adhesion between colliding particles.18 Water vapor phase change entails the condensation of supersaturated water vapor onto the surfaces of fine particles, resulting in an increase in their particle size. This approach is suitable for enlarging and eliminating fine particles in high-humidity settings such as wet desulfurization units or wet electrostatic precipitators.19 A technology that encourages the growth of fine particles is well-suited for the inlet duct of the front section of electrostatic precipitators. Despite its simple design and relatively low cost, turbulent agglomeration remains underdeveloped due to limited understanding of the internal dynamics of particles. The complexities of particle motion and interactions hinder our grasp of microscale flow control in intricate and confined flow conditions. Thus, studying the agglomeration structure and mechanical properties of micrometer-sized particles under various conditions is crucial for both scientific and practical advancements.
Extensive research has been conducted on the clustering of particles suspended in turbulence, through experiments,20,21 simulations,22 and theoretical approaches.23,24 Due to their micron-level size, ultrafine particles are difficult to detect and observe during experimental flow studies. This challenge limits the use of experimental methods to investigate the agglomeration mechanisms of these particles. Most experimental research has concentrated on macroscopic data, leaving a gap in our understanding of the particle-fluid interactions essential for a comprehensive grasp of turbulent agglomeration. However, advancements in computational technology have positioned numerical simulations as a powerful and effective tool for exploring the agglomeration behavior of particles in turbulent flows.
Hollander et al.25 investigated the distribution and movement of suspended particles within a flow field, highlighting how particle concentration and fluid properties influence flow characteristics. Their detailed analysis of particle–fluid interactions demonstrated that the state of particle suspension significantly affects fluid resistance and flow patterns. Meanwhile, Mortimer and Fairweather26 focused on the flow dynamics of particles suspended in a cylinder, examining the impacts of particle concentration, cylinder size, and fluid velocity on the flow field structure and particle distribution. They noted a distinct pattern in the wake region behind the cylinder, providing new insights for understanding and predicting the behavior of suspended particles in fluid flows. Haddadi et al.27 investigated the dynamics of a particle suspension flow under finite Reynolds number conditions using the lattice Boltzmann method. This study explored the interaction forces between particles and fluids and clarified their influence on flow structure and particle dispersion. Thus, the study provides an efficient computational tool for simulating suspended particle flow. Haddadi et al.28 explored the flow behavior of suspended particles passing through a cylinder and interacting with its wake using a combination of experimentation and numerical simulation. The results suggested that, at moderate Reynolds numbers, particles are either absent or sparsely distributed in the wake region behind cylinders. By numerically simulating discrete particle movement, the mechanism driving the formation of the sparse particle region in the wake was examined. The research revealed that exchange between particles and free flow causes a sparse distribution of particles in the wake region, which was consistent with experimental findings. Schuster et al.29 investigated the flow phenomenon of particles suspended near solid boundaries, particularly flow characteristics under complex geometric conditions. The accurate simulation of particle–boundary interactions elucidates how particles influence the stability of fluid flow and the alteration of flow patterns, offering valuable insights into particle behavior in confined spaces. Sun et al.30 utilized numerical simulations to compute the motion trajectories, relative velocities, and residence times of fine particles of varying sizes in diverse flow fields to explore the interaction mechanism between particle agglomeration and turbulent flow fields. Xu et al.31 proposed a mixed Eulerian–Lagrangian model to address turbulence-induced agglomeration in industry-scale applications. Li et al.32 proposed a modified Eulerian–Lagrangian model that enhanced existing methodologies by integrating a new mesh-independent approach to calculate collision probabilities and frequencies. Liu et al.33 investigated the influence of the structural characteristics of vortex generators on particle agglomeration. Their findings underscore the significance of the geometric size, number of rows, and arrangement of vortex generators in improving agglomeration efficiency. Xia et al.34 investigated the effects of a particle collision model within a direct-forcing fictitious domain method on fluid and particle statistics in turbulent channel flow with neutrally buoyant particles. The model combines the discrete element method with a lubrication force correction. After validating the code with benchmark tests on particle-wall collisions, the research explores how lubrication correction and particle stiffness influence statistics in particle-laden turbulent flows.
Previous research has primarily focused on predicting particle agglomeration phenomena and optimizing turbulent flow structures. However, there remains a notable gap in understanding how particle properties affect agglomeration processes. The complexities of particle-laden flows—such as particle transport in turbulent conditions, collision dynamics, agglomeration behaviors, and the fundamental physics at play—have yet to be fully elucidated. A promising strategy to tackle these challenges is the integrated application of large Eddy simulation (LES) and discrete element method (DEM).
In this study, we utilized the LES–DEM coupling technique to investigate the agglomeration dynamics of microparticles, focusing specifically on how varying particle attributes affect these processes. Large Eddy simulation (LES) was employed to simulate the complex vortex structures and flow characteristics of turbulent flow around a cylinder, while discrete element method (DEM) was used to capture the detailed translational and rotational motions of individual particles. Our analysis encompasses the dispersion and agglomeration characteristics of particles with different sizes (2, 5, 10, and 20 μm), densities (2,500, 5,000, 7,500, and 10,000 kg/m3), and surface energies (0.01, 0.1, and 1 J/m2). Furthermore, we examined how the wake generated by cylindrical structures impacts the rate of particle agglomeration in turbulent shear flows.
2. Research Methodology
2.1. Physical Model and Boundary Conditions
The computational domain, as illustrated in Figure 1, was established as a three-dimensional channel with dimensions of Lx × Ly × Lz = 12.5d × 7.5d × d, where d represents the diameter of the cylindrical disturbance and equals 0.002 m. The flow was considered to be a fully developed turbulent flow in the main flow direction (x-direction). Symmetric boundary conditions were applied in the y and z directions. At the inlet, there were 7.2 million particles per second. The initial velocities of the injected particles matched the local fluid velocity. Dynamic equilibrium was reached when the number of particles stabilized at approximately 22,000, ensuring a consistent basis for analyzing particle behavior and agglomeration. Detailed information on the properties of both the fluid and the particles is presented in Table 1.
Figure 1.
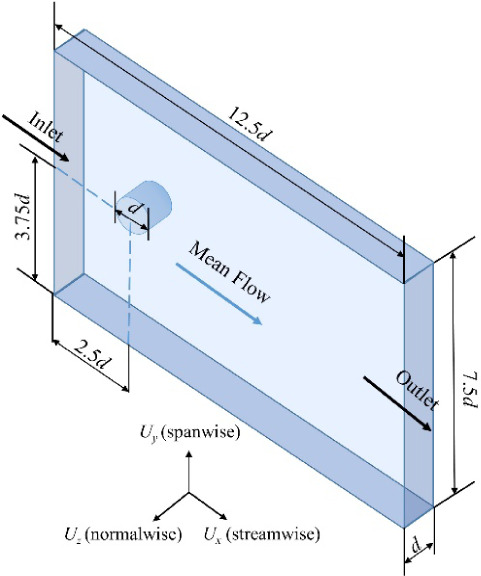
Schematic diagram of computational domain.
Table 1. Physical Parameters.
| Numerical parameter | Values |
|---|---|
| fluid density, ρf (kg·m–3) | 1.225 |
| fluid viscosity, ν (Pa·s) | 1.8 × 10⁻⁵ |
| local fluid velocity at the inlet, U (m·s–1) | 9 |
| particle diameter, dp (μm) | 2, 5, 10, 20 |
| particle density, ρp (kg·m–3) | 2,500, 5,000, 7,500, 10,000 |
| Poisson’s ratio, υ | 0.21 |
| surface energy, γ (J·m–2) | 0.01, 0.1, 1 |
| shear modulus, G (Pa) | 1 × 10⁸ |
| coefficient of restitution, e | 0.5 |
| coefficient of static friction | 0.5 |
| coefficient of rolling friction | 0.01 |
| time step, (Δtf, Δtp) (s) | 3 × 10⁻⁷, 3 × 10⁻⁹ |
2.2. Large Eddy Simulation Governing Equation
To precisely predict the dynamic flow characteristics, the fluid phase was modeled using the LES technique. The filtered momentum equation for an incompressible Newtonian fluid in the LES framework is expressed in the following conservative form:
| 1 |
| 2 |
where ui is the filtered velocity field; ρ is the density; P is the filtered pressure field; ν is the kinematic viscosity; τij represents the subgrid-scale stresses; and fi is the additional source term representing the force exerted by the particle on the fluid.
Subgrid-scale stresses brought about by filtration remain unknown; therefore, similar to with RANS (Reynolds-averaged Navier–Stokes) models, subgrid-scale turbulence models based on the Boussinesg hypothesis in ANSYS Fluent were used to calculate subgrid-scale turbulent stresses:35
| 3 |
where μt is the subgrid-scale turbulent viscosity. The isotropic part of subgrid-scale stresses τkk was not modeled but was added to the filtered static pressure term. Sij is the rate-of-strain tensor for the resolved scale and is defined as
| 4 |
Smagorinsky36 was the first to propose such a straightforward approach. The eddy-viscosity in the Smagorinsky–Lilly model is represented as
| 5 |
where LS is the
mixed length of the subgrid scale and  .
.
2.3. DEM Modeling to Solve the Particle Phase
The granular phase solution was calculated using the DEM solver. The governing equations for the translational and rotational motion of particle i are as follows:
| 6 |
| 7 |
where mp is the particle mass, up,i is the linear velocity vector of the particle, Fd,i is the Stokes drag force of the fluid eddy acting on the particle, Fg,i is the gravitational force of the particle, Fc,i is the interaction force between particle i and the adjacent particles, and Fl denotes the lift force. Ip is the moment of inertia of the particle, ωp,i is the angular velocity vector of particle i, and Mt and Mr are the torques acting on the particle that are generated by the tangential contact force and rotational friction, respectively. The rotational friction coefficient was set to 0.01.
The Hertz–Mindlin contact model with Johnson–Kendall–Roberts (JKR) adhesion, which considers the influence of contact pressure and adhesion within the contact region, was used to represent particle–particle and particle–wall interactions.37 In this model the normal force component is based on Hertzian contact theory. The tangential force model is based on Mindlin–Deresiewicz work. Both normal and tangential forces have damping components where the damping coefficient is related to the coefficient of restitution. The force-overlap relation Fn is defined as follows:
| 8 |
JKR normal force depends on the overlap δ and the interaction parameter, surface energy γ in the following way:
| 9 |
This model provides attractive cohesion forces even if the particles are not in physical contact. The maximum gap between particles with nonzero force is given by
| 10 |
The contact breaks for a critical contact force of 5/9 Fc, where Fc is the pull-off force, is predicted as
| 11 |
The equivalent elastic modulus, E*, and equivalent contact radius, R*, of the particles are calculated as follows:
| 12 |
| 13 |
where E1 and E2 are the elastic modulus of particles 1 and
2, respectively; υ1 and υ2 are Poisson’s
ratios for particles 1 and 2, respectively; and R1 and R2 are the radii of
particles 1 and 2, respectively. Additionally, there is a damping
force,  , given by
| 14 |
where  is the equivalent mass,
  is the normal component of the relative
velocity and β and Sn (the normal
stiffness) are given by
| 15 |
| 16 |
With e the coefficient of restitution. The tangential force, Ft, depends on the tangential overlap δt and the tangential stiffness St.
| 17 |
| 18 |
Here G* is the equivalent shear modulus. Additionally, tangential damping is given by
| 19 |
where  is the relative tangential velocity. The
tangential force is limited by Coulomb friction μsFn where μs is the coefficient
of static friction.
2.4. Numerical Methods: LES–DEM
Fluent software is used for the simulation of fluid, and Edem software is used for the simulation of particles. Through the coupling of the two software, the interaction between particles and fluid is simulated. This study employed a coupled LES–DEM strategy to simulate the interaction between fluid flow and particulate phases. This approach integrates the fluid dynamic behavior described by the continuous phase with the discrete particulate phase to capture the intricate dynamics of particle–fluid interactions, which include the drag force, lift force, and particle–particle collisions within the turbulent flow field.
The finite volume method (FVM) is used to discretize governing equations to ensure the conservation of mass, and momentum across the computational domain. The pressure-implicit with splitting of operators (PISO) algorithm addresses pressure–velocity coupling, enhancing the stability and accuracy of transient flow simulation. Momentum equations employ a central differencing scheme for spatial discretization, promoting second-order accuracy in capturing the fluid velocity field.38 The pressure equations are discretized using a second-order accurate scheme while maintaining precision in the pressure field of the simulation.
The selection of the time step for particle collisions was determined based on the speed of Rayleigh waves propagating across the surface of the solid particles, ensuring that the simulation accurately captured the rapid dynamics of particle interactions.
| 20 |
where tR is the Rayleigh time step, Ure is the relative collision velocity of the particles, and G is the shear modulus.
A flexible time-step ratio, ranging from 1:1 to 1:100, is maintained between the fluid and particle phases. This allows for a precise temporal resolution of fluid–particle interactions, adapting the computational effort to the varying scales of the physical phenomena being simulated. The finer time steps for the particle phase ensure that the rapid dynamics of collisions are accurately resolved, while larger time steps for the fluid phase optimize the computational efficiency without compromising the overall accuracy of the flow field simulation.39
3. Results and Discussions
3.1. Model Validation
First, to ensure that the simulation results were not influenced by the computational grid size, rigorous grid-independent tests were conducted prior to the primary calculations. The objective was to confirm the sufficiency of the mesh granularity to capture the essential physics of the flow, thereby guaranteeing the reliability of the computational findings. The study was conducted using air as the working fluid, with the flow velocity set at 9 m·s–1, corresponding to a Reynolds number of 1,216.
Structured hexahedral meshes were employed, with a focus on varying the number of grid nodes across different spatial regions while maintaining mesh quality. Four distinct grids consisting of 137,144, 243,944, 321,679, and 498,816 nodes, respectively, were tested. This variation in the node count allowed for the assessment of the influence of the mesh on the simulation outcomes. In coupling modeling, since the officially released coupling interface is developed based on the incomplete analytic method “unresolved”, the mesh volume in Fluent is required to be larger than the maximum volume of particles in EDEM. At the same time, based on the calculation stability of the solver and the calculation accuracy of the drag force, the size ratio of the mesh divided in this paper is greater than 3.
Following the establishment of boundary conditions and parameters, simulations were performed until the flow field reached a steady state. Time-averaged analyses of the simulation data were performed over a specified duration to obtain the velocity distributions along the central axis (y = 0). Figure 2 illustrates the results of the time-averaged velocity profiles at different grid resolutions. As shown in Figure 2, a grid with 321,679 nodes was selected for the subsequent simulations, as it provided the optimal balance between computational efficiency and fidelity required for accurate representation of flow physics.
Figure 2.
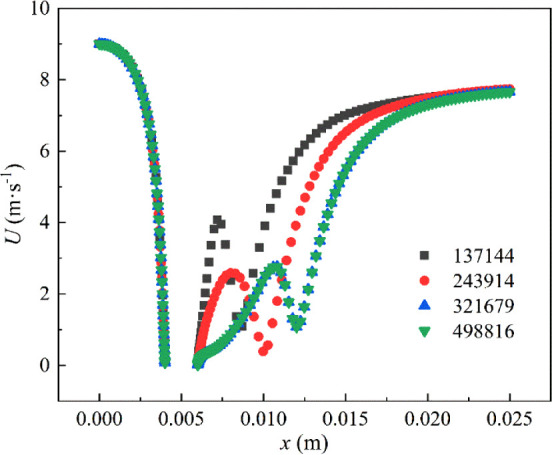
Time-averaged velocity distribution along the central axis (y = 0) for varying grid resolutions.
Second, model validation for the LES was performed based on the results of ref (40) Pasquetti et al.40 computed a considerable quantity of turbulence statistics and compared them with available experimental data to conduct direct numerical simulations (DNS) of a turbulent channel flow disrupted by a cylinder. Large eddy simulation method was used to calculate turbulence, taking air as the study object, the flow rate was selected to be 1.5 m/s, and the Reynolds number was Re = 200. The finite volume method is used to discretely control the equation, the PISO algorithm is used to solve the pressure and velocity coupling, the momentum is used in the central difference scheme, and the pressure equation is discretely of second order precision. Parameters such as the wake and velocity field of cylindrical turbulence are verified. The results revealed strong credibility because they have been widely cited and contrasted in both simulation and experimental situations. Figure 3 illustrates the spatial development of the time-averaged streamwise velocity along the centerline (y = 0), the comparison showed a fair amount of agreement between the present study and ref40
Figure 3.
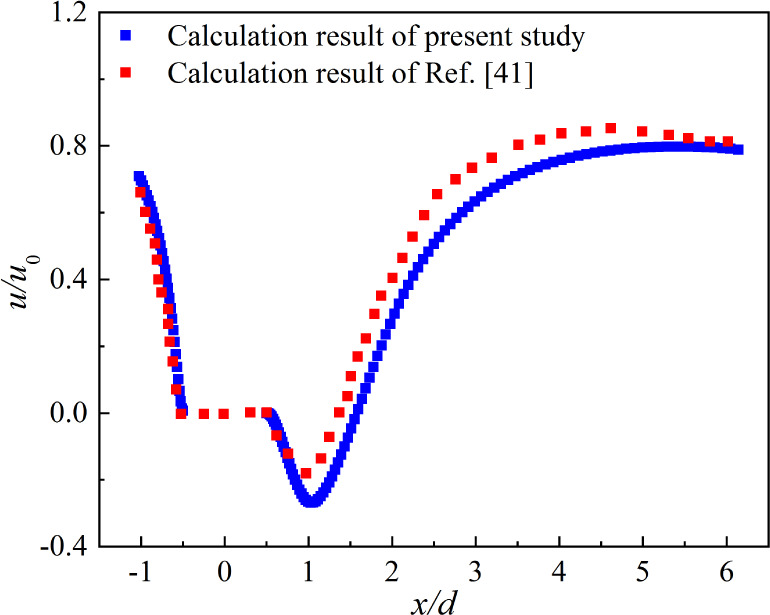
Distribution of the time-averaged streamwise velocity along the centerline (Re = 200).
Finally, the results of the DEM simulations were compared with data from a particle impact experiment, as reported in ref.41 to determine the DEM accuracy. Dong et al.41 experimentally investigated the deposition characteristics of two kinds of coal (XJ and LN coal) fly ash. The simulation settings were: particle size of 7 μm, particle density of 2953 and 2680 kg/m3. Figure 4 shows the relationship between the impact velocity (U0) and restitution coefficient (e, the restitution coefficient is defined as the ratio of the particle rebound velocity to the impact velocity). The lines indicate the results of the DEM calculations, and the scattered dots reflect the experimental measurement data. It is clear from the curves produced by the DEM calculations that the particle collision model used in this study has satisfactory consistency with the experimental results.
Figure 4.
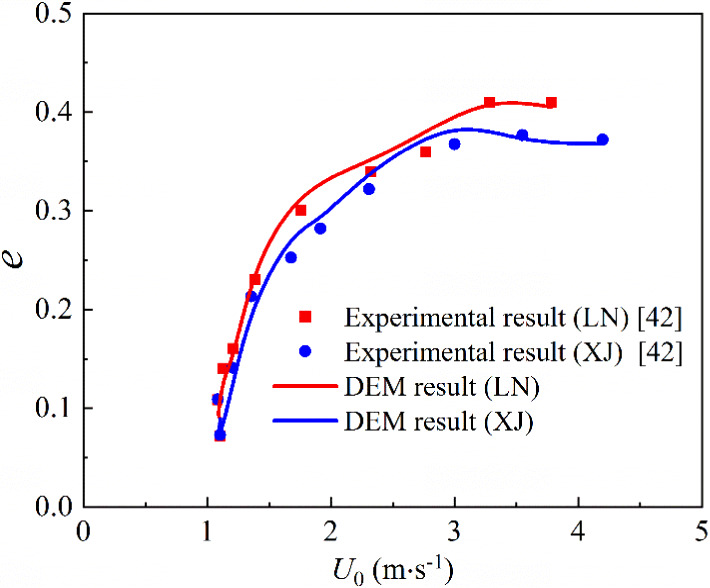
Comparison between experimental measurements and DEM calculations of the restitution coefficient of particle impact on the wall.
3.2. Flow Field without Particles
Prior to particle injection, flow field analysis was conducted. Figure 5a,b shows the instantaneous contours of gas velocity and vorticity obtained at an inlet velocity of 9 m·s–1. The wake of the cylinder was characterized by a distinctive pattern of alternating vortices, known as the von Kármán vortex street, which is a classic manifestation of flow separation and subsequent wake formation in fluid dynamics.
Figure 5.
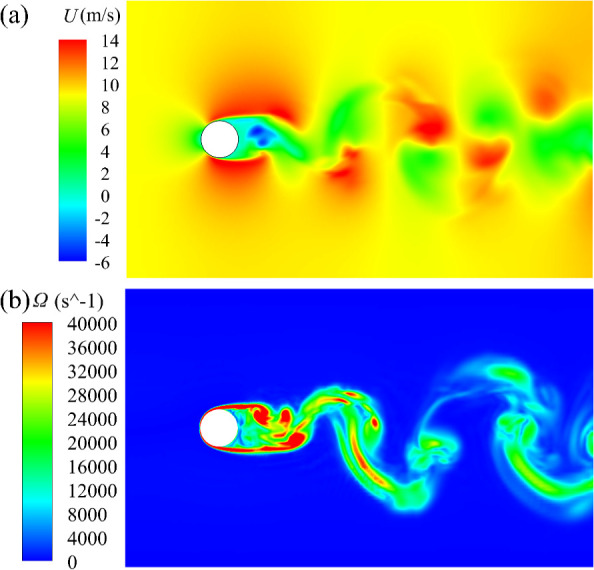
Contours of the flow field: (a) velocity contour and (b) vorticity contour.
The area in front of the cylinder appeared as a steady and undisturbed flow. Immediately behind the cylinder, the flow underwent marked acceleration, resulting in a high-velocity region. Further downstream, the flow velocity progressively decreased with increasing distance from the cylinder. This reduction in flow velocity was primarily due to the dissipation of turbulent kinetic energy, leading to a gradual relaxation of the cylinder’s influence on the flow.42 Adjacent to the flow-field boundaries, a homogeneous velocity distribution was observed, in contrast to the central region of the flow field where larger vorticities were found. The subdued vorticity near the wall regions indicated a dampening effect of the boundary layer on the turbulent fluctuations.
To verify the extent of the disturbance induced by the cylinder, seven positions were selected along the flow direction with nondimensional distances (x/d) of 0, 1.5, 2.5, 5, 7.5, 10, and 12.5 from the cylinder, where x is the streamwise distance to the inlet. The position at x/d = 2.5 corresponded to the immediate vicinity of the cylinder. Figure 6 shows the time-averaged velocity distributions at these seven positions. The figure shows a gradual decrease in the time-averaged velocity under the influence of the cylinder on the flow as x/d increases. The velocity profiles at x/d = 10 and x/d = 12.5 are nearly indistinguishable, suggesting that the flow field approached a state of equilibrium beyond x/d = 10, where the impact of the cylinder was negligible.
Figure 6.
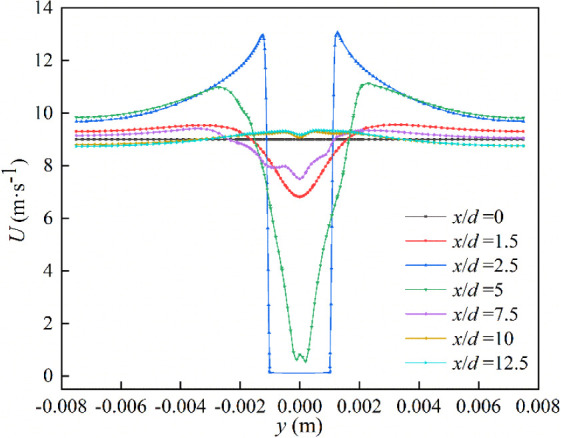
Time-averaged velocity distribution with varied x/d.
In the direction perpendicular to the flow (y-direction), the time-averaged velocities at all seven positions exhibited stable velocity regions for y/d < 3 and y/d > 3, indicating that the boundary regions of the computational domain were unaffected by the disturbance of the cylinder. Hence, the computational domain selected for this study was sufficiently large to allow full development of the flow field. This ensured the reliability of the simulation results within the domain, as the flow was allowed to evolve naturally without confinement effects or boundaries influencing the core dynamics.
3.3. Effect of the Particle Size on Agglomeration
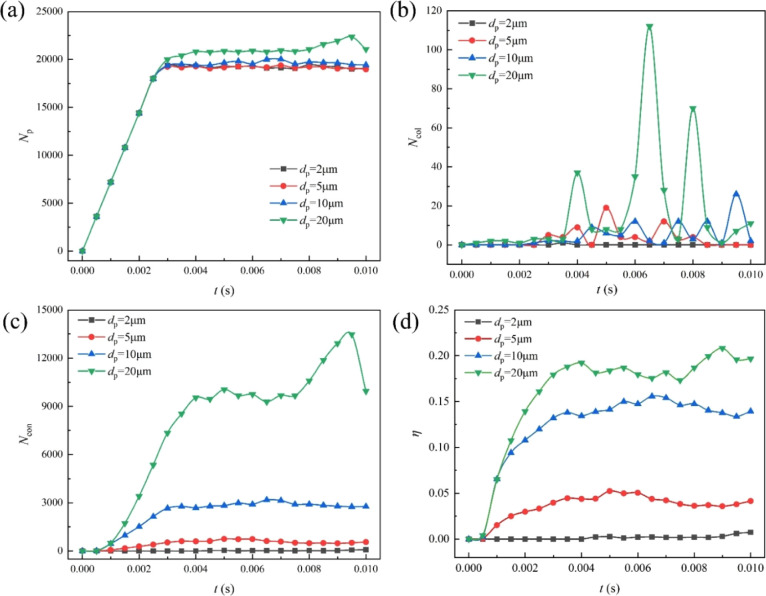
The temporal evolution and agglomeration characteristics particles with different sizes (2, 5, 10, and 20 μm) in the flow field were investigated. Figure 7 displays the variation in the particle numbers (Np), collision numbers (Ncol), contact numbers (Ncon), and agglomeration rates (η) for four particle sizes over time. Particle number refers to the number of all monomer particles in the calculated domain. Contacts are the impacts occurring between elements at data write-out points. In other words, the contact is in progress when the write-out takes place. The contact has an associated force, position and so on—these are discrete values. If two elements stay in contact with each other for some time e.g. over 4 write-out points, four contacts will be stored and each of these may have a different force, position and so on. Contact number refers to the number of all monomer particles in the domain for which contact events have occurred. Collisions are complete impacts. When two elements collide it will register as one collision, regardless of how long the elements stay in contact for. Data is collected for the duration of the collision e.g. total energy loss, min/max/average normal force data and so on. Collisions may occur in-between write-outs and never register as contacts. Collision number refers to the number of all monomer particles in the domain where the collision event occurred. The agglomeration rate η = Number of monomer particles that agglomerate/Total number of particles in the domain.
Figure 7.
Statistical results for particle with different sizes: (a) number of particles, Np; (b) number of collisions, Ncol; (c) number of contacts, Ncon; and (d) agglomeration rate, η.
Once the flow field reached a steady state, it was designated as t = 0. Subsequently, the incidence velocity of particle was set equal to the inlet velocity of air, with the numbers gradually increasing from the start of the calculations until reaching dynamic equilibrium, stabilizing within a certain range. Particles measuring 2 and 5 μm were significantly affected by fluid shear, leading to less frequent collisions and resulting in lower agglomeration rates. Because of their greater inertia, particles of 10 and 20 μm maintained their original trajectories even after passing through a turbulent cylinder, reducing the uncertainty caused by changes in the fluid path in their movement.27 This inertial effect facilitated contacts and collisions between larger particles, thereby enhancing their agglomeration rates.
Stokes number is a dimensionless number, the ratio of particle relaxation time to fluid characteristic time, which describes the behavior of suspended particles in a fluid. Stokes number represents the ratio between particle inertia and diffusion. Table 2 shows the results of the particle Stokes number calculation in this paper:
| 21 |
Table 2. Stokes Number Corresponding to Different Particle Sizes.
| Particle sizes (μm) | Stokes number |
|---|---|
| 2 | 0.14 |
| 5 | 0.87 |
| 10 | 3.49 |
| 20 | 13.97 |
The smaller the Stokes number is, the smaller the particle inertia is, the easier it is to follow the fluid movement, and the more obvious its diffusion is. On the contrary, the larger the value is, the larger the particle inertia is, and the less obvious the particle motion follows. When St > 1, when the flow line bypassed the obstacle, the particles will continue to travel in a straight line until they hit the obstacle. When St ≤ 1, the particles will closely follow the flow line.
To determine the degree of local particle enrichment and the impact of particle inertia on local particle concentrations, particles of four sizes were divided into Voronoi cells.43,44 In each Voronoi cell associated with a particle, any point within the cell must be closer to its associated particle than to any other particle and any point on the boundary of the cell must be equidistant from the nearest two particles. Therefore, the larger Voronoi volumes assigned to a particle indicated a lower local particle concentration. Figure 8 displays the two-dimensional diagrams of Voronoi cells for particles with diameters of 2, 5, 10, and 20 μm. Smaller particles exhibited higher local concentrations with smaller Voronoi volumes and clustered at the vortex edges. Larger particles exhibited dispersion and were less influenced by cylinder-induced turbulence. Additionally, the probability density distribution of particles with different sizes along the y direction was analyzed (Figure 9). The probability distribution function (PDF) of the smaller particles peaked near the cylinder, whereas the PDF of larger particles peaked away from the cylinder.
Figure 8.
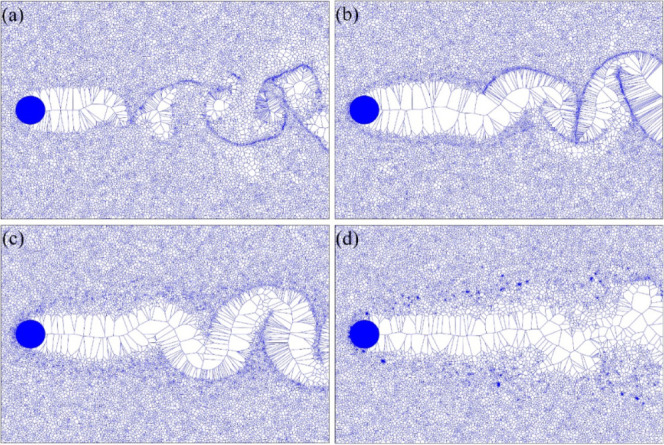
Voronoi two-dimensional diagram of particles with different sizes: (a) 2 μm, (b) 5 μm, (c) 10 μm, and (d) 20 μm.
Figure 9.
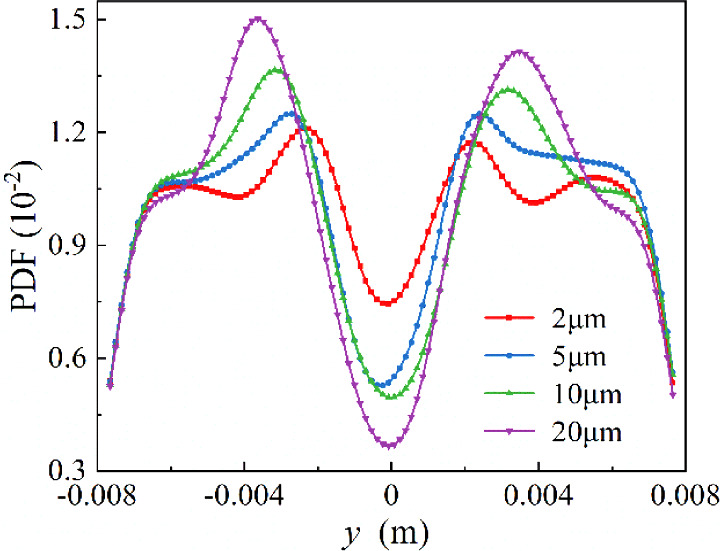
Probability density distribution of particles along the y direction.
The particle distribution and vorticity magnitude results are shown in Figure 10. Owing to the effect of the turbulent cylinder, vortex structures formed in the flow field, with particles following the fluid motion. Moreover, as the particle size increased, the distribution area of the particles increased. Centrifugation is believed to be the primary mechanism for the clustering of small particles. Larger inertial particles in turbulence tended to avoid regions of high vorticity and preferentially accumulated in regions with high strain.
Figure 10.
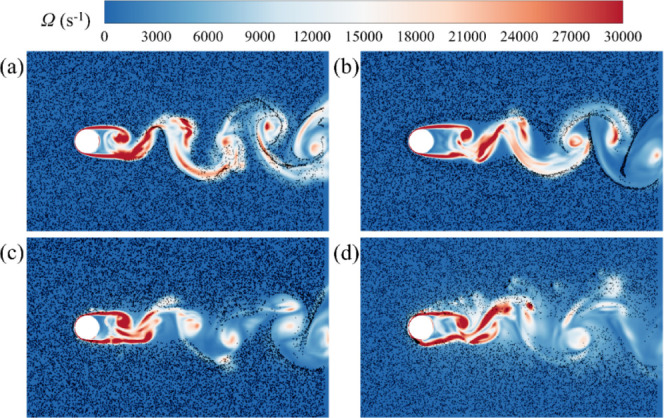
Superimposed contours of particle distributions for particles sizes of (a) 2 μm, (b) 5 μm, (c) 10 μm, and (d) 20 μm, with the vorticity distribution in the flow field.
Figure 11 shows the distribution of the particle numbers corresponding to different vorticities for various particle sizes. A vorticity was divided into different ranges, where P (N) represents the number of particles within these ranges. For particles of all sizes, the number of particles decreased significantly with increasing vorticity. Particles tended to cluster in regions of low vorticity.
Figure 11.
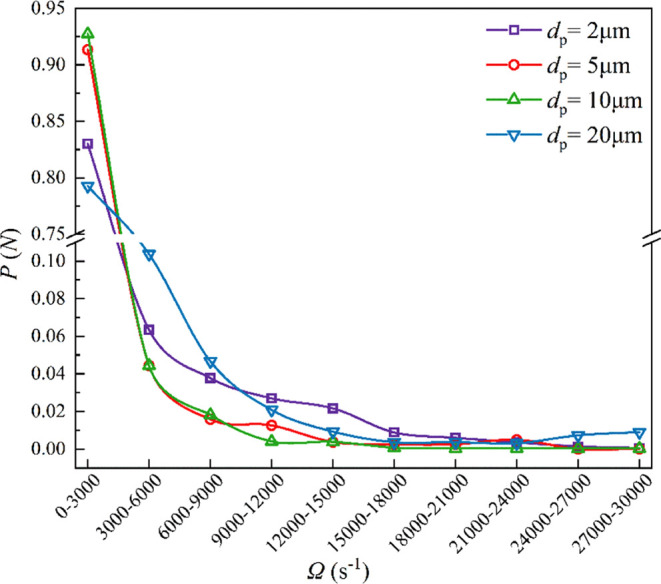
Particle number distribution corresponding to different vorticities under different particle sizes.
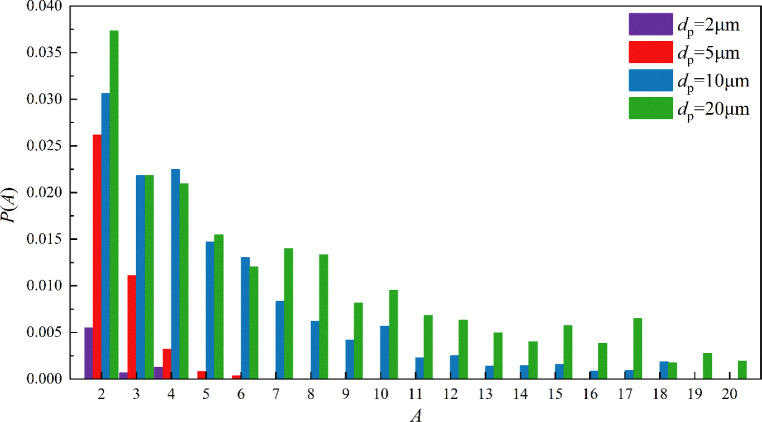
The agglomeration states under four conditions (dp = 2, 5, 10, and 20 μm) are shown in Figure 12. P (A) denotes the proportion of monomer particles in agglomerates relative to the total number of monomer particles.
| 22 |
where A is the size of the particle agglomeration and is defined as the number of single particles in the agglomeration, P (A) represents the proportion of the number of single particles contained in the agglomeration of particle size A to the total number of monomer particles, Na (A) represents the number of agglomerates, and Am is the maximum number of particles contained in the largest agglomerate formed in the system. Specifically, A = 1 indicates individual particles that do not adhere to other particles. Most particles with smaller sizes remained in the form of individual monomers, with only a small portion existing as agglomerates, and these tended to consist of fewer monomers. For larger particle sizes, the number of monomers forming agglomerates increased significantly, with the largest agglomerate size (A) being 20. This indicated that larger particles were more likely to form agglomerates containing more monomers under the influence of turbulence.
Figure 12.
Ratio of monomer particles per agglomerate to the total number of particles.
3.4. Effect of Particle Density on Agglomeration
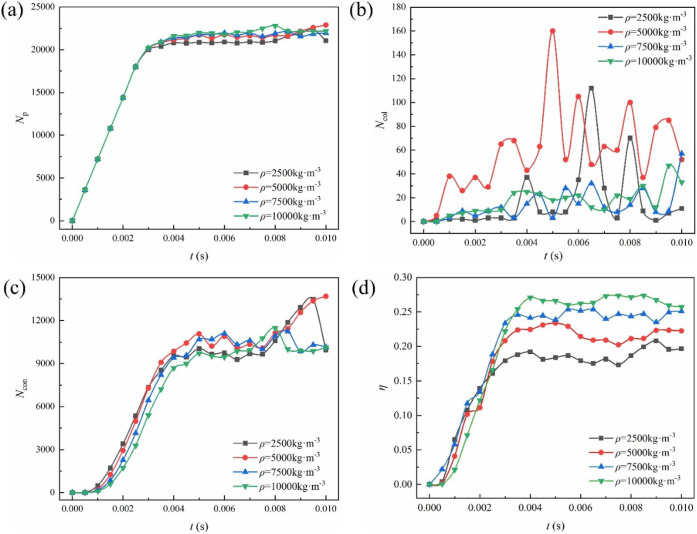
The effects of particle density on the distribution and agglomeration characteristics of micrometer-sized particles under turbulence are investigated. Initially, the particle diameter was fixed at dp = 20 μm, and the density was increased from 2,500 kg·m–3 to 10,000 kg·m–3 to determine the impact of different densities on the particle distribution. Figure 13 illustrates the variations in the particle numbers, collision numbers, contact numbers, and agglomeration rates for the four density conditions over time. Figure 13a shows the temporal variation in the particle numbers under different densities, with the numbers reaching dynamic equilibrium once the motion stabilized. Figure 13b shows the changes in the collision numbers, which is a crucial factor influencing particle agglomeration. It indicates whether particles of all densities experience fluctuations in collision numbers; however, there was no clear pattern in collision numbers with increasing density. Figure 13c displays the variation in the contact numbers, which first rapidly increased and then stabilized. This suggested that particles with different densities reached similar contact numbers after the initial adjustment period. Figure 13d shows the agglomeration rate, which is a key indicator of the efficiency of particle agglomeration. The agglomeration efficiency for particles with a density of 10,000 kg·m–3 was the highest at most time points, particularly in the later stages, indicating that higher-density particles had the highest agglomeration efficiency. Analysis in Figure 13d revealed that particle density significantly affects the agglomeration rate. Particles with the highest density exhibited the highest agglomeration rates, suggesting that they were more likely to form agglomerates under turbulence. This was because the greater mass of higher-density particles enhances the adhesive forces between them postcollision, enabling them to remain agglomerated. By contrast, lower-density particles, having less inertia, may be easily separated by postcollision turbulence.
Figure 13.
Statistical results for different particle density: (a) number of particles, (b) number of collisions, (c) number of contacts, and (d) agglomeration rate.
The particle distribution and vorticity magnitude results are shown in Figure 14. At densities of 2,500 and 5,000 kg·m–3, small agglomerates formed at the edges of vortices, with no significant accumulation in regions at the front of the cylinder, resulting in a relatively uniform particle distribution. Figure 14c,d shows that, as the density increased, particles formed a large accumulation zone at the front of the turbulent cylinder because of the effects of fluid flow around the cylinder. The front of a cylinder is a high-pressure area known as the fluid stagnation zone, where the flow speed suddenly decreases. In this area, particles detached from the fluid flow owing to inertia and accumulated in front of the cylinder. Heavier particles, having greater inertia, exhibited more pronounced accumulation in this area.
Figure 14.
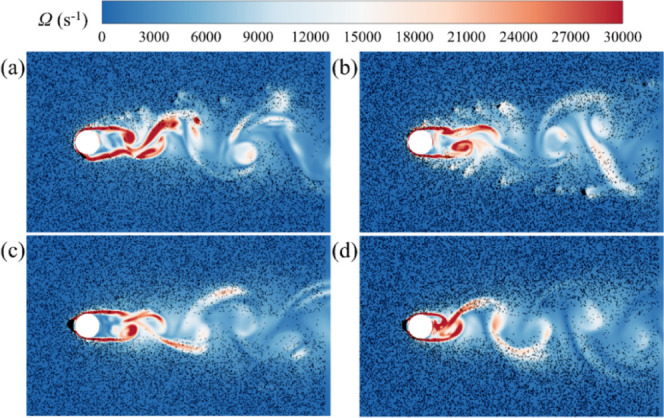
Superimposed contours of particle distributions of (a) 2,500 kg·m–3, (b) 5,000 kg·m–3, (c) 7,500 kg·m–3, and (d) 10,000 kg·m–3, with the vorticity distribution in the flow field.
Figure 15 shows the probability density distribution of particle numbers within the given vorticity ranges for particles of different sizes. The particles had a higher distribution probability in regions of lower vorticity, and the probability density distribution increased as the vorticity increased. The number distribution of lower-density particles decreased more rapidly with increasing vorticity, indicating that they were more widely dispersed by the vortex forces in the flow field. As the density increased, the decrease in the number distribution across all vorticity ranges became more gradual, suggesting that the particles were better able to resist the effects of vortices and aggregate in the flow field.
Figure 15.
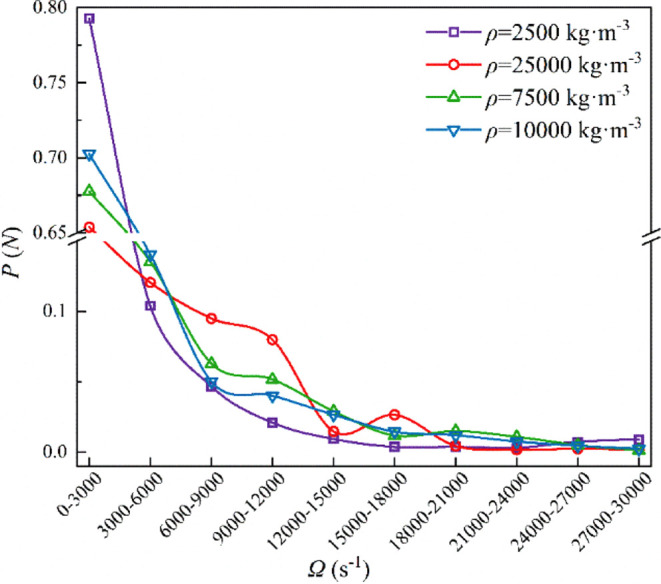
Particle number distribution corresponding to different vorticities under different particle densities.
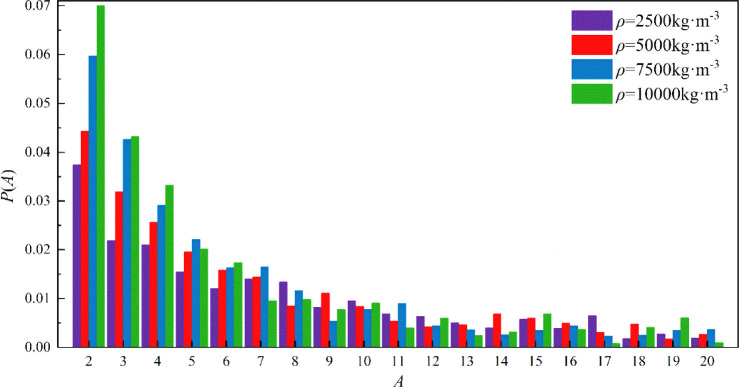
Under the influence of turbulence, the agglomeration behavior of particles is typically affected by the turbulence intensity, particle inertia, and interparticle interactions (Figure 16), which highlights the impact of particle density on agglomeration behavior under turbulence. Owing to their lower inertia, low-density particles interact more frequently with fluid vortices, making them more likely to disperse; thus, they have the highest probability of dispersing at smaller A values. However, their frequency of forming larger agglomerates is low because their lower inertia makes it difficult for them to overcome the shear forces caused by turbulence. High-density particles are more likely to form larger agglomerates under turbulent conditions because heavier particles, having greater inertial forces at the time of collision, can more readily overcome the shear effects of fluids, facilitating their mutual adhesion and the formation of larger agglomerates.
Figure 16.
Ratio of monomer particles per agglomerate to the total number of particles.
3.5. Effect of the Particle Surface Energy on Agglomeration
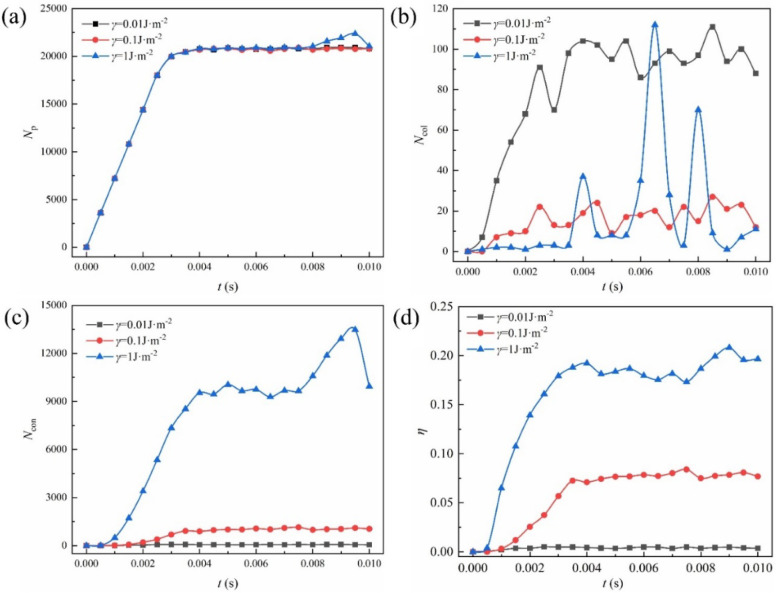
Surface energy is the amount of energy per unit area of a particle’s surface and affects interactions between particles and other particles or interfaces. This section presents the results on the effects of surface energy on the distribution and agglomeration characteristics of micrometer-sized particles under turbulence. Initially, the particle diameter was fixed at dp = 20 μm and ρp = 2,500 kg·m–3, with the surface energy increasing from 0.001 to 1 J·m–2. As shown in Figure 17, particles with higher surface energies showed a significant increase in contact frequency over time because of the increased adhesiveness between the particles as the surface energy increased, and they were more likely to form stable agglomerates owing to greater the adhesive forces.
Figure 17.
Statistical results for different particle surface energies: (a) number of particles, (b) number of collisions, (c) number of contacts, and (d) agglomeration rate.
Figure 18 shows the overlay of the particle distribution with the flow field’s vorticity contours under the different surface energies (γ = 0.01, 0.1, and 1 J·m–2). At γ = 0.01 J·m–2, the particle distribution was relatively uniform and the impact of vortex structures was not highly significant. This indicated that particles with lower surface energies experience less adhesive forces, allowing them to maintain a more independent state in flow fields and making them less likely to form large agglomerates. As the surface energy increased, coupling between the particle distribution and vortex structures in the flow field became more pronounced. Under high-surface-energy conditions, the particles were more influenced by vorticities in the flow field, leading to agglomeration around the vortex structures. This was because the strong bonds between particles with high surface energies were more resistant to the effects of fluid resistance, resulting in a larger chain of particles in the system. Based on these trends, the number and size of aggregates continued to increase as the flow field progressed.
Figure 18.
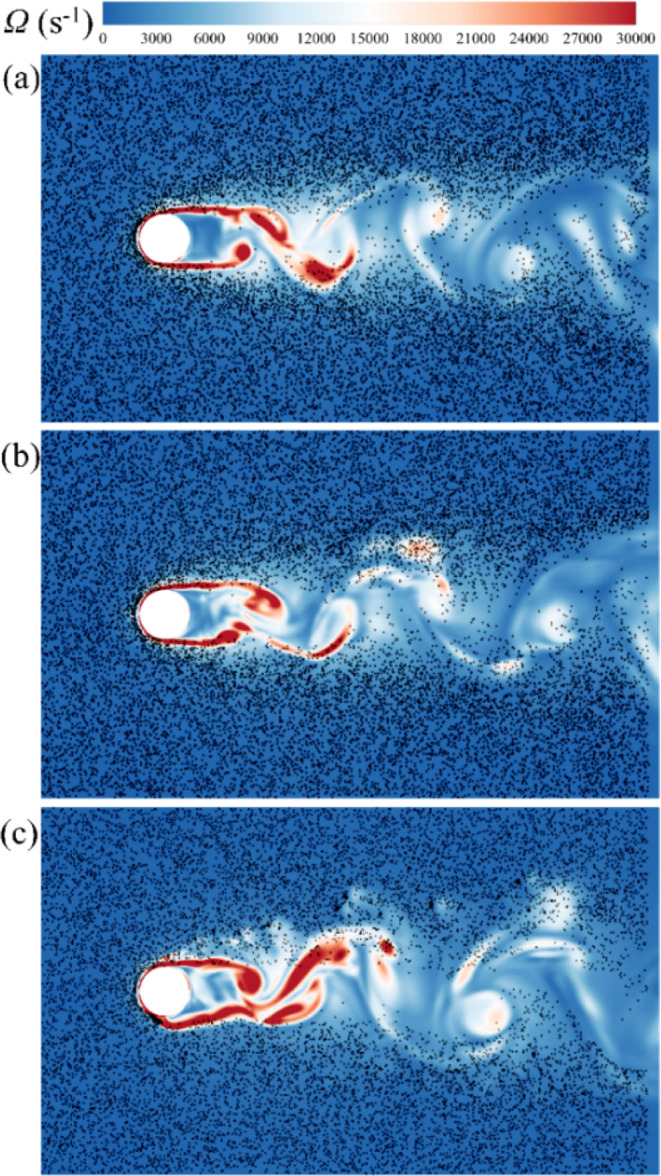
Superimposed contours of particle distributions for (a) 0.01 J·m–2, (b) 0.1 J·m–2, and (c) 1 J·m–2, with vortex distribution in the flow field.
Figure 19 shows the relationship between the particle number distribution and vorticity for different particle surface energies. At low vorticity (Ω < 3,000 s–1), the number of particles decreased sharply with increasing vorticity. This indicated that, in areas of low vorticity in a flow field, particles may exist at higher concentrations; however, they quickly disperse once they enter high-vorticity areas. Under all surface energy conditions, the number of particles significantly decreased as the vorticity increased.
Figure 19.
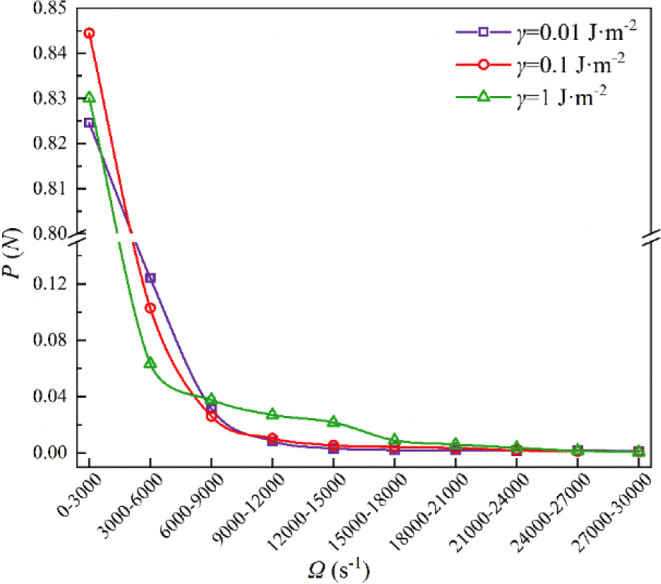
Particle number distribution corresponding to different vorticities under different particle surface energies.
Figure 20 shows the probability distributions under different surface-energy conditions. At γ = 0.01 J·m–2, at most, only binary agglomerates formed, indicating that, under low surface-energy conditions, particles are less likely to agglomerate. At γ = 0.1 J·m–2, the probability was highest at A = 2, indicating that the formation of binary agglomerates is most likely under medium surface energy. As the number of particles in the agglomerate increased, this probability gradually increased, indicating that, although particles are more likely to form binary agglomerates under medium surface energy, a certain number of larger agglomerates also form. At γ = 1 J·m–2, although the probability of forming binary agglomerates was not as high as that at 0.1 J·m–2, particles tended to form larger agglomerates.
Figure 20.
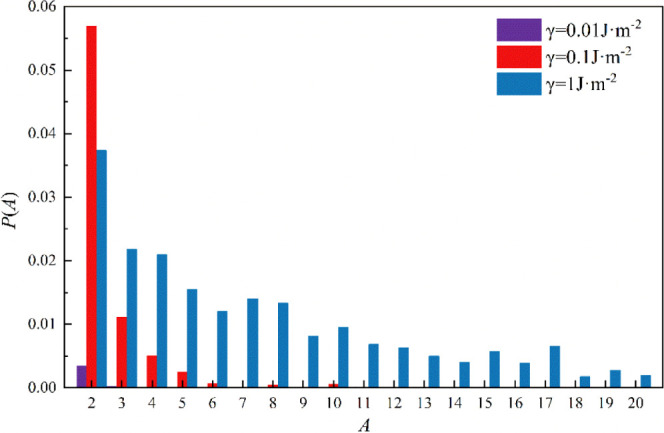
Ratio of monomer particles per agglomerate to the total number of particles.
4. Conclusions
In this study, the particle agglomeration phenomenon under the influence of cylindrical vortex wake has been carried out based on a coupled LES-DEM approach. The main objective was to investigate the influencing mechanism of the unsteady flow field on the particle transport and agglomeration behaviors thanks to the high-fidelity numerical method. The study focused on understanding how particles with different diameters (ranging from 2 to 20 μm), densities (from 2,500 to 10,000 kg/m3), and surface energies (varied between 0.01 and 1 J/m2) behaved within transitioning shear layer flow conditions. The specific findings obtained from this study are as follows:
The influence of particle diameter on agglomeration indicates that larger particles are more susceptible to agglomeration. Their greater mass enables them to withstand turbulent forces more effectively, facilitating collisions and adhesion compared to smaller particles.
Particle density is crucial in determining agglomeration behavior. Lower-density particles are less likely to form large agglomerates due to their diminished capacity to overcome shear forces in turbulent flows. In contrast, higher-density particles can more readily overcome these forces, thanks to their increased mass and inertia.
Surface energy also plays a significant role in agglomeration. Particles with higher surface energies have a greater tendency to agglomerate, as stronger adhesive forces promote particle–particle interactions.
Overall, this study highlights the importance of understanding particle material properties to predict and manipulate their behavior in various industrial and environmental contexts.
Acknowledgments
The authors are grateful for the financial support by the National Natural Science Foundation of China (grant No. 51876031, No.52176179).
The authors declare no competing financial interest.
References
- Bodenschatz E.; Malinowski S. P.; Shaw R. A.; Stratmann F. Can we understand clouds without turbulence?. Science 2010, 327 (5968), 970–971. 10.1126/science.1185138. [DOI] [PubMed] [Google Scholar]
- Zheng C.; Zheng H.; Shen J.; Gao W.; Yang Z.; Zhao Z.; Wang Y.; Zhang H.; Gao X. Evolution of condensable fine particle size distribution in simulated flue gas by external regulation for growth enhancement. Environ. Sci. Technol. 2020, 54 (7), 3840–3848. 10.1021/acs.est.9b06569. [DOI] [PubMed] [Google Scholar]
- Zhang J.; Xia Z.; Ma L.; Huang L.; Feng Y.; Yang D. Experimental study on aluminum particles combustion in a turbulent jet. Energy 2021, 214, 118889. 10.1016/j.energy.2020.118889. [DOI] [Google Scholar]
- Sobczyk A. T.; Marchewicz A.; Krupa A.; Jaworek A.; Czech T.; Śliwiński Ł.; Kluk D.; Ottawa A.; Charchalis A. Enhancement of collection efficiency for fly ash particles (PM2.5) by unipolar agglomerator in two-stage electrostatic precipitator. Separ. Purif. Technol. 2017, 187, 91–101. 10.1016/j.seppur.2017.06.039. [DOI] [Google Scholar]
- Balakin B. V.; Lo S.; Kosinski P.; Hoffmann A. C. Modelling agglomeration and deposition of gas hydrates in industrial pipelines with combined CFD-PBM technique. Chem. Eng. Sci. 2016, 153, 45–57. 10.1016/j.ces.2016.07.010. [DOI] [Google Scholar]
- Heisel S.; Holtkötter J.; Wohlgemuth K. Measurement of agglomeration during crystallization: is the differentiation of aggregates and agglomerates via ultrasonic irradiation possible?. Chem. Eng. Sci. 2019, 210, 115214. 10.1016/j.ces.2019.115214. [DOI] [Google Scholar]
- Guo S.; Hu M.; Zamora M. L.; Peng J.; Shang D.; Zheng J.; Du Z.; Wu Z.; Shao M.; Zeng L.; Molina M. J.; et al. Elucidating severe urban haze formation in China. Proc. Natl. Acad. Sci. U.S. A. 2014, 111 (49), 17373–17378. 10.1073/pnas.1419604111. [DOI] [PMC free article] [PubMed] [Google Scholar]
- Anderson J. O.; Thundiyil J. G.; Stolbach A. Clearing the air: a review of the effects of particulate matter air pollution on human health. J. Med. Toxicol. 2012, 8, 166–175. 10.1007/s13181-011-0203-1. [DOI] [PMC free article] [PubMed] [Google Scholar]
- Brook R. D.; Rajagopalan S.; Pope C. A. III; Brook J. R.; Bhatnagar A.; Diez-Roux A. V.; Holguin F.; Hong Y.; Luepker R. V.; Mittleman M. A.; et al. Particulate matter air pollution and cardiovascular disease: an update to the scientific statement from the American Heart Association. Circulation 2010, 121 (21), 2331–2378. 10.1161/CIR.0b013e3181dbece1. [DOI] [PubMed] [Google Scholar]
- Watts N.; Adger W. N.; Agnolucci P.; Blackstock J.; Byass P.; Cai W.; Chaytor S.; Colbourn T.; Collins M.; Cooper A. Health and climate change: policy responses to protect public health. Lancet 2015, 386 (10006), 1861–1914. 10.1016/S0140-6736(15)60854-6. [DOI] [PubMed] [Google Scholar]
- Wang J.-L.; Zhang Y. H.; Shai M.; Liu X.-L.; Zeng L.-M.; Cheng C.-L.; Xu X.-F. Quantitative relationship between visibility and mass concentration of PM2.5 in Beijing. J. Environ. Sci. 2006, 18, 475–481. [PubMed] [Google Scholar]
- Wu X.; Tian H.; Zhou S.; Chen L.; Xu B. Impact of global change on transmission of human infectious diseases. Sci. China: Earth Sci. 2014, 57 (2), 189–203. 10.1007/s11430-013-4635-0. [DOI] [PMC free article] [PubMed] [Google Scholar]
- Shen X. J.; Sun J. Y.; Zhang X. Y.; Zhang Y. M.; Zhang L.; Che H. C.; Ma Q. L.; Yu X. M.; Yue Y.; Zhang Y. W. Characterization of submicron aerosols and effect on visibility during a severe haze-fog episode in Yangtze River Delta, China. Atmos. Environ. 2015, 120, 307–316. 10.1016/j.atmosenv.2015.09.011. [DOI] [Google Scholar]
- Jaworek A.; Marchewicz A.; Sobczyk A. T.; Krupa A.; Czech T. Two-stage electrostatic precipitators for the reduction of PM2.5 particle emission. Prog. Energy Combust. Sci. 2018, 67, 206–233. 10.1016/j.pecs.2018.03.003. [DOI] [Google Scholar]
- De Sarabia E. R.-F.; Elvira-Segura L.; González-Gómez I.; Rodríguez-Maroto J. J.; Muñoz-Bueno R.; Dorronsoro-Areal J. L. Investigation of the influence of humidity on the ultrasonic agglomeration of submicron particles in diesel exhausts. Ultrasonics 2003, 41, 277–281. 10.1016/S0041-624X(03)00137-4. [DOI] [PubMed] [Google Scholar]
- Wu T.; Chen S.; Chen P.; Li S. Clustering and collision of Brownian particles in homogeneous and isotropic turbulence. J. Aerosol Sci. 2023, 169, 106134. 10.1016/j.jaerosci.2022.106134. [DOI] [Google Scholar]
- Zhang Y.; Chen X.; Wei D.; Dong K.; Wang B. Investigation on fine particle agglomeration and separation promoted by different bluff bodies. J. Cleaner Prod. 2022, 374, 134039. 10.1016/j.jclepro.2022.134039. [DOI] [Google Scholar]
- Liu Y.; Hu B.; Zhou L.; Jiang Y.; Yang L. Improving the removal of fine particles with an electrostatic precipitator by chemical agglomeration. Energy Fuels 2016, 30 (10), 8441–8447. 10.1021/acs.energyfuels.6b01791. [DOI] [Google Scholar]
- Tammaro M.; Di Natale F.; Salluzzo A.; Lancia A. Heterogeneous condensation of submicron particles in a growth tube. Chem. Eng. Sci. 2012, 74, 124–134. 10.1016/j.ces.2012.02.023. [DOI] [Google Scholar]
- Saw E. W.; Shaw R. A.; Ayyalasomayajula S.; Chuang P. Y.; Gylfason Á. Inertial clustering of particles in high-Reynolds-number turbulence. Phys. Rev. Lett. 2008, 100 (21), 214501. 10.1103/PhysRevLett.100.214501. [DOI] [PubMed] [Google Scholar]
- Lu J.; Nordsiek H.; Saw E. W.; Shaw R. A. Clustering of charged inertial particles in turbulence. Phys. Rev. Lett. 2010, 104 (18), 184505. 10.1103/PhysRevLett.104.184505. [DOI] [PubMed] [Google Scholar]
- Bec J.; Homann H.; Ray S. S. Gravity-driven enhancement of heavy particle clustering in turbulent flow. Phys. Rev. Lett. 2014, 112, 184501. 10.1103/PhysRevLett.112.184501. [DOI] [PubMed] [Google Scholar]
- Gustavsson K.; Vajedi S.; Mehlig B. Clustering of particles falling in a turbulent flow. Phys. Rev. Lett. 2014, 112, 214501. 10.1103/PhysRevLett.112.214501. [DOI] [PubMed] [Google Scholar]
- Balachandar S.; Eaton J. K. Turbulent dispersed multiphase flow. Annu. Rev. Fluid. Mech. 2010, 42 (1), 111–133. 10.1146/annurev.fluid.010908.165243. [DOI] [Google Scholar]
- Hollander E. D.; Derksen J. J.; Bruinsma O. S. L.; van den Akker H. E. A.; van Rosmalen G. M. A numerical study on the coupling of hydrodynamics and orthokinetic agglomeration. Chem. Eng. Sci. 2001, 56 (7), 2531–2541. 10.1016/S0009-2509(00)00435-8. [DOI] [Google Scholar]
- Mortimer L.; Fairweather M.. Effect of particle diameter on agglomeration dynamics in multiphase turbulent channel flows. In Proceedings of VI International Conference on Particle-Based Methods. Fundamentals and Applications; International Centre for Numerical Methods in Engineering (CIMNE): 2019, 656-667. [Google Scholar]
- Haddadi H.; Shojaei-Zadeh S.; Morris J. F. Lattice-Boltzmann simulation of inertial particle-laden flow around an obstacle. Phys. Rev. Fluids 2016, 1, 024201. 10.1103/PhysRevFluids.1.024201. [DOI] [Google Scholar]
- Haddadi H.; Shojaei-Zadeh S.; Connington K.; Morris J. F. Suspension flow past a cylinder: particle interactions with recirculating wakes. J. Fluid Mech. 2014, 760, R2. 10.1017/jfm.2014.613. [DOI] [Google Scholar]
- Schuster D.; Climent E.; Rüde U. Particle laden flows around a circular cylinder from the hydrodynamic to granular regime. Int. J. Multiphase Flow 2023, 165, 104487. 10.1016/j.ijmultiphaseflow.2023.104487. [DOI] [Google Scholar]
- Sun Z.; Yang L.; Wu H.; Wu X. Agglomeration and removal characteristics of fine particles from coal combustion under different turbulent flow fields. J. Environ. Sci. 2020, 89, 113–124. 10.1016/j.jes.2019.10.004. [DOI] [PubMed] [Google Scholar]
- Xu J.; Shen H.; Wang H. An industry-scale modeling for the turbulence agglomeration of fine particles. Advances in mechanical engineering 2015, 7, 11. 10.1177/1687814015617670. [DOI] [Google Scholar]
- Li Q.; Yuan X.; Zhang M.; Xu W.; Huo L.; Mu Q. A modified agglomeration kernel model used for particle agglomeration. Adv. Powder Technol. 2022, 33 (1), 103349. 10.1016/j.apt.2021.11.001. [DOI] [Google Scholar]
- Liu H.; Yang F.; Tan H.; Li Z.; Feng P.; Du Y. Experimental and numerical investigation on the structure characteristics of vortex generators affecting particle agglomeration. Powder Technol. 2020, 362, 805–816. 10.1016/j.powtec.2019.12.001. [DOI] [Google Scholar]
- Xia Y.; Xiong H.; Yu Z.; Zhu C. Effects of the collision model in interface-resolved simulations of particle-laden turbulent channel flows. Phys. Fluids 2020, 32, 103303. 10.1063/5.0020995. [DOI] [Google Scholar]
- Hinze J. O.Turbulence McGraw; McGraw-Hill Publishing Co.: New York, 1975. [Google Scholar]
- Smagorinsky J. General Circulation Experiments with the Primitive Equations. Basic Experiment. Mon. Wea. Rev. 1963, 91, 99–164. . [DOI] [Google Scholar]
- Johnson K. L.; Kendall K.; Roberts A. A. K. Surface Energy and the Contact of Elastic Solids. Proc. R. Soc. London, Ser. A 1971, 324, 301–313. 10.1098/rspa.1971.0141. [DOI] [Google Scholar]
- Issa R. I. Solution of the implicitly discretised fluid flow equations by operator-splitting. J. Comput. Phys. 1986, 62, 40–65. 10.1016/0021-9991(86)90099-9. [DOI] [Google Scholar]
- Ning Z.; Ghadiri M. Distinct element analysis of attrition of granular solids under shear deformation. Chem. Eng. Sci. 2006, 61, 5991–6001. 10.1016/j.ces.2006.03.056. [DOI] [Google Scholar]
- Pasquetti R.; Bwemba R.; Cousin L. A pseudo-penalization method for high Reynolds number unsteady flows. Appl. Numer. Math. 2008, 58 (7), 946–954. 10.1016/j.apnum.2007.04.004. [DOI] [Google Scholar]
- Dong M.; Li X.; Mei Y.; Li S. Experimental and theoretical analyses on the effect of physical properties and humidity of fly ash impacting on a flat surface. J. Aerosol Sci. 2018, 117, 85–99. 10.1016/j.jaerosci.2017.12.012. [DOI] [Google Scholar]
- Zhou J.; Qiu X.; Li J.; Liu Y. Vortex evolution of flow past the near-wall circular cylinder immersed in a flat-plate turbulent boundary layer. Ocean Eng. 2022, 260, 112011. 10.1016/j.oceaneng.2022.112011. [DOI] [Google Scholar]
- Baule A.; Mari R.; Bo L.; Portal L.; Makse H. Mean-field theory of random close packings of axisymmetric particles. Nat. Commun. 2013, 4, 2194. 10.1038/ncomms3194. [DOI] [PubMed] [Google Scholar]
- Liu W.; Li S.; Baule A.; Makse H. A. Adhesive loose packings of small dry particles. Soft Matter 2015, 11 (32), 6492–6498. 10.1039/C5SM01322J. [DOI] [PubMed] [Google Scholar]


