Abstract
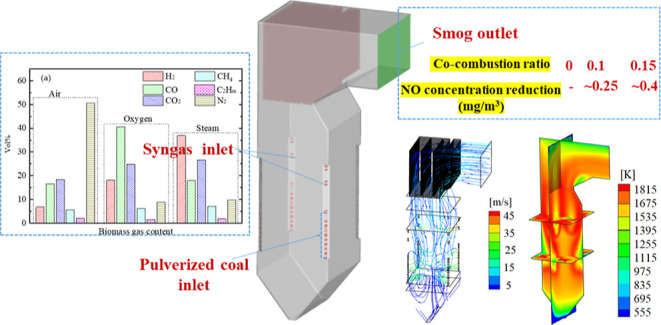
To comprehensively explore syngas cocombustion technology, gasification experiments in a bench-scale circulating fluidized bed (CFB) and three-dimensional (3D) numerical simulations of a coal-fired boiler furnace have been conducted. In the amplification experiment of biomass gasification, sawdust has been gasified using air, oxygen-enriched air, and steam. The highest heating value of the syngas products reaches 12.3 MJ/m3 when the equivalence and steam/biomass ratios are adjusted in the ranges of 0.21–0.31 and 0.1–0.5, respectively. Subsequently, 3D numerical simulation has been performed with several kinds of syngas product to analyze the cocombustion characteristics of the boiler furnace. Results demonstrate that the velocity field of the boiler furnace exhibits a well-formed tangential velocity circle and full degree of streamlines. Syngas cocombustion in the coal-fired furnace reduces the temperature extremum in the combustion zone. Radiant heat flux accounts for >88% of the total heat flux in the furnace. The outlet NO concentration in the case of syngas cocombustion is less than that of pure coal combustion, and it is reduced approximately 25 and 40 mg/m3 at cocombustion ratios of 0.1 and 0.15, respectively.
1. Introduction
Coal-fired plants continue to play an important role in the Chinese electricity supply system. However, the resulting pollutant emissions have caused many serious environmental problems, such as risks to biodiversity and acidification of the soil and surface water.1 In the past decade, with the development of sustainable energy generation technology, methods of cocombustion with biomass in coal-fired units have received increasing attention among researchers.2,3 Co-combustion of biomass and coal has proven to be an effective technology to make the best use of biomass as a renewable energy resource on a large scale.4 Such important clean coal methods can bring enormous environmental and economic benefits.5 Syngas cocombustion technology is an indirect application of raw biomass. The syngas product is first prepared through the gasification process, then injected into the coal-fired boiler furnace, and finally combusted (oxidized) to release heat. Therefore, the gasification efficiency of the syngas product and comprehensive cocombustion characteristics are two key research directions for the development of syngas cocombustion technology for coal-fired boilers.6
Biomass gasification converts biomass hydrocarbons into combustible gases with the aid of assistive gasification agents.7 Wojnicka et al. have conducted steam gasification experiments using sawdust, straw, raw wood, and thistle as feedstocks, respectively,8 reporting that the compositions of different syngas products are basically the same at a gasification temperature of >750 °C. However, the low heating value (LHV) of the syngas product decreases as the gasification temperature increases from 650 to 780 °C. Many studies have shown that the type of gasification agent, equivalent ratio (ER), and steam/biomass ratio (S/B) are important factors in biomass gasification.9−11 ER represents the ratio of the amount of consumed air (or oxygen) to the amount of theoretical air (or oxygen) required for complete combustion per unit of biomass, while S/B represents the consumption ratio of steam to biomass feedstock during gasification. Gasification experiments were carried out with pine in a bubble bed with air as the gasification agent.12 Results showed that when ER increases from 0.2 to 0.45 at a gasification temperature of 800 °C, the H2, CO, CH4, and C2H2 contents of the syngas product are reduced, whereas the CO2 and N2 contents are increased. As a result, LHV is synchronously reduced. In steam gasification experiments with pine powder in a fluidized bed, the H2 and CO2 contents are increased from 40% to 60% and from 10% to 30%, respectively, when S/B is increased from 0.5 to 2.5 at a fixed furnace temperature of 750 °C, and LHV of the syngas product is reduced from 14 to 9 MJ/m3.13 Due to syngas exhibiting a relatively high energy conversion efficiency for further applications, one of its important applications is syngas cocombustion in coal-fired boilers. Syngas cocombustion with coal can reportedly enhance the stability and thermal efficiency of the original boiler furnace.14
Nevertheless, large-scale experimental tests for syngas cocombustion technology in practical boilers are time-consuming and expensive. Therefore, computational fluid dynamics (CFD) is an extensible method for in-depth study that has been successfully applied in the investigation of practical coal-fired boilers. Krzywanski et al. investigated multifuel coal and syngas combustion in a large-scale OFz-425 circulating fluidized bed (CFB) boiler installed in Poland15,16 and successfully validated the experimental results. It was found that the maximum relative error between the measured and calculated data was under ±10%. Drosatos et al. utilized the NPC model to carry out numerical investigations of the effect of biomass on the combustion stability of low-load boilers.17 Moreover, the double-mixed fractional PDF model had been employed to solve the problem of inaccurate calculation of unburned coke in fly ash multistage fuel combustion. Dong et al. utilized the PDF model to conduct a numerical investigation of the cocombustion of biomass gas and coal in a 600 MW boiler.18 The above research results are verified with the corresponding experimental conclusions.
As for numerical investigations of cocombustion, relevant studies have covered aspects of gas–solid convection, temperature deviations, NO emissions, boiler modifications, and so on.19 Li et al. carried out a numerical investigation of ultrasupercritical corner tangential coal-fired boilers using CFD,20 while Huang studied subcritical boilers.21 Liu et al. conducted a numerical study of the cocombustion of syngas and coal in a 130 t/h biomass CFB boiler.22 These researchers found 14.3% and 24.6% reductions in NO emissions at cocombustion ratios (ξ) of 20% and 30%, respectively. The numerical results of Lvarez et al.100 had demonstrated that syngas cocombustion can improve the burnout rate of coal-fired boilers.24 Moreover, NO emissions can be reduced and the whole temperature of the furnace is lowered in the cocombustion case. By contrast, the numerical simulations of coal and syngas cocombustion performed by Krzywanski et al. indicates that syngas supply led to increased local temperature and CO2 concentrations16 and even to frequent emergency stops of the CFB boiler. Lupiáñez et al. found that SO2 emissions were influenced by the chlorine content in corn stover.23 Therefore, the use of cocombustion technology is challenged by the feasibility of CFB boilers. If the gas supply system is well organized and the technically justified load is minimal, the use of syngas can be beneficial for the original CFB boiler. However, cocombustion with syngas might result in beyond acceptable parameters due to changes in the velocity and temperature profiles of the boiler furnace. The concomitantly negative effects include the destruction of or reduction in the operating life of any component.24
The aforementioned investigations reveal that data on the cocombustion characteristics of larger-scale CFB boilers remain insufficient. Since the type of fuel in the boiler has been changed, removing fuel interactions in a fluidized bed furnace is difficult. The key elements that influence the cocombustion characteristics and pollutant emissions in a 600 MW coal-fired boiler furnace need to be clarified. Moreover, the exploration of cocombustion technology applied in large-scale boilers is still limited, especially when the cocombustion ratio ξ is greater than 0.02. In the present study, the syngas product is first prepared through gasification of sawdust in a bench-scale gasification producer using three kinds of gasification agents, i.e., air, oxygen-enriched air, and steam. The effects of ER and S/B on the composition and LHV of the syngas product have been quantified. Subsequently, a comprehensive three-dimensional (3D) CFD model has been developed for syngas cocombustion in a 600 MW coal-fired boiler furnace. The complex phenomena that occur in the combustion chamber of the CFB boiler have been analyzed. The effect of cocombustion ratio (ξ = 0.1 and ξ = 0.15) on the combustion characteristics, gas velocity, temperature, and NO distribution in the combustion chamber has been carefully discussed. The aim of the present work is to supplement the theoretical basis for the practical application of syngas cocombustion technology.
2. Model and Method
2.1. Experiment of Biomass Gasification
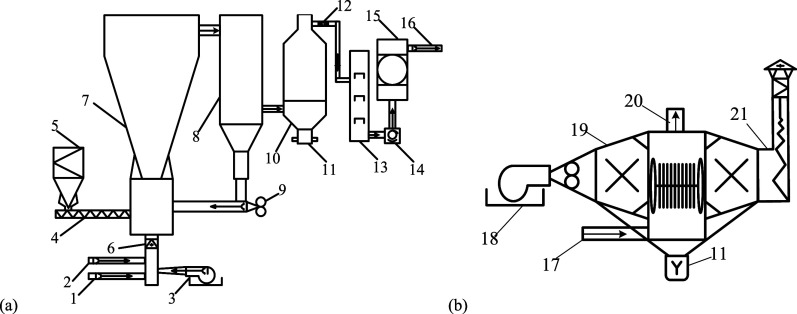
As shown in Figure 1a, the gasification producer is a bench-scale CFB.25 The main experimental device includes the steam inlet channel, oxygen inlet channel, air blower, gasification furnace, catalytic reformer, tar sampling port, gas sampling port, etc. To adapt the insufficient blast in the case of low load or oxygen enrichment, the lower part of the CFB gasification producer is designed as an assembly unit with variable sections. The total height of the assembly unit is approximately 10 m, with bottom and top diameters of 0.33 and 0.55 m, respectively. The feed port of the gasifier is approximately 3 m above the CFB bottom. A return feeder is installed at the bottom of cyclone separator, which sent the separated particles back into the gasifier via the cyclone separator. The outflowing syngas from the cyclone separator enters the catalytic reformer for further reaction. Then, the syngas stream flows into the spray washing tower to remove the tar and dust. Finally, the syngas product is transported to the gas tank by the Roots blower.
Figure 1.
Schematic of the bench-scale circulating fluidized bed (CFB) gasification producer (a) and the catalytic reforming reactor (b). (1: Steam inlet channel, 2: oxygen inlet channel, 3: air blower, 4: screw feeder, 5: biomass bin, 6: main airflow intake, 7: gasifier, 8: cyclone separator, 9: return feeder, 10: catalytic reformer, 11: tar sampling port, 12: gas sampling port, 13: spray tower, 14: Roots blower, 15: syngas tank, 16: syngas outlet, 17: crude gas inlet, 18: burner, 19: reformer, 20: connect the spray tower, 21: chimney.)
Figure 1b presents a schematic diagram of the reforming reactor, which is needed to further adjust the composition of the syngas product. A burner provides heat for the reforming reactor. Due to the upward crude syngas flow, the ash outlet is set at the bottom of the reformer, while the spray tower is linked at the top. The catalytic bed is composed of 50 stainless steel tubes. Each tube is 1.1 m in length, with an inner diameter of 100 mm and thickness of 3 mm. Each tube is embedded with 10 pieces of NiO–MgO solid monolithic catalysts.
Air, oxygen-enriched air, and steam are chosen as the gasification agents for syngas preparation. Air is supplied by a centrifugal blower. The oxygen-enriched air is supplied by a pressure swing adsorption oxygen generator with an oxygen-enriched concentration of 93%. Steam is supplied by a saturated steam boiler. The pressure of the steam at the boiler outlet is set as 0.7 MPa and the temperature is 180 °C. The flow rate of the various gasification agents is measured by an orifice plate flowmeter installed on the intake pipe. Some biomass ash is recycled as the bed material in the gasifier, while the rest is discharged intermittently for the sake of normal operation of the CFB gasification producer.
Seven temperature measuring points and five pressure measuring points have been installed in the CFB sidewall to monitor the variations in temperature and pressure during the gasification process. The gasification temperature is maintained in the range of 700–900 °C, and the manometer pressure in the gasifier is maintained between −500 and +500 Pa. Temperature and pressure measuring points are also inlayed at the outlet of the reforming reactor. K-type thermocouples (model WRN-120) with a testing range of 0–1200 °C have been inset in the temperature measuring points. The micronegative pressure operation inside the gasifier is maintained throughout the gasification process. Due to the high cost of pure oxygen, oxygen-enriched air is selected for the alternative gasification agent. The CFB gasification producer is equipped with pure oxygen and external steam sources to meet the needs of different oxygen enrichment concentrations and feeding flow rates. ER and S/B are achieved by adjusting the flow rates of these two agents. During the experimental process, the feed rate of the feedstock (i.e., sawdust) is set at a constant value. A gas chromatograph is selected to analyze the H2, CH4, CO2, O2, N2, C2H2, C2H4, and C2H6 contents in the syngas product samples.26
The biomass feedstock is abundant sawdust from the nearby lumber mill that is dehydrated by the sun prior to use. The comprehensive characteristics of dry sawdust have been listed in Table 1, where the O content is obtained by differential subtraction. The high heat value is 17.6 MJ/kg for dry sawdust. The apparent and bulk densities are 430 and 218 kg/m3, respectively.
Table 1. Industrial Analysis and Elemental Analysis of Sawdust (Dry Base).
| ultimate
analysis (wt %) |
proximate analysis (wt %) |
HHV (MJ/kg) | ||||||
|---|---|---|---|---|---|---|---|---|
| C | H | O | N | S | volatile | fixed carbon | ash | |
| 45.9 | 5.4 | 47.8 | 0.1 | 0 | 82.1 | 17.1 | 0.8 | 17.6 |
2.2. Numerical Method
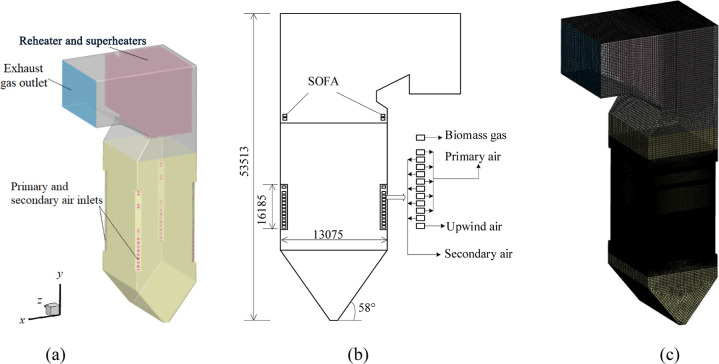
The object of the present numerical study is a 600 MW four-corner tangentially fired boiler furnace with a 90% rated load. Hence, the operating load of the boiler in this study is equal to 544 MW. The corresponding geometry is displayed in Figure 2a,b. The primary and secondary air nozzles are alternately arranged at the four corners of the boiler furnace. The boiler furnace is configured with a π-shaped compact enclosed layout with a full steel frame suspension structure. The utilized tangential combustion method has the advantages of good flame distribution, high combustion efficiency, simple operation, and flexibility for many types of coal. The boiler furnace is equipped with heat exchange devices, such as a wall-type reheater, screen-type reheater, final-stage superheater, economizer, and air preheater. The dimensions of the furnace are approximately 53.5 m in height and 13.1 m in width.
Figure 2.
Diagrams of the four-corner tangential furnace (a), burner arrangement (b), and hexahedral mapped mesh (c).
The operating conditions of the fuel inlets and
air nozzles are
listed in Table 2,
wherein mc refers to the mass flow rate
of pulverized coal;  and
and  are the inlet velocities of the primary
and secondary air streams, respectively; Tpri and Tsec are the inlet temperatures
of the primary and secondary air streams, respectively;
  is the inlet velocity of sawdust syngas;
and Tgas is the temperature of sawdust
syngas. The elemental and industrial analysis results of the chosen
coal are listed in Table 3. The heating value of coal is 23 MJ/kg. The average particle
diameter, dispersion coefficient, and inlet temperature of pulverized
coal are 8.60 × 10⁻⁵ m, 1.4, and 350 K, respectively.
Table 2. Operating Conditions of Fuel Inlets and Air Nozzles for Numerical Study.
| parameter | coal | gasified by air |
gasified by oxygen-enriched air |
gasified by steam |
|||
|---|---|---|---|---|---|---|---|
| ξ = 0.1 | ξ = 0.15 | ξ = 0.1 | ξ = 0.15 | ξ = 0.1 | ξ = 0.15 | ||
| mc (kg/s) | 22.68 | 20.41 | 19.28 | 20.41 | 19.28 | 20.41 | 19.28 |
 (m/s) (m/s) |
21 | 21 | |||||
| Tpri (K) | 596 | 596 | |||||
 (m/s) (m/s) |
45 | 40 | 40 | 40 | |||
| Tsec (K) | 600 | 600 | |||||
 (m/s) (m/s) |
19.2 | 28.84 | 11.52 | 17.28 | 11.87 | 17.81 | |
| Tgas (K) | 596 | ||||||
Table 3. Elemental and Industrial Analysis of Coal.
| industrial analysis (wt %) |
heating value (MJ/kg) | elemental analysis (wt %) |
|||||||
|---|---|---|---|---|---|---|---|---|---|
| M | A | V | FC | C | H | N | S | O | |
| 1.81 | 27.42 | 46.67 | 24.1 | 23.014 | 57.07 | 2.39 | 0.92 | 0.88 | 9.51 |
The mathematical model for cocombustion in the boiler furnace can be described by the equation set comprising mass, momentum, and energy conservation equations. Suitable models have been selected to ensure the accuracy of the numerical simulations, including the RNG k–ε turbulent model, P-1 radiation model, double-mixed fractional PDF model, and discrete phase model. Devolatilization was analyzed using the dual competing rate model. The adopted NOx model described the thermal and fuel NOx pathways.26,27 In the modeling process, several appropriate simplifications were made. For example, the water-cooled wall and screen-type heat exchanger on the furnace roof were assumed to be thermostatic, and the thicknesses of all sidewalls were assumed to be zero. The Boussinesq approximation was utilized in the present simulation. Detailed expressions of the governing equations can be found in a previous study.26
2.3. Numerical Verification
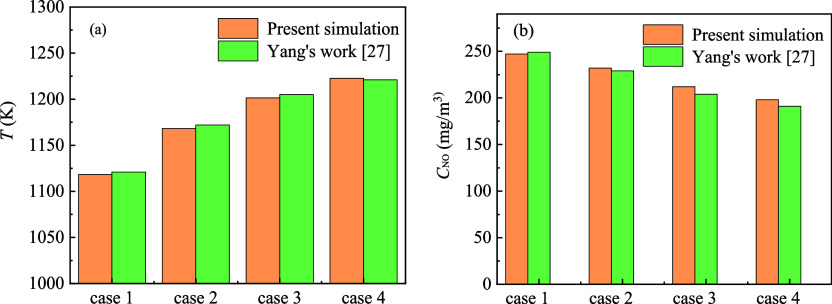
Fluent software equipped with the SIMPLE algorithm for the noncoupled pressure–velocity solution was utilized. To validate the applicability and accuracy of the numerical method, four cocombustion cases in a four-corner tangentially fired boiler furnace had been simulated. The numerical results showed that the temperature and NO concentration (CNO) at the furnace outlet differed from Yang’s numerical results by <5%,27 as displayed in Figure 3. Case 1 refers to a boiler load of 544 MW without syngas, while Cases 2, 3, and 4 refer to boiler loads of 544, 480, and 380 MW, respectively, with ξ = 0.02. Due to the simplifications, the simulation results deviated from the practical operating parameters to some extent. However, the deviation of the present simulation is within a reasonable range, indicating that the numerical modeling adopted in the present study has convincing accuracy and rationality.
Figure 3.
Comparison of temperature T (a) and NO concentration CNO (b) at the outlet of the boiler furnace between the present simulation and Dr. Yang’s work.27
As shown in the mesh diagram displayed in Figure 2c, a hexahedral mapped mesh has been utilized to converge the calculation speed and numerical accuracy. The boiler furnace is divided into several different zones, including the cold ash hopper, lower burner, burner, upper burner, and heat exchanger zones. High-quality hexahedral meshes in the burner zone are appropriately refined to reduce pseudodiffusion. The grid verification has been performed by adopting the module of pure coal combustion in the 600 MW furnace. As listed in Table 4, the calculated temperature (T) and CNO at the furnace outlet are compared for three kinds of mesh. The relative temperature error E(T) and relative concentration error E(CNO) at different meshes are within 2%. The selected number of grids is 1,767,250, which is considered to meet the requirements of calculation time costs and accuracy in engineering applications.
Table 4. Comparison of Outlet T and Concentration CNO of the Boiler Furnace with Different Grids.
| items | values | ||
|---|---|---|---|
| grid number | 1,600,525 | 1,767,250 | 1,893,975 |
| T | 1120.8 | 1118.5 | 1117.6 |
| E(T) | 0.21% | 0 | 0.08% |
| CNO | 241.55 | 245.91 | 248.01 |
| E(CNO) | 1.77% | 0 | 0.85% |
3. Results and Discussion
3.1. Component Analysis of Experimentally Prepared Syngas
In the gasification experiment, air, oxygen-enriched air, and steam serve as the gasification agents. To balance the cost and gasification performance, the adopted operation conditions are set at OC = 90%, ER = 0.25, and S/B = 0.5. LHV is indicated by Qv, which is expressed as follows
| 1 |
where CO, H2, CH4, and C2Hm represent the volume fraction of each syngas component.
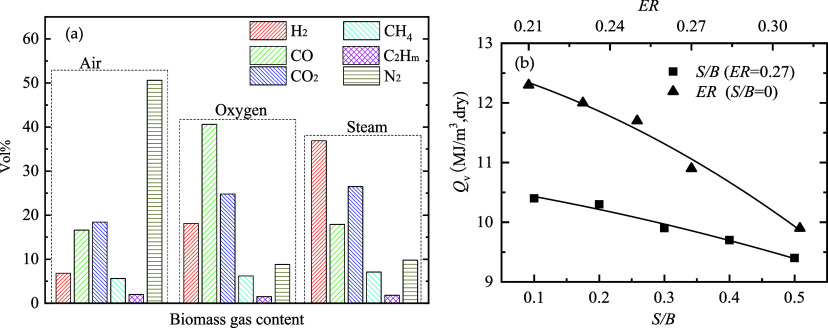
As shown in Figure 4a, the combustible syngas contents are lower when air served as the gasification agent than when oxygen-enriched air and steam are used due to the dilution effect of the inert gas, N2. The dilution effect in the syngas is significant because the volume fraction of N2 is as high as approximately 50%. When oxygen-enriched air serves as the gasification agent, the H2 and CO contents in the syngas significantly increase. Especially, the highest volume fraction of CO could reach up to 40%, which is attributable to the high reduction temperature in the gasifier and negligible dilution effect of N2. Moreover, the addition of oxygen could effectively improve the catalytic reaction efficiency of the catalytic reformer. Hence, the conversion rate of tar increases, which resulted in the generation of less tar product. When steam serves as the gasification agent, the highest H2 content (38%) could be obtained in the syngas product. Due to operation of the catalytic reformer, the steam reforming process can not only significantly improve the H2/CO ratio for crude syngas but also improve the CH4 conversion rate. Additionally, it should be noted that operation of the catalytic reformer requires an external heating process, resulting in higher operation costs.
Figure 4.
Diagram of syngas component (a) for different gasification agents at ER = 0.25 and S/B = 0.5 and low heating value (b) of product syngas varies with ER and S/B values at OC = 90%.
The LHV values of the syngas product gasified by air, oxygen-enriched air, and steam are 6.16, 10.29, and 9.99 MJ/m3, respectively, at OC = 90%, ER = 0.25 and S/B = 0.5. Obviously, the syngas with the highest LHV is produced by the oxygen-enriched gasification agent. Even though steam yields a syngas product with a relatively lower LHV, its composition, especially its H2 content, could be effectively regulated by adjusting the steam flow rate.8,13
Figure 4b depicts the variation trends in LHV with S/B at ER = 0.25. Notably, maximum gasification efficiency is reached at ER = 0.25. When S/B rose from 0.1 to 0.5, the LHV value of the syngas monotonously decreases from 10.5 to 9.4 MJ/m3. Although reactions between water vapor with C and CH4 are conducive to further formation of combustible content and increasing LHV, the water–syngas conversion reaction is the main reaction among all reactions involving steam,28−30 causing a drop in LHV owing to the higher heating value of CO compared to H2. At the same time, the pyrolysis reaction is weakened when the gasifier temperature decreases at higher S/B, decreasing the deposition rate and the LHV of the syngas product.
3.2. Cocombustion Characteristics of Coal-Fired Boiler Furnace
Herein, ξ is defined as the ratio of the theoretical combustion heat of syngas to that of pulverized coal. For example, ξ = 0 indicates that no syngas is injected into the boiler furnace. When ξ = 0.1, the combustion heat of the injected syngas accounts for 10% of all heat in the furnace, and the combustion heat of the pulverized coal accounts for 90%. Although ξ varied, the total combustion heat value of syngas and pulverized coal entering the boiler furnace remains constant. Values of ξ = 0.1 and ξ = 0.15 were specified for the numerical study of syngas cocombustion in the four-corner tangential 600 MW coal-fired boiler furnace. The sawdust syngas for the numerical study was produced by the gasification experiments with air, oxygen-enriched air, and steam as the gasification agents at ER = 0.25, OC = 90%, and S/B = 0.5.
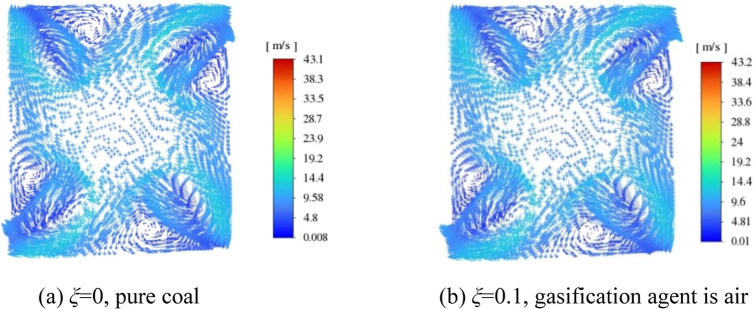
Due to the unchanged inlet stream velocities from the primary and second nozzles, the obtained velocity vectors or velocity distribution of the boiler furnace are independent of ξ values and the gasification agents. Figure 5 presents the diagram of the cross-sectional velocity vectors at the Y-coordinate of 13.2 m, where the first-layer primary air nozzle is positioned. The vector pattern at ξ = 0 is almost the same as that at ξ = 0.1, except for a small difference in velocity magnitude. The injected primary air and syngas streams created a well-formed tangential velocity circle. The results indicates that the velocity field distribution in the furnace chamber is reasonable and could meet the requirements of high combustion efficiency. The velocity pattern in the cross section of the 600 MW furnace was similar to that of the 300 MW furnace.26
Figure 5.
Diagrams of the cross-sectional velocity vector at first-layer primary air nozzles at the furnace of Y = 13.2 m.
As shown in Figure 6a, the overall velocity distributions are axisymmetric at the cross sections and longitudinal sections of the furnace; however, the velocity magnitude along the Y-coordinate of the boiler furnace is not uniform. The airflow velocity is relatively low at the furnace bottom compared to that in other parts of the furnace. In the main combustion zone, the velocity increases due to the effects of the primary and secondary air streams and fuel combustion. The highest velocity reaches approximately 48 m/s in the combustion zone. In the top regions of the boiler furnace, the airflow decreases to approximately 20 m/s due to obstruction of the heat exchangers and horizontal flue. According to the distribution of streamlines depicted in Figure 6b, the flow track exhibits a spiral line in a clockwise orientation from the bottom to the top of the boiler furnace. The full degree of streamlines demonstrates the reasonable distribution of airflow in the furnace. Additionally, the results indicate that more attention should be paid to controlling the tangential radius of the airflow circle to adjust the temperature field of the boiler furnace.
Figure 6.
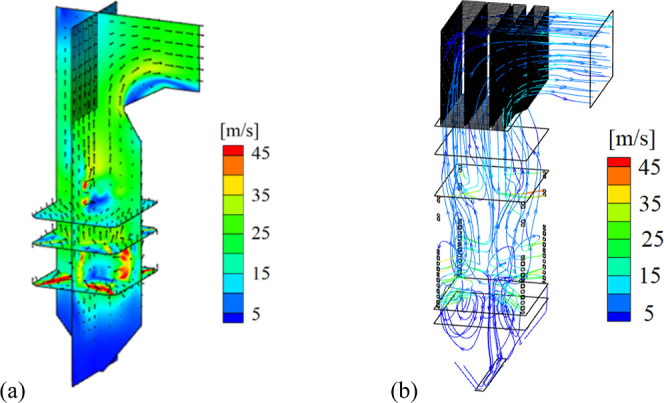
Diagrams of velocity distribution at cross sections and longitudinal sections (a) and streamline (b) in the boiler furnace at ξ = 0.1.
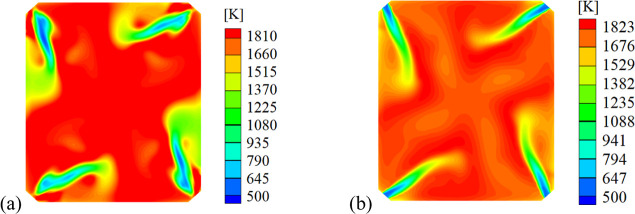
Figure 7 illustrates the cross-sectional temperature distribution in the burner zone at ξ = 0.1, with furnace heights of Y = 6.3 m and Y = 11.7 m, where the first- and four-layer primary air nozzles are located. The temperature distribution patterns are mainly influenced by the spraying jet from the nozzles. The temperature of the initial injection streams is relatively low before combustion of the pulverized coal occurred, and the temperature rose sharply as the fuel burned. In the central furnace zone, the temperature reached to the highest value, approximately 1850 K. As for the four-corner tangential combustion mode, the flame is slightly attached to the sidewall. Thus, a higher temperature might appear at a local sidewall, causing slagging, corrosion, and other risks.
Figure 7.
Temperature distribution patterns at the cross sections of the boiler furnace where the first-layer primary air nozzles at Y = 6.3 m (a) and four-layer primary air nozzles at Y = 11.7 m (b) are located.
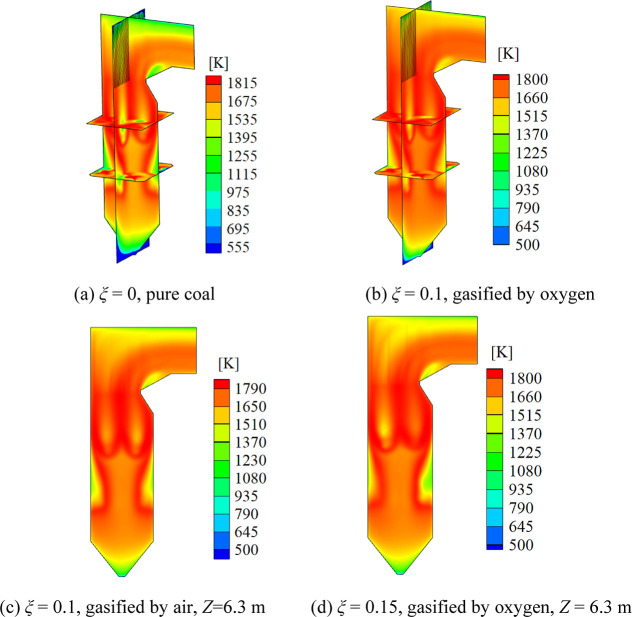
Figure 8 demonstrates the temperature distributions at the cross sections and longitudinal sections of the boiler furnace in the cases of pure coal combustion and cocombustion with coal and sawdust syngas gasified by three kinds of gasification agents. The overall temperature distributions are almost symmetrical in the longitudinal sections of the furnace for ξ = 0, ξ = 0.1, and ξ = 0.15. Additionally, the cross-sectional temperature distributions are nearly independent of ξ and the type of gasification agent. By contrast, the temperature magnitude in the furnace was affected by ξ and the type of gasification agent. The maximum temperature at ξ = 0 is greater than in the other cases of syngas cocombustion, which may be attributed to the cooling effect of the injected syngas stream in the SOFA zone. The maximum temperature of the whole boiler furnace at ξ = 0.15 with oxygen as the gasification agent is approximately 1870 K, which is slightly higher than that at ξ = 0.1. This result may have been due to the higher heating value of sawdust syngas gasified by oxygen-enriched gas than by air.
Figure 8.
Distributions of temperature field at the cross sections and longitudinal sections of the boiler furnace for the pure coal combustion (a) and cocombustion with coal and sawdust syngas gasified by three kinds of agents (b,c,d).
When sawdust syngas is injected into the boiler furnace, the cross-sectional temperature in the SOFA zone is comparable to that in the case of pure coal combustion. The injected syngas in the transition zone prolonged the combustion process and increased the heat release. As a result, the average cross-sectional temperature is relatively higher than the case of pure coal combustion. Notably, the flame temperature in the whole boiler furnace is within the safe operating temperature range. Moreover, the velocity and temperature distributions are consistent with the results reported by Yang.31
According to the temperature distribution patterns at the longitudinal section at Y = 6.3 m, shown in Figure 8c,d, the flame temperature rises sharply from the cold ash hopper area to the combustion zone. The highest furnace temperature is observed in the burner zone, where alternate arrangement of primary and secondary air nozzles is configured. In the transition zone, the temperature continues to rise owing to the intense mixing of flame and pulverized coal. In the SOFA zone, the temperature decreases due to the lower combustion intensity and injection of a cold syngas stream. Subsequently, the temperature is further reduced in the top furnace as the flame gas exchanges heat with the water-cooled walls and superheater unit. On the whole, the temperature distributions and combustion temperature in the boiler furnace are reasonable for practical applications.
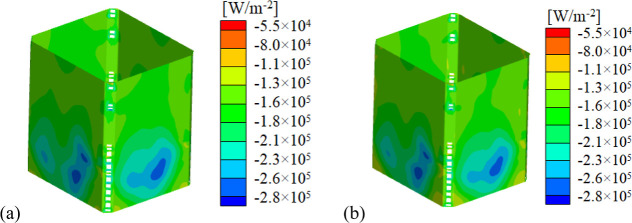
Figure 9a depicts the total heat flux distribution in the burner zone. The heat flux distribution on the sidewall of the furnace is uneven. The temperature at the local wall could be relatively high, increasing the risk of slag formation. As shown in Figure 9b, the distribution of radiant heat flux is consistent with that of total heat flux. Further calculations revealed that radiant heat flux accounts for >88% of the total heat flux. These results indicated that the main heat transfer mode in the furnace is the high-temperature radiant heat transfer mode. Therefore, the control of heat flux distribution on the furnace wall should be considered from the perspective of radiant heat transfer.
Figure 9.
Patterns of total heat flux distribution (a) and radiant heat flux distribution (b) on the furnace sidewall at the burner zone for syngas cocombustion at ξ = 0.1.
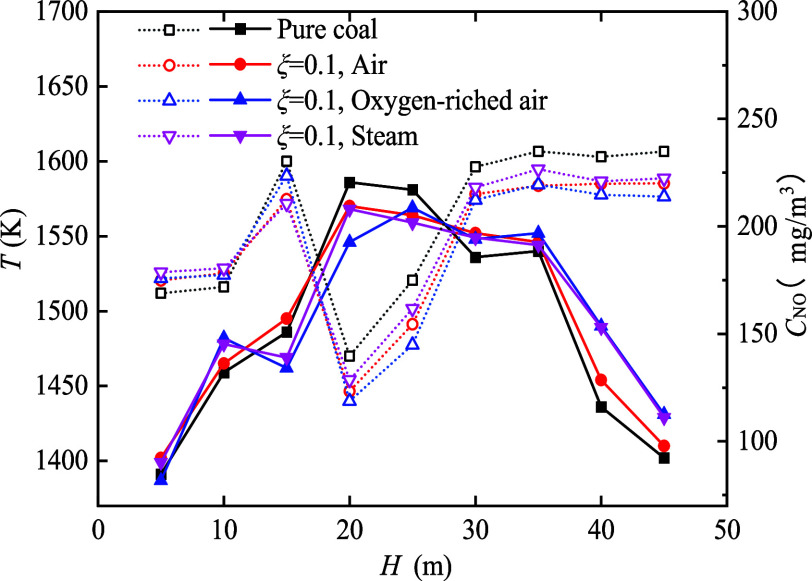
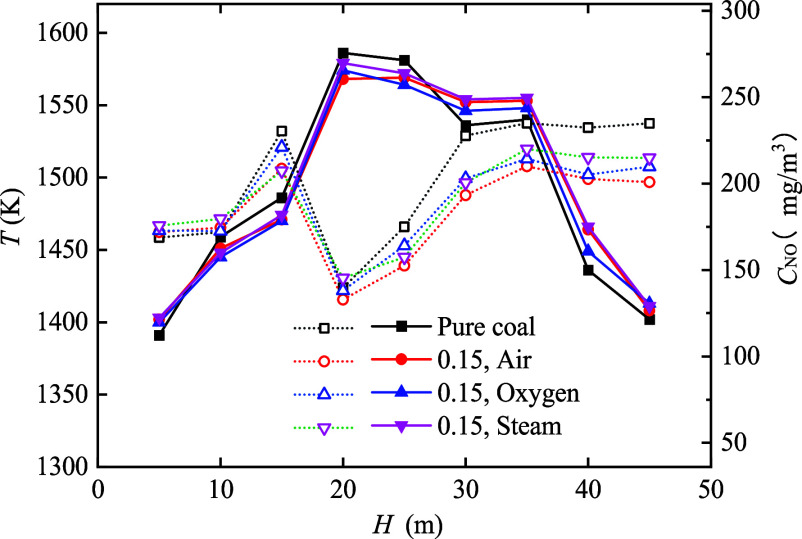
Figures 10 and 11 illustrate the variations in T and CNO with the height (H) of the boiler furnace at ξ = 0.1 and ξ = 0.15, respectively. The temperature of the boiler furnace initially increases and then decreases in the upward direction in both cases. A transition region between the pulverized coal and syngas nozzles is present where no fuel injection occurred. Hence, two temperature peaks appear at the burner and SOFA zones. Figures 10 and 11 also demonstrate that cocombustion with syngas in the coal-fired furnace reduces the temperature extremum in the combustion zone, which might be ascribed to the reduced flow rate of coal injection and dilution effect of the injected syngas stream. Due to the constant value of the total combustion heat in the boiler furnace, the flow rate of pulverized coal is inversely proportional to the syngas flux. Not only the heating value of syngas is much lower than that of coal, but also the large amount of inert gas content (such as N2 and CO2) has been contained in syngas absorbed a certain amount of heat. Therefore, the furnace temperature extremum is reduced during syngas cocombustion.
Figure 10.
Variations of temperature T (solid symbols) and NO concentration CNO (hollow symbols) along with the furnace height H for the case of pure coal combustion and the case of cocombustion with sawdust syngas at ξ = 0.1 with different gasification agents.
Figure 11.
Variations of temperature T (solid symbols) and NO concentration CNO (hollow symbols) along with the furnace height H for the case of pure coal combustion and the case of cocombustion with sawdust syngas at ξ = 0.15 with different gasification agents.
Syngas combustion releases heat in the SOFA zone in the furnace, which results in higher temperatures in the SOFA zone at ξ = 0.1 and ξ = 0.15 than at ξ = 0, as displayed in Figures 10 and 11. Moreover, the temperature at the furnace outlet might have been influenced by syngas combustion in the SOFA zone. Compared to the case of syngas cocombustion, the outlet temperature in the ξ = 0 case is slightly greater. For the case of cocombustion with sawdust syngas gasified by oxygen and steam at ξ = 0.1, the temperature at the furnace outlet is higher than that in the pure coal combustion case. The lowest outlet temperature occurred in the case of cocombustion with sawdust syngas gasified by air, which is attributed to its low LHV. Similar to the case of ξ = 0.15, the outlet temperature seems to be independent of the gasification agent.
Figures 10 and 11 demonstrate two climbs and one fall in the variation of CNO with H. The outlet CNO of the boiler furnace in the cocombustion case is less than that in the pure coal combustion case. Moreover, the outlet CNO at ξ = 0.1 is slightly less than that at ξ = 0.15. The reduction in outlet CNO between the cases at ξ = 0.1 and ξ = 0 is approximately 25 mg/m3, which is caused by two factors. First, the total amount of pulverized coal consumed is reduced in the cocombustion case. Accordingly, the quantities of nitrogenous compounds such as N2, NO, NO2, and N2O generated from coal combustion were decreased. Second, the injected syngas stream contributes a large part of the CO, H2, CH4, and CO2 contents, which are difficult to convert into NOx.31−33 Therefore, NO emissions have been pronouncedly decreased in the case of syngas cocombustion. Compared to the cocombustion case of the 300 MW furnace,27 the case of the 600 MW furnace generated a greater amount of NO emissions, with a difference of approximately 100 mg/m3.
4. Conclusion
Amplification experiment of biomass gasification and 3D numerical simulations have been performed to investigate cocombustion technology in a coal-fired boiler furnace. Sawdust acts as the feedstock in a bench-scale CFB gasification producer gasified by air, oxygen-enriched air, and steam, which greatly influenced the components and heating value of the syngas product. Subsequently, the effects of different kinds of syngas product on the cocombustion characteristics have been investigated via 3D numerical simulations. The conclusions of the study are listed as follows.
-
(1)
When the gasification agent is oxygen-enriched air or steam, the H2 and CO contents and LHV of the syngas product are substantially higher than when air was the gasification agent. Oxygen-enriched air as the gasification agent greatly increase the CO content of the syngas product, while steam as the agent greatly increase the H2 content. The highest heating value of the syngas reaches 12.3 MJ/m3 when ER and S/B are adjusted in the ranges of 0.21–0.31 and 0.1–0.5, respectively.
-
(2)
The numerical velocity field demonstrates a well-formed tangential velocity circle in the cross sections and full degree of streamlines in the boiler furnace. Syngas cocombustion technology is shown to reduce the temperature extremum of the boiler furnace while raising the temperatures in the SOFA zone and furnace outlet. The proportion of radiant heat flux is >88% of the total heat flux in the boiler furnace.
-
(3)
The outlet CNO of the boiler furnace in the case of syngas cocombustion is less than that of pure coal combustion. The reductions in outlet CNO are approximately 25 and 40 mg/m3 at the high cocombustion ratios of ξ = 0.1 and ξ = 0.15, respectively.
Acknowledgments
This work was supported by the Project of Prosperity of Science and Technology for China Power Construction Chengdu Institute (no. P54022), Power China Construction Group Urban Planning and Design Research Institute Corporation Limited, Guangzhou, China and Guangdong Provincial University Innovation Team Project, No. 2023KCXTD038.
Glossary
Nomenclature
- A
ash content (wt %)
- CNO
mass fraction of NO (wt %)
- CFB
circulating fluidized bed
- E(T)
relative error of temperature
- E(CNO)
relative error of CNO
- ER
equivalent ratio
- FC
fixed carbon content (wt %)
- LHV
low heating value (MJ/kg)
- M
moisture content (wt %)
- OC
oxygen concentration (%)
- Qv
heating value of syngas (MJ/kg)
- S/B
steam/biomass ratio
- T
temperature (K)
- v
velocity at fuel inlets or air nozzles (m/s)
- V
volatile content (wt %)
- Y
Y-coordinate of the boiler furnace (m)
- ξ
cocombustion ratio
Glossary
Subscript
- pri
primary secondary air streams
- sec
secondary air streams
- gas
sawdust syngas
Data Availability Statement
The data that supports the findings of this study are available within the article.
The authors declare no competing financial interest.
References
- Deng M. S.; Zhang P. X.; Nie Y. Z.; Shi Y.; Yang H. Y.; Wu D.; Rong X.; Ma R. How to improve pollutant emission performances of household biomass cookstoves: A review. Energy Build. 2023, 295, 113316. 10.1016/j.enbuild.2023.113316. [DOI] [Google Scholar]
- Chaves M.; Torres C.; Tenorio C.; Moya R.; Arias-Aguilar D. Syngas characterization and electric performance evaluation of gasification process using forest plantation biomass. Waste Biomass Valorization 2024, 15 (3), 1291–1308. 10.1007/s12649-023-02231-3. [DOI] [Google Scholar]
- Trinh V. T.; Lee B. H.; Kim S. M.; Jeon C. H. Numerical Optimization on Char Conversion and NOx Emission under Various Operating Conditions in a Retrofit Biomass Boiler. ACS Omega 2023, 8 (21), 18530–18542. 10.1021/acsomega.3c00264. [DOI] [PMC free article] [PubMed] [Google Scholar]
- Glushkov D.; Zhuikov A.; Zemlyansky N.; Pleshko A.; Fetisova O.; Kuznetsov P. Influence of the composition and particle sizes of the fuel mixture of coal and biomass on the ignition and combustion characteristics. Appl. Sci. 2023, 13, 11060. 10.3390/app131911060. [DOI] [Google Scholar]
- Zhuikov A.; Zemlyanskiy N.; Grishina I.; Chicherin S. Experimental combustion of different biomass wastes, coals and two fuel mixtures on a fire bench. Sustainability 2024, 16, 5227. 10.3390/su16125227. [DOI] [Google Scholar]
- Liu H. L.; Ye C.; Zhao Y.; Li G. E.; Xu Y. S.; Tang Y. J.; Luo G.; Wang Q. Performance analysis of biomass gasification coupled with ultra-supercritical power generation system. Chem. Eng. Process. 2022, 179, 109093. 10.1016/j.cep.2022.109093. [DOI] [Google Scholar]
- Maitlo G.; Unar I. N.; Mahar R. B.; Brohi K. M. Numerical simulation of lignocellulosic biomass gasification in concentric tube entrained flow gasifier through computational fluid dynamics. Energy Explor. Exploit. 2019, 37 (3), 1073–1097. 10.1177/0144598719839760. [DOI] [Google Scholar]
- Wojnicka B.; Ściążko M.; Schmid J. C. Modelling of biomass gasification with steam. Biomass Convers. Biorefin. 2021, 11, 1787–1805. 10.1007/s13399-019-00575-2. [DOI] [Google Scholar]
- Morrone B. Residual biomass conversion to bioenergy. Energies 2022, 15 (16), 5822. 10.3390/en15165822. [DOI] [Google Scholar]
- Murugesan P.; Raja V.; Dutta S.; Moses J. A.; Anandharamakrishnan C. Food waste valorisation via gasification–A review on emerging concepts, prospects and challenges. Sci. Total Environ. 2022, 851, 157955. 10.1016/j.scitotenv.2022.157955. [DOI] [PubMed] [Google Scholar]
- Costa M.; Piazzullo D. The Effects of Syngas Composition on Engine Thermal Balance in a Biomass Powered CHP Unit: A 3D CFD Study. Energies 2024, 17, 738. 10.3390/en17030738. [DOI] [Google Scholar]
- Arruda Ferraz de Campos V.; Carmo-Calado L.; Mota-Panizio R.; Matos V.; Silva V. B.; Brito P. S.; Eusébio D. F. L.; Tuna C. E.; Silveira J. L. A Waste-to-Energy Technical Approach: Syngas–Biodiesel Blend for Power Generation. Energies 2023, 16, 7384. 10.3390/en16217384. [DOI] [Google Scholar]
- Tsekos C.; Grosso M. D.; Jong W. D. Gasification of woody biomass in a novel indirectly heated bubbling fluidized bed steam reformer. Fuel Process. Technol. 2021, 224, 107003. 10.1016/j.fuproc.2021.107003. [DOI] [Google Scholar]
- Liu H.; Li S.; Xiang X.; Gong S.; Jia C.; Wang Q.; Sun B. Simulation of biogas co-combustion in CFB boiler: Combustion analysis using the CPFD method. Case Stud. Therm. Eng. 2024, 59, 104610. 10.1016/j.csite.2024.104610. [DOI] [Google Scholar]
- Krzywanski J.; Sztekler K.; Szubel M.; Siwek T.; Nowak W.; Mika L. A comprehensive three-dimensional analysis of a large-scale multi-fuel CFB boiler burning coal and syngas. Part 1. The CFD model of a large-scale multi-fuel CFB combustion. Entropy 2020, 22, 964. 10.3390/e22090964. [DOI] [PMC free article] [PubMed] [Google Scholar]
- Krzywanski J.; Sztekler K.; Szubel M.; Siwek T.; Nowak W.; Mika L. A comprehensive three-dimensional analysis of a large-scale multi-fuel CFB boiler burning coal and syngas. Part 2. Numerical simulations of coal and syngas co-combustion. Entropy 2020, 22, 856. 10.3390/e22080856. [DOI] [PMC free article] [PubMed] [Google Scholar]
- Drosatos P.; Nikolopoulos N.; Karampinis E.; Grammelis P.; Kakaras E. Comparative investigation of a co-firing scheme in a lignite-fired boiler at very low thermal-load operation using either pre-dried lignite or biomass as supporting fuel. Fuel Process. Technol. 2018, 180, 140–154. 10.1016/j.fuproc.2018.08.011. [DOI] [Google Scholar]
- Dong C. Q.; Yang Y. P.; Yang R.; Zhang J. Numerical modeling of the gasification based biomass co-firing in a 600 MW pulverized coal boiler. Appl. Energy 2010, 87, 2834–2838. 10.1016/j.apenergy.2009.05.033. [DOI] [Google Scholar]
- Lu H.; Huang S. W.; Li H. C.; Cheng Z.; Chang X.; Dong L.; Kong D.; Jing X. Numerical simulation of combustion characteristics in a 660 MW tangentially fired pulverized coal boiler subjected to peak-load regulation. Case Stud. Therm. Eng. 2023, 49, 103168. 10.1016/j.csite.2023.103168. [DOI] [Google Scholar]
- Li P.; Bao T.; Guan J.; Shi Z. F.; Xie Z.; Zhou Y.; Zhong W. Computational analysis of tube wall temperature of superheater in 1000 MW ultra-supercritical boiler based on the inlet thermal deviation. Energies 2023, 16, 1539. 10.3390/en16031539. [DOI] [Google Scholar]
- Huang S. L.; Li D. B.; Que Z. B.; Miao J. J.; Liu P. Y. Numerical simulation of combustion process of 600 MW supercritical tangentially fired boiler. Clean Coal Technol. 2023, 29 (2), 167–175. [Google Scholar]
- Liu Y. Q.; Tan W. Y.; Liang S. H.; Bi X. L.; Sun R. Y.; Pan X. J. Comparative study on the co-combustion behavior of torrefied biomass blended with different rank coals. Biomass Convers. Biorefin. 2022, 14 (1), 781–793. 10.1007/s13399-022-02368-6. [DOI] [Google Scholar]
- Lupiáñez C.; Mayoral M. C.; Guedea I.; Espatolero S.; Diez L. I.; Laguarta S.; Andrés J. M. Effect of co-firing on emissions and deposition during fluidized bed oxy-combustion. Fuel 2016, 184 (15), 261–268. 10.1016/j.fuel.2016.07.027. [DOI] [Google Scholar]
- Alvarez L.; Yin C.; Riaza J.; Pevida C.; Pis J.J.; Rubiera F. Biomass co-firing under oxy-fuel conditions: A computational fluid dynamics modelling study and experimental validation. Fuel Processing Technology 2014, 120, 22–33. 10.1016/j.fuproc.2013.12.005. [DOI] [Google Scholar]
- Tao J. Y.; Hou L. A.; Li J.; Yan B. B.; Chen G. Y.; Cheng Z. J.; Lin F.; Ma W.; Crittenden J. C. Biomass combustion: Environmental impact of various precombustion processes. J. Clean. Prod. 2020, 261, 121217. 10.1016/j.jclepro.2020.121217. [DOI] [Google Scholar]
- Yahaya A. Z.; Somalu M. R.; Muchtar A.; Sulaiman S. A.; Wan Daud W. R. Effect of particle size and temperature on gasification performance of coconut and palm kernel shells in downdraft fixed-bed reactor. Energy 2019, 175 (15), 931–940. 10.1016/j.energy.2019.03.138. [DOI] [Google Scholar]
- Shang X. X.; Xie J. J.; Chen J. C.; Gu Y. N. Numerical Study on Combustion Characteristics of Biogas Cocombustion in a 300MW Coal-Fired Boiler Furnace. ACS Omega 2024, 9, 20378–20387. 10.1021/acsomega.4c00885. [DOI] [PMC free article] [PubMed] [Google Scholar]
- Yang X. D.The investigation of the combustion characteristics and pollutants emission behaviour during the co-combustion of Biomass and coal. Ph.D. Thesis, Zhe Jiang University, China, 2022. [Google Scholar]
- Zha Z.; Ge Z.; Ma Y.; Zeng M.; Wu Y.; Hou Z.; Li F.; Zhang H. Hydrogen-rich syngas production and insight into morphology-kinetics correlation for furfural residue steam gasification in a bubbling fluidized bed. Chem. Eng. J. 2023, 477, 147151. 10.1016/j.cej.2023.147151. [DOI] [Google Scholar]
- Cerone N.; Zimbardi F. Effects of oxygen and steam equivalence ratios on updraft gasification of biomass. Energies 2021, 14 (9), 2675. 10.3390/en14092675. [DOI] [Google Scholar]
- Prestipino M.; Piccolo A.; Polito M. F.; Galvagno A. Combined bio-hydrogen, heat, and power production based on residual biomass gasification: energy, exergy, and renewability assessment of an alternative process configuration. Energies 2022, 15 (15), 5524. 10.3390/en15155524. [DOI] [Google Scholar]
- Yang X. D.; Luo Z. Y.; Yan B. C.; Wang Y. C.; Yu C. J. Evaluation on nitrogen conversion during biomass torrefaction and its blend co-combustion with coal. Bioresour. Technol. 2021, 336, 125309. 10.1016/j.biortech.2021.125309. [DOI] [PubMed] [Google Scholar]
- Ajorloo M.; Ghodrat M.; Scott J.; Strezov V. Recent advances in thermodynamic analysis of biomass gasification: a review on numerical modelling and simulation. J. Energy Inst. 2022, 102, 395–419. 10.1016/j.joei.2022.05.003. [DOI] [Google Scholar]
- Chang J.; Zhou Z.; Ma X.; Liu J. Computational investigation of hydrodynamics, coal combustion and nox emissions in a tangentially fired pulverized coal boiler at various loads. Particuology 2022, 65 (65), 105–116. 10.1016/j.partic.2021.06.012. [DOI] [Google Scholar]
Associated Data
This section collects any data citations, data availability statements, or supplementary materials included in this article.
Data Availability Statement
The data that supports the findings of this study are available within the article.


