Abstract
Hot dry rock (HDR) geothermal is a sustainable and clean energy source. However, its development progress is hindered by creating seepage channels in deep reservoirs with low porosity and permeability. Traditional hydraulic fracturing techniques are ineffective for enhancing the permeability of these high-strength reservoirs. To address this, a cyclic nitrogen injection technique was proposed, which leverages the thermal gradients of the hot reservoir to stimulate a complex thermally induced fracture network. To study the three-dimensional pore-fracture structure and the flow characteristic of HDR under temperature shock effects, various high-temperature rock samples (200–500 °C) were treated with 5 cycles of liquid nitrogen cold shock. Using digital core technology, a visual pore-fracture network was reconstructed and the simulation of flow and heat exchange within this network was further performed. The main conclusions are as follows: Following the liquid nitrogen cold shock treatment with rock cores of 200–300 °C, only a few isolated micropores were formed, marked by low porosity and poor connectivity, yielding effective porosities of 0.79 and 1.52%, respectively. In contrast, the cold shock at 400–500 °C induced the formation of a reticulated pore-fracture network. This development was attributed to the combined effects of thermal stress and grain expansion, with an effective porosity reaching 12.58%. Further, a pore network model revealed a substantial increase in both the pore number and size, especially under the cold shock of 500 °C cores, where the largest pore radius reached 2133 μm. The permeability of the representative elementary volume increased significantly with the rising cold shock temperature difference, escalating from 13.79 μm2 at 200 °C to 1101.39 μm2 at 500 °C. This shift signifies a transition from localized to more extensive flow paths. Based on the actual pore-fracture network, a simulation of heat extraction from HDR was conducted, showing that the exchanged heat increased from 4.51 × 10⁻⁸ to 8.34 × 10⁻⁸ W with the rise in the temperature difference. Within the temperature range of 300–400 °C, a singular flow path was observed, characterized by minimal fluid transport but elevated exit temperatures. Meanwhile, at 500 °C, a superior heat exchange network was established, featuring improved fluid transport and heat exchange efficiency.
1. Introduction
Hot dry rock (HDR), a rock mass with a minimal fluid and temperatures exceeding 180 °C, represents a significant source of geothermal energy that is both clean and renewable.1 This energy source is characterized by its widespread geographical presence, low carbon emission, environmental friendliness, and the stability of energy output. In contrast to wind and solar energy, HDR geothermal is unaffected by atmospheric conditions, thereby ensuring a continuous and stable energy supply. Compared to biomass and traditional fossil fuels, it offers the environmental benefit of not emitting greenhouse gases or pollutants. The HDR resources of the global land area are estimated to be equivalent to 4950 trillion tons of standard coal, nearly 30 times the combined total of all fossil fuel reserves.2 In China, HDR resources within the 3–10 km depth range are equivalent to 856 trillion tons of standard coal, which is 80 times the country’s total fossil fuel reserves.3 In response to climate change, more than one hundred countries have pledged to reduce carbon emissions, committed to reducing carbon emissions. Currently, the Russian–Ukrainian conflict has further intensified a global energy crisis. The development of HDR geothermal energy is pivotal in transforming the global energy landscape, mitigating the greenhouse effect, and countering energy scarcity.
The essence of HDR geothermal resource development is centered on technological innovation in thermal storage modification. These reservoirs are typically embedded within deep granite formations, characterized by low porosity and permeability. Consequently, this necessitates fracture enhancement to facilitate seepage heat transfer, thereby enabling the development of enhanced geothermal systems (EGS).4 Conventional hydraulic fracturing is constrained by the high stress encountered at depth and requires substantial initiation pressure; moreover, the fractures generated are often linear and confined, which hinders efficient heat transfer with the thermal reservoir.5 To address these challenges,
Researchers have proposed a thermal stimulation method that involves injecting cold fluids into high-temperature reservoirs. This approach leverages the heterogeneity of rock, where different mineral grains exhibit varying thermal expansion coefficients, leading to differential deformation. Consequently, localized thermomechanical stress induces the formation of fractures within the reservoir. Water is the most common fracturing fluid in thermal stimulation, a subject of extensive scholarly investigation. Kang et al.6 subjected high-temperature granite cores to water cooling and subsequently assessed the altered physical properties, observing a significant development of thermal cracks. Zhang et al.7 conducted experiments on granite blocks under high-temperature heating and cold water fracturing, noting a 27.7% reduction in fracture pressure with increased temperature differential. The tensile thermal stresses around pores reach up to 5.25 MPa. Hu et al.8 utilized PFC2D software simulation to demonstrate that distinct cold water injection results in varied fracture propagation patterns. Findings indicated that cyclic injection, causing frequent activation and deactivation of natural fractures, may lead to uneven stress and fatigue, promoting crack initiation and the growth of additional branch fractures. In contrast, step injection effectively activates natural fractures, resulting in a primary fracture with minimal branching. Chemical stimulation, which involves the injection of chemical stimulants at pressures below the fracture pressure to dissolve rock minerals and enhance reservoir permeability, is typically employed as a supplementary method to hydraulic fracturing in HDR operations. Liu et al.9 compared the effects of thermal and chemical stimulation on the permeability of φ25 mm × 50 mm granite cores, finding that water cooling increased permeability by nearly an order of magnitude, whereas hydrochloric acid stimulation achieved a 3–4 order of magnitude enhancement. Luo et al.10 applied chemical stimulation to improve the permeability of fractured granite, discovering that a 12% HCl + 5% HF mixture significantly increased permeability by approximately 4 orders of magnitude. They also noted the rapid reaction of hydrochloric acid with feldspar and biotite, in contrast to its minimal reactivity with quartz. Both thermal and chemical stimulation methods have proven effective in promoting the formation and development of fractures in HDR. However, hydraulic fracturing has high crack initiation pressure and a single shape. hydraulic fracturing’s substantial water consumption and potential for formation contamination present challenges. Chemical stimulation can significantly enhance the permeability of granite and similar rocks, but low flow rates may lead to the precipitation of dissolved components, reducing permeability. Furthermore, secondary precipitation in chemically stimulated rock could obstruct newly formed fractures, compromising the effectiveness of chemical stimulation.11 Thus, the interest in liquid nitrogen fracturing technology has been rekindled among scholars. By cyclic injection of liquid nitrogen, the extreme temperature difference between the cryogenic liquid nitrogen and the high-temperature rock induces thermal stress, resulting in the formation of a complex pore-fracture network and creating an artificial thermal storage with enhanced permeability.12 The liquid nitrogen fracturing technology encompasses the cryogenic shock effect of ultralow temperature liquid nitrogen on high-temperature reservoirs, the nitrogen gas pressure fracturing effect from the vaporization expansion of liquid nitrogen, and the fatigue damage effect of cyclic cryogenic shock. The synergistic action of these multiple effects can lead to the formation of a complex fracture network within the reservoir.13 In the 1990s, McDaniel et al.14 conducted field tests on liquid nitrogen fracturing for coalbed methane and shale gas reservoirs in Kentucky, USA. Their work demonstrated the induction of a main-branch fracture network and validated the feasibility of this method.
Zheng et al.15 investigated the morphological characteristics of rock fractures induced by the cryogenic temperatures of liquid nitrogen and observed that new fractures were perpendicular to the original ones. The scale of thermal stress-induced fracture dilation is governed by the maximum tensile stress and the fracture intensity factor, respectively. Deng16 demonstrated that the liquid nitrogen cold shock to hot rocks significantly degrades the physical and mechanical properties of the rocks, with the damage factor increasing from 9% to 69% as the temperature rises from 100 to 600 °C. Gao et al.17 tested the fracture characteristics of various sandstones and marbles after exposure to room temperature or liquid nitrogen, revealing that the fracture toughness and crack density of deep-cooled specimens were 158.33% and 536.67% respectively, higher than those of the pristine specimens. Cha et al.18 conducted liquid nitrogen fracturing experiments on transparent PMMA samples, observing that liquid nitrogen flows along the borehole surface. Initially, fractures were predominantly horizontal, with subsequent expansions leading to the formation of a complex fracture network. Sun et al.19,20 performed a series of liquid nitrogen cold shocks on cores ranging from 200 to 600 °C and used ultrasonic detection to evaluate rock damage. The results indicated that the velocity, amplitude, and dominant frequency of the transmitted waves decreased with intensified rock damage, in which the velocity showed the most significant reduction of up to 85.01%. Collectively, these studies have captured the development of fracture surfaces, the type of damage patterns, and the deterioration of the mechanical properties of rocks, demonstrating that the temperature shock effect of liquid nitrogen can significantly diminish the mechanical properties of rocks and enhance the connectivity of pore structures, offering a distinct advantage over hydraulic fracturing.
Macroscopic damage in rocks originates from the accumulation microscopic pores and fractures.21 Freire-Lista et al.22 observed the evolution of fractures in four types of granites in Madrid, Spain under 42 thermal cycles using fluorescence microscopy. They found that the generation of fractures was affected by grain types, with quartz and feldspar grains being more prone to fracture formation. Sun et al.23 exposed hot rock to liquid nitrogen cold shock and subsequently characterized the pore structure using low-field nuclear magnetic resonance. It was found that as the temperature difference of the cold shock increased, the samples shifted from the development of micropores to that of meso- and macropores, accompanied by a significant increase in the number of pores and fractures. Current research on the pore structure of fractured HDR mainly focuses on the characterization of local fracture morphology or overall pore size distribution. However, the pore-fracture network in hot dry rock treated with liquid nitrogen is more complex, and there exists a significant gap in three-dimensional visualization reconstruction and quantitative analysis for such a network.
Computed tomography (CT) scanning capitalizes on the penetrating power of X-rays to nondestructively reveal the density distribution within a core sample, thereby providing a detailed, three-dimensional visualization of its pore-fracture networks. Wang et al.24 reconstructed a three-dimensional pore-fracture model of coal samples using CT scan data, enabling a detailed statistical analysis of microstructural parameters, including pore size, volume, and porosity. Li et al.25 developed a digital three-dimensional core model and examined the quantitative relationship between fractal dimension and porosity. Their findings demonstrated that the fractal dimension serves as a sensitive indicator for discerning subtle variations in core structures. The pore-fracture network analysis also aids in understanding fluid flow dynamics and heat transfer. Sepehri and Siavashi26 and Tian et al.27 utilized stochastic methods to construct two-dimensional fractured medium models for fluid flow simulation and capture the associated fluid dynamics under idealized conditions. However, current applications of CT scanning in characterizing the three-dimensional pore-fracture network are constrained by the absence of multilevel precise characterization. This limitation obstructs the execution of seepage simulation based on actual pore-fracture networks and impedes the correlation between the pore-fracture structure and heat transfer characteristics mediated by seepage.
In this study, granite samples, heated to distinct high temperatures (200, 300, 400, and 500 °C), were subjected to a series of liquid nitrogen cold shock cycles. The post-treatment granite was examined using a three-dimensional X-ray microscopic imaging system, which yielded two-dimensional (2D) cross-sectional images of the core at various layers. Image processing techniques were employed to accurately identify and quantify the 2D pore and fracture structures, allowing for an in-depth analysis of parameters such as porosity and fractal dimension across different slices. Utilizing digital core technology, the 3D pore-fracture network of the damaged HDR was reconstructed, providing a clear visualization of the pore-fracture network. A topologization model of this network was developed based on the maximal ball algorithm, enabling the extraction and quantitative analysis of pore and throat data. This model assessed the topological accessibility and permeability characteristics of the 3D pore-fracture network. Subsequently, numerical simulations of the heat extraction process were conducted, focusing on comparing the flow and heat transfer capacities of granite samples with varying degrees of damage. The study elucidates the mechanisms of pore and fracture development and the enhancement of heat transfer in HDR stimulated by the liquid nitrogen cold shock. These findings offer valuable insights for the efficient exploitation of EGS in the Gonghe Basin, Qinghai Province, China.
2. Experimental Introduction and Three-Dimensional Reconstruction of Damaged Cores
2.1. Sample Preparation
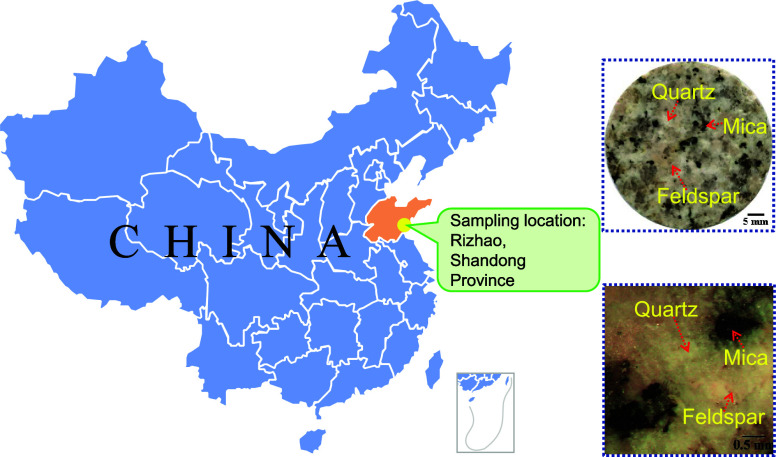
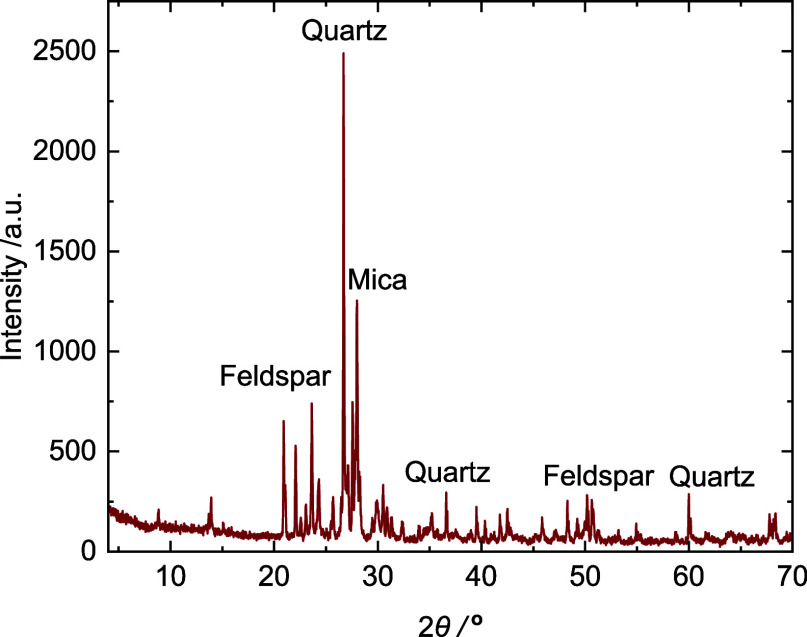
In this study, granite samples from Rizhao City, Shandong Province, were selected for the experiment. These samples are distinguished by coarse-grained textures, featuring large white quartz and flesh-colored feldspar particles, as shown in Figure 1. The granite’s density is measured at 2.571 ± 0.004 g/cm3, with a porosity of 1.09 ± 0.14% and a P-wave velocity of 2.752 ± 0.164 km/s. Further, granite powder with particle size finer than 325 mesh was analyzed by X-ray diffraction (XRD) to identify the mineral composition, as presented in Figure 2. Based on the XRD analysis results, the sample is primarily composed of quartz, potassium feldspar, plagioclase, and mica, with feldspar being the most abundant, followed by mica and quartz. Additionally, minor amounts of silicate minerals are also present. For the following liquid nitrogen cold shock tests, a series of 12 cylindrical specimens, each φ50 mm × 100 mm in size, were prepared in triplicate sets for exposure to varying temperature conditions.
Figure 1.
Sampling location and petrographic morphology of granite samples.
Figure 2.
XRD analysis result of selected granite.
2.2. Experimental Procedures
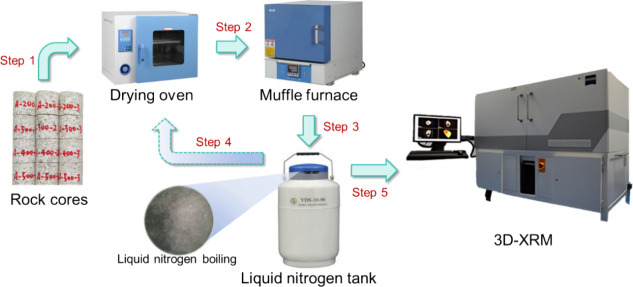
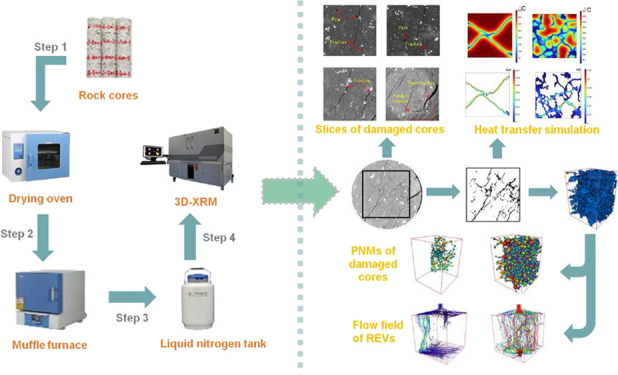
The primary experimental apparatus used in this study is depicted in Figure 3. The experimental process is outlined as follows:
-
1)
Drying: The core specimens were dried in an oven set at a temperature of 80 °C for the duration of 12 h. Subsequently, the dried specimens were removed and left to equilibrate to room temperature.
-
2)
Slow heating: The specimens were gradually heated to distinct target temperatures (200, 300, 400, and 500 °C) within a muffle furnace at a controlled rate of 5 °C per minute to minimize thermal damage. Upon reaching each temperature, the specimens were maintained for a period of 1 h to ensure uniform heat distribution throughout the core.
-
3)
Liquid nitrogen cold shock: The specimens were rapidly immersed in a liquid nitrogen bath for a duration of 10 min (During the liquid nitrogen immersion process, high-temperature granite samples were extracted at 200, 300, 400, and 500 °C, and the internal temperature changes in response to cold shock over time were analyzed. Within a maximum of 493 s, the temperature of all samples approached that of the liquid nitrogen. Consequently, we can conclude that after 10 min of liquid nitrogen immersion, the temperatures of the four groups of samples have undergone sufficient heat exchange with the liquid nitrogen). To ensure complete cooling of the entire specimens, the liquid nitrogen level always exceeded these specimens. The maximum cooling rates spanned were recorded as 2.46, 2.55, 2.49, and 2.62 °C/s, respectively. The mean cooling rates for the four sets of samples were recorded as 1.05, 1.17, 1.2, and 1.68 °C/s, respectively.
-
4)
Cyclic cold shock: Steps 1 to 3 were repeated, with the liquid nitrogen cold shock being applied a total of 5 times to each specimen.
-
5)
CT scanning: Following the temperature shock cycles, the core specimens were scanned using a CT scanner once they had returned to room temperature. This step was essential for acquiring cross-sectional images within the specimen, facilitating subsequent digital core reconstruction and analysis.
Figure 3.
Experimental setup and procedure.
2.3. Three-Dimensional Reconstruction Process
A high-resolution three-dimensional X-ray microcomputed tomography (micro-CT) imaging system, the X-radia 510 Versa from Carl Zeiss (Germany), was used to scan the damaged cores, as illustrated in Figure 4. The broad-spectrum source generates X-rays that transmit through the rotating specimen.28 Then two-dimensional slice images were captured at various angles by a detector. These images were subsequently integrated by analytical software to achieve a three-dimensional reconstruction of the specimen. A cylindrical segment, 50 mm in length along the axis of the specimen (φ50 mm × 100 mm), was chosen for scanning with a spatial resolution of 49.817 μm.
Figure 4.
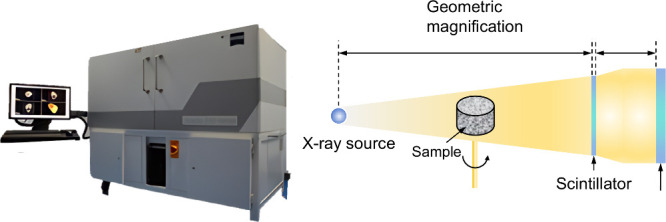
3D-XRM system and imaging principle.
Utilizing the 3D-XRM scanning, multilayer CT images of the damaged specimens were procured. As depicted in Figure 5, the attenuation coefficient of X-rays varies with the density of the medium they traverse, thus gray value of the image is directly correlated with the medium’s density. That is, the gray value is linearly proportional to the density within the specimen; higher gray values correspond to regions of greater density. The CT images revealed distinct minerals and fractures: considering the density ranges of mica (2.70–3.30 g/cm3), quartz (2.60–2.65 g/cm3), and feldspar (2.54–2.65 g/cm3), mica appears brighter than quartz, which in turn is more luminous than feldspar. Pore-fracture spaces are characterized by the lowest brightness.
Figure 5.
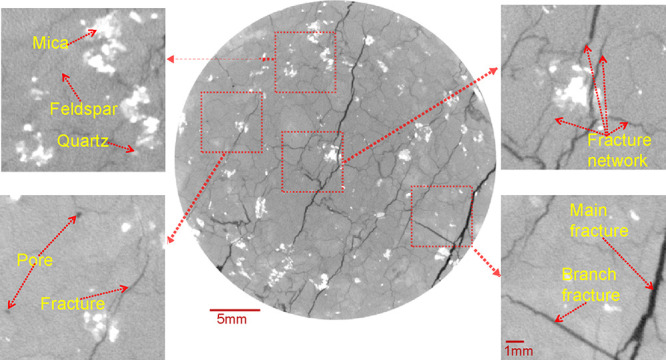
CT images of the damaged granite specimen.
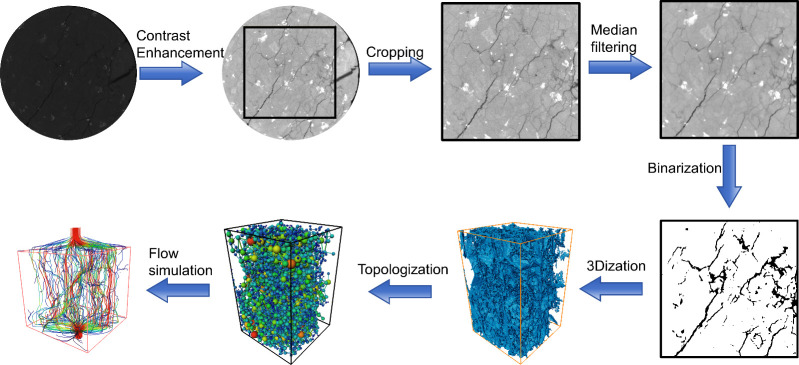
The CT images were imported into AVIZO software to reconstruct the real three-dimensional pore-fracture network of the damaged HDR. By digital image processing, the digital cores were finally obtained. The three-dimensional reconstruction process is shown in Figure 6.
Figure 6.
Three-dimensional reconstruction process of the damaged granite specimen.
2.3.1. Image Enhancement
The original CT images were dark and low-contrast, which requires image enhancement to amplify the gray scale differences between the pore fracture and the rock matrix. Image enhancement is carried out using histogram gray scale transformation, which adjusts the gray scale histogram of the original image to a more uniform distribution and increases the dynamic range of pixel gray scale values, so as to enhance the overall contrast and the image quality.29
2.3.2. Image Cropping
Due to the inconsistent response of the target points to X-rays,30 the original images may have ring artifacts around the edges, which can impede the accurate identification of the pore fractures. Therefore, the CT images need to be cropped. In this study, a square region of 650 × 650 pixels at the center was selected.
2.3.3. Filtering Denoising
During the CT scanning process, inherent noise from the mechanical system and the environment cause the generated CT image to deviate somewhat from the actual image. Therefore, it is necessary to use filters to mitigate the noise for a higher resolution CT image.31 The commonly used filtering methods include Gaussian, mean, and median filtering. Median filtering, a nonlinear smoothing method, replaces the gray value of each point with the median of the gray values of its neighborhood pixels with a defined window. This method can effectively reduce random noise and pulse interference, while also maintaining the edge information on the image.32 After a comparison of these mentioned methods, the median filtering method was ultimately selected.
2.3.4. Threshold Segmentation
Accurate segmentation of the matrix and pore-fracture interfaces within the digital core is crucial for the quantitative characterization of the pore structure. The optimal segmentation threshold between the pores with low gray values and the matrix with a high gray value is identified from the gray histogram of the image. Pixels below this threshold are regarded as pores, while those above are regarded as the rock matrix. In this study, the interactive threshold method was used to determine the optimal segmentation threshold value through the real-time updated image, thereby achieving image binarization.
2.3.5. Three-Dimensional Reconstruction
The objective of three-dimensional reconstruction is to convert the two-dimensional slice set into a three-dimensional data body, thereby enabling visualization of the specimen’s pore-fracture structure. Based on the built-in algorithm of AVIZO software, the porosity and fractal dimension of the slice set were first analyzed to evaluate the pore development across different layers. Then the three-dimensional pore-fracture network model was further constructed to analyze the spatial topological features of the network, such as the parameters of pores (equivalent pore radius), throats (throat radius and length), and coordination number.
2.3.6. Seepage Heat Transfer Simulation
Based on the three-dimensional pore-fracture network model, representative elementary volumes (REV) of appropriate sizes were selected for seepage heat transfer simulations. The resulting flow field distribution and heat exchange quantity were used to assess the effects of liquid nitrogen cold shock on various high-temperature rock specimens.
3. Results and Discussion
3.1. Characterization of Pore and Fracture Structures in Damaged Core Slices
The representative slices of damaged cores after 5 cycles of thermal exposure (200, 300, 400, and 500 °C) and subsequent cold shock are shown in Figure 7. At 200 °C, the rock samples exhibited minute pores, accompanied by sporadic, short, isolated fractures confined to localized regions but not interconnected. Upon reaching 300 °C, the pore-fracture network began to form, characterized by enlarged and increased pores as well as longer, penetrating fractures. At 400 °C, the expansion of fractures intensified, with branching fractures originating from the primary fractures and extending outward, resulting in multiple long fractures that traversed the entire region. After reaching 500 °C, extensive fractures developed within the core, intertwining to form a vast pore-fracture network that spanned the complete region.
Figure 7.
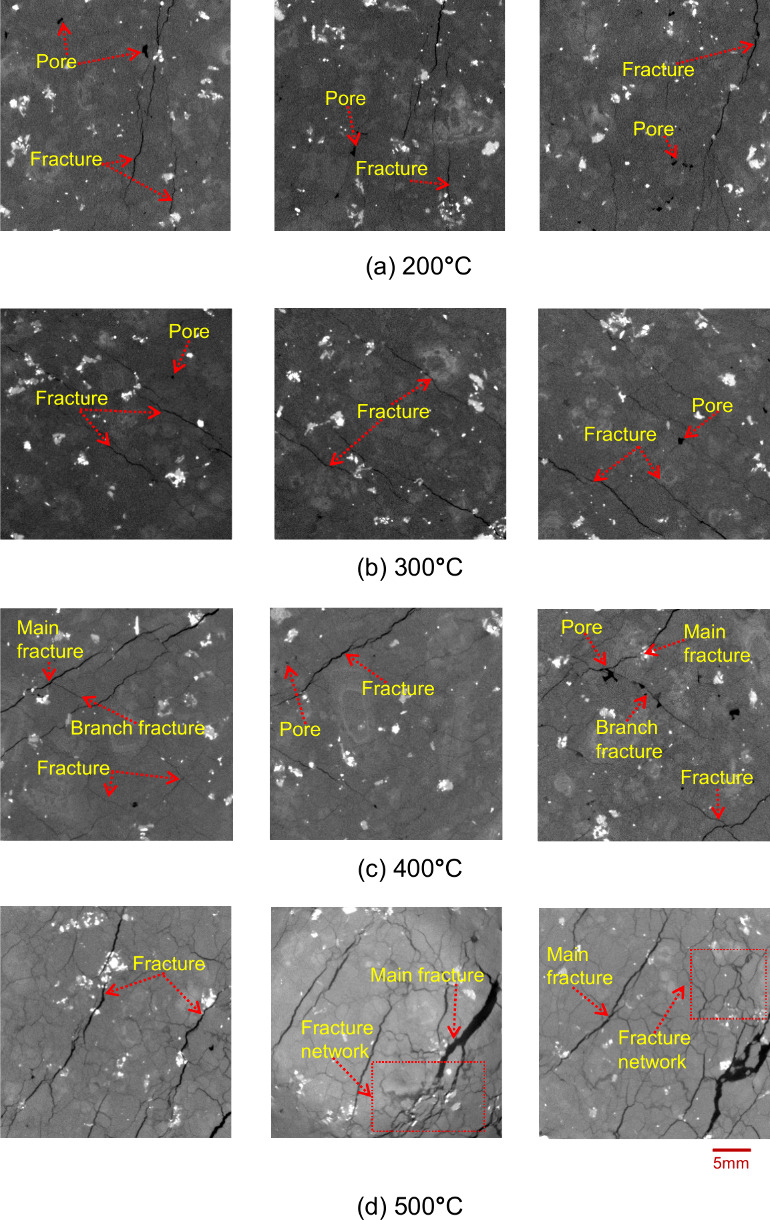
(a–d) Slices of damaged cores after 5 cycles of high temperature and cold shock.
To investigate the effects of rapid cooling on the formation of fractures and voids, numerical simulations of granite thermal fracturing based on PFC2D were conducted. In these simulations, a 40 × 40 mm square domain was created with randomly generated particles, and the mineral composition was simplified as follows: quartz (orange), potassium feldspar (gray), plagioclase (yellow), and mica (black). The granite was subjected to different high temperatures ranging from 200 to 500 °C and then cooled down to liquid nitrogen temperature (−196 °C). The simulation captured the generation and propagation of fractures in the cooling process, exploring the influence of temperature on fracture formation. The results of the simulation are depicted in Figure 8.
Figure 8.
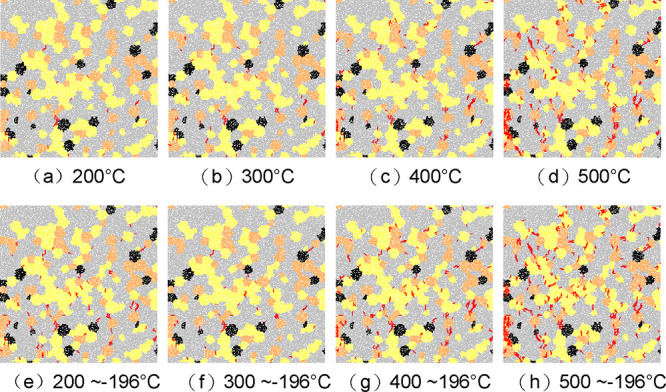
(a–h) Thermal fracture of granite during the heating and cooling process.
Thermal damage occurs due to the difference in thermal expansion coefficients of various mineral grains, leading to varying degrees of deformation among the grains, which in turn causes a redistribution of the contact forces between particles. When the particles are in a state of tension, and the normal tensile stress between particles exceeds the normal strength, tensile fractures are likely to form. These fractures are predominantly discretely distributed, with tensile fractures being the main type and shear fractures being relatively few in number. Between 200 and 400 °C, the number of fractures is relatively low and mostly consists of short, single fractures, primarily located within feldspar grains. This is because feldspar has the largest proportion and also has a relatively high thermal expansion coefficient. Additionally, many of these fractures are connected with quartz grains, as quartz has the highest thermal expansion coefficient. Furthermore, at the junctions of multiple minerals, the distribution of contact forces between particles is complex, making it prone to fracturing. At 500 °C, the number of fractures significantly increases, with a large number of fractures connecting and expanding to form longer fractures. The number of fractures generated within quartz and plagioclase also greatly increases.
During the cooling process, the scale of fractures produced is smaller compared to the heating process. Due to the “thermal expansion and contraction” of mineral particles, during the heating process, the particles expand, and the contact forces between all particles are relatively large. In the cooling process, the particles contract, changing their position and contact state, leading to an increase in contact forces between some particles and causing damage. The fractures during the cooling process are still mainly tensile in nature. At the grain boundaries, fractures extend and expand along the fractures generated during the heating process, or connect with other fractures to form through-crystal fractures. New fractures are also produced in the weak areas at the edges of some grains. The number of fractures increases with the increase in the temperature difference during the cooling shock. After experiencing heating and liquid nitrogen cooling shock, the strength of the granite is affected by the number of thermally induced fractures and the residual contact forces between particles. As the initial heating temperature increases, the total number of thermally induced fractures during the heating–cooling process decreases, and the residual contact forces between particles decrease. At the same time, due to the difference in thermal expansion of different mineral grains, weak areas are formed locally, which can lead to a reduction in the overall.
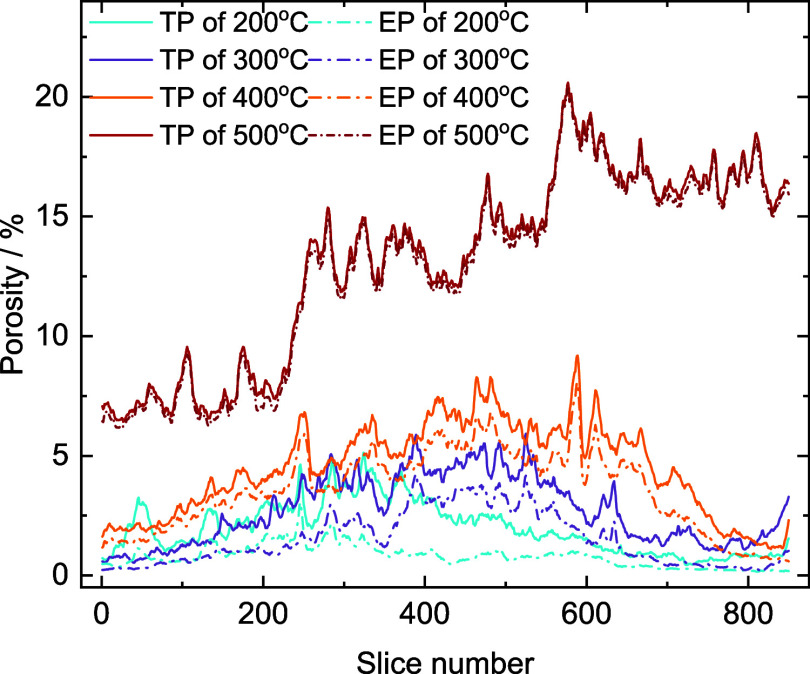
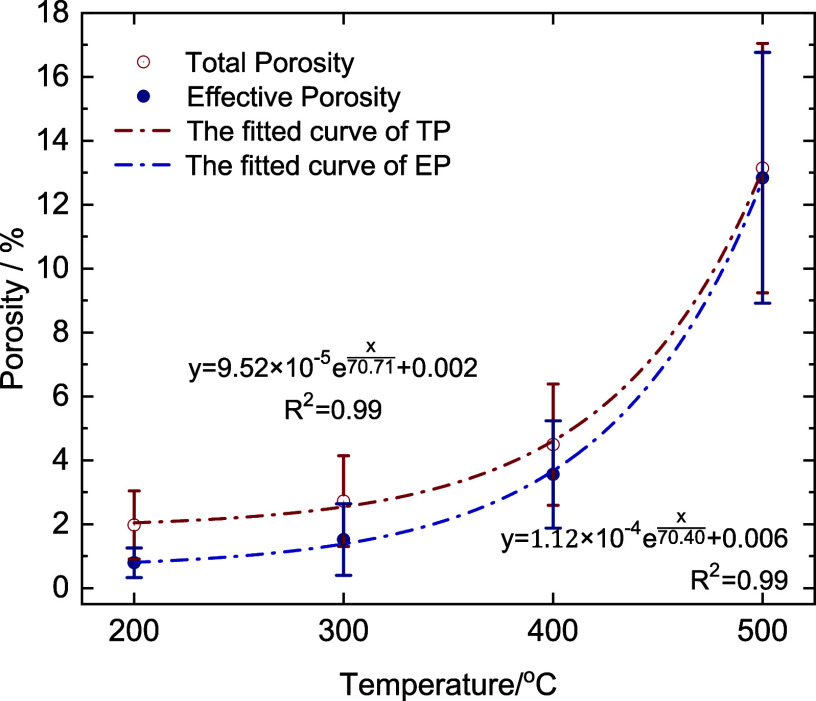
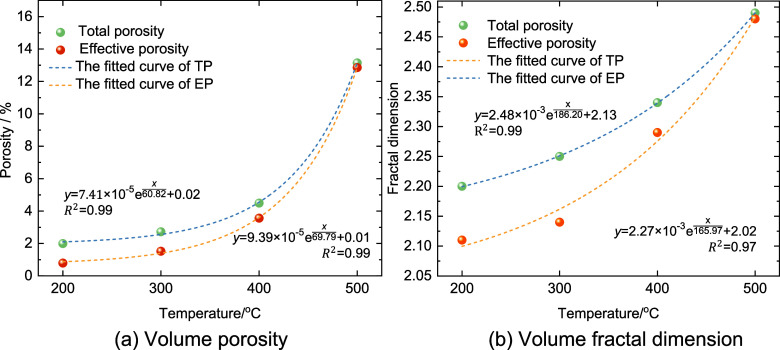
Figure 9 presents the distribution curves of total porosity (TP) and effective porosity (EP) across various slices, while Figure 11 illustrates the relationship between TP, EP, and temperature for the entire cores.
Figure 9.
Porosity distribution curves of different layers.
Figure 11.
Variation of average porosity dimensions with temperature.
After undergoing five cycles of high temperature (200 °C) and liquid nitrogen cold shock, the damaged core’s slices exhibited low porosity with minimal fluctuations, only particularly noticeable from the 200th to 400th layer slices. The TP values ranged from 0.43% to 5.13%, with an average of 1.98% and a standard deviation of 1.08%. The EP followed the trend of TP, ranging from 0.16% to 3.04%, with an average of 0.79% and a standard deviation of 0.46%. The ratio of EP to TP was 39.89%, pointing to inadequate pore development within the HDR. This was typified by a sparse distribution of small-sized pores with limited connectivity and predominantly isolated features. At 300 °C, there was a marked increase in both TP and EP compared to those of 200 °C. The average TP was 2.72% with a standard deviation of 1.41%, while the average EP was 1.52% with a standard deviation of 1.12%. The proportion of EP rose to 55.88%. The increased thermal stress from the higher cold shock temperature difference led to the formation of new intergranular pores and the enlargement of existing pores. However, the proportion of connected pore remained relatively low due to the limited number and connectivity of pores. For damaged cores subjected to 400 °C high-temperature and cold shock cycles, both TP and EP continued to rise. TP ranged from 1.10% to 9.19%, averaging 4.49% with a standard deviation of 1.89%, while EP ranged from 0.55% to 8.06%, averaging 3.56% with a standard deviation of 1.68%. Notably, the proportion of connected pore space increased to 79.29%, indicating that the original pores and fractures expanded and interconnected with newly formed pores and fractures, particularly in the local fragile areas. Upon reaching 500 °C, there was a significant increase in both TP and EP, with average values reaching 13.14% and 12.84%, respectively. However, pore distribution became more heterogeneous, with standard deviations of 3.90% for TP and 3.92% for EP. The distribution curves for the two were closely aligned, with EP constituted 97.71% of TP. At this stage, connected pores were predominant, with few isolated pores remaining. In fact, the temperature difference between the 500 °C rock and −196 °C liquid nitrogen reached 700 °C, resulting in the proliferation of large-sized intergranular pores that interconnected, ultimately forming an extensively connected fracture network. This development will significantly improve the HDR permeability and heat exchange capacity.
As shown in Figure 11, the average porosity values increased exponentially with temperature, initially at a slow rate and then accelerating. A damage threshold existed within the temperature range of 300–400 °C, beyond which porosity increased dramatically. During 200–300 °C, the dense structure of granite, coupled with low initial porosity, limited the cold shock effect and thermal stress. This stage involves the formation of micropores. The pores and fractures in each region were independently developed, and no connected pores and fractures were formed. As a result, the heterogeneity across each layer was minimal, reflected in a low standard deviation. During 400–500 °C, the increased cold shock temperature difference intensified the thermal stress and grain thermal expansion, which promoted the generation of new fractures and the expansion of original ones. Small pores gradually expanded to large pores, and isolated pores connected, culminating in the formation of an extensive pore network.
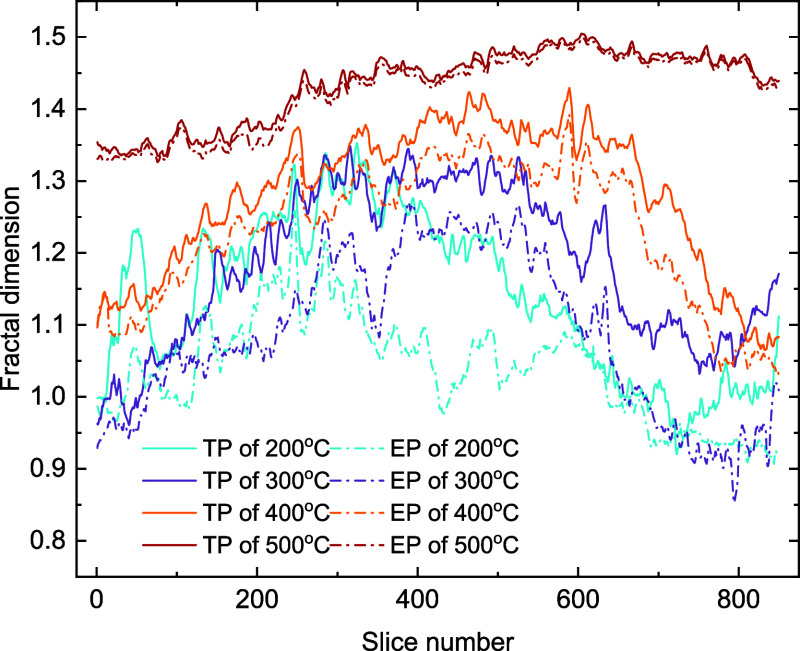
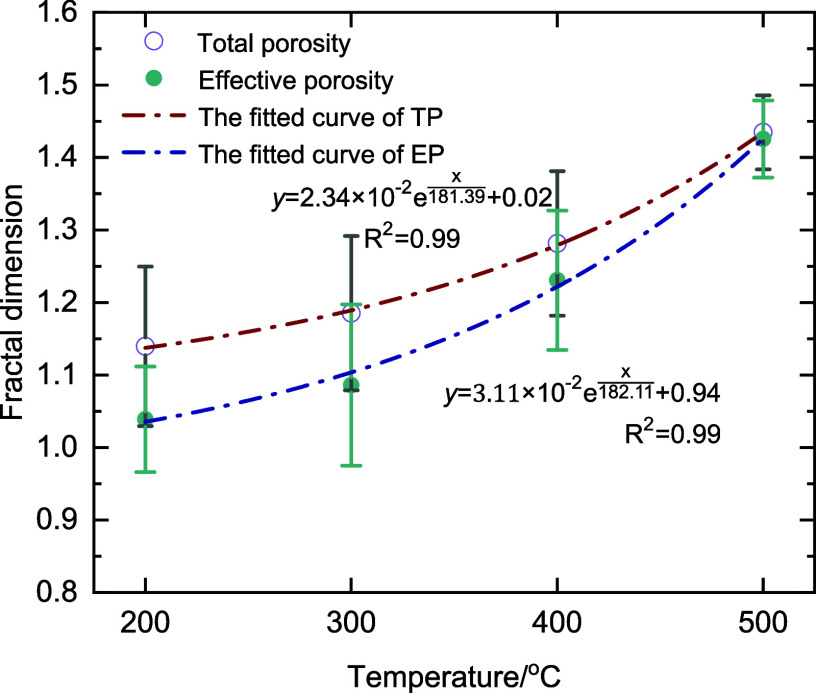
The fractal dimension serves as an indicator of pore structure complexity. The larger the fractal dimension, the more complex the pore structure is. The distribution curves of both the total and effective pore fractal dimensions across different layers are shown in Figure 10. Furthermore, Figure 12 shows the relationship between average fractal dimension and temperature. After 5 cycles of high-temperature exposure at 200 °C and subsequent liquid nitrogen cold shock, the fractal dimension attained its minimum value. Specifically, the mean value of the total pore fractal dimension was 1.14, with a standard deviation of 11%; while the mean value of the effective pore fractal dimension was 1.04, with a standard deviation of 7.27%. At this stage, the pores were poorly developed and their connectivity was also worst. At 300 °C, the total pore fractal dimension ranged from 0.96 to 1.35, while the effective pore fractal dimension ranged from 0.84 to 1.27. Notably, the average values of the total and effective pore fractal dimensions were 1.19 and 1.09, respectively. This increase in fractal dimension suggests that the pore structure became more complex and interconnected at this elevated temperature. However, the fluctuation of fractal dimension among different slices remained substantial, indicating a lack of improved connectivity and persistently percolation. Upon reaching 400 °C, the fractal dimensions of both total and effective pores continued to rise. The fractal dimension of total pore ranged from 1.06 to 1.43, with a mean value of 1.28 and a standard deviation of 9.96%; meanwhile, the fractal dimension of connected pore space ranged from 1.03 to 1.39, with a mean value of 1.23 and a standard deviation of 9.60%. The pore structure tended to be more complex and homogeneous. Furthermore, the pore connectivity at this stage improved, which in turn led to a better seepage capacity. After 500 °C, the fractal dimensions of both total and effective pores appeared a significant and substantial improvement. The mean fractal dimensions of total and effective pores were 1.43 and 1.42, respectively. Additionally, the heterogeneity in pore distribution was at its weakest, with the standard deviations of the fractal dimensions being 5.10% and 5.31%, respectively. Furthermore, the effective pores dominated at this stage, exhibiting well-developed and intricate structures across all layers, both of which were conducive to fluid transportation.
Figure 10.
Distribution curves of fractal dimensions for different layers.
Figure 12.
Variation of average fractal with temperature.
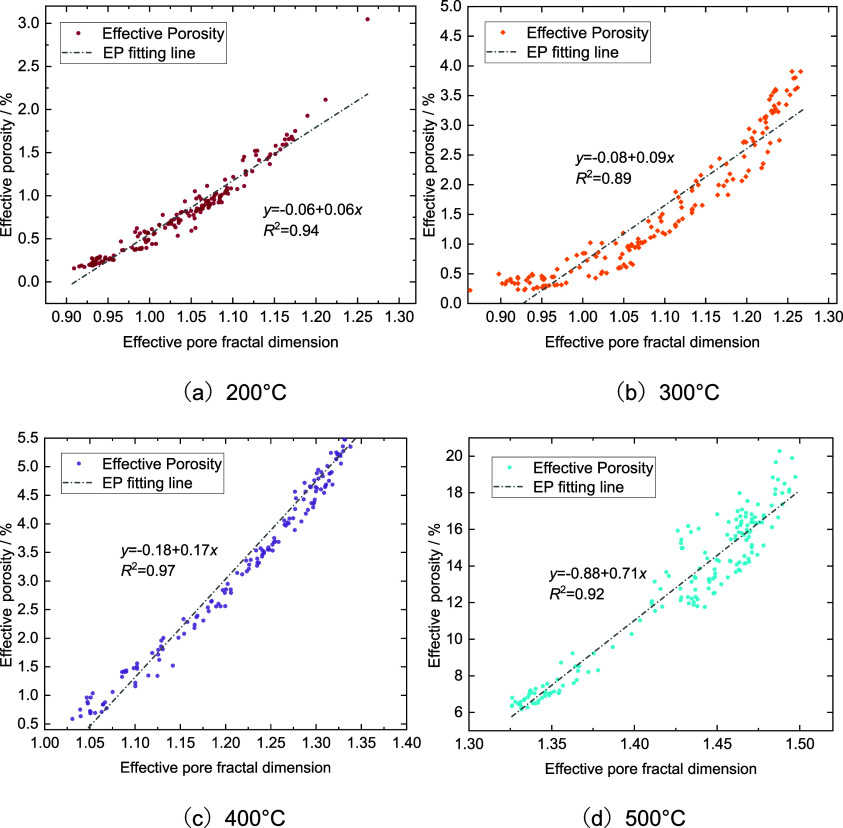
Upon comparison of Figures 11 and 12, it is evident that both porosity and fractal dimension exhibit a consistent upward trend with the increasing cold shock temperature differential. Effective porosity and fractal dimension were extracted from each slice for fitting analysis, and the results are presented in Figure 13. These results highlight a strong linear relationship between the effective porosity and fractal dimension of HDR within the elevated temperature of 200 to 500 °C. The observed increase in porosity is attributed to both a proliferation of pores and an enlargement of their volumes. Consequently, the extension and expansion of the pores led to a more tortuous morphology, displaying analogous morphological traits across diverse scales, which contributes to a higher fractal dimension.
Figure 13.
(a–d) Fitting of effective porosity and fractal dimension.
3.2. Reconstruction of the Three-Dimensional Pore-Fracture Network in Damaged Cores
Utilizing the digital core method outlined in the previous section, three-dimensional pore-fracture networks were reconstructed for granite specimens subjected to five cycles of high temperature and cold shocks at varying temperatures. Comparative analysis revealed how thermal stress, induced by temperature differentials during cold shocks, influenced the three-dimensional pore-fracture networks within the granite. Figures 14 and 15 depict the three-dimensional connected and isolated pores of the damaged cores following distinct temperature effects, respectively.
Figure 14.

(a–d) Three-dimensional structure of connected pore fractures.
Figure 15.

(a–d) Three-dimensional structure of isolated pore fractures.
The characteristics of the pore-fracture network in the HDR stimulated by temperature effect are detailed as follows: After 5 cycles of high-temperature exposure at 200 °C and liquid nitrogen cold shock at 200 °C, only a limited number of small-sized pores and fractures were developed, primarily at the core’s periphery, with minimal connectivity. Numerous isolated pores were observed, predominantly in the vicinity of the connected pores, indicating an overall lack of well-defined permeability pathways. When reaching 300 °C, the previously isolated pores coalesced to form larger connected pores, shifting from localized to a broader distribution. The number of isolated pores increased, accompanied by the emergence of isolated fracture faces and exceptionally large pores in discrete regions. As the temperature reached 400 °C, the extent of fractures linked to connected pores expanded significantly, increasing both in quantity and size. A central, substantial fracture network emerged, featuring an extensive penetrating fracture face. Isolated pores were densely packed, yet the large-sized isolated pores diminished. At this stage, the pore-fracture network had developed more fully, enhancing the core’s overall permeability. Upon reaching 500 °C, numerous pores and fractures distributed throughout the region in a staggered pattern. The exceptionally large-sized pores interlinked with surrounding pores and fractures, creating a complex pore-fracture network. This network featured numerous penetrating fracture faces and scattered small-sized isolated pores. Ultimately, the formation of this intricate three-dimensional network significantly improved the potential for fluid seepage and heat transfer within the HDR body.
Based on the outcomes of three-dimensional reconstruction, the volume porosity and volume fractal dimension of granite at varying temperatures were examined and consolidated, as depicted in Figure 16.
Figure 16.
(a,b) Variations of volume porosity and fractal dimension with temperature.
Both total porosity and total fractal dimension escalate with the temperature rise, exhibiting exponential growth. During the 200–300 °C phase, the porosity increment is moderate; effective porosity rises from 0.79% to 1.52%, and total porosity advances from 1.99% to 2.72%. in this stage, the main focus was on the generation and development of microporous, and the number of microporous increased while more macroporous and fractures continued to be formed, and isolated pores were extended and connected; As the fractal dimension of total pores rose from 2.20 to 2.25, the effective fractal dimension rises from 2.11 to 2.14. the overall pore-fracture network architecture becomes increasingly intricate. The graphical distribution indicates a substantial divergence between total and connected porosity at this stage. Corroborated by the 3D reconstruction findings, a significant quantity of isolated pores persists.
Within the 400–500 °C range, there is a pronounced upsurge in volume porosity; effective porosity soars from 3.56% to 12.85%, and total porosity escalates from 4.49% to 13.14%. the total and effective pore fractal dimensions are 2.48 and 2.49 as the temperature reached 500 °C, During this stage, the intense thermal impact induces heightened complexity in the pore-fracture structure. Concurrently, the expansion and development of microporous under impact, along with the amalgamation of isolated pores into larger ones, collectively contribute to the escalation of porosity.
To investigate the topological connectivity of pore structure within the HDR, the pore network model (PNM) was formulated based on the maximum sphere algorithm theory. In this study, the PNM was derived using AVIZO software’s functions for axis connectivity, object separation, and pore network model generation in turn. In this model, spheres represent the simplified pores and fractures, while connecting lines represent the simplified throats.
Figure 17 illustrates the PNMs of granite specimens subjected to five cycles of high temperature (200–500 °C) and liquid nitrogen cold shock. The model delineates pores and throats, color-coded to reflect the relative sizes of the equivalent pore and throat radii. At 200 °C, the PNM was constrained to the specimen’s periphery, exhibiting a limited scale. Macropores, sparse and interconnected, formed the primary fracture, displaying a chain-like distribution of scattered minute connecting pores encircled them. At this condition, pore connectivity was tenuous, restricting fluid heat transfer to localized, small-scale regions. At 300 °C, there was a notable increase in micropores, while the macropore count remained largely unchanged. The PNM further evolved, with micropores elongating along the original macropores, marking enhanced pore connectivity. When reaching 400 °C, there was a significant increase in the number of large, dispersed spheres. Numerous smaller spheres densely clustered around these larger ones, interconnected by throats. This signified the emergence of dominant seepage channels. The PNM expanded, extending into the central region and approaching the periphery. Upon reaching 500 °C, there was a substantial increase in the number of larger spheres present throughout the core, with smaller spheres pervasively distributed across the interior. A multitude of disordered and densely packed spheres, linked by connecting lines, formed a complex three-dimensional network, significantly improving porosity and connectivity. Finally, a high-quality seepage network was established within the core, thereby facilitating more effective heat transfer between the fluid and the hot rock.
Figure 17.

(a–d) PNMs of damaged cores after five cycles of high temperature and cold shock.
In summary, the findings indicate: between 200 and 300 °C, the PNMs were characterized by localized small-sized ball chains and dispersed large-sized balls. As the temperature reached 400 °C, large and small spheres were interspersed and interconnected, forming a penetrating fracture face. At 500 °C, a plethora of randomly dispersed balls and cross-connected lines formed a three-dimensional network. As the cold shock temperature differential increased, the balls increased in number and became more dispersed, and a more complex network structure emerged among the connecting lines, indicating the PNM evolved toward higher porosity and connectivity.
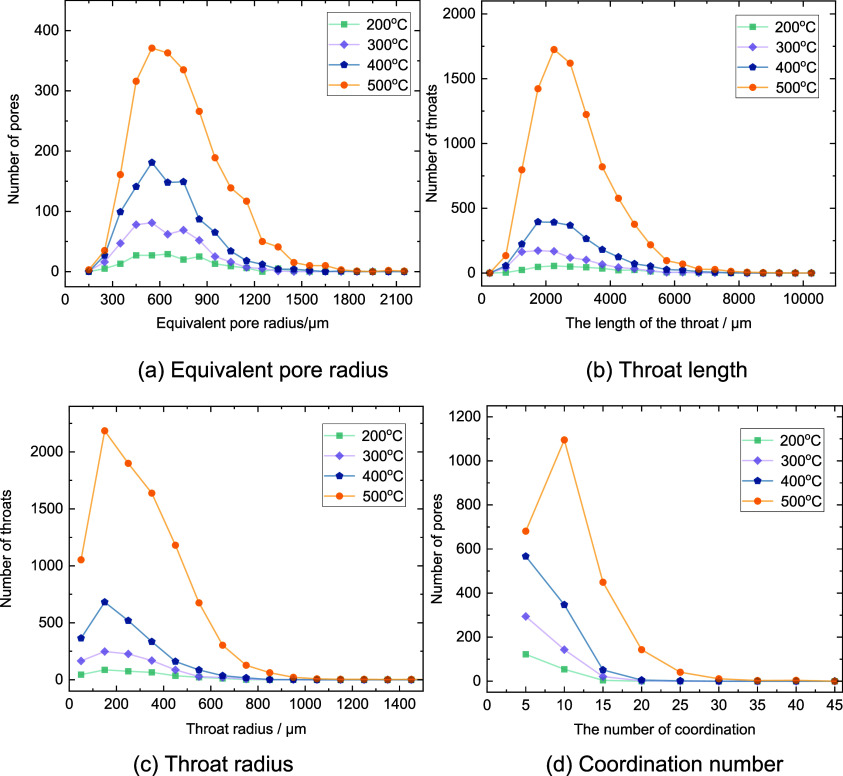
Based on the PNMs, the distribution curves for pore and throat parameters were analyzed, as shown in Figure 18. The equivalent pore radius is determined by the maximal ball algorithm, which identifies a maximal ball as one fully contained within the pore space and not surrounded by other balls.12 Specifically, the radius of the largest internal tangent ball within the pore is defined as the equivalent pore radius. In Figure 18a, the pore number progressively increased from 180 to 972 as the temperature rose from 200 to 400 °C. What’s more, pore sizes predominantly fall within the 350–550 μm range, with a minority of large-sized pores. Indeed, at 500 °C, the pore number reached 2428, most within the 350–550 μm range, alongside a substantial peak in larger pores exceeding 900 μm. Additionally, superlarge pores with an equivalent radius exceeding 2133 μm were also observed. This is attributed to the continuous enlargement of overall pore size and a substantial rise in pore count.
Figure 18.
(a–d) Topological parameters of granite post five high-temperature liquid nitrogen cold shocks.
The throat, serving as a conduit between adjacent pores, shows a similar distribution pattern for both length and radius with temperature changes. As the temperature rose from 200, 300 to 400 °C, the throat number reached 342, 951, and 2202, respectively. Throat radii are concentrated between 100 and 300 μm, while their lengths are predominantly between 1000 and 3000 μm. Subsequently, at 500 °C, there were sharp increases in throat radius within the 100–600 μm range and throat length within the 2000–4000 μm range, meanwhile the longest throat recorded was 10,167 μm. The temperature shock effect increased both the size and quantity of throats, thereby enhancing the seepage heat transfer capacity of fluid channels.
The coordination number, a parameter insight into the connectivity between individual pores and their surrounding pores, can reflect the topological connectivity of the damaged HDR cores’ porous network. Following 5 cycles of 200 °C high temperature and liquid nitrogen cold shock, the coordination number ranged from 1 to 15, with 122 in the 1–5 range, constituting 67.78% of the total. There were only 4 connected units in the 15–20 range, reflecting an overall low connectivity. At 300 °C, the curve’s peak value increased, with the maximum coordination number reaching 19, indicating enhanced pore connectivity compared to 200 °C. Upon reaching 400 °C, the coordination number ranged from 1 to 25, with 347 units concentrated in the 5–10 range. The increased number and dispersed distribution of connected units were evident. As the temperature reached 500 °C, the coordination number extended from 1 to 59, with 1095 units in the 5–10 range and 592 units in the 10–20 range, accounting for 24.38% of the total. This signified enhanced pore connectivity and the formation of a well-connected network region within the core.
In summary, the temperature shock effect of liquid nitrogen induced substantial transformations in the pore structure of HDR. The pore number and radius increased, while throats widened and lengthened. This modification led to improved pore-throat connectivity, with large-sized pores and short, wide throats combined into units, thereby endowing the HDR with favorable seepage qualities.
3.3. Seepage Simulation of the Three-Dimensional Pore-Fracture Network in Damaged Cores
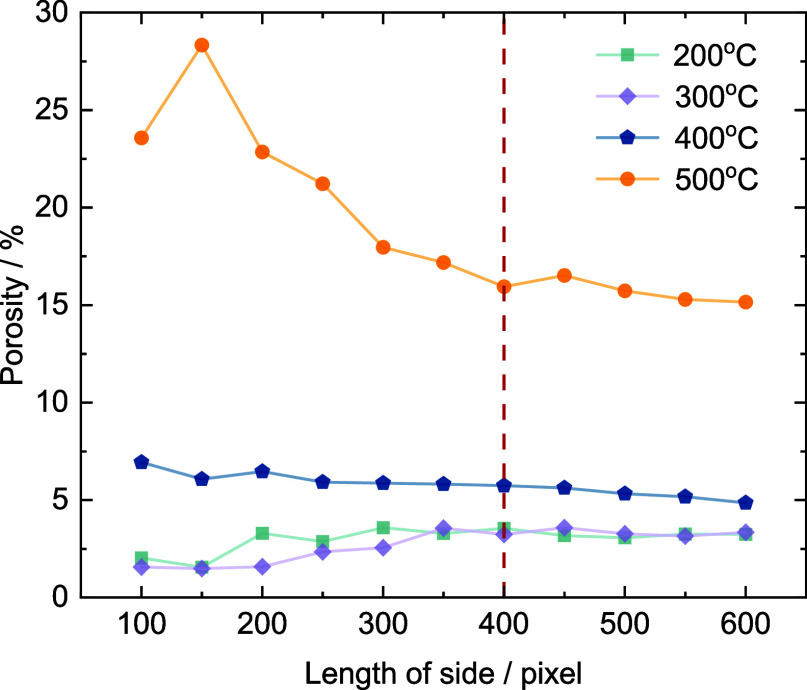
When the selected volume of the rock core exceeds a certain critical value, the equivalent parameters stabilize, which is defined as the representative elementary volume (REV) of the core.33 The variation of porosity with the volume size is shown in Figure 19. When the volume length exceeded 400 pixels, the porosities of all samples at different temperatures tended to some constant values. Therefore, a REV with a size of 400 × 400 × 400 pixels (an actual size of 20 mm) of the granite core was extracted. Based on the absolute permeability simulation module in AVZIO, the seepage characteristics of REVs after 5 cycles of high temperature and cold shock were analyzed to compare the seepage differences of pore-fracture networks with different damaged degrees. And the three-dimensional flow fields of REVs are shown in Figure 20.
Figure 19.
Selection of REV.
Figure 20.

(a–d) Flow field of REVs after 5 cycles of high temperature and cold shock.
As can be seen from Figure 20, within the flow velocity field, red and orange flow lines represent high velocities, while blue and green lines represent low velocities. At 200 °C, multiple streamlines converged in the corner of the REV, creating a localized channel with slow flow rates. Additionally, short and sparse streamlines were distributed in the middle region. This indicated limited pore space development and poor overall connectivity, with an absolute permeability of 13.79 μm2. When reaching 300 °C, streamlines lengthened and proliferated, corresponding to a steady rise in flow rates. Multicluster streamlines were distributed in the middle and upper regions of the REV, yet without any continuous through-flow. Nevertheless, pore connectivity and network development improved, raising the absolute permeability to 18.38 μm2. At 400 °C, the absolute permeability rose to 62.18 μm2, with continuous and smooth streamlines side by side, colored red and orange, indicating higher flow rates. Combined with Figure 13, the main seepage pattern was featured as a main fracture with secondary branch fractures. The increased flow line number and decentralized distribution pattern augmented the seepage capacity. Upon reaching 500 °C, the smooth streamlines densely packed at the center, acting as the primary seepage channel. This channel’s streamlines were predominantly red and orange, reflecting high overall flow rates and robust seepage capacity, with an absolute permeability of 1101.39 μm2. At this stage, large- and medium-sized fractures within the REV were interconnected to form a complex pore network, extending the seepage region across the entire REV.
As the cold shock temperature difference increased, the REV’s seepage characteristics evolved as follows: the streamlines multiplied, transitioning from a single seepage channel to a seepage face and ultimately to a complex seepage network. The streamlines distribution broadened from a localized region to a uniform full-region coverage. Lengthened streamlines and reduced tortuosity further reduced flow resistance, so the granite’s seepage capacity was significantly enhanced.
3.4. Heat Transfer Simulation Based on the Real Pore-Fracture Network of Damaged Cores
The heat recovery simulation for HDR was conducted based on the genuine pore-fracture network. First, the CT slices from damaged cores were imported to create the pore-fracture geometric model, then the thermal-fluid fields were added to compare the flow and heat transfer capacities of damaged HDR under different degrees of temperature shock.
The mass conservation equation, as known as the continuity equation, embodies the principle that matter is conserved in fluid flow, stipulating that the mass within a control volume remains constant. The mathematical formulation34 is as follows:
| 1 |
where ρ represents the density, u represents the velocity vector, and t represents time.
The momentum conservation equation describes how fluid momentum changes for incompressible fluids, an assumption made for computational simplicity. For the two-dimensional scenario, the equation35 is streamlined to
| 2 |
where μ represents the fluid dynamic viscosity and p represents the fluid pressure.
Every system involved in energy exchange must obey the conservation of energy. According to the first law of thermodynamics, the increase in an object’s internal energy equates to the sum of the increments in its thermal energy and the work done on it. For the specific system being discussed, this principle36 is mathematically expressed as
| 3 |
where T represents temperature, k represents the thermal conductivity, and Q represents the heat source term per unit volume.
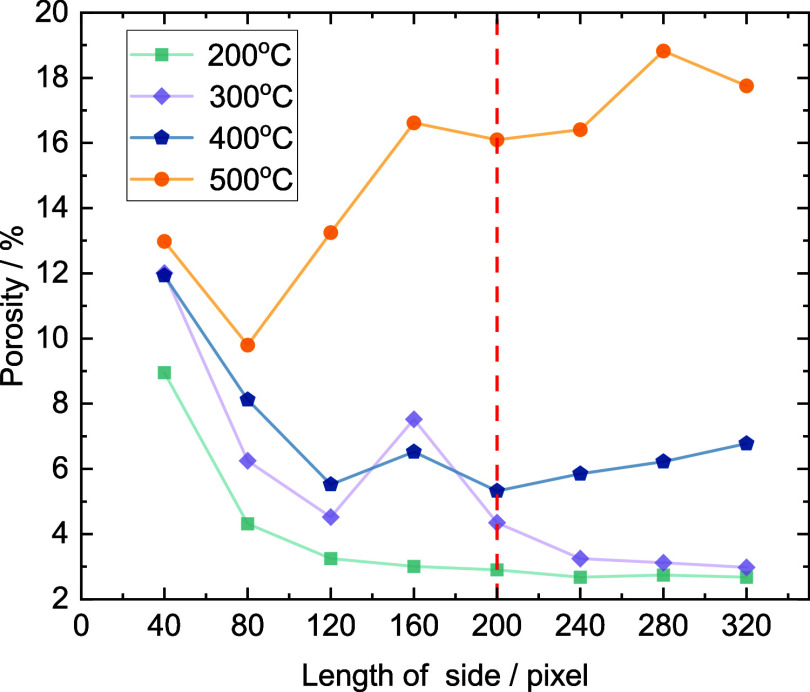
Four specific pore-fracture slices, from damaged cores exposed to five cycles of different high temperatures (200, 300, 400, and 500 °C) and cold shock, were selected for analysis. Image processing techniques such as cropping, filtering for noise reduction, and binarization have been utilized to generate a two-dimensional model that accurately reflects the fracture network under different impact temperatures. As shown in Figure 21, in this model, black represents fractures and voids, while white highlights represent the hot dry rock framework. However, the formation and development of fractures exhibit complexity and randomness, with significant size effects observed in various fracture characteristic parameters. Once the research scale of the fracture model exceeds a certain critical value, the characteristic parameters tend to stabilize, and this size can be considered as the representative element of the model. In this study, squares with different side lengths (40, 80, 120, 160, and 200 up to 320 pixels) were selected in the model, and the porosity of the fracture network model under these squares was calculated. It was found that as the side length increases, the porosity under different temperatures shows a trend of fluctuation and then tends to stabilize and moderate. A size of 200 pixels is the minimum dimension that tends to stabilize; therefore, a 200 × 200 pixels model was chosen for analysis, and it is believed that this model can reflect the actual conditions of fractures, the curve changes are shown in Figure 22. These slices were transformed into the pore-fracture geometric model and subsequently, seepage heat transfer simulation coupled with fluid-thermal fields was conducted in the Flow Heat Transfer module of COMSOL.
Figure 21.
2D fracture development process diagram.
Figure 22.
Selection of characterization length.
The genuine pore-fracture model was selected from the representative elementary region of 200 × 200 pixels (corresponding to an actual size of 10 × 10 mm). Boundary conditions were set with inflow from the left side and outflow from the right, no flow at the top and bottom, and an inlet-to-outlet pressure difference of 20 Pa. The fluid is defined as water under standard conditions, with an inlet temperature of 293 K. The temperatures of the hot dry rock matrix are 200, 300, 400, and 500 °C, corresponding to different thermal extraction scenarios. In the two-dimensional model grid generation, the numbers of grids are 21,654, 69,347, 27,019, and 126,512, respectively. Concurrently, in the computational fluid dynamics (CFD) simulation, the following assumptions are made:37 (1) the fluid is defined as an incompressible fluid; (2) the flow of fluid through the porous space can be regarded as creeping flow, which meets the laminar flow conditions, and the effect of gravity is neglected.38Figure 23 shows the fluid velocity distribution of the real pore fracture under different temperature conditions.
Figure 23.
(a–d) Flow velocity field of the pore fracture in different high-temperature reservoirs.
For the 200 °C geothermal reservoir, fractures were impermeable, resulting in minimal flow velocity below 10–12m/s. The flow was confined, with velocities diminishing toward the pore termini, asymptotically approaching 0. As for 300 °C reservoir, the formation of a penetrating fracture allowed for the unimpeded fluid channel. The flow area within the constricted channels decreased, while velocities increased. Within the intersection, flow velocities were relatively subdued, averaging between 0.01 and 0.06 m/s. The outlet flow rate was measured at 1.38 × 10⁻⁸ m3/s, indicating an enhanced seepage performance relative compared to 200 °C. When the reservoir temperature reached 400 °C, an interconnected fracture network emerged, maintaining a uniform flow velocity range of 0.01–0.07 m/s. Fluids entered from the left, encountering narrower constrictions where flow rates intensified, and flow velocities at fracture intersections were lower, with an average value of 0.04m/s. The exit flow rate peaked at 1.980 × 10⁻⁸ m3/s, reflecting a significant improvement in fluid seepage efficiency within the fracture network. For the extremely high-temperature reservoir of 500 °C, the fractures were extensively interconnected, creating a highly permeable network. The overall flow velocity averaged between 0.02 and 0.03m/s. Compared to the velocities at 300 and 400 °C conditions, a notable reduction was observed, attributable to the multiple branches of the fracture network. Nonetheless, the overall connectivity was improved, and so did the fluid migration capability, yielding the optimal seepage effect. The outlet flow rate for this stage was 3.33 × 10⁻⁸ m3/s.
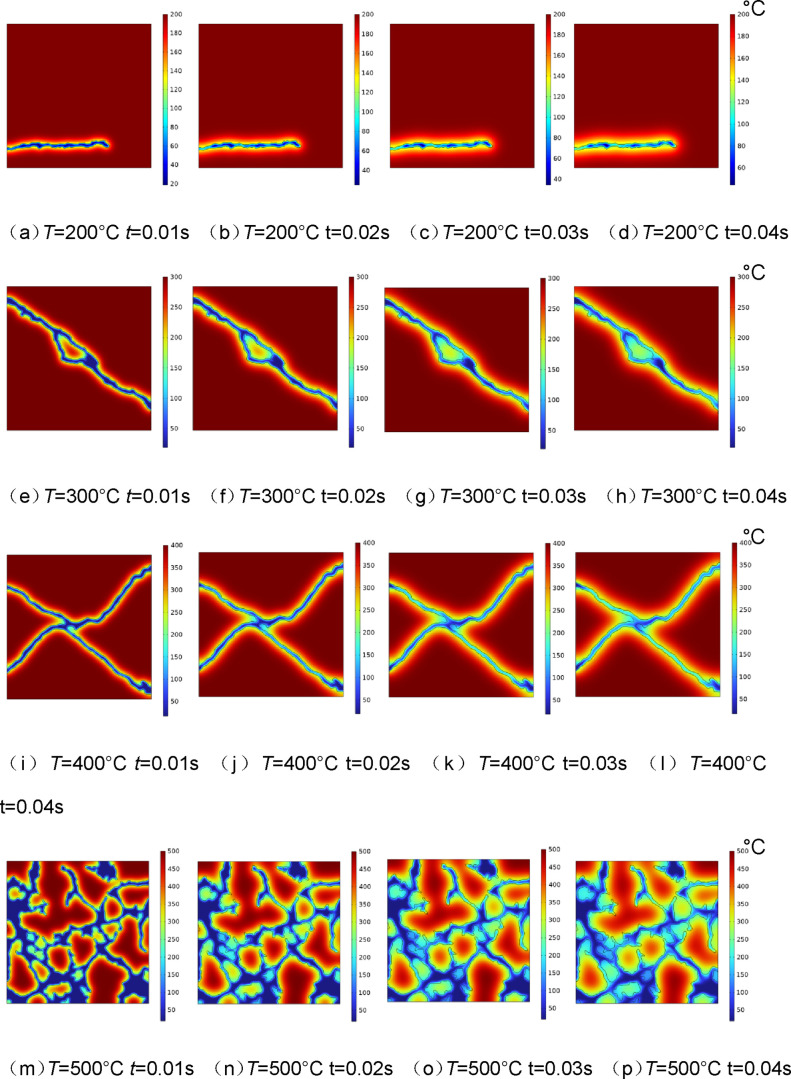
Flow and heat transfer simulations were conducted on the pore-fracture model across a spectrum of temperatures, with thermal reservoir temperatures set at 200, 300, 400, and 500 °C, and the fluid temperature initialized at 20 °C. The temperature difference between the fluid and the HDR is large, as the heat transfer process is very rapid, and the heat transfer of the four groups of samples basically enters the steady state within 0.08s. In order to more obviously compare the seepage and heat transfer capacity of pore-fracture networks with different development degrees, we selected four time nodes in the time interval of 0.04 s for analysis. Figure 24 captures the temperature distributions at sequential time points: t = 0.01 s, t = 0.02 s, t = 0.03 s, and t = 0.04 s, providing a snapshot of the thermal propagation through the damaged HDR.
Figure 24.
(a–p) Temperature distribution of HDR.
In the 300 and 400 °C geothermal reservoirs, the fluid flow through the fractures contributed to thermal conductivity and convection, leading to an overall increase in fluid temperature. Fluid temperature stratified near the fracture walls, with higher temperatures closer to the wall. Friction slowed the fluid velocity near the fracture wall, creating a boundary layer39 that absorbed heat more effectively from the HDR. Under these conditions, the fracture flow channels were simple and heat transfer in HDR was localized near the flow regions. At 0.04s, outlet fluid temperatures were recorded at 100.9 and 104.85 °C, respectively. As for the 500 °C reservoir, a complex pore-fracture network within the HDR enhanced the fluid’s heat absorption capacity. Compared to the HDRs at 300 and 400 °C, the entire region experienced a significant temperature reduction, indicating the superior seepage heat transfer of this network. On the one hand, the expansive pore-fracture space significantly increased the fluid’s heat transfer area, while the complexity of fractures intensified the fluid disturbance, both enhancing the heat transfer effect. On the other hand, the well-connected pore-fracture network facilitated fluid migration ability, allowing a higher flow rate to transport more heat. The average outlet temperature at 500 °C was 80.87 °C.
To quantitatively assess the seepage heat transfer capacity of the penetrating fractures at 300, 400, and 500 °C (no penetrating channel was formed at 200 °C), the heat exchange capacity of the fluid flow is denoted by φ, which depends on the fluid’s temperature and flow rate. The calculation formula is as follows:
| 4 |
where cp is the fluid’s specific heat capacity, V is the outlet flow rate, and ΔT is the temperature difference between the fluid’s inlet and outlet.
The calculated heat exchange capacities at 300, 400, and 500 °C were 4.51 × 10⁻⁸, 6.78 × 10⁻⁸, and 8.34 × 10⁻⁸ W, respectively. At 200 °C, the nonthrough fracture lacked effective seepage channels, resulting in the poorest heat transfer capacity. Further, the fracture development at 400 °C was superior to that at 300 °C, offering better seepage heat transfer. At 500 °C, the pore-fracture network achieved optimal connectivity and extensive heat transfer area, maximizing the flow heat transfer between the fluid and HDR.
3.5. Analysis of the Influence of Liquid Nitrogen Applied to Geothermal Mining
In the context of geothermal energy extraction, the application of liquid nitrogen fracturing presents considerable safety hazards, particularly pertaining to the risk of liquid nitrogen leakage. The vaporization ratio of liquid nitrogen at standard conditions is notably high, surpassing 1:600, which implies that upon leakage, it can swiftly transform into gas, drawing in substantial heat and precipitating a sharp decrease in local temperatures. Such a scenario may precipitate physical explosion risks, asphyxiation, and the potential for frostbite injuries. Moreover, the escape of liquid nitrogen could deplete the ambient air’s oxygen levels, leading to hypoxic conditions that endanger the health and safety of workers.
While liquid nitrogen is inherently nontoxic, its extensive utilization has the capacity to perturb the temperature equilibrium of soil and aquatic systems, consequently disrupting the local ecological balance. Within the sphere of hot dry rock geothermal resource development, the deployment of liquid nitrogen fracturing techniques may enhance the efficiency of heat retrieval. However, this approach could also result in the modification of subsurface thermal profiles, which may, in turn, exert influences on the growth patterns of vegetation and the dynamics of subterranean microbial communities.
In addition, the author also puts forward a feasible scheme for the treatment and disposal of large-scale liquid nitrogen. During the implementation of liquid nitrogen fracturing, there is a significant issue regarding the disposal of large quantities of liquid nitrogen. Currently, liquid nitrogen can be utilized as a cryogenic agent, leveraging its properties at ultralow temperatures to achieve rapid cooling and freezing. Volatile Organic Compounds (VOCs), which are organic compounds with high vapor pressure at ambient conditions, are not only a crucial component of air pollutants but also a primary precursor for ozone pollution. The control and management of VOC emissions are of great significance for environmental protection, economic development, and human health. The deep cryogenic treatment technology with liquid nitrogen has made notable progress in the management of volatile organic waste gases.40 This technology uses the low-temperature characteristics of liquid nitrogen to cool organic waste gases to below −120 °C, thereby effectively recovering and purifying VOCs, and simultaneously addressing the disposal issue of large-scale liquid nitrogen. Moreover, the nitrogen gas formed from the vaporization of liquid nitrogen does not pollute the atmosphere, and it can be recycled and utilized industrially, creating a circular use of nitrogen gas resources.
Under typical operating conditions for geothermal energy extraction, the fracturing and damage to the rock mass can facilitate heat exchange between the fluid and the rock, thus enhancing geothermal recovery. However, recent research by Jiang et al.41 has demonstrated that geothermal energy production can induce significant geological hazards, such as earthquakes and ground subsidence, which threaten the sustainability of operations and pose potential catastrophic risks to nearby populations. These hazards are driven by various physical mechanisms, including reservoir pressure depletion due to fluid loss, poroelastic shrinkage, thermoelastic shrinkage, and aseismic fault slip. Notably, in projects like the Habanero in Australia and the Pohang EGS reservoir modification in South Korea, formation fracture pressures exceeded 100 MPa. The Mw5.4 earthquake in Pohang, South Korea, in November 2017 was attributed to dry rock fracturing, and the Basel EGS pilot project in Switzerland was shut down in 2006 due to an induced earthquake. Consequently, researchers are focusing on strengthening the fundamental theories and applied technologies related to dry-hot rock mining, aiming to develop methods for creating storage in complex dry-hot rock seam networks. This involves constructing complex seam networks to reduce the risk of induced earthquakes, which is crucial for the safe and sustainable extraction of geothermal energy.
4. Conclusions
In this study, granite samples were treated with 5 cycles of high temperature and liquid nitrogen cold shock, and how the temperature shock effect of liquid nitrogen affects HDR was comprehensively analyzed. First, the three-dimensional pore-fracture structures within the damaged HDRs were reconstructed using the digital core method, enabling detailed visualization of the pore-fracture networks. Then, topological models were developed to quantitatively analyze pores and throats, thereby assessing the topological accessibility of these networks. Lastly, seepage heat transfer numerical simulations were performed based on the actual pore-fracture networks to compare the heat exchange efficiency of damaged cores. These analyses can reveal the mechanisms of pore-fracture development and heat transfer enhancement of HDR under liquid nitrogen cold shock. The main conclusions are as follows:
-
1)
As the temperature rose form 200 to 500 °C, the effective porosity increased from 0.79% to 12.84%, while the corresponding effective fractal dimension increased from 1.04 to 1.42. At 200 and 300 °C, pores and fractures developed independently with minimal connectivity and complexity. In contrast, at 400 and 500 °C, the high-temperature differential during the cold shock induced thermal stress and grain expansion, promoting the formation of new fractures and the enlargement of existing ones. This led to the transformation of micropores into macropores, the connection of isolated pores, and the formation of a complex pore-fracture network, enhancing the overall complexity and connectivity.
-
2)
The topologically equivalent PNM was established. At 200–400 °C, with the enhanced temperature shock effect, the total pore count improved from 180 to 972. The pore radii were concentrated between 350 and 550 μm, while throat lengths mostly ranged from 1000 to 3000 μm. At 500 °C, the pore count escalated to 2428, with substantial growth in both pore size and throat length. The coordination number ranged from 1 to 59, peaked with 952 units between 10 and 20, indicating the highest level of pore connectivity at this stage.
-
3)
Based on the actual effective pore-fracture network, seepage simulations were performed on selected REVs. The permeabilities of the samples were measured at 13.79, 18.38, 62.18, and 1101.39 μm2, respectively. As the temperature shock effect intensified, the flow lines grew from a singular seepage channel to a seepage face and finally to a complex seepage network. The streamlines distribution broadened from a localized region to a uniform full-region coverage. Lengthened streamlines and reduced tortuosity further reduced flow resistance, so the seepage capacity of HDR was significantly enhanced.
-
4)
Flow and heat transfer simulations were conducted to evaluate the heat extraction performance of the modified HDR. At 200 °C, small fracture and poor connectivity resulted in the lowest seepage heat transfer. At 300 °C, fractures gradually expanded, with an outlet flow rate of 1.38 × 10⁻⁸ m3/s. At 400 °C, the outlet flow rate increased to 1.66 × 10⁻⁸ m3/s, and the fluid heat transfer capacity reached 7.54 × 10⁻⁸ W, localized around fractures. At 500 °C, a highly connected pore-fracture network formed, enhancing overall heat exchange efficiency, with a flow heat exchange of 8.34 × 10⁻⁸ W and a fluid outlet temperature of 80.87 °C.
The liquid nitrogen cyclic fracturing technology involves the periodic injection of cryogenic liquid nitrogen, leveraging thermal effects to induce fatigue damage in granite, promoting the formation, development, and propagation of fractures, and creating a complex network of fractures and voids, thereby enhancing the reservoir’s permeability characteristics. As a clean fracturing medium, liquid nitrogen poses no environmental pollution, avoiding the extensive use of water resources and potential water contamination associated with traditional hydraulic fracturing, aligning with the requirements for green, economic, and efficient development of hot dry rock resources. Currently, based on experimental research and numerical simulation methods, the mechanisms of liquid nitrogen cyclic fracturing and the morphological characteristics of the fracture network have been thoroughly investigated, providing a theoretical basis and experimental foundation for the development of hot dry rock using liquid nitrogen cyclic fracturing.
The liquid nitrogen fracturing process parameters were optimized, including the number of cycles and injection pressure, and in-depth analysis of the granite fracturing mechanisms was conducted. Based on the actual fracture network of granite, a thermohydromechanical coupling model was established and three-dimensional numerical simulations were carried out to assess and optimize the efficiency of geothermal heat extraction from hot dry rocks. The application of liquid nitrogen fracturing technology was explored in different types of hot dry rock reservoirs, as well as its integration with other enhanced geothermal system (EGS) technologies to enhance the overall efficiency and sustainability of geothermal energy extraction.
Acknowledgments
This work was financially supported by the Natural Science Foundation of Jiangsu Province (BK20231069), the National Natural Science Foundation of China (52304270 and 51774278), and the Postgraduate Practice Innovation Project Foundation of Jiangsu Province (SJCX24_1435).
The authors declare no competing financial interest.
References
- Zaigham N. A.; Nayyar Z. A. Renewable Hot Dry Rock Geothermal Energy Source and Its Potential in Pakistan. Renew. Sustain. Energy Rev. 2010, 14 (3), 1124–1129. 10.1016/j.rser.2009.10.002. [DOI] [Google Scholar]
- Xu T.; Zhang Y.; Zeng Z.; Bao X. Advancements in Enhanced Geothermal Systems (Hot Dry Rock) Development Technology. Sci. Technol. Rev. 2012, 30 (32), 42–45. [Google Scholar]
- Li G.; Wu X.; Song X.; Zhou S.; Li M.; Zhu H.; Kong Y.; Huang Z. Current Status and Challenges of Hot Dry Rock Geothermal Resource Exploitation Technology. Pet. Sci. Bull. 2022, 7 (3), 343–364. [Google Scholar]
- Ren Y.; Kong Y.; Pang Z.; Wang J. A Comprehensive Review of Tracer Tests in Enhanced Geothermal Systems. Renew. Sustain. Energy Rev. 2023, 182, 113393 10.1016/j.rser.2023.113393. [DOI] [Google Scholar]
- Xu T.; Hu Z.; Li S.; Jiang Z.; Hou Z.; Li F.; Liang X.; Feng B. Enhanced Geothermal Systems: International Research Progress and Current Status of Research in China. Acta Geol. Sin. 2018, 92 (9), 1936–1947. [Google Scholar]
- Kang F.; Jia T.; Li Y.; Deng J.; Tang C.; Huang X. Experimental Study on the Physical and Mechanical Variations of Hot Granite under Different Cooling Treatments. Renew. Energy 2021, 179, 1316–1328. 10.1016/j.renene.2021.07.132. [DOI] [Google Scholar]
- Zhang W.; Guo T.; Qu Z.; Wang Z. Research of Fracture Initiation and Propagation in HDR Fracturing under Thermal Stress from Meso-Damage Perspective. Energy 2019, 178, 508–521. 10.1016/j.energy.2019.04.131. [DOI] [Google Scholar]
- Hu Z.; Xu T.; Moore J.; Feng B.; Liu Y.; McLennan J.; Yang Y. Investigation of the Effect of Different Injection Schemes on Fracture Network Patterns in Hot Dry Rocks - A Numerical Case Study of the FORGE EGS Site in Utah. J. Nat. Gas Sci. Eng. 2022, 97, 104346 10.1016/j.jngse.2021.104346. [DOI] [Google Scholar]
- Liu H.; Shi Y.; Fang Z.; Liu J.; Zhang L.; Tong R. Seepage Characteristics of Thermally and Chemically Treated Mesozoic Granite from Geothermal Region of Liaodong Peninsula. Environ. Earth Sci. 2021, 80 (17), 599. 10.1007/s12665-021-09838-6. [DOI] [Google Scholar]
- Luo J.; Zhu Y.; Guo Q.; Tan L.; Zhuang Y.; Liu M.; Zhang C.; Zhu M.; Xiang W. Chemical Stimulation on the Hydraulic Properties of Artificially Fractured Granite for Enhanced Geothermal System. Energy 2018, 142, 754–764. 10.1016/j.energy.2017.10.086. [DOI] [Google Scholar]
- Guo Q.; He T.; Zhuang Y. Q.; Luo J.; Zhang C. H. Expansion of Fracture Network in Granites via Chemical Stimulation: A Laboratory Study. Earth Sci. Front. 2020, 27 (1), 159–169. [Google Scholar]
- Sun Y.Evolution of Physical and Mechanical Properties and Damage Mechanism of High-Temperature Granite under Liquid Nitrogen Cryogenic Impact Ph.D. Dissertation, China University of Mining and Technology: 2023. [Google Scholar]
- Sun Y.; Zhai C.; Cong Y. Z.; Zheng Y. F.; Tang W.; Wang S.; Lai Y. S.; Wang Y.; Chen A. K.. Evolution of Fracture and Damage Mechanism of Hot Dry Rock Induced by Thermal Shock Effect. J. China Coal Soc. 2024. [Google Scholar]
- McDaniel B. W.; Grundmann S. R.; Kendrick W. D.. et al. Field applications of cryogenic nitrogen as a hydraulic fracturing fluid. In SPE Annual Technical Conference and Exhibition?; SPE: 1997, 561-572. [Google Scholar]
- Zheng X.; Zhang G.; Zheng S. Study on the Mechanism of Crack Formation in Rock-like Materials Induced by Liquid Nitrogen at Ultra-low Temperatures. Chin. J. Rock Mech. Eng. 2022, 41 (5), 889–903. [Google Scholar]
- Deng X.Temperature Fluctuation Damage Experimental Study on Hot Dry Rock M.S. Thesis, China University of Petroleum (Beijing): 2019. [Google Scholar]
- Gao F.; Cai C.; Yang Y. Experimental Research on Rock Fracture Failure Characteristics under Liquid Nitrogen Cooling Conditions. Results Phys. 2018, 9, 252–262. 10.1016/j.rinp.2018.02.061. [DOI] [Google Scholar]
- Cha M.; Alqahtani N. B.; Yin X.; Wang L.; Yao B.; Kneafsey T. J.; Miskimins J. L.; Wu Y.-S. Propagation of Cryogenic Thermal Fractures from Unconfined PMMA Boreholes. Energies 2021, 14 (17), 5433. 10.3390/en14175433. [DOI] [Google Scholar]
- Sun Y.; Zhai C.; Xu J.; Yu X.; Cong Y.; Zheng Y.; Tang W.; Li Y. Damage and Failure of Hot Dry Rock under Cyclic Liquid Nitrogen Cold Shock Treatment: A Non-Destructive Ultrasonic Test Method. Nat. Resour. Res. 2022, 31 (1), 261–279. 10.1007/s11053-021-10005-8. [DOI] [Google Scholar]
- Sun Y.; Zhai C.; Yu X.; Xu J.; Cong Y.; Zheng Y.; Tang W.; Li Y. Pore Structure and Damage Evaluation of Hot Dry Rocks in Enhanced Geothermal System by Combining Electrical Resistivity, Ultrasonic Waves and Nuclear Magnetic Resonance. Nat. Resour. Res. 2023, 32 (4), 1559–1578. 10.1007/s11053-023-10210-7. [DOI] [Google Scholar]
- Sun Y.; Zhai C.; Xu J.; Cong Y.; Zheng Y. Experimental Study on Pore Structure Evolution of Coal in Macroscopic, Mesoscopic, and Microscopic Scales during Liquid Nitrogen Cyclic Cold-Shock Fracturing. Fuel 2021, 291, 120150 10.1016/j.fuel.2021.120150. [DOI] [Google Scholar]
- Freire-Lista D. M.; Fort R.; Varas-Muriel M. J. Thermal Stress-Induced Microcracking in Building Granite. Eng. Geol. 2016, 206, 83–93. 10.1016/j.enggeo.2016.03.005. [DOI] [Google Scholar]
- Sun Y.; Zhai C.; Xu J.; Cong Y.; Qin L.; Zhao C. Characterisation and Evolution of the Full Size Range of Pores and Fractures in Rocks under Freeze-Thaw Conditions Using Nuclear Magnetic Resonance and Three-Dimensional X-Ray Microscopy. Eng. Geol. 2020, 271, 105616 10.1016/j.enggeo.2020.105616. [DOI] [Google Scholar]
- Wang G.; Shen J.; Chu X.; Cao C.; Jiang C.; Zhou X. Comprehensive Characterization and Analysis of High-Order Coal Fracture and Porosity Structure Based on CT Three-Dimensional Reconstruction. J. China Coal Soc. 2017, 42 (8), 2074–2080. [Google Scholar]
- Li X.; Wei W.; Wang L.; Cai J. Fractal Dimension of Digital 3D Rock Models with Different Pore Structures. Energies 2022, 15 (20), 7461. 10.3390/en15207461. [DOI] [Google Scholar]
- Sepehri E.; Siavashi M. Pore-Scale Direct Numerical Simulation of Fluid Dynamics, Conduction and Convection Heat Transfer in Open-Cell Voronoi Porous Foams. Int. Commun. Heat Mass Transfer 2022, 137, 106274 10.1016/j.icheatmasstransfer.2022.106274. [DOI] [Google Scholar]
- Tian Z.; Zhao Z.; Zhou Y.; Zhao C. Simulation Study on Seepage in Fractured Media Based on Lattice Boltzmann Method. Coal Technol. 2017, 36 (11), 181–183. [Google Scholar]
- Sun Y.; Zhai C.; Ma H.; Xu J.; Yu X.; Wang Y. Changes of Coal Molecular and Pore Structure under Ultrasonic Stimulation. Energy Fuels 2021, 35 (12), 9847–9859. 10.1021/acs.energyfuels.1c00621. [DOI] [Google Scholar]
- Liu H.; Tang Q.; Yang J. Application of Improved Histogram Equalization and Retinex Algorithm in Grayscale Image Enhancement. Acta Electron. Sin. 2014, 31 (5), 525–532. [Google Scholar]
- Tang Y.; Zhu Y.; Liu Y.; Gao X. Current Status and Prospects of CT Image Ring Artifact Removal Methods. J. Comput. Appl. 2024, 44 (3), 890–900. [Google Scholar]
- Muneyasu M.; Nishi N.; Hinamoto T. A New Adaptive Center Weighted Median Filter Using Counter Propagation Networks. J. Frankl. Inst. 2000, 337 (5), 631–639. 10.1016/S0016-0032(00)00022-3. [DOI] [Google Scholar]
- Zhao G.; Zhang L.; Wu F. Application of an Improved Median Filtering Algorithm in Image Denoising. Appl. Opt. 2011, 32 (4), 678–682. [Google Scholar]
- Usol’tseva O. M.; Tsoi P. A. The Influence of Size Effect on Strength and Deformation Characteristics of Different Types of Rock Samples. IOP Conf. Ser. Earth Environ. Sci. 2021, 720 (1), 012089 10.1088/1755-1315/720/1/012089. [DOI] [Google Scholar]
- Alves M. A.; Oliveira P. J.; Pinho F. T. Numerical Methods for Viscoelastic Fluid Flows. Annu. Rev. Fluid Mech. 2021, 53 (1), 509–541. 10.1146/annurev-fluid-010719-060107. [DOI] [Google Scholar]
- Budarin V. Transformation of the Equation of Motion in Stresses for an Incomressible Fluid. East. - Eur. J. Enterp. Technol. 2015, 2 (7), 38. 10.15587/1729-4061.2015.39886. [DOI] [Google Scholar]
- Batcho P. F. The Energy Operator and New Scaling Relations for the Incompressible Navier--Stokes Equations. SIAM J. Appl. Math. 2001, 62 (1), 70–93. 10.1137/S0036139999354121. [DOI] [Google Scholar]
- Zhang J.; Liu X.; Chen D.; Yin Z. An Investigation on the Permeability of Hydrate-Bearing Sediments Based on Pore-Scale CFD Simulation. Int. J. Heat Mass Transfer 2022, 192, 122901 10.1016/j.ijheatmasstransfer.2022.122901. [DOI] [Google Scholar]
- Liu X.; Zhang J.; Bhawangirkar D. R.; Jiao H.; Li Q.; Yin Z. Effect of Particle Size Distribution Variability on the Permeability of Hydrate-Bearing Sediments: A CFD Study. Gas Sci. Eng. 2024, 126, 205335 10.1016/j.jgsce.2024.205335. [DOI] [Google Scholar]
- Antoš P.; Kuznetsov S. Experimental Study of a Boundary Layer on a Heated Flat Plate. EPJ. Web Conf. 2019, 213, 02002. 10.1051/epjconf/201921302002. [DOI] [Google Scholar]
- Xu H.; Xu X. F.; Chen L. B.; Guo J.; Wang J. J. Study on Deep Cryogenic Recovery Technology of VOCs Based on Liquid Nitrogen Condensation. Oil Gas Field Environ. Prot. 2022, 32 (6), 13–18. [Google Scholar]
- Jiang G.; Barbour A. J.; Skoumal R. J.; Materna K.; Taron J.; Crandall-Bear A. Relatively Stable Pressure Effects and Time-Increasing Thermal Contraction Control Heber Geothermal Field Deformation. Nat. Commun. 2024, 15 (1), 5159. 10.1038/s41467-024-49363-1. [DOI] [PMC free article] [PubMed] [Google Scholar]


