Abstract
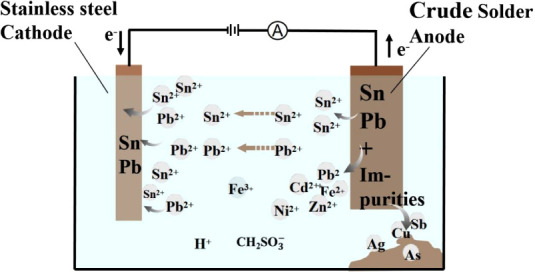
At present, the refining of crude solder has many drawbacks such as high energy consumption, high environmental pollution, equipment corrosion, and low current efficiency. Therefore, a new technique for refining crude solder is of great practical importance. In this work, the electrorefining of crude solder in methanesulfonic acid (MSA) medium was studied. The conductivities of tin—MSA solutions had been measured and modeled to characterize the electrolyte. The effects of the electrorefining conditions on the electrorefining process were investigated systematically. The cell voltage, current efficiency, and fine solder appearance were used to characterize the electrorefining performance. Some operating parameters of the electrorefining process are established as follows: current density 207 A/m2, tin concentration 120–160 g/L, free-MSA concentration 90–120 g/L, electrode spacing 4 cm, and temperature 305.15–315.15 K. Under these conditions, the average cell voltage is 0.30 V and the current efficiency is 99.31%. The total content of tin and lead of the fine solder with good product appearance is >99.99%. This technique offers low energy consumption, high productivity, and low environmental pollution.
1. Introduction
Tin compounds, due to their special physical and chemical properties, are widely used in solders, chemical industry, tin plate, glass, electronic, catalysts, and so on.1 The main refining techniques of crude solder are pyrorefining and electrorefining.2 The pyrorefining process brings some drawbacks such as high energy consumption and high environmental pollution. In contrast, electrorefining has a lot of advantages, such as high recovery of precious metals, low energy consumption, and low environmental pollution. The electrolytes used in the electrorefining of crude solder are mainly acidic electrolytes and alkali electrolytes.3−6 Compared with alkali electrolytes, acidic electrolytes have more advantages such as stabilization and low production costs; therefore, they are more widely used in the industry. At present, sulfuric acid and silicofluoric acid are acidic electrolytes. Unfortunately, some problems such as environmental pollution, equipment corrosion, high energy consumption, and low current efficiency are also exposed in the electrorefining process in the electrolytes, as mentioned before.7 Therefore, a new electrolyte for the electrorefining of crude solder is of great practical importance. MSA has some properties including low toxicity, high saturation metal salt solubility, high conductivity, wider operating window, and ease of effluent treatment.8 Furthermore, the metal ions in the solution are not easy to oxidize and hydrolyze.
In recent years, MSA, as a new green electrolyte, has been used in some researches. Bingjie Jin9 studied crude lead electrorefining in MSA medium. Finally, >99.99% pure lead with good product appearance is obtained at a widely operating parameter range. In comparison to tin or tin alloy electroplating from MSA medium,10−12 the literature on electrorefining process of crude solder in MSA medium is inadequate.
In this work, the conductivities of tin–MSA solutions were measured to characterize the electrorefining medium, and the electrorefining process of crude solder in MSA medium was investigated. The variables of interest in electrorefining behavior are current density, tin concentration, free-MSA concentration, electrode spacing, and temperature.
2. Materials and Methods
2.1. Materials
The crude solder plates, which were used as anodes, were obtained from a company in China. The chemical composition is given in Table S1. 316 L stainless steel sheets, which were used as cathodes, were available in the hydrometallurgical laboratory of the Kunming University of Science and Technology. Reagents such as MSA (≥99.0 wt %), stannous methanesulfonate solution (50 wt %), and stannous oxide (99.99 wt %) were also provided by the company. The solutions that were used in the experiments were prepared with stannous oxide, MSA, and deionized water.
2.2. Equipment
The conductivity test equipment was a DDS-307A conductivity meter from Inesa Scientific Instrument Co., Ltd. The main electrorefining equipment included a constant temperature water bath, a GEP891126 AC DC power supplier, a voltmeter, and a self-made rectangular cell.
2.3. Experimental Principle
The electrochemical system for electrorefining of crude solder in the MSA medium is as follows:
The main anodic reaction and cathodic reaction under direct current are expressed by eq 1 and the reverse reactions, respectively.
| 1 |
In the electrorefining process, metal couples with higher reduction potentials such as silver, copper, arsenic, and antimony will not dissolve into the electrolyte and eventually be left as the anode slime. Less noble metals such as Fe, Zn, Al, Cd, and Ni with lower potentials will preferentially dissolve at the anode but cannot be reduced at the cathode and accumulate in the electrolyte.
2.4. Procedures
2.4.1. Conductivity Test
In order to determine the conductivity of stannous methylate under predetermined conditions, a theoretical amount of stannous oxide powder was weighed accurately according to eq 2 and mixed with 30 mL of deionized water in a 100 mL round-bottomed flask. Then, a theoretical amount of MSA was added into the round-bottomed flask using a buret. The dissolution process of stannous oxide powder was carried out in a constant temperature oil bath under 398.15 K. When the stannous oxide powder was dissolved completely, the tin–MSA solution in the round-bottomed flask was transferred into a 100 mL measuring flask, and the volume was made up to 100 mL. A sample of 10 mL of the solution was placed in a test tube, which in turn was placed on a test tube holder for performing the conductivity test. The test solution was fresh in each bath test.
| 2 |
2.4.2. Electrorefining Process
The anode of area 6 cm2 and cathode of area 9 cm2 were masked with insulation tape to expose only the active areas. The reaction area of the electrodes was cleaned with distilled water. Then, the electrodes were dried, weighed, and placed in a 250 mL rectangular polypropylene plastic cell. The electrodes were connected to a DC power supply and a voltmeter. The electrolyte was fed into the cell and circulated by peristaltic pump, the DC power was turned on, and the electrorefining time was recorded with a timer. When each electrorefining experiment was complete, the anode and cathode were taken out of the cell. The fine solder was washed with distilled water, dried at room temperature, and then weighed. The anode slime was separated from the anode scrap and electrolyte, washed with deionized water, and dried in an oven for 24 h. The fine solder was dissolved, and then, the chemical compositions were analyzed by AAS or ICP-MS. The appearance and surface morphology were recorded by camera or SEM, respectively. In the electrorefining process, the effects of tin concentration, free-MSA concentration, current density, electrode spacing, and temperature were investigated systematically. The cell voltage was measured by voltmeter at 15-min intervals. The cathodic current efficiency was calculated by eq 3 according to the product that mainly contained tin.
| 3 |
where:
Q is the electrochemical equivalent in 2.215 g/A·h
m is the fine solder weight in g
I is the current in A
t is the time in h.
All electrorefining experiments were conducted based on the conditions provided in Table S2.
3. Results and Discussion
3.1. Conductivity of Tin–MSA Solution
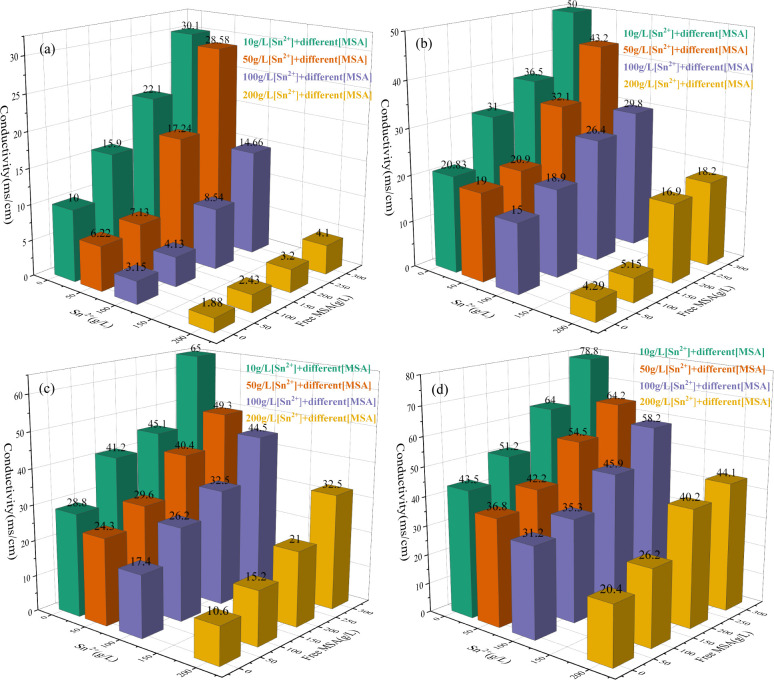
The conductivities of tin–MSA solutions were measured at temperatures ranging from 298.15 to 353.15 K, tin concentrations ranging from 10 to 200 g/L, and free-MSA concentrations ranging from 10 to 300 g/L. The test range of conductivity is enough to guide the electrorefining process of crude solder from MSA medium in this work. The results are shown in Figure 1.
Figure 1.
Effect of temperature, tin concentration, and free-MSA concentration on conductivities of tinMSA solutions. (a) 298.15 K, (b) 318.15 K, (c) 333.15 K, and (d) 353.15 K.
The results indicate that the conductivities of tin–MSA solutions increase with an increase of the free-MSA concentration and temperature, respectively, and decrease with an increase of tin concentration for free-MSA concentrations of 10–300 g/L. A mathematical model for all of the conductivities developed by SPSS statistical software is given as eq 4.
| 4 |
where:
σ is the conductivity, in mS/cm
T is the temperature in K
[Sn] is the tin concentration in g/L
[MSA] is the free-MSA concentration in g/L
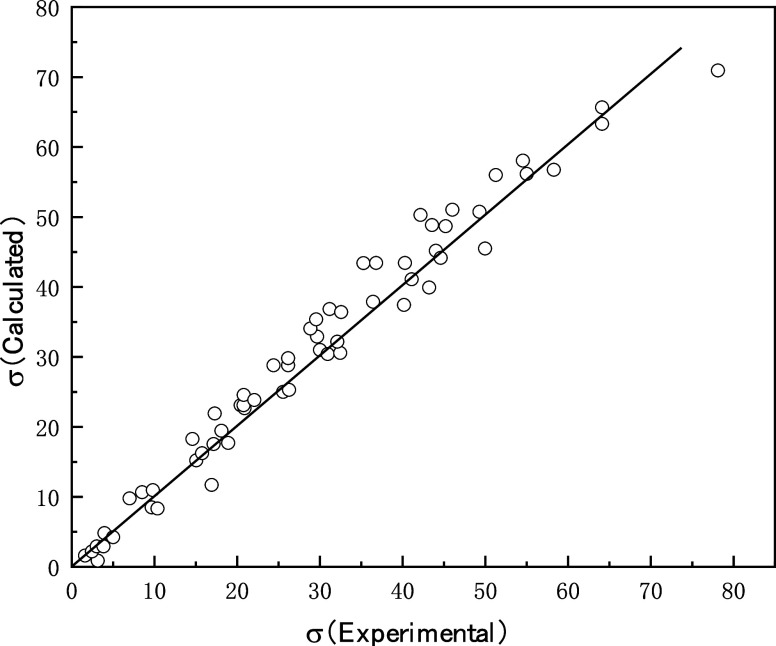
The calculated and measured values are compared in Figure 2 and show very good agreement. The relative mean square of errors was calculated as 0.21 (eq 5).
| 5 |
Figure 2.
Comparison of calculated and tested values of conductivities.
3.2. Electrorefining Behavior
3.2.1. Effect of Current Density
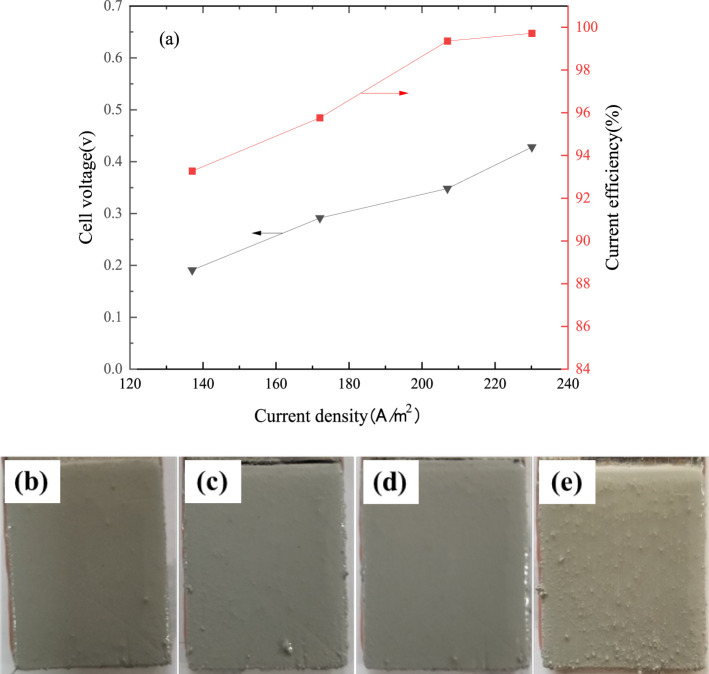
The effect of current density on current efficiency, cell voltage, and surface appearance of the fine solder was studied. Figure 3a indicates that the cell voltage increases from 0.19 to 0.43 V when the current density increases from 137 to 230 A/m2. It is because the cell voltage is positively correlated with the current density. The current efficiency increases from 93.25% to 99.71% when the current density increases from 137 to 230 A/m2. This is because the overpotential for hydrogen evolution at the cathode increases with an increase of current density, which leads to further reducing the possibility of hydrogen production and thus increasing the current efficiency. When the current density is 210 A/m2, the current efficiency is close to 100%, so even if the current density is increased to 230 A/m2, the increase in current efficiency is negligible.
Figure 3.
Effect of current density on cell voltage and current efficiency (tin concentration 130 g/L, free-MSA concentration 120 g/L, electrode spacing 4.0 cm, temperature 295.15 K, 4 h; (b) 137 A/m2, (c) 172 A/m2, (d) 207A/m2, and (e) 230 A/m2).
Figure 3b–e shows that the surface appearance of the fine solder is smooth at 137–207 A/m2. However, coarse crystalline particles are generated on the cathodic surface when the current density increases to 230 A/m2. It may be because the growth of nuclei is faster than the generation of nuclei at high current densities. At the same time, the mass of the fine solder increases with increasing current density, which will inevitably result in rougher deposits. Considering the cell voltage, current efficiency, and fine solder appearance, a current density of 207 A/m2 is reasonable for further experimentation.
3.2.2. Effect of Tin Concentration
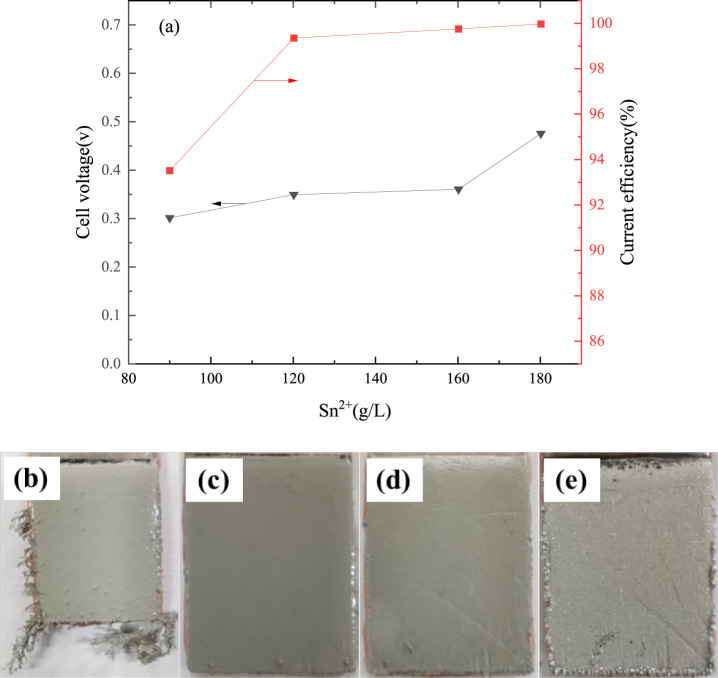
The effect of tin concentration on cell voltage and current efficiency is shown in Figure 4a. It can be seen that the current efficiency increases from 93.53% to 99.99% when the tin concentration increases from 90 to 180 g/L. This is due to the fact that the rate of the electrochemical reduction of Sn (II) increases with increasing concentration according to the reverse reaction of eq 1. Meanwhile, the amount of tin involved in the reduction at the cathode surface is limited and the mass transfer rate is low when the initial tin concentration in the electrolyte is low. However, the mass transfer rate increases with an increase of tin concentration. Figure 4 also shows that the cell voltage increases with an increase in tin concentration. It increases from 0.30 to 0.48 V when the tin concentration increases from 90 to 180 g/L. This is because the conductivity of the solution gradually decreases with an increase of tin concentration, which coincides with the previous studies of conductivity of tin–MSA solution with varying tin concentrations.
Figure 4.
Effect of tin concentration on cell voltage and current efficiency (current density 207 A/m2, free-MSA concentration 120 g/L, electrode spacing 4.0 cm, temperature 295.15 K, 4 h; (b) 90, (c) 120, (d) 160, and (e) 180 g/L).
Figure 4b–e shows the effect of tin concentration on the surface appearance of the fine solder. The obvious dendritic crystals generate at the cathodic edge when an initial tin concentration is 90 g/L and the dendrites become more obvious with an extension of electrolysis time. This is due to the fact that the electric field is not uniform. The ions preferentially discharge at the dendritic crystals, which suffer stress at the edges. Furthermore, it is easy to cause a concentration polarization at the cathodic edge and the bulk electrolyte at a low concentration of tin. The concentration difference between the surface of the cathode and the bulk electrolyte becomes smaller with an increase of tin concentration. At the same time, the growth opportunities of crystal particles are equal in all directions. So, the fine solder grows uniformly and densely under a tin concentration of 120–180 g/L. Considering the cell voltage, current efficiency, and fine solder appearance, a tin concentration from 120 to 160 g/L is reasonable for further experimentation.
3.2.3. Effect of Free-MSA Concentration
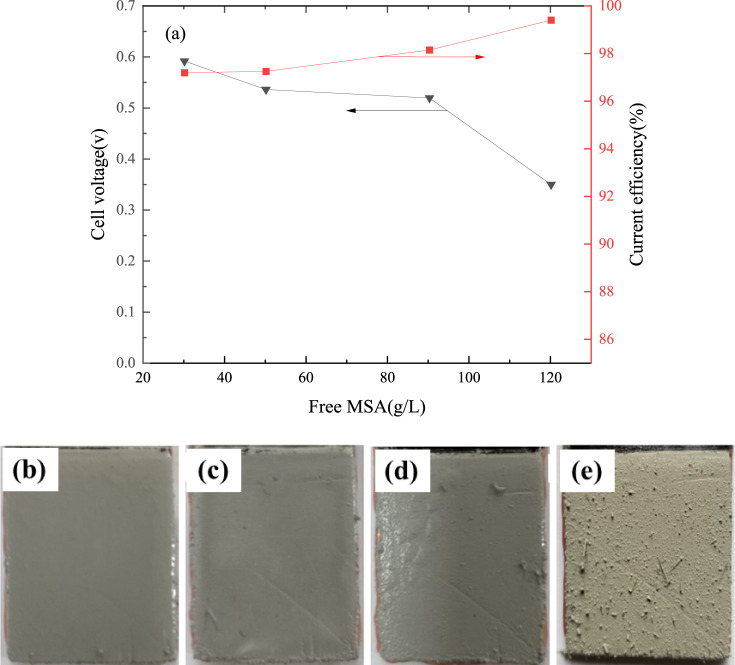
The effect of free-MSA concentration on cell voltage and current efficiency is shown in Figure 5a. It shows that the current efficiency increases from 97.11% to 99.34% and cell voltage decreases from 0.59 to 0.35 V with an increase of free-MSA concentration from 30 to 120 g/L, respectively. These results coincide with the observed conductivities of tin–MSA solutions.
Figure 5.
Effect of free-MSA concentration on cell voltage and current efficiency (current density 207 A/m2, tin concentration 130 g/L, electrode spacing 4.0 cm, temperature 295.15 K, 4 h; (b) 30 g/L, (c) 50 g/L, (d) 90 g/L, and (e) 120 g/L).
Figure 5b–e shows the effect of the free-MSA concentration on the surface appearance of the fine solder. The results show that the grains of the fine solder were deposited at coarse size and the fine solder was not dense with an increase of free-MSA concentration. It was because of the increase of hydrogen evolution on the cathode. Considering the cell voltage, current efficiency, and fine solder appearance, a free-MSA concentration from 90 g/L to 120 g/L is reasonable for further experimentation.
3.2.4. Effect of Electrode Spacing
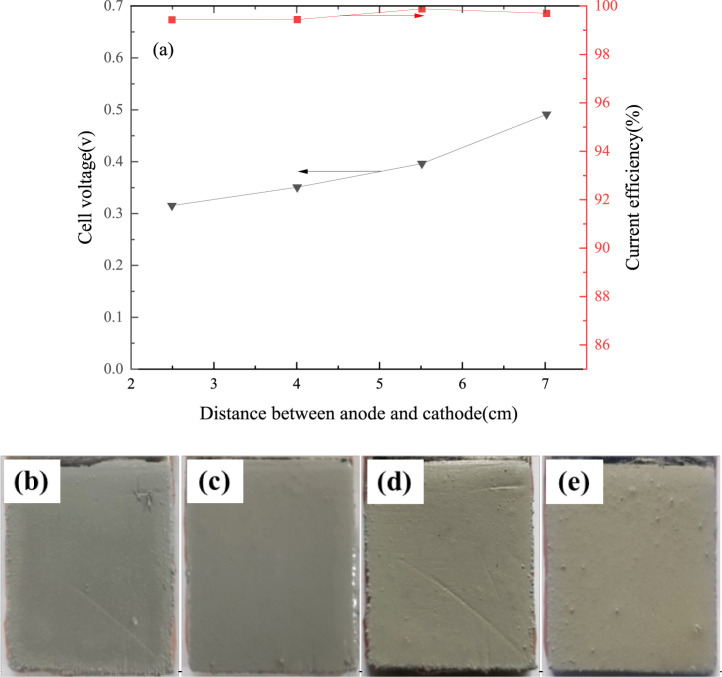
The effect of electrode spacing on cell voltage and current efficiency is shown in Figure 6a. It shows that cell voltage increases from 0.31 to 0.49 V with an increase of electrode spacing from 2.5 to 7.0 cm. The main reason is that the resistance of the electrolyte and migration distance of ions between the cathode and anode increases with an increase of electrode spacing. However, if the electrode spacing is too short, it is easy to cause a short circuit between the cathode and anode. At the same time, the electrode spacing has no obvious effect on the current efficiency which maintains between 99.36% and 99.87%.
Figure 6.
Effect of different electrode spacing on cell voltage and current efficiency (current density 207 A/m2, tin concentration 130 g/L, free-MSA concentration 100 g/L, temperature 295.15 K, 4 h; (b) 2.5 cm, (c) 4.0 cm, (d) 5.5 cm, and (e) 7.0 cm).
Figure 6b–e shows the effect of electrode spacing on the surface appearance of the fine solder. The surface appearance became worse when the electrode spacing was beyond 4.0 cm. The diffusion distance of ions was longer, but the strength of electric field near the cathode surface was basically the same. It may be the reason why the reduction of tin ions was too late to arrange orderly and the crystal growth uniformity needed to be further improved. Considering the cell voltage, current efficiency, and fine solder appearance, the optimum electrode spacing appeared to be 4.0 cm.
3.2.5. Effect of Temperature
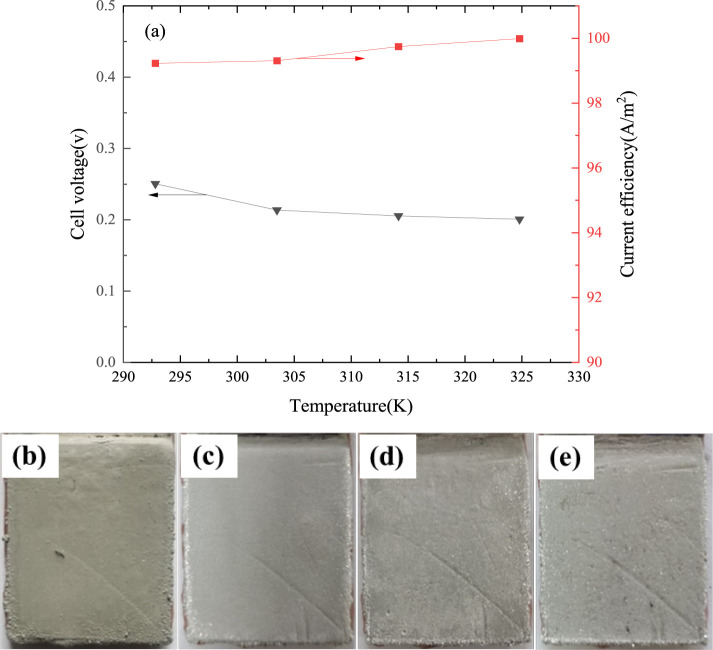
The effect of temperature on cell voltage and current efficiency is shown in Figure 7a. The figure shows that the average cell voltage decreases from 0.25 to 0.20 V as the temperature increases from 295.15 to 323.15 K. It is mainly as a result of the conductivities of tin–MSA solutions increasing with an increase of temperature. When the temperature is low, the migration rate of ions in the electrolyte is slow, while the migration speed of ions is strengthened with an increase of the electrolyte temperature. In practice, the comprehensive energy consumption of the electrorefining process must be considered. Although increasing the electrorefining temperature can reduce the specific energy consumption, energy may be required to heat or cool the electrolyte. Furthermore, high temperature can cause evaporation of the electrolyte, deterioration of workshop environment, and shorten the service life of electrolytic cell. In the range of experimental temperature, the current efficiency (>99.3%) increases slightly.
Figure 7.
Effect of temperature on cell voltage and current efficiency (current density 207 A/m2, tin concentration of 130 g/L, free-MSA concentration 100 g/L, electrode spacing 4 cm, 4 h; (b) 295.15 K; (c) 305.15 K; (d) 315.15 K; and (e) 325.15 K).
The effect of electrorefining temperature on the surface appearance of the fine solder is presented in Figure 7b–e. When the temperature was low, the migration rate of ions in the electrolyte was slow, which may have caused the concentration difference of ions, and hence, the cathodic surface and the metal gloss was poor. The concentration difference at the cathodic surface was weakness when the migration speed of ions was strengthened with an increase of the electrolyte temperature. However, hydrogen overpotential decreases with an increase of electrolyte temperature, which will reduce the current efficiency and worsen the cathode morphology. Considering the cell voltage, current efficiency, and fine solder appearance, the electrorefining temperature from 305.15 to 315.15 K was reasonable for further testing.
3.2.6. Optimum Condition Experiment
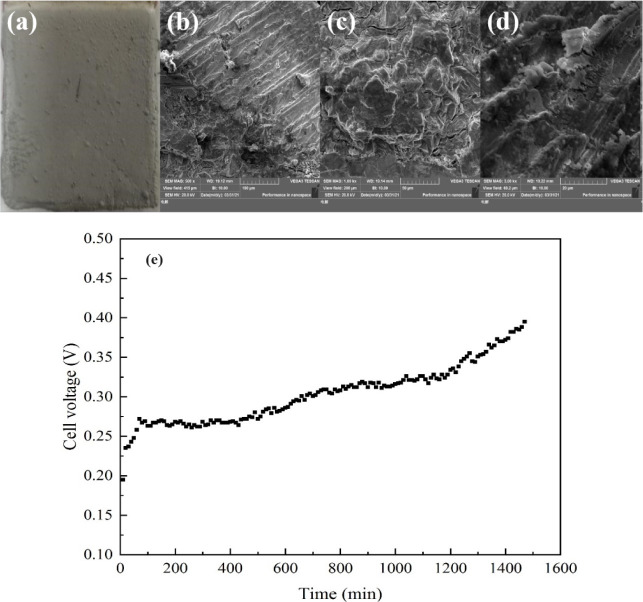
According to the optimization conditions obtained from the previous conditional experiments, the experiment was performed under current density 207 A/m2, tin concentration 130 g/L, free-MSA concentration 120 g/L, electrode spacing 4.0 cm, and temperature 305.15 K, and the electrorefining of the crude solder was carried out for 24 h. Table S3 shows the chemical composition of fine solders. The total content of tin and lead of the fine solder with good product appearance is >99.99%. Figure 8a–d shows the surface appearance and morphology of the fine solder after 24 h of electrorefining. The results show that the crystal growth on the fine solder is uniform.
Figure 8.
(a–d). Surface appearance and morphology of the fine solder. (e) Relationship between cell voltage and electrorefining time (a, camera; b, × 500; c, × 1000; d, × 3000; current density 207 A/m2, tin concentration 130 g/L, free-MSA concentration 120 g/L, electrode spacing 4.0 cm, temperature 305.15 K, 24 h).
The cell voltage increased over time (Figure 8e). This is due to the increasing amounts of slime that contribute to a higher anodic polarization and the concentration of metal ions that contributes to lower conductivities of the electrolyte. In the whole process, the average cell voltage is 0.30 V and the current efficiency is 99.31%.
4. Conclusion
(1) The electrorefining process of the crude solder from MSA medium is an attractive alternative to conventional technology. It offers low energy consumption, high productivity, and low environmental pollution.
(2) The conductivities of tin–MSA solutions increase with an increase of free-MSA concentration and temperature, respectively. However, they decrease with an increase of tin concentration in the solution for free-MSA concentrations of 10–300 g/L. A mathematical model for all the conductivities is developed as
(3) The cell voltage of the electrorefining process increases with an increase of tin concentration, current density, and electrode spacing and decreases with an increase of free-MSA concentration and temperature. The current efficiency of the electrorefining process increases with an increase of current density, free-MSA concentration, tin concentration, and temperature. However, the electrode spacing has no significant effect on the current efficiency.
(4) The operating parameters of the electrorefining process are established as follows: current density 207 A/m2, tin concentration 120–160 g/L, free-MSA concentration 90–120 g/L, electrode spacing 4 cm, and temperature 305.15–315.15 K. Under these conditions, the average cell voltage is 0.30 V and the current efficiency is 99.31%. The total content of tin and lead of the fine solder with good product appearance is >99.99%.
Acknowledgments
We would like to express our gratitude to all those who helped us during the experiments.
Data Availability Statement
All relevant data are within the manuscript and its additional files.
Supporting Information Available
The Supporting Information is available free of charge at https://pubs.acs.org/doi/10.1021/acsomega.4c08470.
Chemical composition of crude solder (Table S1); list of process parameters studied during experiments (Table S2); chemcial composition of fine solder (Table S3) (PDF)
Author Contributions
Y.Z.: investigation, data curation. K.H.: investigation, writing—original draft preparation. B.J.: supervision, writing—reviewing and editing. J.L.: investigation, writing—original draft preparation.
This work was supported financially by the National Key Research and Development Project (No. 2022YFC2904203), Yunnan Ten Thousand Talents Plan Young and Elite Talents Project (No. YNWRQNBJ2018087), and Yunnan Province applied basic research enterprises joint special project (No. 202301BC070001–018).
The authors declare no competing financial interest.
Supplementary Material
References
- Nordberg G. F.; Costa M.. Handbook on the Toxicology of Metals: Volume II: Specific Metals, 5th Edition Ed.; Elsevier: 2021; pp. 807–856. [Google Scholar]
- Huang W. S.; Stannum. Metallurgical; Industry Press, 2000. [Google Scholar]
- Rimaszeki G.; Kulcsar T.; Kekesi T. Application of HCl solutions for recovering the high purity metal from tin scrap by electrorefining. Hydrometallurgy 2012, 125–126, 55–63. 10.1016/j.hydromet.2012.05.012. [DOI] [Google Scholar]
- Kelsall G. H.; Gudyanga F. P. Thermodynamics of Sn–S–Cl–H2O system at 298 K. J. Electroanal. Chem. Interfacial Electrochem. 1990, 280, 267–282. 10.1016/0022-0728(90)87003-3. [DOI] [Google Scholar]
- Kekesi T.; Torok T. I.; Kabelik G. Extraction of tin from scrap by chemical and electrochemical methods in alkaline media. Hydrometallurgy 2000, 55, 213–222. 10.1016/S0304-386X(99)00091-2. [DOI] [Google Scholar]
- Saba A. E.; Afifi S. E.; El Sherief A. E. Developments in Alkaline Tin Electrorefining. J. Miner., Met. Mater. Soc. 1988, 40 (8), 40–43. 10.1007/BF03258122. [DOI] [Google Scholar]
- Walsh F. C.; Low C. T. J. A review of developments in the electrodeposition of tin. Surf. Coat. Technol 2016, 288, 79–94. 10.1016/j.surfcoat.2015.12.081. [DOI] [Google Scholar]
- Gernon M. D.; Wu M.; Buszta T.; Janney P. Environmental benefifits of methanesulfonic acid: comparative properties and advantages. Green Chem. 1999, 1 (3), 127–140. 10.1039/a900157c. [DOI] [Google Scholar]
- Jin B. J.; Dreisinger D. B. A green electrorefining process for production of pure lead from methanesulfonic acid medium. Sep. Purif. Technol. 2016, 170, 199–207. 10.1016/j.seppur.2016.06.050. [DOI] [Google Scholar]
- Low T. J.; Walsh F. C. Electrodeposition of tin, copper and tin-copper alloys from a methanesulfonic acid electrolyte containing a perfluorinated cationic surfactant. Surf. Coat. Technol. 2008, 202, 1339–1349. 10.1016/j.surfcoat.2007.06.032. [DOI] [Google Scholar]
- Low C. T. J.; Walsh F. C. The influence of a perfluorinated cationic surfactant on the electrodeposition of tin from a methanesulfonic acid bath. J. Electroanal. Chem. 2008, 615, 91–102. 10.1016/j.jelechem.2007.11.031. [DOI] [Google Scholar]
- Xie Q.; Du L.; Li X. Y.; Yuan B.; Bao G. Q.; Wang L. M. Influence of 1,8-naphthalimide derivatives as additives on the electrodeposition of tin from methanesulfonic acid system. Dyes Pigm. 2022, 207, 110691. 10.1016/j.dyepig.2022.110691. [DOI] [Google Scholar]
Associated Data
This section collects any data citations, data availability statements, or supplementary materials included in this article.
Supplementary Materials
Data Availability Statement
All relevant data are within the manuscript and its additional files.


