ABSTRACT
Background
Research on the function of HGH1 in breast cancer remains lacking.
Methods
TCGAand GEO (GSE45827) datasets investigated discrepancies in HGH1 expression in BC. An aggregate of 106 clinical samples were gathered through immunohistochemistry, KM curves were drawn for prognostic analysis, and the function of HGH1 of BC was predicted. Finally, the effects of HGH1 knockdown on MDA-MB-231 and MCF-7 BC cells were verified via CCK8, invasion, wound healing and colony formation assays.
Results
HGH1 is highly expressed in BC and is linked to unfavorable prognosis. HGH1 overexpression is connected to keratinization and the cell cycle and is closely related to ER and PR expression and tumor stage in BC patients. Knocking down HGH1 in BC cells inhibited the viability, invasion and migration.
Conclusion
Knockdown of HGH1 in breast cancer cell lines can inhibit the viability, invasion and migration of tumor cells.
KEYWORDS: Bioinformatics, biomarker, breast cancer, HGH1, prognosis
Introduction
Breast cancer (BC) has become a global health challenge [1,2]. The incidence has risen dramatically in recent years, and the disease burden is increasing [3]. Due to the high heterogeneity of breast cancer, the individualized treatment of this disease has received increasing attention [4]. Therefore, the identification of biomarkers and molecular targets are particularly important for early-stage diagnosis, prediction of disease development and assessment of patient prognosis [5–7]. Cancer is a complex and diverse condition marked by the disruption of critical biological processes, including growth, proliferation, and cell death pathways [8].
Human growth hormone (HGH) is a pituitary-derived protein with a molecular mass of 22 kDa that is a family of molecules consisting of various isomers that differ in size, structure, charge, and posttranslational modifications [9,10]. One of the subtypes of this family, growth hormone 1 (HGH1), is located on chromosome 8 and can interact with specific proteins and indirectly regulate target genes. Current studies have shown that HGH1-mediated CASC21 accelerates colorectal cancer progression in vivo and boosts the growth, movement, EMT, and stem-like characteristics of colorectal cancer cells [11]. However, HGH1 in BC remains unexplored.
In this research, HGH1 expression and its correlation with clinical features were analyzed via TCGA and GEO databases, and the expression results were verified via immunohistochemistry of 106 clinical samples. Moreover, protein‒protein (PPI) networks were constructed via HGH1 and its related HUB genes, the function of HGH1 in BC was predicted via GO, KEGG, GSEA, and immune infiltration analysis. Finally, HGH1 was verified in MDA-MB-231 and MCF-7 cells, underlying molecular mechanism how HGH1 promotes BC progression was elucidated.
Methods
Data acquisition and preprocessing
Raw genes for BC and corresponding clinical information were retrieved from the TCGA database (https://portal.gdc.cancer.gov/) and RNA-seq described the variation HGH1 expression in unmatched and matched samples. An aggregate of 103 BC samples and 3 normal breast samples were incorporated. Toil process uniformizes the data [12]. Differential analysis data for HGH1 in the expression profile of GSE45827 were downloaded from GEO database.
Single-gene differential analysis of HGH1
To analyze single-gene difference and correlations for HGH1 in BRCA projects, we applied the DESeq2 software and STAT software using data from the TCGA database [13]. Volcano maps were generated via ggplot2 software [version 3.3.6]. STRING database was employed to visualize DEGs [14], and PPI network was examined through the Cytoscape software. The top 35 correlations are then searched in descending order by | Pearson value |.
Functional enrichment analysis
GO and KEGG functional analysis were conducted via the R packages ‘clusterProfiler.’ GSEA was conducted to study the presumed signaling pathway on the basis of different expression analysis. A p-value adjusted to less than 0.05 was regarded as indicating significant enrichment. All the results were visualized via R software.
Immunoinfiltration analysis of HGH1
The immune infiltration analysis was carried out using the ssGSEA algorithm and Spearman correlation method. Using GSVA [version 1.34.0], we assessed 24 distinct immune cell types [15]. The samples were categorized into groups based on HGH1 expression levels, one with low HGH1 expression and the other with high, to compute the immune cell infiltration enrichment scores for each subgroup.
An analysis to assess HGH1 mRNA levels and patient prognosis in BRCA
Overall survival was plotted on the Kaplan-Meier curve for BRCA. The ROC analysis was conducted using the pROC package. Finally, we established binary logistic regression models and clinical baseline data tables for the prediction about the correlation between clinicopathological features and HGH1 expression.
Specimens
The Ethics Review Committee of the School of Nursing, Jilin University, authorized this study (Changchun, China). Ethics approval number: 2022062701. Paraffin-embedded samples were obtained from 103 breast cancer patients and 3 healthy controls in Second Hospital of Jilin University, diagnosed between December 2013 and December 2023. All patients were informed about the breast cancer-related study and provided written consent to participate. I confirm the study adheres to the Declaration of Helsinki.
Immunohistochemistry
IHC staining was conducted following the protocol outlined in a previous study [16,17]. Images were captured using an optical microscope of the sections at magnifications of × 200 or × 400. The IHC-stained sections were graded independently and double-blinded by two pathologists.
Cell culture and the development of stably transfected cells
In iCell Bioscience Inc., Shanghai, we purchased MCF-10A, MCF-7 and MDA-MB-231 cells. MCF-10A and MCF-7 was prepared in DMEM medium supplemented with 10% fetal bovine serum, 1% nonessential amino acids, and 1% penicillin‐streptomycin. For MDA-MB-231, Leibovitz’s L-15 culture medium was used. All cells were cultured at the humidified atmosphere containing 5% CO2 at 37°C.
The lentiviral vector plasmid pLKO.1-Puro was employed to generate the pLKO.1-Scramble and pLKO.1-shHGH1. Following primers: HGH1 gene, 5’-CCTAGAGGAAGGCATCCAAA-3’ for forward and 5’-GCAGCCCGTAGTTCTTGAGTAG-3’ for reverse; GAPDH gene, 5’‐GAAGGTGAAGGTCGGAGTC‐3’ for forward and 5’‐GAAGATGGTGATGGGATTTC‐3’ for reverse. The lentivirus used in this study was packaged via. The lentiviral vector plasmid was combined with PMD2.G (BR037, Fenghui), psPAX2 (BR036, Fenghui) and Lipofectamine™ 3000 transfection reagent (L3000150, Thermo Fisher) was used to introduce the complexed solution into HEK-293T cells. And then, culture-medium was collected by filtration with a 0.2 μm filter after 48 and 72 hours.
MCF-7 and MDA-MB-231 cells were seeded into a six-well plate (300,000 cells/well) for culture of the transfected cell lines. The cells containing the resistance gene were screened with 2 μg/ml purinomycin.
Real-time PCR
The RNA extraction was performed using EasyPure RNA Kit (TransGen, ER101–01), and cDNA synthesis used the kit (TransGen, AT311–02), following manufacturer’s instructions. The primers employed were as follows: for the HGH1 gene, forward primer 5’−GATCCTTCGAGAGCTGCACA and reverse primer 5“-CAGCAGGTTTTCCATGCCAC; for the GAPDH gene, forward primer 5”-GAAGGTGAAGGTCGGAGTC‐3’ and reverse primer 5‘‐GAAGATGGTGATGGGATTTC‐3’. The expression of mRNA was quantified using 2-ΔΔCt [18].
Cell counting kit-8
MCF-7, McF-7-shScramble, McF-7-shHGH1, MDA-MB-231, MDA-MB-231-shScramble, and MDA-MB-231-ShHGH1 was inoculated into a 96-well plate. The samples were incubated at 37°C for 1.5 h at 450 nm with an enzyme marker (E0226; Detie, Inc.), and the absorbance was measured.
Invasion assay
A total of 100 µl of serum-free medium containing 20,000 cells per well was added to upper chamber of the transwell insert (Labselect, product code 14,342), which was coated with Matrigel. The lower chamber was supplemented with 600 µl of medium containing 10% serum. Cells were incubated at 37°C for 24 hours, followed by staining with 10% Giemsa.
Wound-healing assays
All the aforementioned cells were plated six-well plates, and scratched with 200 ul pipette, and photographed with an optical microscope at 0, 24, and 48 h.
Colony formation assays
All above cells were plated six-well plates (100 cells/well). And then, they were stained with 10% Giemsa (Biotopped, China).
Western blot
Intracellular protein samples were extracted and separated using 12.5% SDS-PAGE gel electrophoresis. And then, they were transferred to PVDF membranes, using the Immobilon-P membrane (Millipore, Merck, Italy). The PVDF membrane was incubated in 5% skim milk for 1 h, followed by washing with TBST. It was then incubated with the diluted primary antibody. TBST was washed again and incubated with a second antibody labeled with horseradish peroxidase for 1 h. Enhanced chemiluminescence (ECL) was used to detect protein levels. The strip is quantized using ImageJ. β-actin acts as an internal parameter of the total protein. The Protein marker is Blue Plus® V Protein Marker (10–190 kDa) (Item: DM141–01).
Statistical analysis
The means of three independent experiments, along with the standard deviation (SD), were statistically analyzed. SPSS 25.0 was used; Assessing differences between groups using the ANOVA.
Results
HGH1 is upregulated in pancarcinoma and BRCA
As depicted in (Figure 1a), analysis of unmatched samples revealed HGH1 expression was elevated in the following cancer types compared to normal tissues: bladder urothelial carcinoma (BLCA), breast invasive carcinoma (BRCA), cervical squamous cell carcinoma and endocervical adenocarcinoma (CESC), colon adenocarcinoma (COAD), esophageal carcinoma (ESCA), glioblastoma multiforme (GBM), head and neck squamous cell carcinoma (HNSC), kidney renal clear cell carcinoma (KIRC), kidney renal papillary cell carcinoma (KIRP), liver hepatocellular carcinoma (LIHC), lung adenocarcinoma (LUAD), lung squamous cell carcinoma (LUSC), pancreatic adenocarcinoma (PAAD), prostate adenocarcinoma (PRAD), rectal adenocarcinoma (READ), pulmonary sarcomatoid carcinoma (SARC), stomach adenocarcinoma (STAD), thyroid carcinoma (THCA), thymoma (THYM), and uterine corpus endometrial carcinoma (UCEC).
Figure 1.
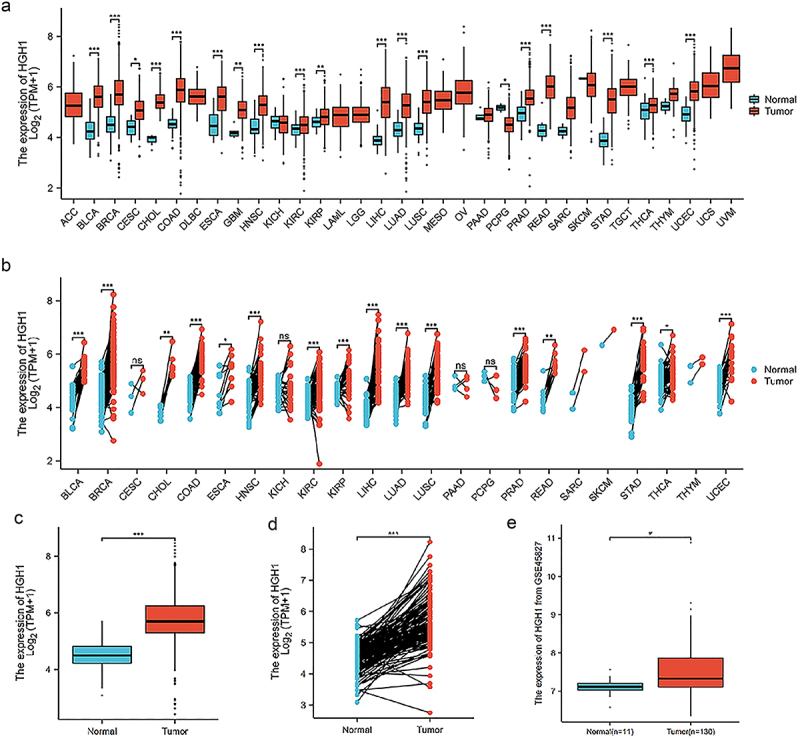
HGH1 expression in pancarcinoma and BRCA. (a) HGH1 in unpaired pancarcinoma and normal samples. (b) HGH1 in paired pancarcinoma and normal samples. (c) HGH1 in unpaired BRCA and normal samples. (d) HGH1 in paired BRCA and normal samples. (e) HGH1 based on GSE45827 data. “*, p < .05; **, p < .01; ***, p < .001”.
Analysis of paired samples indicated that HGH1 expression was elevated compared to normal tissues: BLCA, BRCA, cholangiocarcinoma (CHOL), COAD, ESCA, HNSC, KIRC, KIRP, LIHC, LUAD, LUSC, PRAD, READ, STAD, THCA, and UCEC (Figure 1b).
HGH1 expression was consistently higher in tumor tissues in both unmatched and paired BRCA samples (Figure 1c,d). This observation was validated using HGH1 mRNA expression from the GSE45827, as presented in Figure 1e.
Evaluation HGH1 expression in clinical samples of BRCA
AOD was determined by immunohistochemistry in 103 BC clinical samples and 3 normal tissue samples. HGH1 expression varies in BC tissues with different differentiation, HGH1 showed a low expression in normal tissues and increases progressively as tumor differentiation decreases (Figure 2a). The HGH1 immunohistochemical results in 106 samples are shown in Figure 2b. As shown in Figure 2c–e, HGH1 expression is associated with ER, PR levels, as well as the tumor stage. Remaining data are presented in Supplementary Table 2. In addition, ROC curve is presented in Figure 2f, with an AUC of 0.880, suggesting that HGH1 is associated with the development of BC.
Figure 2.
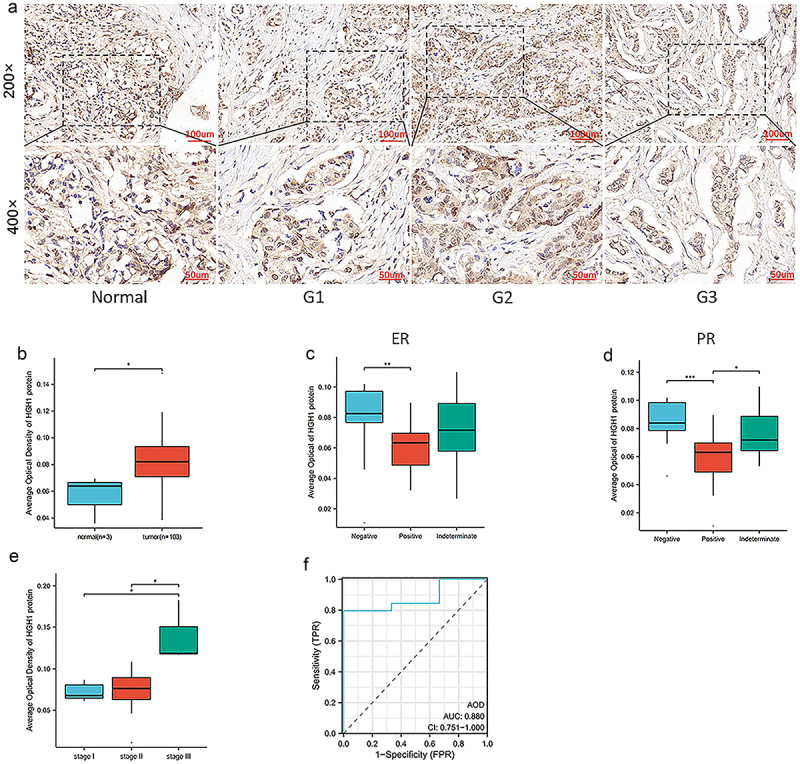
HGH1 expression in BRCA clinical and normal tissues. (a) Immunohistochemical staining about HGH1 expression across different differentiation grades. (b) Comparison about HGH1 immunohistochemical between 103 BRCA clinical samples and 3 normal breast tissue samples. (c–e) Comparison about HGH1 protein expression levels across groups on ER, PR and Stage of tumor. (f) Diagnostic ROC curve for HGH1. “*, p < .05; **, p < .01; ***, p < .001”.
Single-gene expression and analyses about HGH1
As shown in Figure 3a, 622 genes were satisfied, in which 243 genes are overexpressed and 379 genes are underexpressed. As shown in Figure 3b, for constructing the protein interaction network, these 622 genes are introduced in STRING, and 10 hUB genes (LOR, LCE1C, LCE1A, KPRP, SPRR2G, SPRR2E, LCE2A, LCE3D, LCE1B, and LCE5A) were screened out. After that, correlation analysis was performed. Figure 3c presents the co-expression heat map about HGH1 and the first 35 genes, while Figure 3d displays the co-expression heat map about HGH1 and HUB genes.
Figure 3.
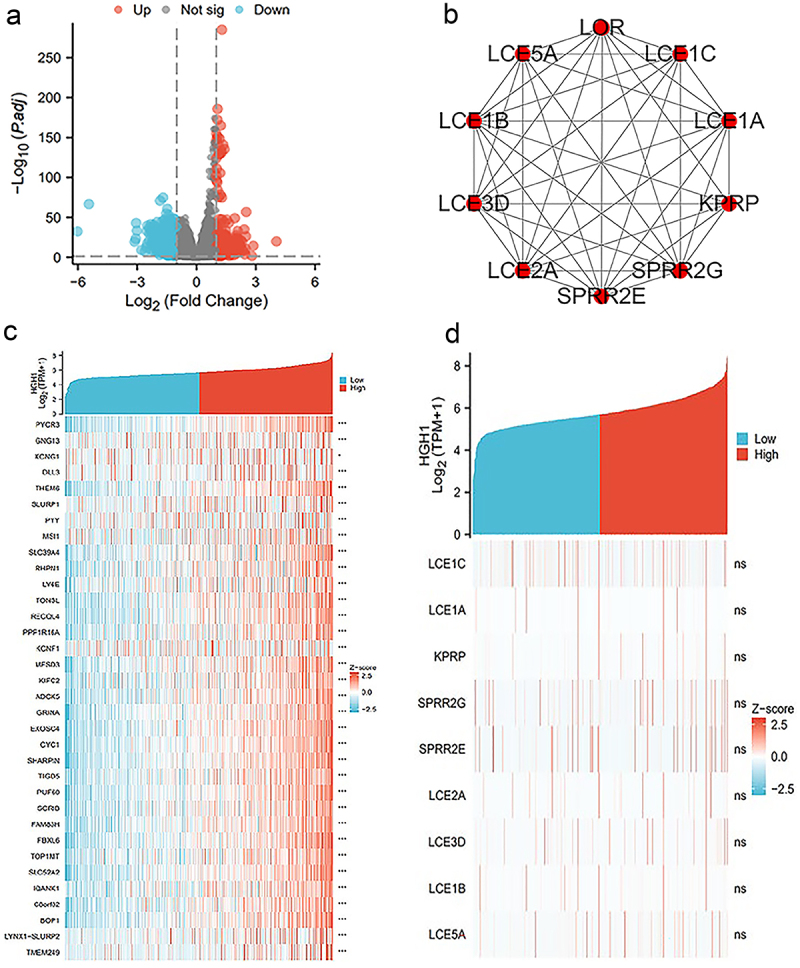
Single-gene expression and analyses about HGH1. (a) Volcano plot of HGH1. (b) HUB genes’ PPI. (c) Heatmap analysis. (d) Heatmap illustrating the co-expression between 35 hUB genes and HGH1.
Functional enrichment analysis of HGH1
HGH1 and its differentially expressed genes were subjected to functional enrichment via GO and KEGG. GO analysis indicate in terms of ‘biological processes’, keratinization, adenylate cyclase-modulating G protein-coupled receptor signaling pathway, negative regulation of epithelial cell apoptotic process, DNA replication-dependent chromatin assembly, and peptide hormone secretion were enriched. In terms of ‘molecular function,’ CENP-A containing nucleosome, transmembrane transporter complex, collagen-containing extracellular matrix and DNA packaging complex were enriched. In terms of ‘cell composition,’ gated channel activity, hormone activity, acetylcholine receptor regulator activity, heparin binding, and alcohol dehydrogenase [NAD (P)+] activity were enriched (Figure 4a,c and Supplementary Table 1).
Figure 4.
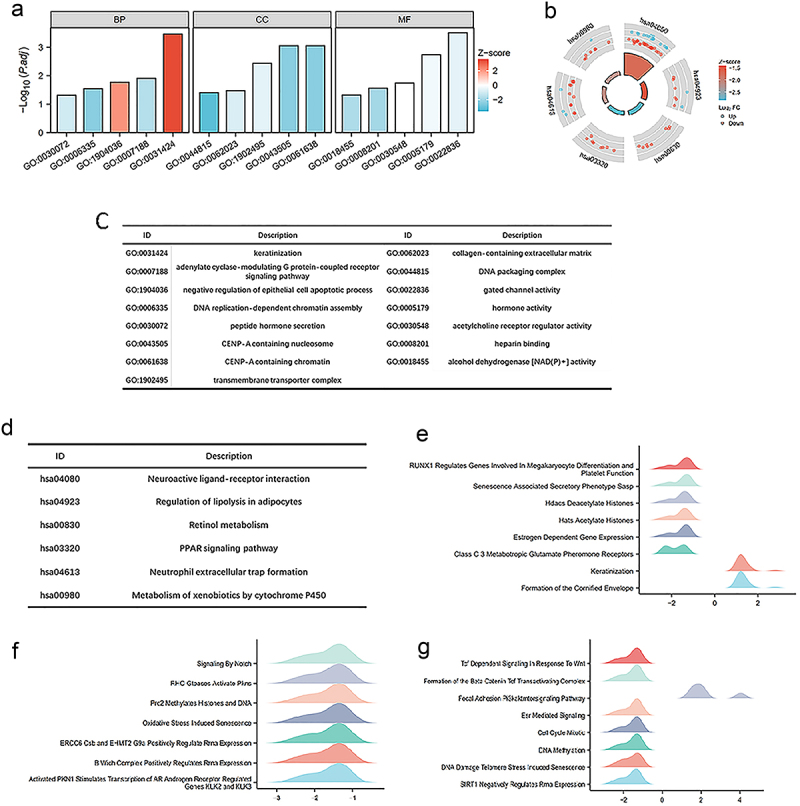
Functional enrichment analysis about HGH1 gene. (a, b) GO and KEGG results. (c, d) Category names for GO and KEGG analyses corresponding to their respective identifiers. (e–g) GSEA analysis results. A positive value on the abscissa indicates positive correlation between HGH1 and the pathway, while a negative value indicates an inverse correlation.
The KEGG functional enrichment results revealed that neuroactive ligand‒receptor interaction, regulation of lipolysis in adipocytes, retinol metabolism, PPAR signaling pathway, neutrophil extracellular trap formation and metabolism of xenobiotics were among enriched (Figure 4b,d and Supplementary Table 1).
GSEA functional enrichment analysis predicts the function of HGH1 in BRCA. We find HGH1 and HATs acetylate histones, HDACs deacetylate histones, senescence associated secretory phenotype SASP, Activated PKN1 promotes the transcription of AR-regulated genes KIK2 and KIK3, signaling by NOTCH, ESR mediated signaling, PI3K-AKT-mTOR signaling pathway, and TCF-dependent signaling in response to the Wnt and other pathways are closely related (Figure 4e–g).
Immunoinfiltration analysis of HGH1
HGH1 expression showed a positive correlation with the infiltration levels of Th2 cells and a negative correlation with the infiltration levels of T cells (Figure 5a,c).
Figure 5.
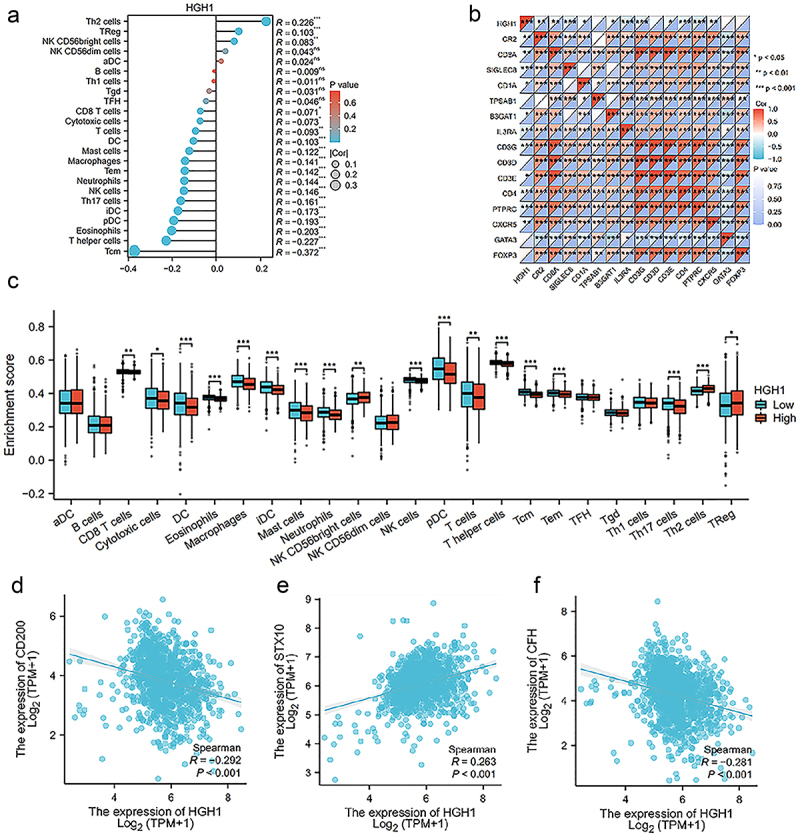
Immunoinfiltration on HGH1. (a) Analysis of the correlation between HGH1 and 24 immune types. (b) Heatmap between HGH1 and various immune cell surface marker protein. (c) Comparison of immune cell infiltration levels with varying HGH1. (d–f) Analysis of the correlation between HGH1 and CD200, STX10, CFH. “*, p < .05; **, p < .01; ***, p < .001”.
Then we analyzed the correlation between HGH1 and surface marker proteins of immune cells, and the results revealed strong correlations between HGH1 and CR2, CD8A, SIGLEC8, IL3RA, CD3G, CD4, PTPRC and CXCR5 (Figure 5b). Finally, in Figure 5d–f and Supplementary Table 3, we investigated the correlation between HGH1 and several common immunotherapy targets, finding that HGH1 was positively associated with STX10 and negatively associated with CD200 and CFH.
High HGH1 expression indicates poor prognosis in BRCA
Survival analysis was conducted using prognostic data from BC patients. As depicted in Figure 6a, elevated HGH1 expression was linked to worse overall survival (OS). For instance, in Figure 6b, ROC assessed predictive accuracy of HGH1 expression for patient prognosis, an AUC of 0.643 was found, indicating that HGH1 was significant in predicting patient outcomes with BC. Moreover, an online database analyzed the prognostic impact of HGH1 expression in CESC, KIRC, and LIHC, as displayed in Supplemental Figure 1. The analysis revealed that elevated HGH1 correlates with reduced OS, implying a potential link between HGH1 and tumor progression.
Figure 6.

HGH1 expression in prognosis. (a) Kaplan–Meier survival curves for OS stratified by HGH1 expression. (b) Prognostic ROC curve. (c) Kaplan–Meier OS curves on HGH1 expression in 106 BC clinical samples. (d) Kaplan-Meier DSS curves on HGH1 expression in 106 BC clinical samples.
We subsequently used 106 sample data to explore the relationship between HGH1 and patient prognosis. Figures 6c,d indicated higher HGH1 correlated with worse prognosis, aligning with the online data findings.
Effects of HGH1 knockdown in BC cells
Compared with normal breast cells, HGH1 protein was up-regulated in BC cells MDA-MB-231 and MCF-7 (Figure 7a,b). Then, we constructed MDA-MB-231 and MCF-7 cells that knock down HGH1, and confirm the reduced expression of HGH1, as shown in Figure 7c–d. After that, a CCK-8 assay was performed, and the results revealed that cells with low HGH1 knockdown had reduced proliferation ability, as shown in Figure 7e,f. A colony formation test revealed that colony formation ability decreased after HGH1 knockdown, as shown in Figure 7g,i. Transwell experiments revealed that the invasive capacity of HGH1-knockdown cells was reduced (Figure 7h,j). Wound-healing assays further indicated that, over time, the migratory ability of HGH1-knockdown cells diminished, as illustrated in Figures 7k–n. Additionally, western blot revealed ER protein expression was up-regulated after HGH1 knockdown (Figure 7o–p).
Figure 7.
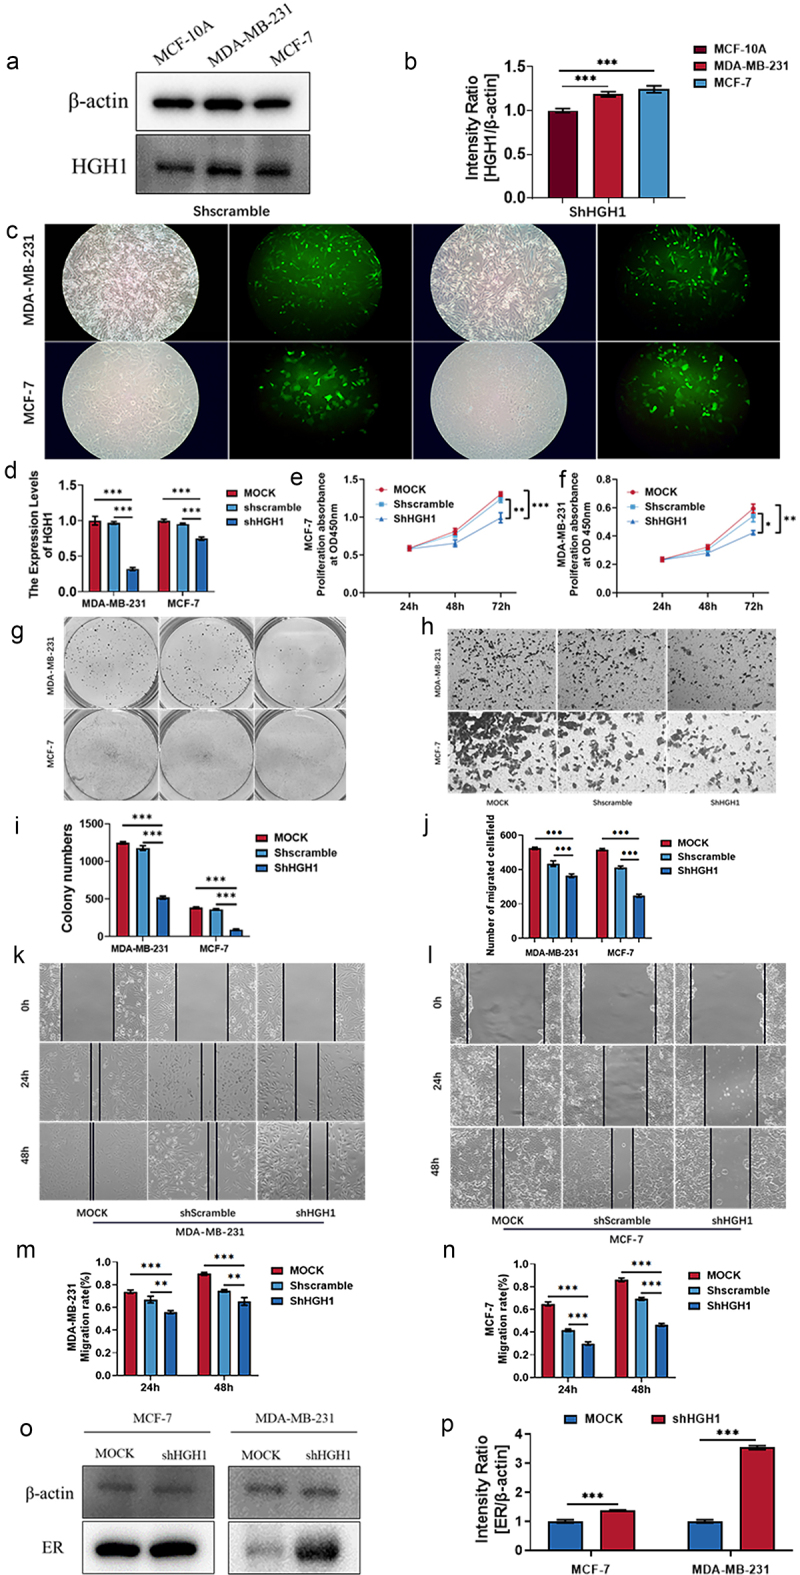
Effects of HGH1 knockdown in BC cells. (a) HGH1 protein in MCF-10A, MDA-MB-231 and MCF-7. (b) Quantitative analysis of western blot. (c) Fluorescence map of HGH1 knockdown cell construction. (d) MDA-MB-231 and MCF-7 were transfected with shHGH1, and HGH1 was assessed using qRT-PCR. (e, f) Cell proliferation was measured through CCK-8 assays, and (g, i) colony formation was evaluated. (h, j) Invasion assays were performed to assess cell migration, while (k–n) wound-healing assays were performed to assess the metastatic potential. (o) ER protein expression. (p) Quantitative analysis of western blot. “*, p < .05; **, p < .01, ***, p < .001”.
Discussion
BC is a group of biologically and molecularly heterogeneous diseases originating in the breast [19] with increasing incidence and mortality worldwide [1,20]. Indications and precision have become popular focuses of breast cancer treatment. Therefore, identification of the molecular targets that promote BC growth is particularly important for diagnosis, treatment and prognosis.
At present, many genes or proteins related to growth and proliferation have been shown to be related to BC. HGH1 is a human growth hormone associated with mature-onset Diabetes of the Young, Type 3 (MODY3), and its function in malignant tumors has not been defined. Only one study has shown that HGH1-mediated CASC21 can accelerate the malignant phenotype of tumor cells [11], suggesting that HGH1 may be related to cancer cells proliferation and migration. As a result, we speculate HGH1 may be related to BC.
This research first used RNA-seq data, which is mainly from TCGA and GEO databases, revealed HGH1 was notably elevated in BC. Immunohistochemistry of 106 samples that HGH1 protein was higher in tumor tissues compared to normal tissues, and its expression was strongly linked to ER and PR levels, as well as tumor stage. Additionally, ROC curve analysis, AUC = 0.880 indicates that HGH1 may promote tumor onset and progression, potentially serving as a molecular marker for BC diagnosis.
To better understand HGH1 in BC development and progression, this study screened 35 genes and 10 hUB genes closely related to HGH1, including LCE protein family, SPRR protein family, through single-gene difference and correlation analysis. Previous studies have shown that the LCE family enables identical protein-binding activity and participates in keratinization. LCE1C is the target of cyclin GAK [21]. LCE3D is upregulated in head and neck squamous cell carcinoma [22] and may serve as a potential target in cancer molecular diagnosis and targeted therapy. Small proline-rich proteins (SPRRs), which are structural components of the epidermis of the skin and are involved in keratinocyte differentiation and peptide crosslinking, are located in the keratinocyte envelope. SPRR2E has been shown to be present in cancer exosomes and promotes cancer cell differentiation as a novel molecular target [23], and SPRR2G has also been shown to be highly expressed in HPV-positive head and neck squamous cell carcinoma, affecting the growth and differentiation of cancer cells [24]. These findings indicate HGH1 May participate in the cell cycle and differentiation, contributing to cancer onset and progression.
To gain deeper molecular mechanisms how HGH1 contributes to tumor initiation and progression, we carried out GO, KEGG, GSEA functional enrichment analyses on HGH1 and its related differentially genes. The results are as follows: GO analysis revealed HGH1 was associated with keratinization, epithelial cell apoptosis and peptide hormone secretion, adenylate cyclase regulation, and GPCR signaling pathways. Keratinization is the differentiation process of epidermal cells and is related to tumor progression [25]. Some peptide hormones, such as P substance and glucagon-like peptide 1, are overexpressed in tumors and can be used as tumor diagnosis and treatment targets [26–29]. Increased or decreased adenylate cyclase activity may lead to abnormal proliferation and invasion of BC cells. Moreover, adenylate cyclase/cAMP signaling pathway in BC cells interacts with estrogen receptor signaling pathway, which can influence the treatment response and prognosis. The abnormal expression and activation of GPCR is closely linked to pathological progression of BC. For example, GPCRS such as CXCR4 [30] and CCR7 [31] are elevated expressed in BC and are linked to the likelihood of tumor metastasis. The GPCR signaling pathway also influences the molecular typing of BC and its response to targeted therapies through interactions with breast cancer-related receptors such as ER [32] and HER2.
KEGG results show HGH1 is associated with the regulation of lipolysis in adipocytes, PPAR and metabolism by cytochrome P450. Lipolysis is linked to cancer-associated cachexia, with tumor-secreted proliferative protein-1 regulating both adipogenesis and lipolysis in this condition [33–35]. PPAR signaling pathway is a known tumor-related signaling pathway [36–38]. Research indicates PPARγ expression has a role in inhibiting tumor growth in BC [39]. PPARγ regulates the apoptosis of BC cells through its interaction with ER (estrogen receptor) signaling pathway, especially in ER-positive BC.
GSEA also indicated a strong association between HGH1 and keratinization, the formation of cornified envelope, cyclin, PI3K-AKT-mTOR signaling pathway and Wnt pathway.
Tumor microenvironment is highly heterogeneous, and a thorough understanding of their components, particularly the traits of tumor-infiltrating immune cells, is essential for identifying key regulatory molecules that drive tumor progression and impact immunotherapy. Therefore, we investigated the association between HGH1 and various immune cells. HGH1 showed a positive correlation with Th2 cell infiltration and a negative correlation with T cell infiltration. The shift from Th1/Th2 equilibrium to Th2 dominance plays a critical role in tumor progression. Th2 cells are ineffective in supporting cellular immunity against tumors [40]. The replication potential and differentiation status of T cells are important regulators of antitumor activity, and the use of T cells capable of increasing self-renewal and replication capacity is associated with the antitumor response [41–43]. Moreover, HGH1 was correlated with the immunotherapy target STX10 and negatively correlated with CD200 and CFH. The study’s results suggest high HGH1 expression might suppress the tumor immune response, indicating that HGH1 could serve as a potential target for cancer immunotherapy.
Next, the correlation between HGH1 and the prognosis of BC was examined. KM survival and ROC curve analysis indicated elevated HGH1 was linked to unfavorable prognosis. When examining the relationships between HGH1 and clinical characteristics, online data showed that HGH1 was related to ER, PR, tumor stage and BC classification (Supplementary Table 4), whereas when the sample information of 106 patients was used, HGH1 was related to ER, PR and tumor stage. The classification of tumors was not verified because of incomplete clinical data.
Finally, to verify HGH1’s function, we downregulated HGH1 in BC cell lines via stable transfection of shRNA. CCK-8, wound-healing, invasion, and colony formation assays showed knockdown HGH1 reduced the viability, invasion and migration ability.
In summary, HGH1 expression contributes to the progression of BC, weakens antitumor immune response, and promotes invasion and migration of BC cells. Thus, HGH1 could serve as a valuable molecular marker for predicting breast cancer outcomes, as well as a new target for tumor therapy, presenting fresh strategies for the future management of BC patients.
This study first systematically demonstrates the important role of HGH1 in the progression of BC, particularly its inhibitory effect on anti-tumor immune responses and its promotion of BC cells invasion and migration. In contrast to existing literature, most studies focus on well-known molecular markers and signaling pathways in breast cancer, such as HER2 and BRCA1/2 [44], while research on HGH1’s specific mechanisms in the tumor microenvironment has been relatively lacking. Through comprehensive mechanistic analysis, this study identifies the important role of HGH1 in immune evasion and tumor progression, offering a novel potential target for BC treatment.
Moreover, this study has limitations. One notable issue is the imbalance between tumor samples and normal samples, sample size should be expanded and the gap should be narrowed for further verification in the future. Second, this study only predicted the diagnosis and prognosis of monogenic BC, which cannot fully reflect all biological changes and individual differences of patients, and may ignore the interaction between genes and the influence of microenvironment. Future studies can evaluate the prognosis and diagnosis of different combinations of markers. Finally, the effect of HGH1 on BRCA cell lines was validated in this study, the findings related to KEGG pathway enrichment require further validation through in vitro and vivo experiments. In the end, given that it is a retrospective study, further prospective research is essential to address the inherent biases linked to retrospective investigations.
Conclusion
Knockdown of HGH1 in BC cells can inhibit viability, invasion and migration of tumor cells.
Supplementary Material
Funding Statement
This study was supported by the Jilin Provincial Department of Science and Technology project (grant number: 20210204200YY) and the Healthcare Talents Program of the Finance Department of Jilin Province (grant number: 2024WSZX-B07).
Disclosure statement
No potential conflict of interest was reported by the author(s).
Author contributions
ZW, TL conceived and designed the study. KH and LW collected data for statistical analysis. XM and ZY performed experiments and analyzed the data. LZ and YZ drafted the manuscript. All authors contributed to revising the intellectual content and language editing of the paper. All authors reviewed and approved the final version of the article.
Abbreviations
- BC
Breast cancer
- BRCA
Breast invasive carcinoma
- HGH1
Human growth hormone 1
- TCGA
the cancer genome atlas
- GEO
Gene Expression Omnibus
- PPI
Protein-protein interaction
- GO
Gene ontology
- KEGG
Kyoto encyclopedia of genes and genomes
- GSEA
Gene set enrichment analysis
- DEGs
differentially expressed genes
- OS
Overall survival
- DSS
Disease-specific survival
- AOD
Average optical density
- CCK-8
Cell counting kit-8
- ANOVA
One-factor analysis of variance
- IHC
Immunohistochemical
Data availability statement
The data in the study is publicly available and unrestricted re-use is permitted via an open license. This data can be found here: The TCGA database (https://portal.gdc.cancer.gov/), and GSE45827 of The GEO database (https://www.ncbi.nlm.nih.gov/geo/query/acc.cgi). Authors agree to provide data and materials that support the results or analysis presented in their papers when reasonably requested.
Ethics statement
The study received approval from the Ethics Committee of the School of Nursing at Jilin University (Changchun, China). All participants provided written informed consent for their involvement. Additionally, written consent was obtained for the publication of any potentially identifiable data or images included in the study. I Confirm that ethical approval was obtained to conduct the study.
Supplementary material
Supplemental data for this article can be accessed online at https://doi.org/10.1080/19336918.2024.2442349.
References
- [1].Wilkinson L, Gathani T.. Understanding breast cancer as a global health concern. Br J Radiol. 2022;95(1130):20211033. doi: 10.1259/bjr.20211033 [DOI] [PMC free article] [PubMed] [Google Scholar]
- [2].Zhao T, Gao P, Li Y, et al. Investigating the role of FADS family members in breast cancer based on bioinformatic analysis and experimental validation. Front Immunol. 2023;14:1074242. doi: 10.3389/fimmu.2023.1074242 [DOI] [PMC free article] [PubMed] [Google Scholar]
- [3].Katsura C, Ogunmwonyi I, Kankam HK, et al. Breast cancer: presentation, investigation and management. Br J Hosp Med (Lond). 2022;83(2):1–7. doi: 10.12968/hmed.2021.0459 [DOI] [PubMed] [Google Scholar]
- [4].Fan Y, Wang X, Li Y. IFI30 expression predicts patient prognosis in breast cancer and dictates breast cancer cells proliferation via regulating autophagy. Int J Med Sci. 2021;18(14):3342–3352. doi: 10.7150/ijms.62870 [DOI] [PMC free article] [PubMed] [Google Scholar]
- [5].Zhao A, Li D, Mao X, et al. GNG2 acts as a tumor suppressor in breast cancer through stimulating MRAS signaling. Cell Death Dis. 2022;13(3):260. doi: 10.1038/s41419-022-04690-3 [DOI] [PMC free article] [PubMed] [Google Scholar]
- [6].Li K, Zhang R, Wei M, et al. TROAP promotes breast cancer proliferation and metastasis. Biomed Res Int. 2019;2019:1–8. doi: 10.1155/2019/6140951 [DOI] [PMC free article] [PubMed] [Google Scholar]
- [7].Kawiak A. Molecular research and treatment of breast cancer. Int J Mol Sci. 2022;23(17):9617. doi: 10.3390/ijms23179617 [DOI] [PMC free article] [PubMed] [Google Scholar]
- [8].Colaprico A, Olsen C, Bailey MH, et al. Interpreting pathways to discover cancer driver genes with moonlight. Nat Commun. 2020;11(1):69. doi: 10.1038/s41467-019-13803-0 [DOI] [PMC free article] [PubMed] [Google Scholar]
- [9].López-Guajardo CC, Armstrong LS, Jordan L, et al. Generation, characterization and utilization of anti-human growth hormone 1–43, (hGH1–43), monoclonal antibodies in an ELISA. J Immunol Methods. 1998;215(1–2):179–185. doi: 10.1016/S0022-1759(98)00086-6 [DOI] [PubMed] [Google Scholar]
- [10].Mönkemeyer L, Klaips CL, Balchin D, et al. Chaperone function of Hgh1 in the biogenesis of eukaryotic elongation factor 2. Mol Cell. 2019;74(1):88–100.e109. doi: 10.1016/j.molcel.2019.01.034 [DOI] [PubMed] [Google Scholar]
- [11].Zhang C, J E, Yu E. LncRNA CASC21 induces HGH1 to mediate colorectal cancer cell proliferation, migration, EMT and stemness. RNA Biol. 2021;18(sup1):369–381. doi: 10.1080/15476286.2021.1950464 [DOI] [PMC free article] [PubMed] [Google Scholar]
- [12].Vivian J, Rao AA, Nothaft FA, et al. Toil enables reproducible, open source, big biomedical data analyses. Nat Biotechnol. 2017;35(4):314–316. doi: 10.1038/nbt.3772 [DOI] [PMC free article] [PubMed] [Google Scholar]
- [13].Love MI, Huber W, Anders S. Moderated estimation of fold change and dispersion for RNA-seq data with DESeq2. Genome Biol. 2014;15(12):550. doi: 10.1186/s13059-014-0550-8 [DOI] [PMC free article] [PubMed] [Google Scholar]
- [14].Jensen LJ, Kuhn M, Stark M, et al. STRING 8–a global view on proteins and their functional interactions in 630 organisms. Nucleic Acids Res. 2009;37(Database issue):D412–D416. doi: 10.1093/nar/gkn760 [DOI] [PMC free article] [PubMed] [Google Scholar]
- [15].Hänzelmann S, Castelo R, Guinney J. GSVA: gene set variation analysis for microarray and RNA-seq data. BMC Bioinformatics. 2013;14(1):7. doi: 10.1186/1471-2105-14-7 [DOI] [PMC free article] [PubMed] [Google Scholar]
- [16].He K, Li J, Huang X, et al. KNL1 is a prognostic and diagnostic biomarker related to immune infiltration in patients with uterine corpus endometrial carcinoma. Front Oncol. 2023;13:1090779. doi: 10.3389/fonc.2023.1090779 [DOI] [PMC free article] [PubMed] [Google Scholar]
- [17].Ma X, Zheng J, He K, et al. TGFA expression is associated with poor prognosis and promotes the development of cervical cancer. J Cell Mol Med. 2024;28(3):e18086. doi: 10.1111/jcmm.18086 [DOI] [PMC free article] [PubMed] [Google Scholar]
- [18].Chen J, Xu D, Wang T, et al. HMGB1 promotes the development of castration‑resistant prostate cancer by regulating androgen receptor activation. Oncol Rep. 2022;48(5). doi: 10.3892/or.2022.8412 [DOI] [PMC free article] [PubMed] [Google Scholar]
- [19].Li J, Lu M, Jin J, et al. miR-449a suppresses tamoxifen resistance in human breast cancer cells by targeting ADAM22. Cell Physiol Biochem. 2018;50(1):136–149. doi: 10.1159/000493964 [DOI] [PubMed] [Google Scholar]
- [20].Wang Z, Yang L, Wu P, et al. The circROBO1/KLF5/FUS feedback loop regulates the liver metastasis of breast cancer by inhibiting the selective autophagy of afadin. Mol Cancer. 2022;21(1):29. doi: 10.1186/s12943-022-01498-9 [DOI] [PMC free article] [PubMed] [Google Scholar]
- [21].Yabuta N, Ota C, Sasakura T, et al. Nojima H: late cornified envelope 1C (LCE1C), a transcriptional target of TAp63 phosphorylated at T46/T281, interacts with PRMT5. Sci Rep. 2018;8(1):4892. doi: 10.1038/s41598-018-23045-7 [DOI] [PMC free article] [PubMed] [Google Scholar]
- [22].Tyszkiewicz T, Jarzab M, Szymczyk C, et al. Epidermal differentiation complex (locus 1q21) gene expression in head and neck cancer and normal mucosa. Folia Histochem Cytobiol. 2014;52(2):79–89. doi: 10.5603/FHC.2014.0018 [DOI] [PubMed] [Google Scholar]
- [23].Qadir F, Aziz MA, Sari CP, et al. Transcriptome reprogramming by cancer exosomes: identification of novel molecular targets in matrix and immune modulation. Mol Cancer. 2018;17(1):97. doi: 10.1186/s12943-018-0846-5 [DOI] [PMC free article] [PubMed] [Google Scholar]
- [24].Chintala S, Quist KM, Pa G-D, et al. High expression of NFX1–123 in HPV positive head and neck squamous cell carcinomas. Head Neck. 2022;44(1):177–188. doi: 10.1002/hed.26906 [DOI] [PMC free article] [PubMed] [Google Scholar]
- [25].Kaminagakura E, Domingos PL, da Rosa Mr, et al. Detection of cytokeratins in ghost cells of calcifying cystic odontogenic tumor indicates an altered keratinization and hair follicle differentiation for their development. Ann Diagn Pathol. 2013;17(6):514–517. doi: 10.1016/j.anndiagpath.2013.07.002 [DOI] [PubMed] [Google Scholar]
- [26].Seki Y, Ichihara A, Anbazhagan R. Association between overweight and growth hormone secretion in patients with non-functioning pituitary tumors. PLoS One. 2022;17(4):e0267324. doi: 10.1371/journal.pone.0267324 [DOI] [PMC free article] [PubMed] [Google Scholar]
- [27].Pimentel E. Peptide hormone precursors, subunits, and fragments as human tumor markers. Ann Clin Lab Sci. 1985;15(5):381–399. [PubMed] [Google Scholar]
- [28].Zwanziger D, Beck-Sickinger AG. Radiometal targeted tumor diagnosis and therapy with peptide hormones. Curr Pharm Des. 2008;14(24):2385–2400. doi: 10.2174/138161208785777397 [DOI] [PubMed] [Google Scholar]
- [29].Khan IU, Beck-Sickinger AG. Targeted tumor diagnosis and therapy with peptide hormones as radiopharmaceuticals. Anticancer Agents Med Chem. 2008;8(2):186–199. doi: 10.2174/187152008783497046 [DOI] [PubMed] [Google Scholar]
- [30].Luker KE, Luker GD. Functions of CXCL12 and CXCR4 in breast cancer. Cancer Lett. 2006;238(1):30–41. doi: 10.1016/j.canlet.2005.06.021 [DOI] [PubMed] [Google Scholar]
- [31].Yang Y, Li J, Lei W, et al. CXCL12-CXCR4/CXCR7 axis in cancer: from mechanisms to clinical applications. Int J Biol Sci. 2023;19(11):3341–3359. doi: 10.7150/ijbs.82317 [DOI] [PMC free article] [PubMed] [Google Scholar]
- [32].Lappano R, Jacquot Y, Maggiolini M. GPCR modulation in breast cancer. Int J Mol Sci. 2018;19(12):3840. doi: 10.3390/ijms19123840 [DOI] [PMC free article] [PubMed] [Google Scholar]
- [33].Hu W, Ru Z, Xiao W, et al. Adipose tissue browning in cancer-associated cachexia can be attenuated by inhibition of exosome generation. Biochem Biophys Res Commun. 2018;506(1):122–129. doi: 10.1016/j.bbrc.2018.09.139 [DOI] [PubMed] [Google Scholar]
- [34].Chung TH, Yen-Ping Kuo M, Chen JK, et al. YC-1 rescues cancer cachexia by affecting lipolysis and adipogenesis. Int J Cancer. 2011;129(9):2274–2283. doi: 10.1002/ijc.26174 [DOI] [PubMed] [Google Scholar]
- [35].Nguyen TD, Miyatake Y, Yoshida T, et al. Tumor-secreted proliferin-1 regulates adipogenesis and lipolysis in cachexia. Int J Cancer. 2021;148(8):1982–1992. doi: 10.1002/ijc.33418 [DOI] [PubMed] [Google Scholar]
- [36].Mirza AZ, Althagafi II, Shamshad H. Role of PPAR receptor in different diseases and their ligands: physiological importance and clinical implications. Eur J Med Chem. 2019;166:502–513. doi: 10.1016/j.ejmech.2019.01.067 [DOI] [PubMed] [Google Scholar]
- [37].Wagner N, Wagner KD. PPAR beta/delta and the hallmarks of cancer. Cells. 2020;9(5):1133. doi: 10.3390/cells9051133 [DOI] [PMC free article] [PubMed] [Google Scholar]
- [38].Porcuna J, Mínguez-Martínez J, Ricote M. The PPARα and PPARγ epigenetic landscape in cancer and immune and metabolic disorders. Int J Mol Sci. 2021;22(19):10573. doi: 10.3390/ijms221910573 [DOI] [PMC free article] [PubMed] [Google Scholar]
- [39].Hernandez-Quiles M, Broekema MF, Kalkhoven E. Ppargamma in metabolism, immunity, and cancer: unified and diverse mechanisms of action. Front Endocrinol (Lausanne). 2021;12:624112. doi: 10.3389/fendo.2021.624112 [DOI] [PMC free article] [PubMed] [Google Scholar]
- [40].Sharma A, Rajappa M, Saxena A, et al. Cytokine profile in Indian women with cervical intraepithelial neoplasia and cancer cervix. Int J Gynecol Cancer. 2007;17(4):879–885. doi: 10.1136/ijgc-00009577-200707000-00019 [DOI] [PubMed] [Google Scholar]
- [41].Crespo J, Sun H, Welling TH, et al. T cell anergy, exhaustion, senescence, and stemness in the tumor microenvironment. Curr Opin Immunol. 2013;25(2):214–221. doi: 10.1016/j.coi.2012.12.003 [DOI] [PMC free article] [PubMed] [Google Scholar]
- [42].Kishton RJ, Sukumar M, Restifo NP. Metabolic regulation of T cell longevity and function in tumor immunotherapy. Cell Metab. 2017;26(1):94–109. doi: 10.1016/j.cmet.2017.06.016 [DOI] [PMC free article] [PubMed] [Google Scholar]
- [43].van der Leun AM, Thommen DS, Schumacher TN. CD8(+) T cell states in human cancer: insights from single-cell analysis. Nat Rev Cancer. 2020;20(4):218–232. doi: 10.1038/s41568-019-0235-4 [DOI] [PMC free article] [PubMed] [Google Scholar]
- [44].Litton JK, Hurvitz SA, Mina LA, et al. Talazoparib versus chemotherapy in patients with germline BRCA1/2-mutated HER2-negative advanced breast cancer: final overall survival results from the EMBRACA trial. Ann Oncol. 2020;31(11):1526–1535. doi: 10.1016/j.annonc.2020.08.2098 [DOI] [PMC free article] [PubMed] [Google Scholar]
Associated Data
This section collects any data citations, data availability statements, or supplementary materials included in this article.
Supplementary Materials
Data Availability Statement
The data in the study is publicly available and unrestricted re-use is permitted via an open license. This data can be found here: The TCGA database (https://portal.gdc.cancer.gov/), and GSE45827 of The GEO database (https://www.ncbi.nlm.nih.gov/geo/query/acc.cgi). Authors agree to provide data and materials that support the results or analysis presented in their papers when reasonably requested.


