Abstract
Diabetic macular edema (DME) is characterized by hard exudates. In this article, we propose a novel statistical atlas based method for segmentation of such exudates. Any test fundus image is first warped on the atlas co-ordinate and then a distance map is obtained with the mean atlas image. This leaves behind the candidate lesions. Post-processing schemes are introduced for final segmentation of the exudate. Experiments with the publicly available HEI-MED data-set shows good performance of the method. A lesion localization fraction of 82.5% at 35% of non-lesion localization fraction on the FROC curve is obtained. The method is also compared to few most recent reference methods.
Keywords: Exudate segmentation, Retinal images registration, Statistical retinal atlas
1. Introduction
1.1. Clinical motivation
Diabetic retinopathy (DR) is the leading cause of visual impairment and blindness worldwide. According to the first global estimate of World Diabetes Population 2010 [1], there are approximately 93 million people with diabetic retinopathy, 17 million with proliferative diabetic retinopathy, 21 million with diabetic macular edema (DME) and 28 million with vision-threatening diabetic retinopathy. Diabetic retinopathy can be defined as the presence of typical retinal microvascular lesion in an individual with diabetes. The elements that characterize diabetic retinopathy in retinal fundus images are micro aneurysms (“red dots”), hemorrhages, cotton wool spots, macular anomalies like exudate and vascular proliferation. Among these, cotton wool spots and exudate can be categorized under bright lesions and the rest under dark lesions.
Exudates (often called hard exudates) are described as small sharply demarcated yellow or white waxy patches due to vascular leakage. These are the hallmarks for the diagnosis of macular edema in fundus images. Macula is the most used central area of the retina for vision. The adverse effect of exudates present in this area can vary from distorted central vision to complete loss of vision (in severe cases). A regular follow-up and laser surgery can reduce the risk of blindness by 90%. Such bright lesions are seen in the retinal fundus image characterize both the pre-proliferative and proliferative retinopathy stage.
The most widely used technique for retinal image acquisition is by means of a low cost fundus camera. For the diagnosis of the diabetic related complications it is important to localize the lesions, quantify them and to make subsequent follow-ups of them. However, in case of bright lesions like exudates this task is not easy due to: (1) the presence of anatomical structures (vessels, optic disc etc.) which may share similar information (intensity, texture etc) as those of the lesions, (2) illumination variability causing imaging artifacts and (3) eye movement and difference in head positions during multiple acquisitions. Computer aided diagnosis, potential follow-up and medical treatment thus require image processing pipeline that can solve these retinal imaging problems. The images must be pre-processed to remove the illumination variability and must be registered to a reference co-ordinate system for further analysis required for both the diagnosis and treatment.
1.2. Related work
Several ideas have been exploited in the past for the detection of both dark (mostly microaneurysms) and bright lesions. The methods of bright lesion segmentation can be divided into adaptive grey level based thresholding [2], region growing method [3,4], morphology based techniques [5], and classification methods [6–9].
Philip et al. [2] used a two step strategy to segment the bright lesions. The retina images were first shade corrected in order to eliminate the non-uniformities and to improve the contrast of the bright lesions. Then to segment these lesions a global and local threshold values were used. The method was reported to have sensitivity between 61% and 100%. However, artefacts due to noise in image acquisition can be detected as exudate with this technique.
Ege et al. [3] used template matching, region growing and thresholding methods to detect the bright lesions. They used a Bayesian classifier to identify the bright lesions as exudates and cotton wool spots. They achieved 62% sensitivity for exudates detection and a relatively low sensitivity of 52% for the cotton-wool spots. Sinthanayothin et al. [4] used recursive region growing on pre-processed color images. They classified the features into haemorrhages and microaneurysms as one group and hard exudates as another in non-proliferative diabetic retina images. The dataset with 21 images containing exudates and 9 without pathology were considered. A sensitivity of 88.5% at 99.7% specificity was reported. Both of these methods have used computationally expensive region growing algorithm. Sopharak et al. [5] proposed a method to automatically extract the exudates from the images of diabetic patients with non-dilated pupil. In their approach they used fuzzy C-mean clustering followed by morphological closing reconstruction. Standard deviation, hue, intensity and number of edge pixels are selected as input features based on exudate characteristics. The algorithm was evaluated on 10 images against their ground truth manually obtained by ophthalmologists. They present an overall sensitivity of 87.2% at specificity of 99.2%. Dupas et al. [10] used mathematical morphological transformation along with black top-hat step for the candidate selection. Then a k-neareset neighbours (k-NN) classifier was used. The article reported 72.8 % of sensitivity on dataset of 761 images. However, the same method fo diabetic retinopahty (DR) was reported to have 83.9% accuracy. Feroui et al. [11] combined the mathematical morphology and k-means clustering for hard exudate detection in the retinal images. The method was tested on 50 opthalmologic manually segmented by an expert. The drawback of both these methods is that first morphological closing reconstruction technique can give distance information between the detected exudates and the optic disc but it may fail to detect tiny exudates. The algorithm also will fail to separate the hard exudates with the other bright lesions like appearing structures like imaging artifacts, drusen etc.
Niemeijer et al. [7] applied a machine learning approach for the automatic detection of exudates and cotton-wool spots in color fundus images. They presented a method for distinguishing among drusen, exudate and cotton wool spots. 300 retinal images of patients with diabetes were chosen form tele-diagnosis database. The gold standard was built on this dataset by two retinal specialists. They achieved 95% sensitivity at 88% specificity for the bright lesions. The sensitivity/specificity pairs were 77%/88 %, 95%/86 % and 70%/93 % for drusen, exudates and cotton wool spots detection respectively.
Giancardo et al. [12] introduced a new methodology for automatic diagnosis of diabetic macular edema using a set of features that includes color, wavelet decomposition and automatic lesion segmentation. These features were used to train a classifier. The method is evaluated on the publicly available HEI-MED dataset (http://vibot.u-bourgogne.fr/luca/heimed.php) and MESSIDOR dataset (http://messidor.crihan.fr/download.php). The employed methodology in the article shows an area under the curve between 0.88 and 0.93. All of these classification methods require an accurate manual annotations for the training dataset. In addition they are also highly dependent on the type of features selected for classification.
In literature, a common drawback of the methods for exudate segmentation is the capability to separate highly correlated lesion pixels and the optic disc pixels effectively without missing true positives and/or introducing false positives. Optic disc removal in [9,13] is done by manually cropping the region whereas [14] used snake based segmentation method with an initial fitted circle to locate the optic disk area. While the former is a manual method, the later one is time consuming as it is based on an energy minimization technique. Both techniques are inefficient and prone to missing true positives of the probable lesions. We present a novel method of exudates segmentation by building a retinal statistical atlas based on ethnicity. Ethnic background plays a significant role in retinal luminance in the fundus images [15]. Our idea is to exploit the chromatic informations present in a particular ethnic group for efficient segmentation of lesion like pixels. The method first creates a statistical atlas based on ethnicity then warps any test image of the same ethnic group patient to that atlas co-ordinate frame. A simple distance map between the atlas and the test image suppresses the anatomical locations like optic disc, vessels, macula and leads to a good segmentation of the pixels belonging to the abnormality. This pipeline avoids any pre-processing, image normalization or any other complex image processing schemes presented as discussed above. Two post-processing schemes are also proposed for separating these segmented pixels as exudates from other abnormalities that might be present in the distance map thresholding. This technique also ensures the follow up of the lesion in the patients much more precisely because all the test images are warped to one reference co-ordinate frame.
The rest of the paper is organized as follows. Section 2 gives a brief description of the datasets used for the building statistical atlas and for the evaluation of the proposed method. In Section 3.1, we present a novel method for retinal atlas building. Section 3.2 deals with the subsequent segmentation of the exudates using the mean atlas image and the warped test image. The post processing schemes for separating the artifacts from the lesion are also discussed here. The results are presented and analyzed in Section 4. Finally, the paper ends with concluding remarks in Section 5.
2. Materials
To build the retinal atlases, one for each left and right eye, we have selected 400 good quality images of healthy African American from a dataset containing 5218 retina fundus images collected from February 2009 to August 2011 from clinics in the mid-South region of the USA as part the Tele-medical Retina Image Analysis and Diagnosis (TRIAD) project [16]. The images are from both healthy and abnormal retinas with color variations covering the pigmentation spectrum found in the patient population, which is approximately 70% African American and 30% Caucasian. The result of the exudate segmentation is validated using publicly available HEI-MED dataset [9] for diabetic macular edema. It includes a mixture of images with no macular edema or with varying degree of macular edema. The dataset consists of 169 fundus images with mixed ethnicities. We evaluated our method with the 104 images corresponding to African American patients since the method is used to exploit the atlas based ethnicity. The same dataset was used for comparison of other methods in literature with the method presented in this paper. Both mentioned datasets have macula centered images for both left and right eye.
3. Methodology
The purpose of building the ethnicity based statistical atlas is to represent the chromatic information of the retinal pigmentation of the vasculatures. Another goal is to know the locations of major retinal landmarks such as the superior and inferior major vessel arches, the optic disc and the macula. These information can be used to register any test image of the patient to a built reference co-ordinate system and subsequently help to suppress these anatomical structures of an eye seen in fundus images with the known reference locations and chromatic information for efficient segmentation of abnormalities (like lesions and artifacts). Further, post-processing schemes are applied to segregate the exudates from other similar pixels. The overall method is shown in Fig. 1. In this figure, we can see that a test image is first warped to the atlas co-ordinate system (atlas space) and then a distance image with the atlas mean image gives a good approximation of the lesion pixels and further processing enables the segmentation of the exudates. The methods has been explained in the following sub-sections.
Fig. 1.
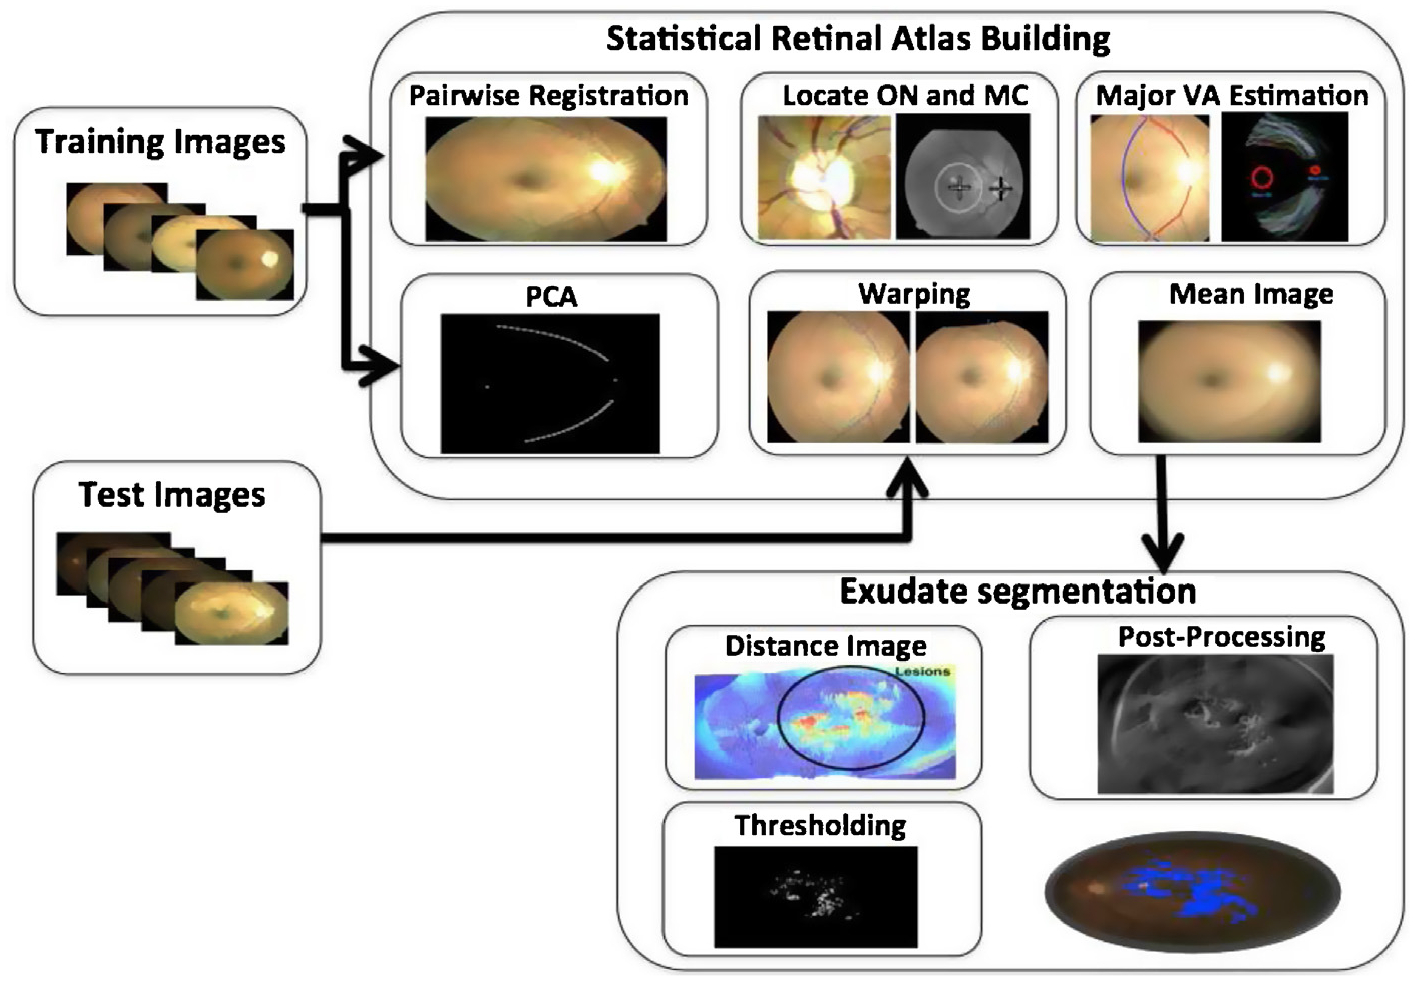
Block diagram of overall process.
3.1. Statistical retinal atlas
A retinal atlas provides a reference representation for important retinal structures: major vessel arches (superior and inferior), optic disc, fovea and eye pigmentation. First, a reference co-ordinate system is identified by rigid alignment of the detected optic nerve center, macula center and by finding mean shape of the tracked major vessel arches in the training dataset mentioned in Section 2. Second, all the training images are warped onto a reference co-ordinate system giving the mean image representing the retinal atlas. The overall block diagram is shown in Fig. 2. The major steps for building such a statistical retinal atlas are explained in the next subsections.
Fig. 2.
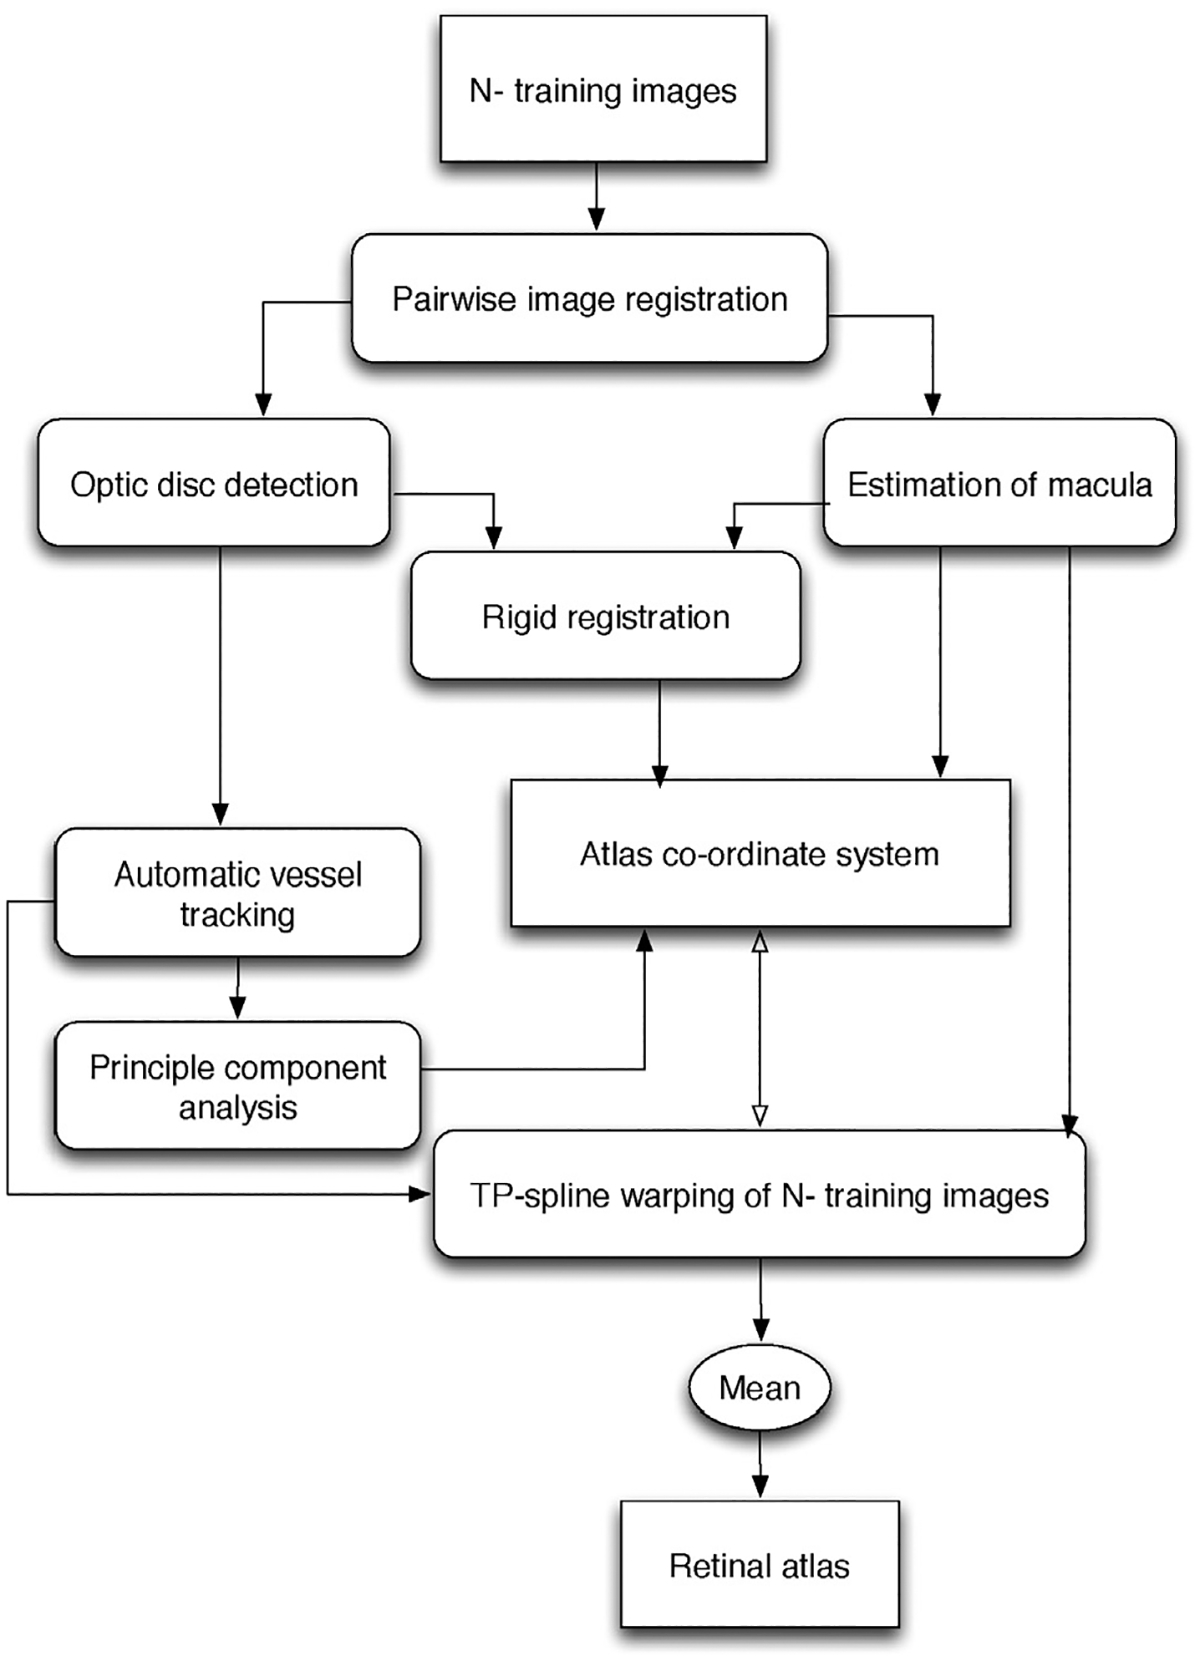
Block diagram of automatic retinal atlas generation.
3.1.1. Paired retinal images registration
The paired images are first registered using a feature based registration method. Feature vectors are extracted from the intensity image using SURF algorithm resulting in a 64-dimensional feature vector for each interest point [17]. An interest point in the test image is compared to an interest point in the target image by calculating the Euclidean distance between their respective descriptor vectors. A matching pair is detected, if its distance is closer than 0.7 times the distance of the second nearest neighbor. This is the nearest neighbor ratio matching strategy used to eliminate ambiguous pair of features [18]. We then apply RANSAC algorithm to further remove outliers and estimate the best transformation parameters from the known matches.
3.1.2. Rigid co-ordinate system
The basic structure of the optic disc is usually a circle and has an intensity peak at this region. The optic disc center is thus detected using circular Hough transform. The macula center was experimentally found to be 7° in the left eye and 173° in the right eye; below the line between the centre of the image and the optic disc location with a distance measure of 5.9 ± 0.08 mm. Let poc and pmc be the mean locations of the optic disc center and the macula center in N training fundus images respectively. These mean locations define the first two landmark positions in the retinal atlas co-ordinate system. Using these two known reference points and the estimated optic center and macula locations in the training images, we find a rigid transformation matrix solving for {θ, tx, ty} where is the rotation angle, and {tx, ty} represents the translation vector. If pi denotes the pixel locations of the optic center or the macula in a training image, then the new location qi in a warped image in the atlas co-ordinate system is given by:
| (1) |
with Ti = [tx, ty]T representing the translation vector.
3.1.3. Automatic vessel landmarks generation
Considering the automatically detected optic disk location using Hough transform as center of an arbitrary co-ordinate system shown in Fig. 3(a), we define some empirical assumptions for finding the major arches in the registered image pairs of each eye. These assumptions are made based on the geometrical localization of the major vessel arches in the images and experimental results conducted for their detection. They are used in locating the seed points for the vessel arches, which are then found automatically. They are chosen based on the geometrical availability of the retinal major vessel arches and the experiments conducted for the search space of them.
Fig. 3.
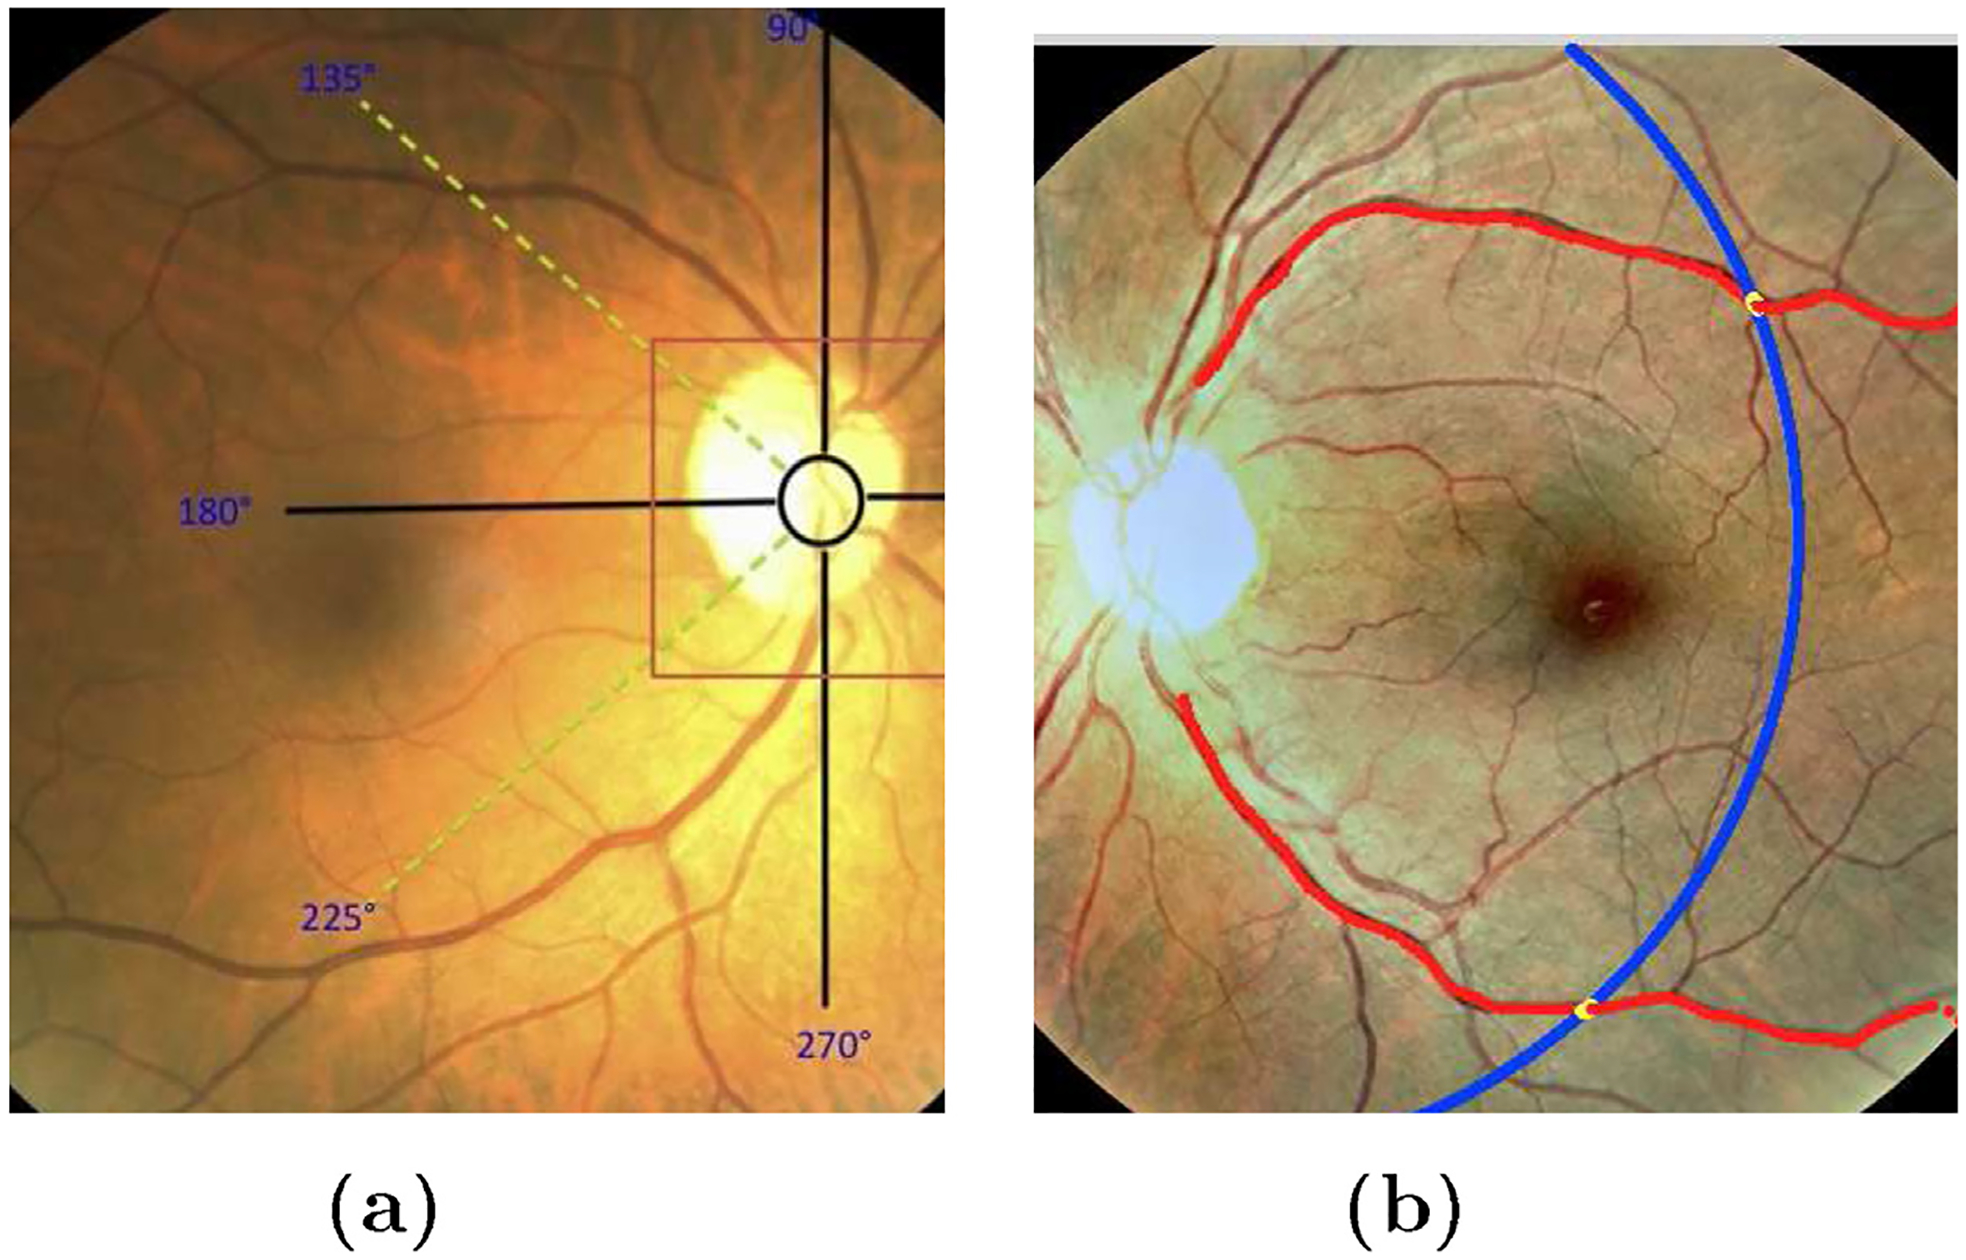
Vessel tracking. (a) Search location of major arches in right eye; (b) automatic major arches tracing in left eye. Red points are the centers of the tracked vessels and blue line is the arc giving the similar length of arches for all the training images. Yellow points represent the end points on them.
For the right eye, starting from the detected optic disc center, the search is made in the interval [90°, 135°] for the upper arch and in [225°, 270°] for the lower arch. Similarly, for the left eye, the search is made in the closed interval [45°, 90°] for the upper arch while for the lower arch the interval is [270°, 315°].
A rectangular mask of size 20 × 20 is taken around each pixel within the search interval mentioned above to find the highly correlated pixels using a low pass differentiator correlation kernel on vessel enhanced image. Vessel enhancement was done by analysing the Hessian matrix according to [19]. The correlation filter [20] adapted on this filtered image is locally oriented along x-axis and is defined by,
| (2) |
where ⊗ represents the convolution operator along y-direction, δ represents the impulse response of the filter and K is the kernel size.
The vessels are characterized by well defined edges and have comparatively lower reflectance compared to the local background. The intensity varies smoothly within the vessels. Also speaking particularly about the major vessel arches, they have strong edge response relative to other vasculatures so we were able to restrict the trace along the major vessel arches even in presence of arch nodes. The pixels within the constrained search window defined are convolved with the kernel in Eq. (2). The peak response of this correlation kernel is obtained at the major vessel arches. The pixel location is taken as a seed point for tracking the major vessel. Vessel boundaries can be obtained by rotating correlation kernels given by Eq. (2). Multiple templates are correlated with the seed point and the search is moved along the point with the highest response [20]. Each template is divided into right and left template. Left template finds the edge location in 90° counter-clockwise direction and right is tuned to the right boundary. The angle of rotation of the kernel is discretized into 16 values at spacing of 22.5°. The sum of square weights of the elements is 60 in each template. Additionally, we have used Kalman filter to avoid from jumping of the major vessel arch trace to another vessel at the bi/tri-furcations (i.e. vessels nodes). The tracked major arches are shown in Fig. 3(b). The blue arc gives the end points cutting the tracked vessels at yellow points. Typically, the radius of this arc is taken equals to 1.45 × the distance from macula center to optic disk. This is an empirically chosen value which only confirms the same lengths of the traced major vessels in all the images.
3.1.4. Atlas co-ordinates system generation
For the N pairwise aligned images in the training set we automatically find M (M = 20) equidistant points on each of the two major arches. The major arches are shown in Fig. 4(a). We then apply PCA (principal component analysis) on these points coordinates to find to two major vessel arches in the atlas co-ordinates frame as shown in Fig. 4(b).
Fig. 4.
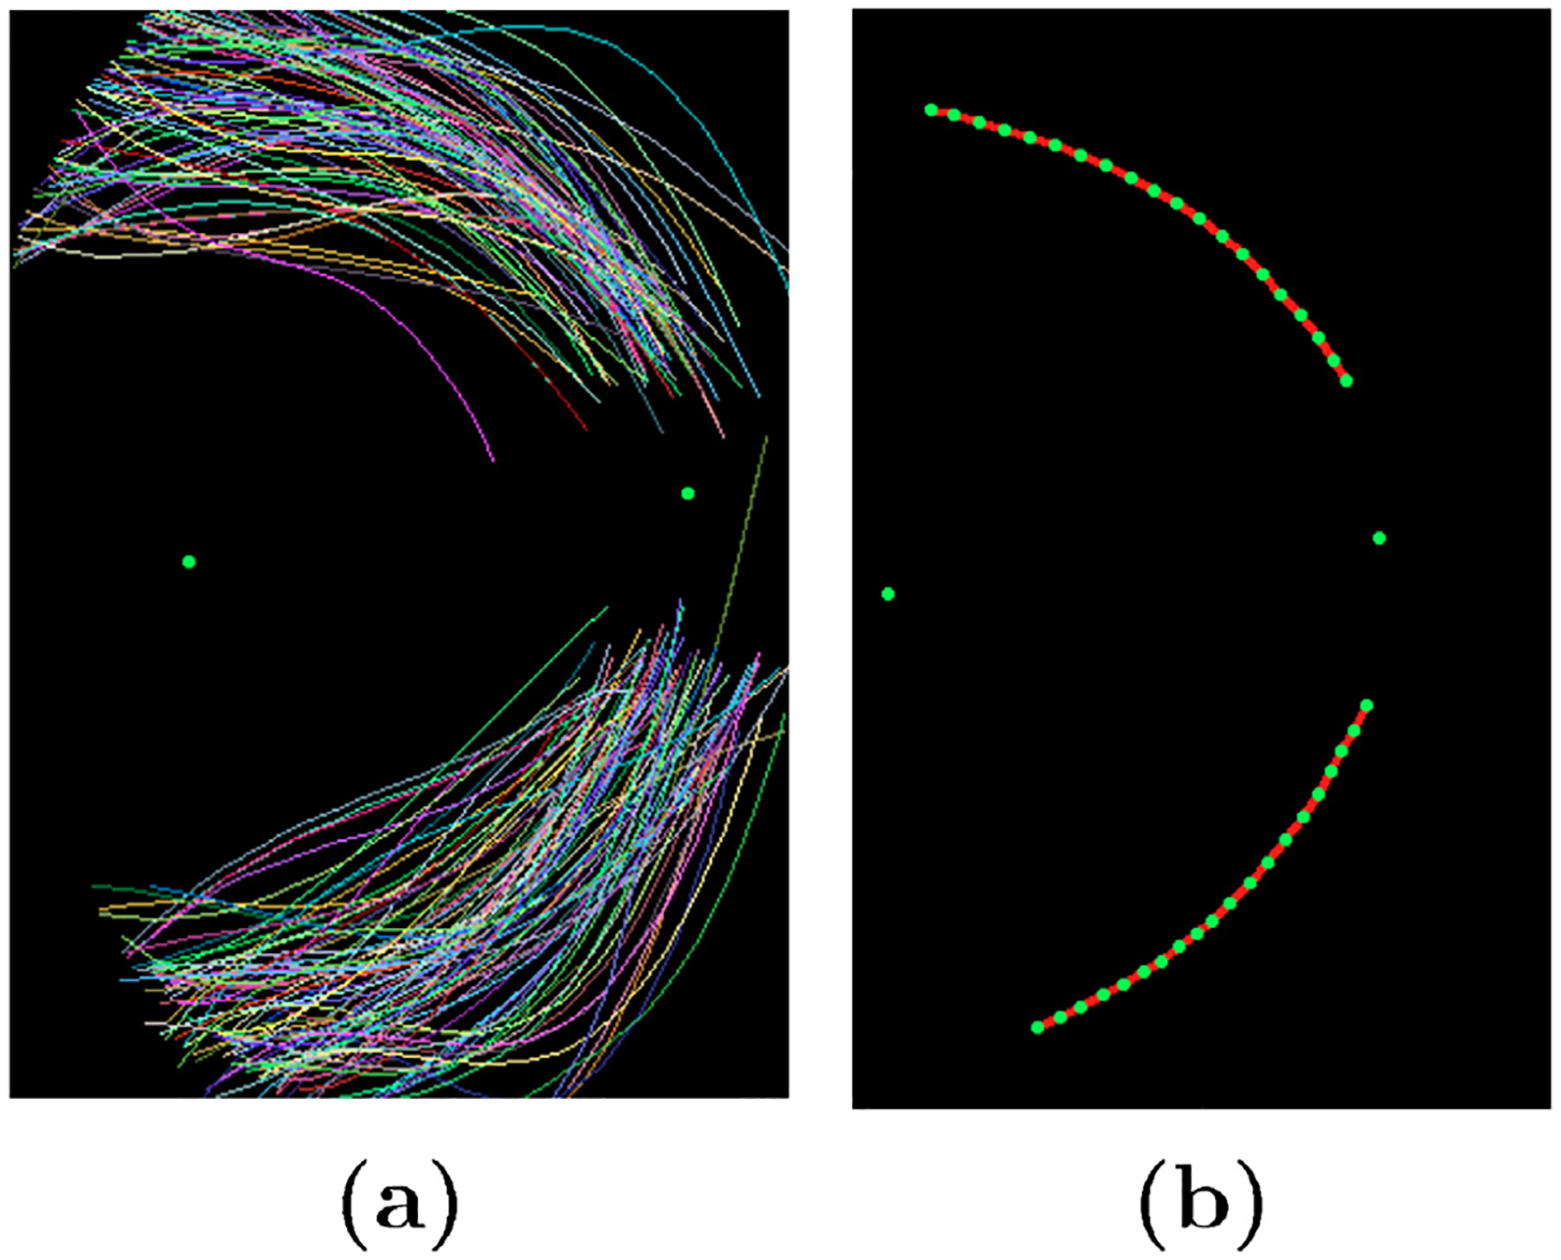
Formation of atlas co-ordinate system. (a) Major vessel arches traced; (b) Atlas co-ordinate system with optic center, macula center and major vessel arches.
Each training image is warped onto the atlas co-ordinate system using thin-plate splines [21] as shown in Fig. 5. After all the images are warped into this atlas co-ordinate system, we take the mean to get the average color/pigmentation in the population. The mean image is normalized to obtain an atlas map for the ethnic group (here African American) population as shown in Fig. 5.
Fig. 5.
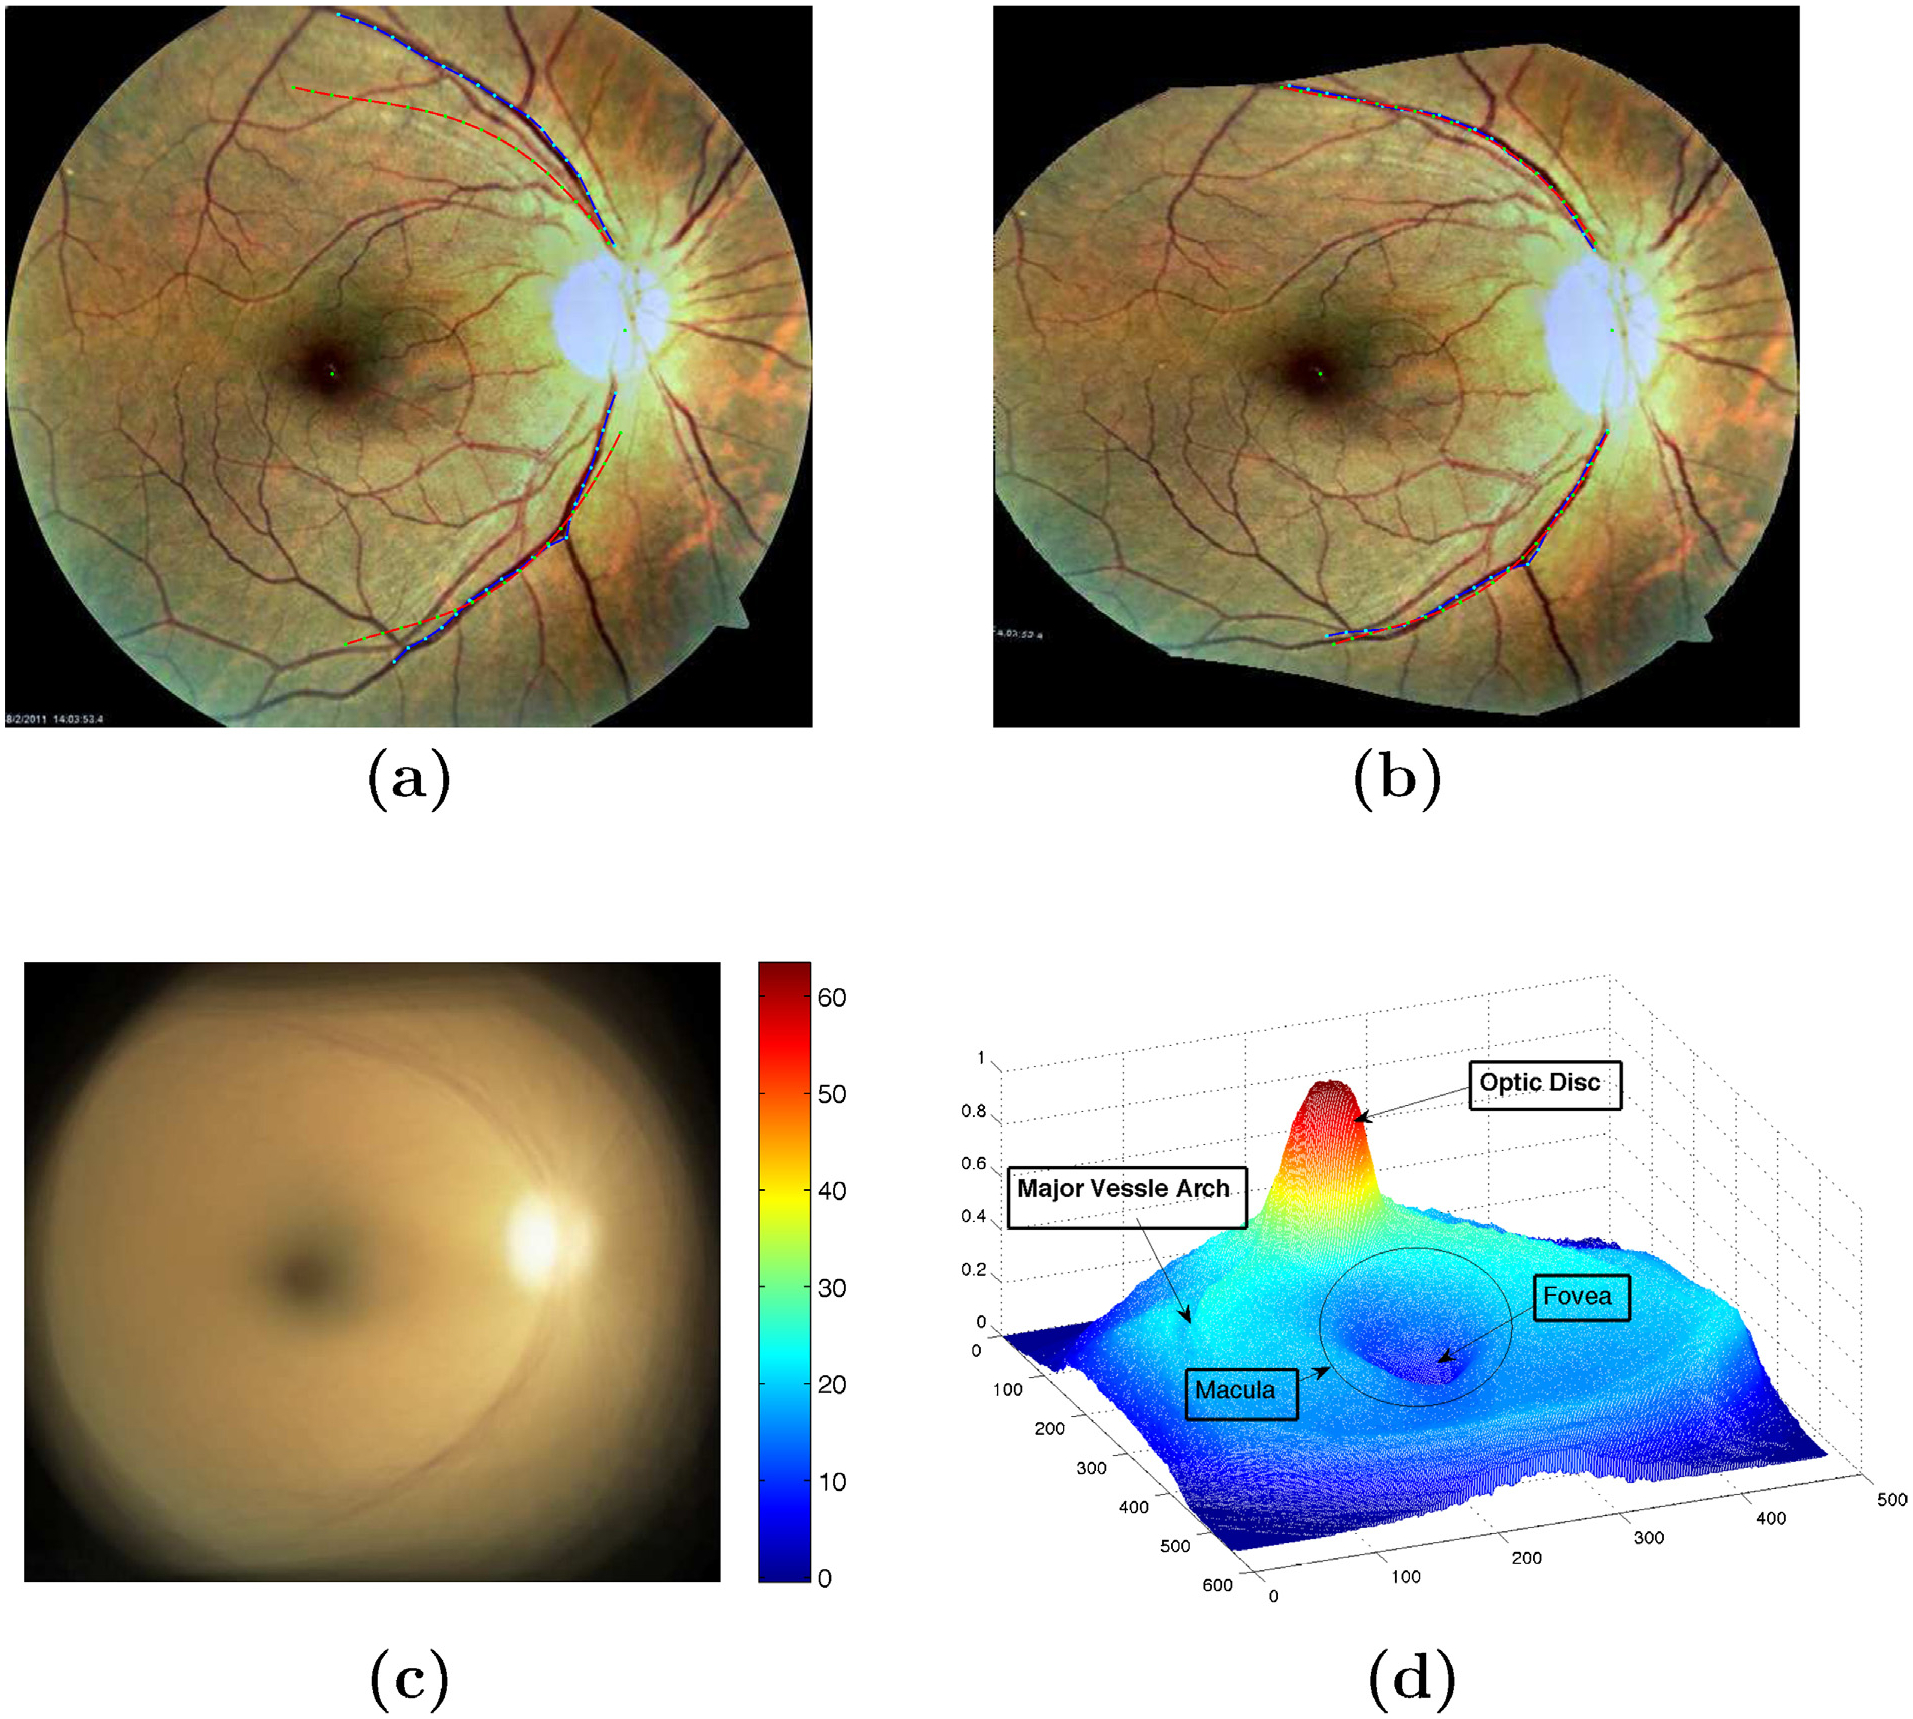
Warping of the training images onto atlas co-ordinate. (a) On original image, red line represents the atlas co-ordinate and blue represents the main vessel arches of the image to be warped; (b) Image after warping with thin plate spline to atlas co-ordinate; (c) Mean image of 200 warped images onto atlas space with its chromatic distribution; (d) Statistical atlas image with labelled landmarks.
3.2. Exudate segmentation
Supervised learning methods require large amounts of manually labelled data which are susceptible to human errors and usually give inconsistent segmentation results. Moreover, it is slightly impracticable to obtain do such classification methods for large dataset due to the need of large amount of manual annotations by experts. We introduce a novel approach for segmenting bright lesions based on the retinal atlas created in Section 3.1. The key feature of the method proposed here is that we make use of chromatic differences between the mean atlas image (generally providing the measure of healthy eye pigmentation) with the fundus image (with lesion) of a diseased eye. This will give the potential lesion candidates. Upon applying post-processing schemes like edge detectors, a final segmentation of exudates are obtained.
3.2.1. Exudate detection methods for comparison
We have compared our method with the methods proposed by Sanchez et al. [22], Sopharak et al. [23] and Giancardo et al. [9,12]. These methods are the most recent rule-based – meaning they do not use data mining technique and are independent of the used datasets. These exudate segmentation algorithms consists of two main steps: a pre-processing step to remove irrelevant structures and an exudate segmentation step. We briefly describe each method below:
Sopharak et al. [23] used the contrast-limited adaptive histogram equalization (CLAHE) algorithm to enhance the contrast of retinal images. Then, the optic disc and the vasculature were removed using morphological operations. These pre-processing steps were followed by the exudate segmentation step which started by first capturing the image intensity variations; computing the standard deviation on a sliding window and converting the image into a binary image using Otsu-algorithm [24]. A circular structuring element was used to dilate the cluster of similar lesion in this binary image. Further, soft estimation of the lesions were obtained through morphological reconstruction. The final segmentation result was evaluated with dynamic thresholds {ththres ∈ (0: 0.05: 1)}.
Sanchez et al. [22] first used the green channel of the fundus image due to its higher contrast in RGB color space. The authors found the pixels belonging to the background using the method described in [25] and applied bilinear interpolation to generate the complete background. The image was then modeled as a mixture of three Gaussian models representing background, foreground and outliers respectively. The foreground consisted of vessels, optic disk and lesion. An EM (Expectation-Maximization) algorithm was used to estimate the exudate candidate and thresholded dynamically. As the exudate detection procedure, the authors employed Kirsch edge operator [26] to separate the exudate from artifacts and other bright lesions.
Giancardo et al. [9] first preprocessed the image using a large median filter on the I-channel of the normalized image in HSI color space for background estimation. The normalized image was further enhanced with morphological reconstruction giving a clear distinction between the dark and bright structures. The author manually removed the optic nerve. The exudate candidates were selected based on some score using connected component analysis. The score was then assigned based on Kirsch edges and stationary wavelets.
3.2.2. Proposed exudate segmentation method
The exudate segmentation methods discussed above require many preprocessing steps. We present a method which not only removes a wide range of preprocessing steps for subsequent exudate segmentation but also registers the test images to a reference co-ordinate system.
The statistical atlas image is built from our dataset (see Section 2) following the procedure described in Section 3.1. During this process, we obtain a retinal atlas co-ordinate system which will help in aligning any new test image to one reference frame, and a retinal mean image whose distance map with the warped test image on the atlas space will help in separating the lesion-like structures while suppressing the optic disc, the macula and other vasculatures as shown in Fig. 6. This is because it replicates the chromatic distribution of the pixels in the eye which gives likelihood of pixels belonging to optic disk, fovea, major vessels arches and other vasculatures. Thus, there is a strong variance in the pixels with lesion or artifacts due to imaging.
Fig. 6.
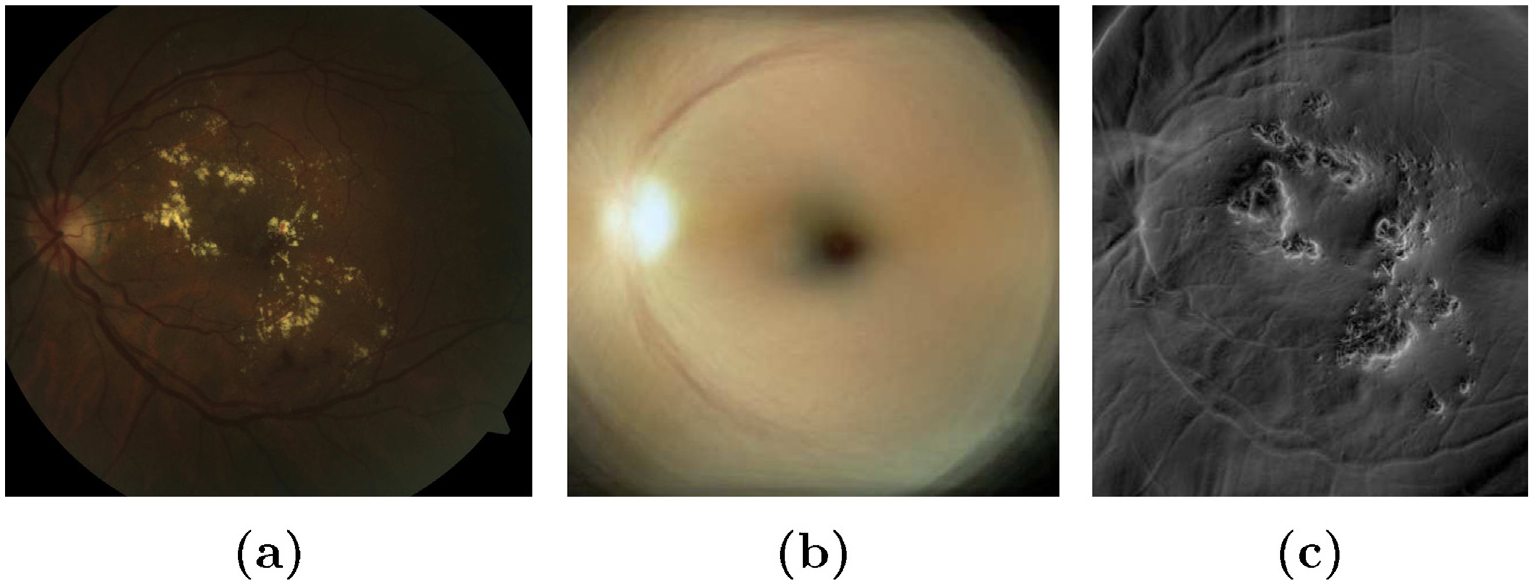
Distance image of a test retinal image with the mean atlas image. (a) Retinal test image with lesion; (b) mean atlas image; (c) distance map between (a) and (b).
3.2.3. Post-processing schemes
After separating the lesion-like structures from the test image, it is important to separate the artifacts from the lesion. Hard exudate have a distinct characteristic of having sharp edges. Therefore, edge detection schemes can be advantageous and provide better result. We have investigated two edge detectors: (1) a 2D-quadrature filter called Riesz transform and (2) 8-directional Kirsch compass kernel detectors. Advantage of using Riesz transform is that it is phase invariant and detects the edges in all directions. But, the major limitation of such filters is that there is strong likelihood of nearby edge pixels getting blended together [27] which will introduce the false positives (FPs) in the detection. On the other hand, the step response of the derivative filters like Kirsch Edge operator discussed above has a narrow band relatively. However, using Kirsch edge operator alone will also limit the detection because of its limited orientations. Thus we use a combination of both filters to improve detection results. The two edge detectors are briefly explained below:
Kirsch operator is a non-linear edge detector kernel that evaluates the edges in 8 different directions on an image often called as “Kirsch compass kernels”. The operator is calculated for 8 directions with 45° difference [28] and the maximum of them is taken as the result.
| (3) |
where, is the directional kernel.
A 2D steerable filter h(x) of order is mathematically defined as the linear combination of basis filters n(x) and coefficients an(θ) [29]:
| (4) |
One of the major advantage of using Riesz tansform is that the coefficients are essentially zero in smooth area of the image [31]. Therefore, it enhances the edges of the structures in retinal images as can be seen in Fig. 8(b).
Fig. 8.
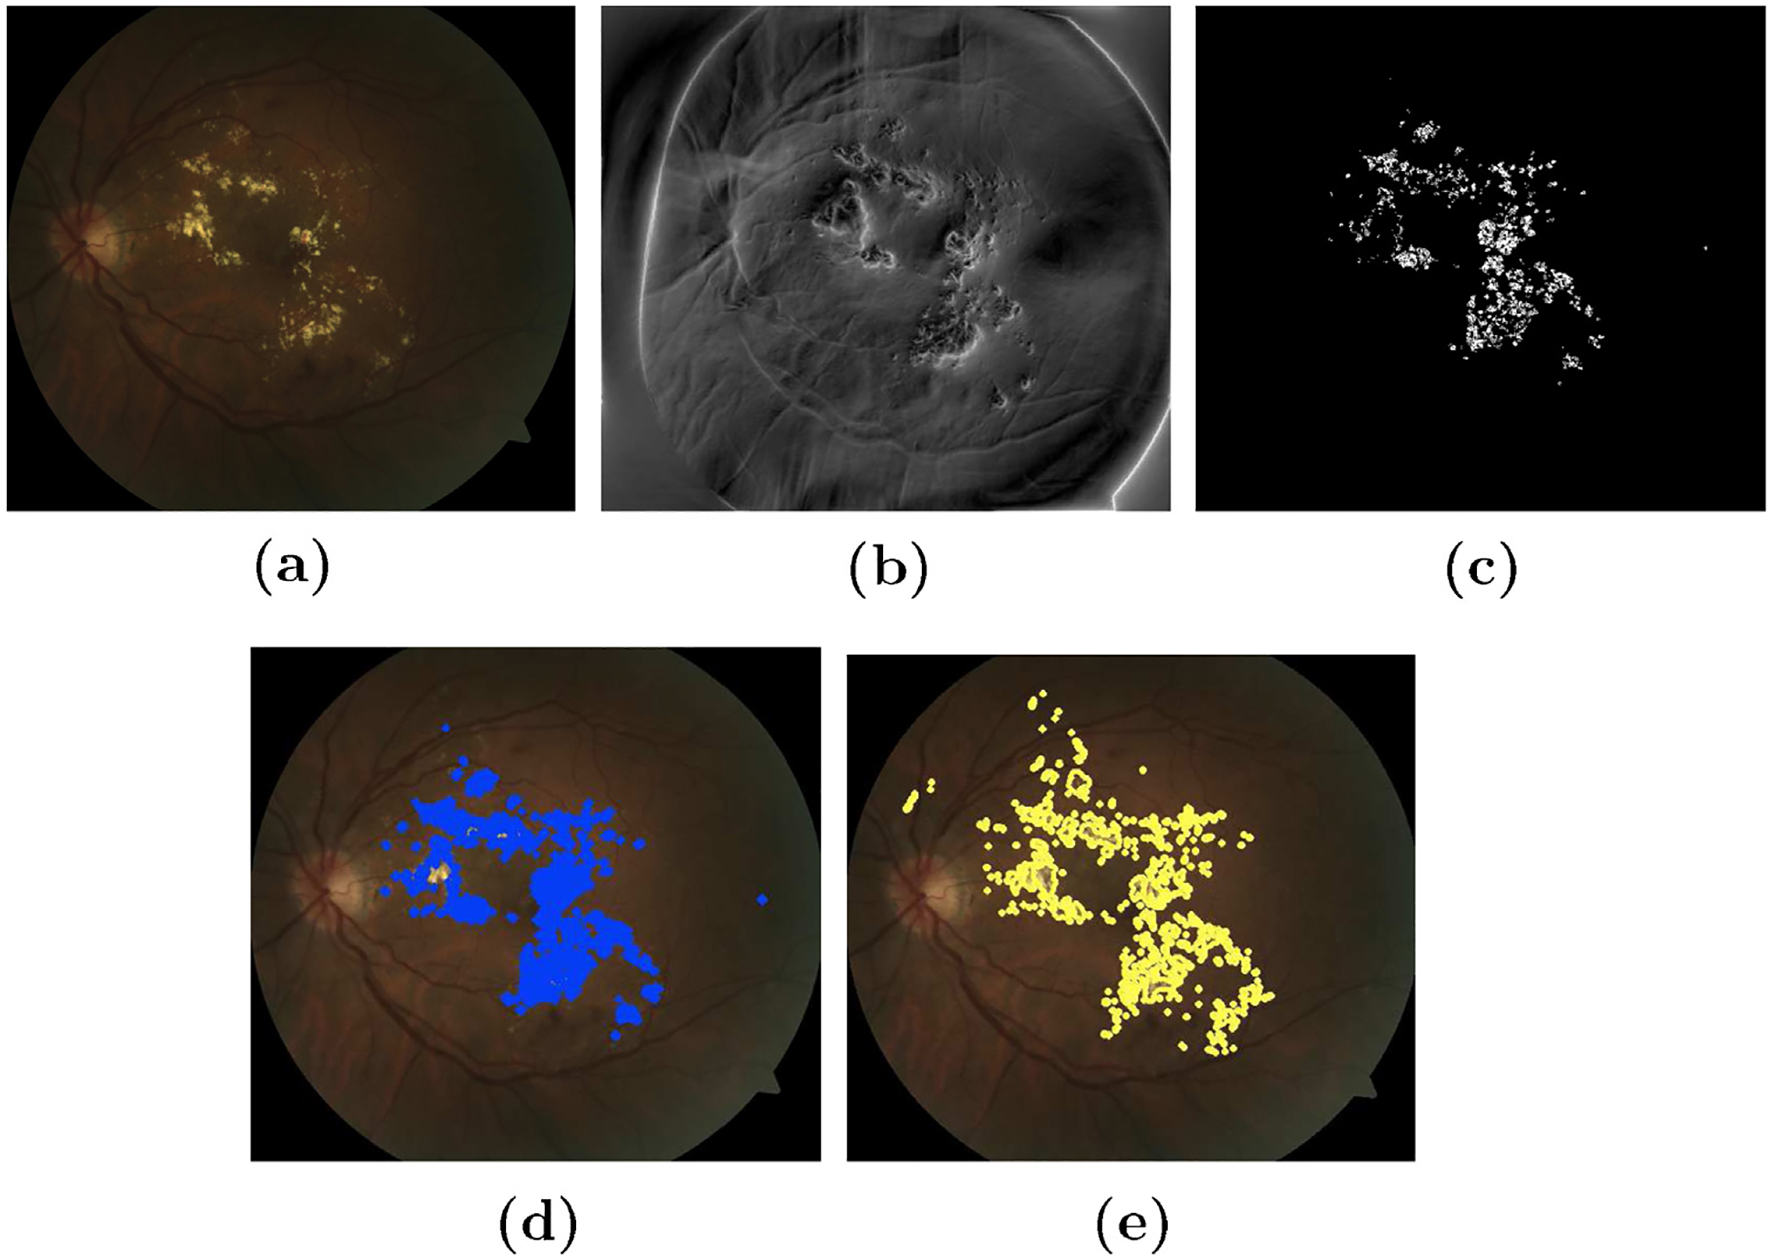
Exudate segmentation on atlas space. (a) Original image (b) steerable Riesz transform applied on atlas space (c) thresholding the absolute image after removal of FOV mask (d) plot of lesion on original image after unwrap of lesion pixels and (e) ground truth labelled by an expert.
In Fig. 7 we have demonstrated the importance of such adaptive filters for edge detection and enhancement on the atlas-space [30]. It is clear from the figure that the distance of the test image (having lesions) with the gold standard (atlas mean-image) is higher when 2D-Riesz filter is applied. Thus increasing the rate of detection of the pixels belonging to the exudates.
Fig. 7.
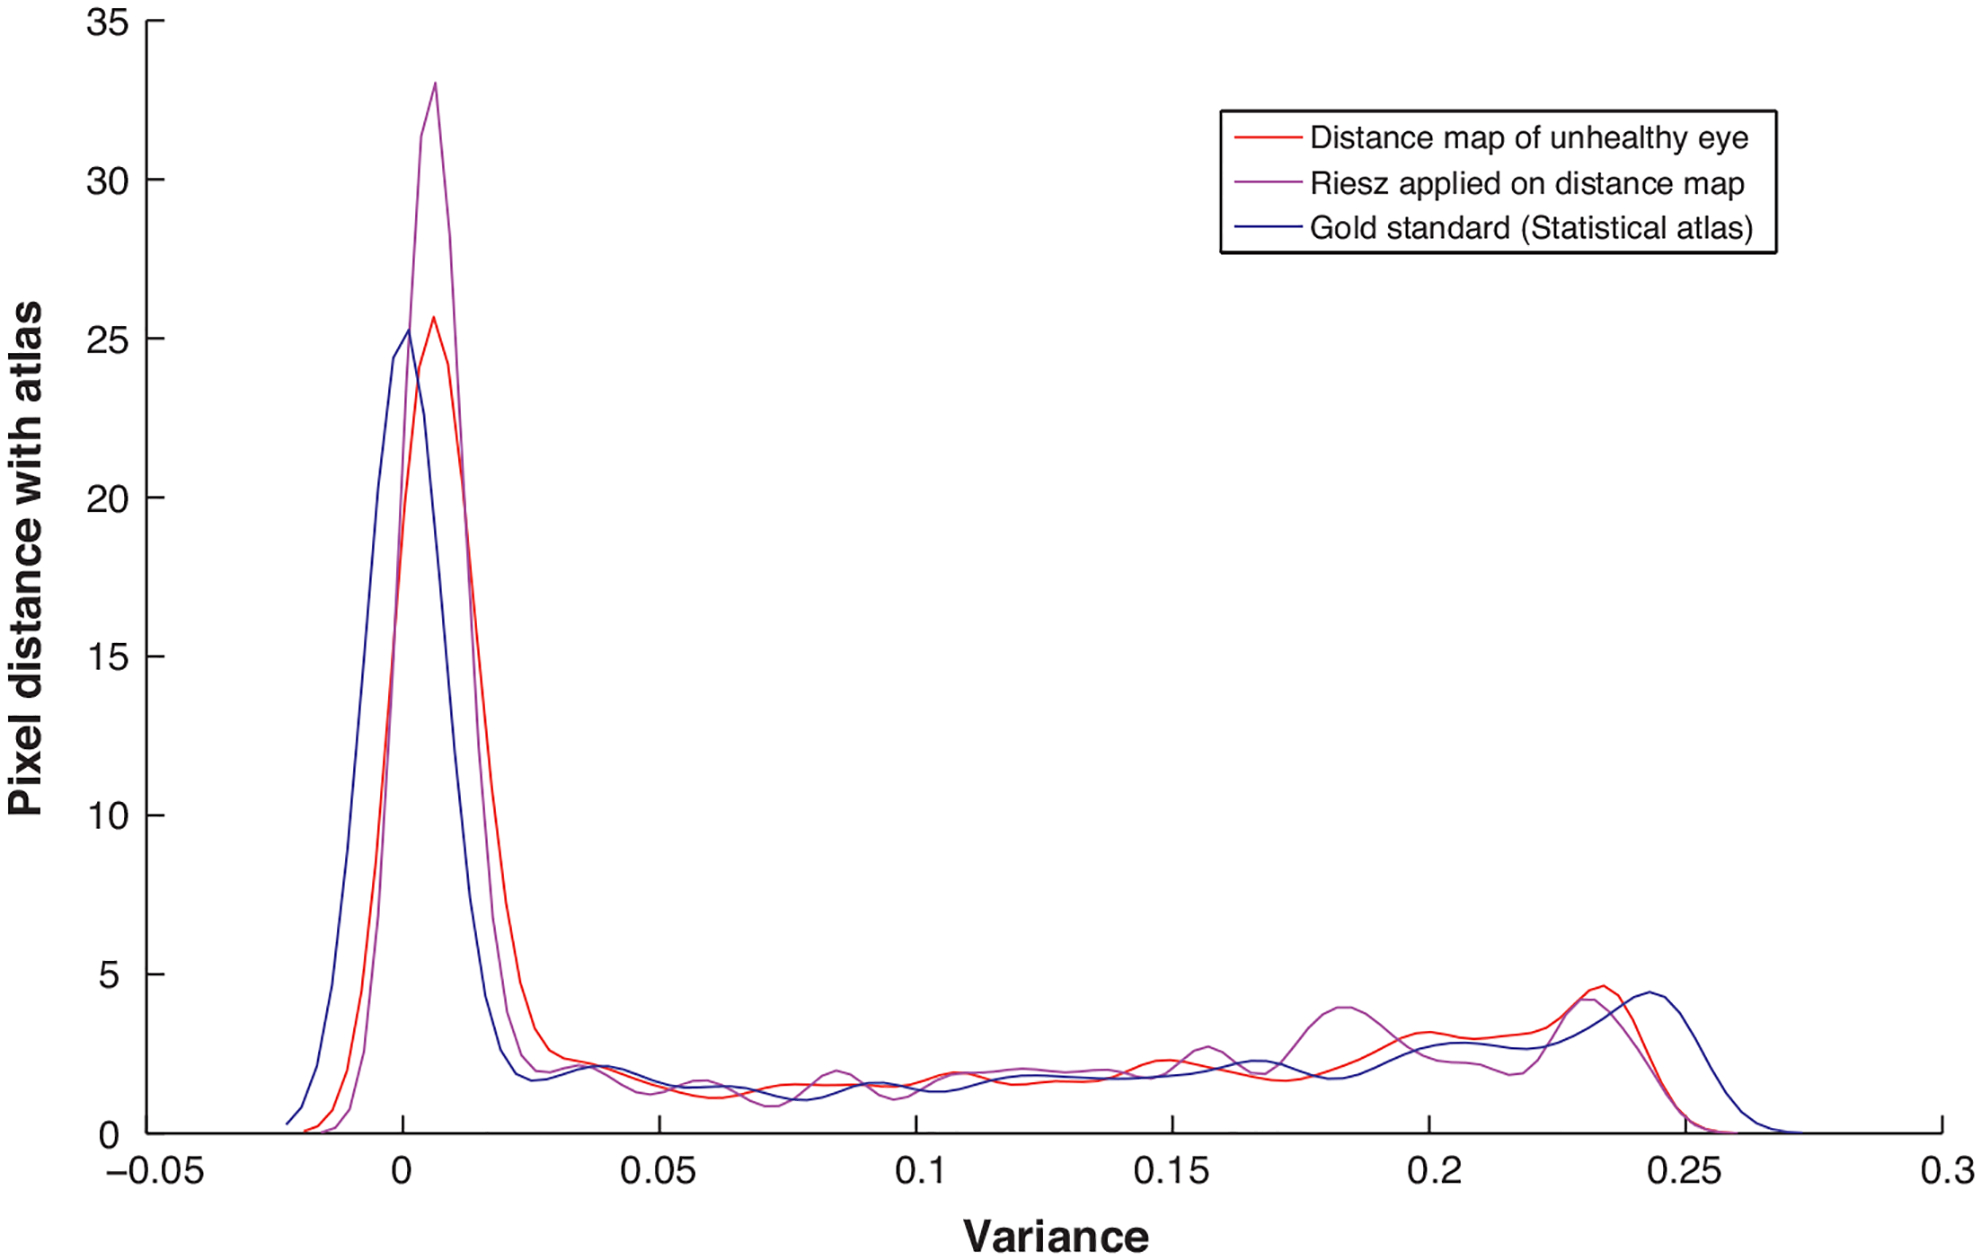
Post processing scheme enhancing the lesion pixels in an unhealthy test image [30].
4. Results
In this section we present different methods that have been used to evaluate the segmentation of DME in retinal fundus images using the proposed atlas based approach. The method was evaluated on publicly available HEI-MED dataset discussed in Section 2. We have evaluated our method using the 104 African American images from the dataset. FROC curves are used to analyze the accuracy of the methods.
The performance accuracy of the diagnosis by an algorithm has to be evaluated based on some criterion which takes into account the output of the algorithm versus a ground truth. The possibility of disease detection by an algorithm is characterized by plotting ROC curve and FROC curve. The area under the curve gives the accuracy of the algorithm in use. FROC is a region based analysis unlike the pixel-based ROC-method and is widely being used in the evaluation of computer aided diagnosis. For our evaluation purpose with the ground truth provided in the HEI-MED dataset, a true positive is considered when at least a part of the lesion overlaps with the ground truth. The detection is a false positive when the exudate is found outside the region of the manually annotated ground truth and a false negative if no lesion is found in the image while a lesion exists. as lesion localization fraction).
4.1. Result with different post-processing schemes
The results obtained for the different segmentation methods (depending on the type of post-processing scheme) discussed below is shown in Fig. 9. The FROC-analysis curve is shown in Fig. 10 and their respective accuracy results are shown in Table 1.
Fig. 9.
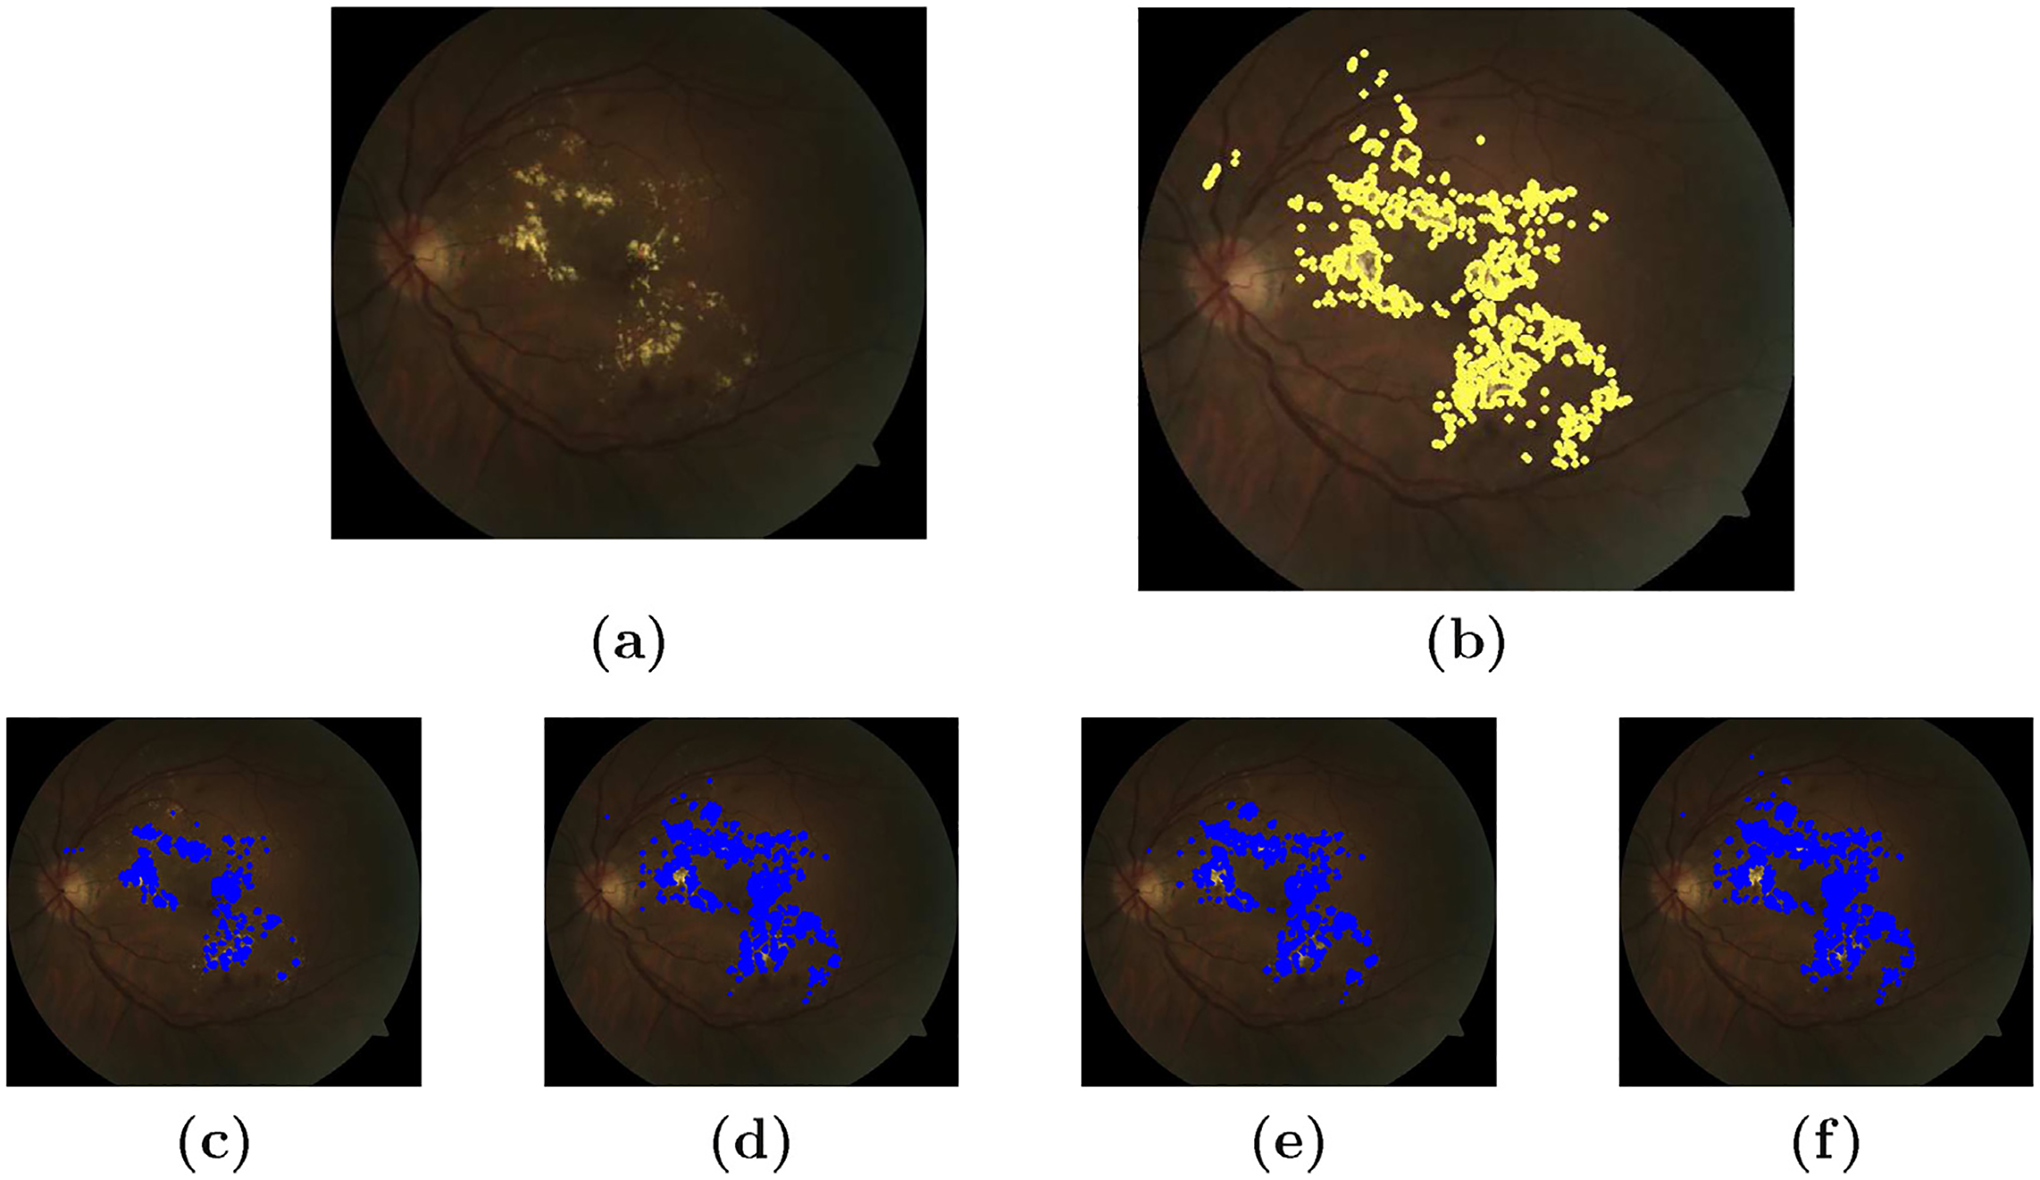
Different post-processing schemes for exudate segmentation. (a) Original image (b) ground truth (c) simple thresholding (d) steerable wavelet (e) Kirsch operator and (f) steerable and Kirsch’s operator.
Fig. 10.
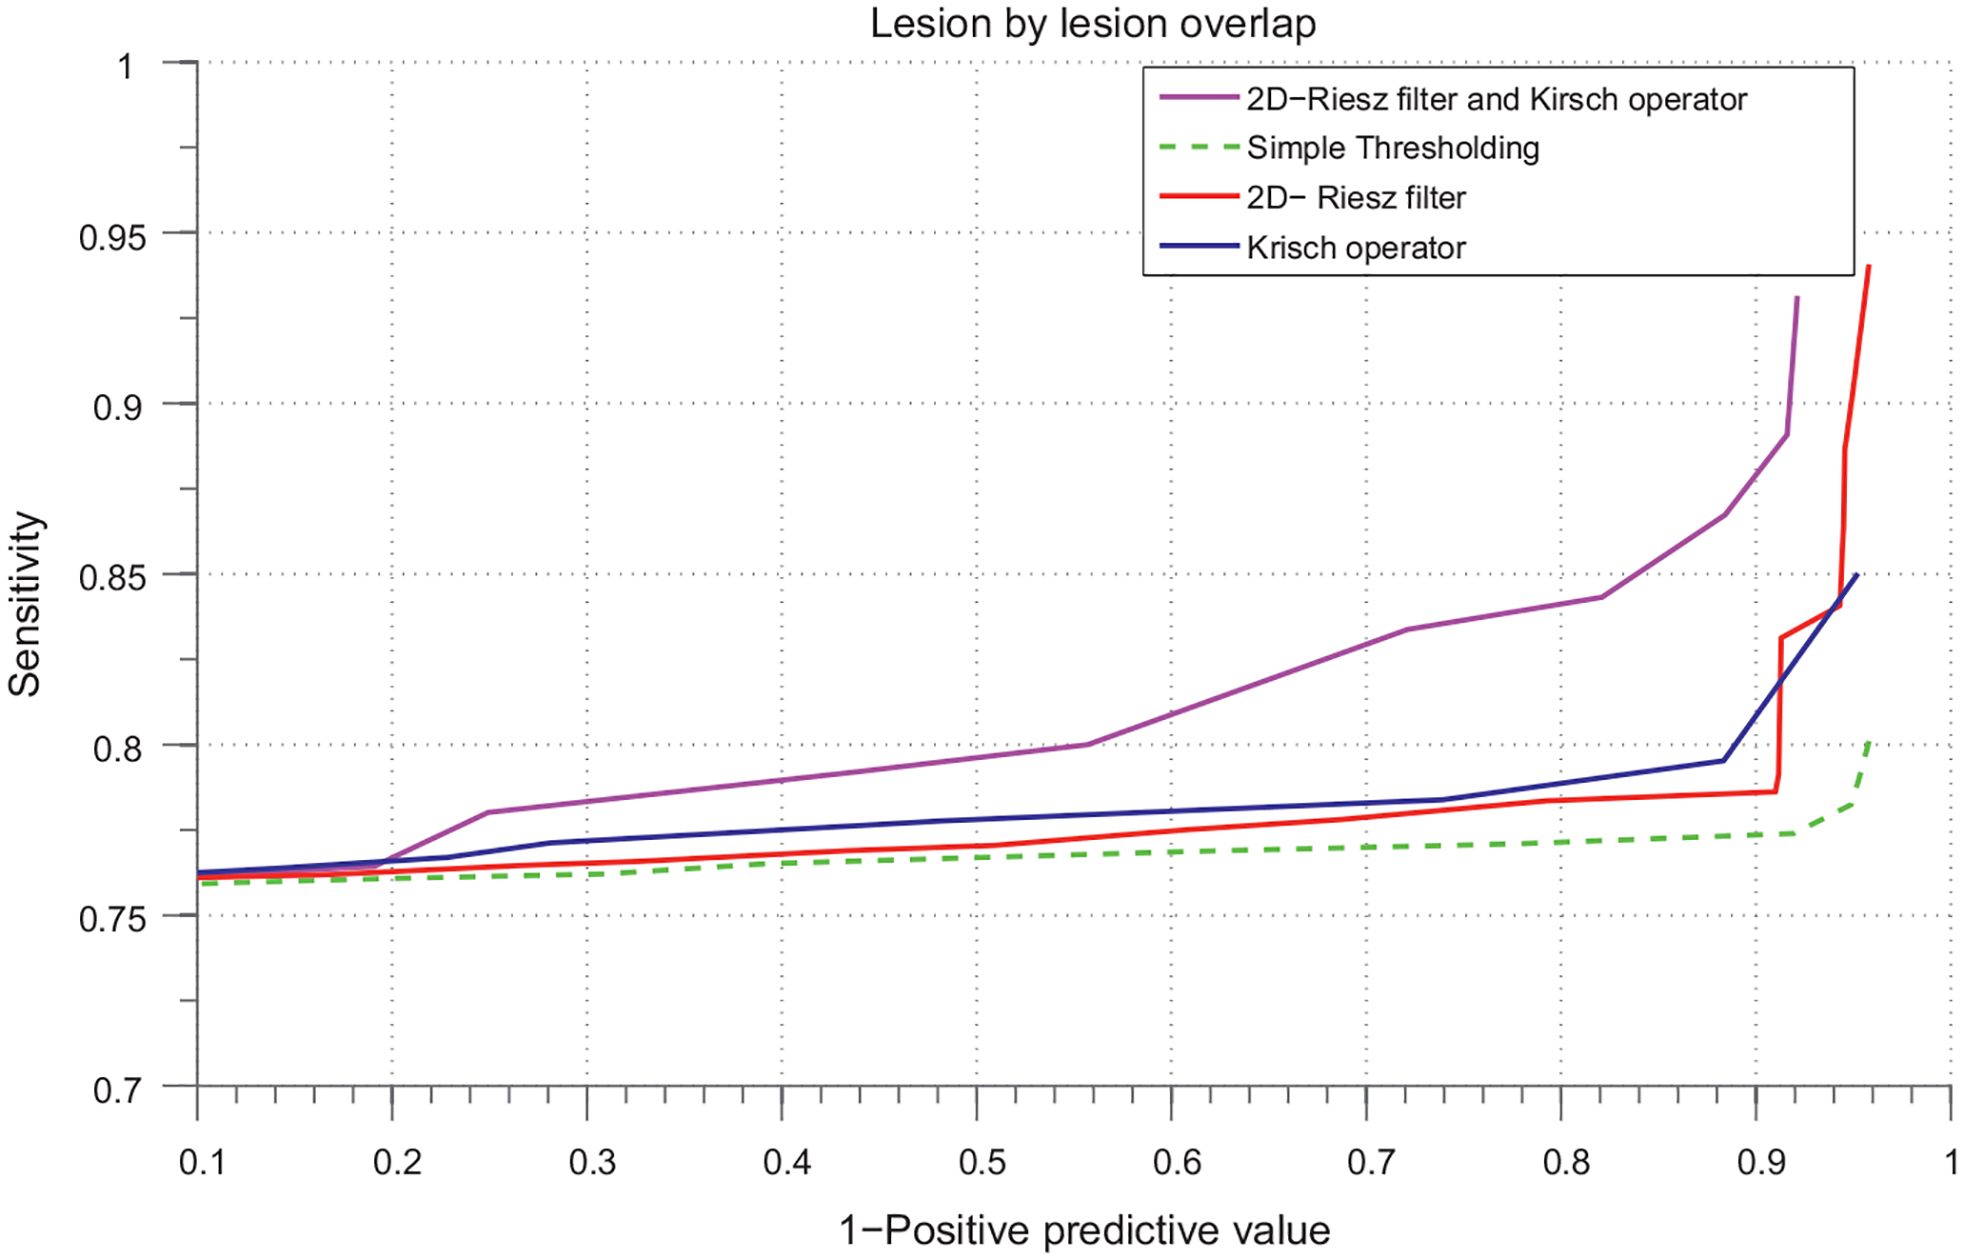
FROC curve. Based on exudate segmentation performance on the 104 images of HEI-MED dataset.
Table 1.
AUC for with/without post processing.
| Method | AUC |
|---|---|
| Direct Thresholding | 0.7612 |
| Kirsch’s Operator) | 0.7832 |
| Steerable Pyramid | 0.7866 |
| Kirsch+Steerable | 0.8258 |
Thresholding.
The bright lesions have high distance with the atlas mean image. So, these lesions can be directly segmented using simple thresholding method without using any post-processing approaches. We obtained a descent accuracy of 76.12% on FROC-curve for DME segmentation.
Steerable wavelet.
We have used 2D-Riesz transform which is multi-directional and multi scale wavelet. This post-processing is done to improve the result compared to simple thresholding method. However, the improvement is small giving us an accuracy of 78.66% on the same dataset.
Kirsch’s operator.
A 8-directional edge detector is used to boost the edges of the exudate regions. We do so because these lesion have well-defined edges which help us to remove false positives and increase true positives detection. The accuracy of the segmentation increases a little bit compared with simple thresholding, 78.32%.
Kirsch with Steerable wavelet.
Again, as a post processing scheme, we first used the steerable multi-directional filters to enhance the edges then we used Kirsch’s operator to detect the edges. This revealed few lesions which were suppressed while using steerable or Kirsch’s operator alone. Experiments show that the combination of these two directional edge enhancement methods increases the true positive detection. The accuracy rate increases to 82.58%.
From our experiments, we can see the direct effect of using an atlas in exudate segmentation. A simple thresholding result in atlas space is equally comparable to other post-processing as shown in Table 1. This can be useful for necessary feature extraction in automatic lesion detection methods without using complex processing steps. Some detection examples are shown in Fig. 11. The thresholds used to evaluate the algorithms are ththres ∈ {0: 0.05: 1}. The interval is chosen so as to trace the correct sensitivity parameter at a given threshold.
Fig. 11.
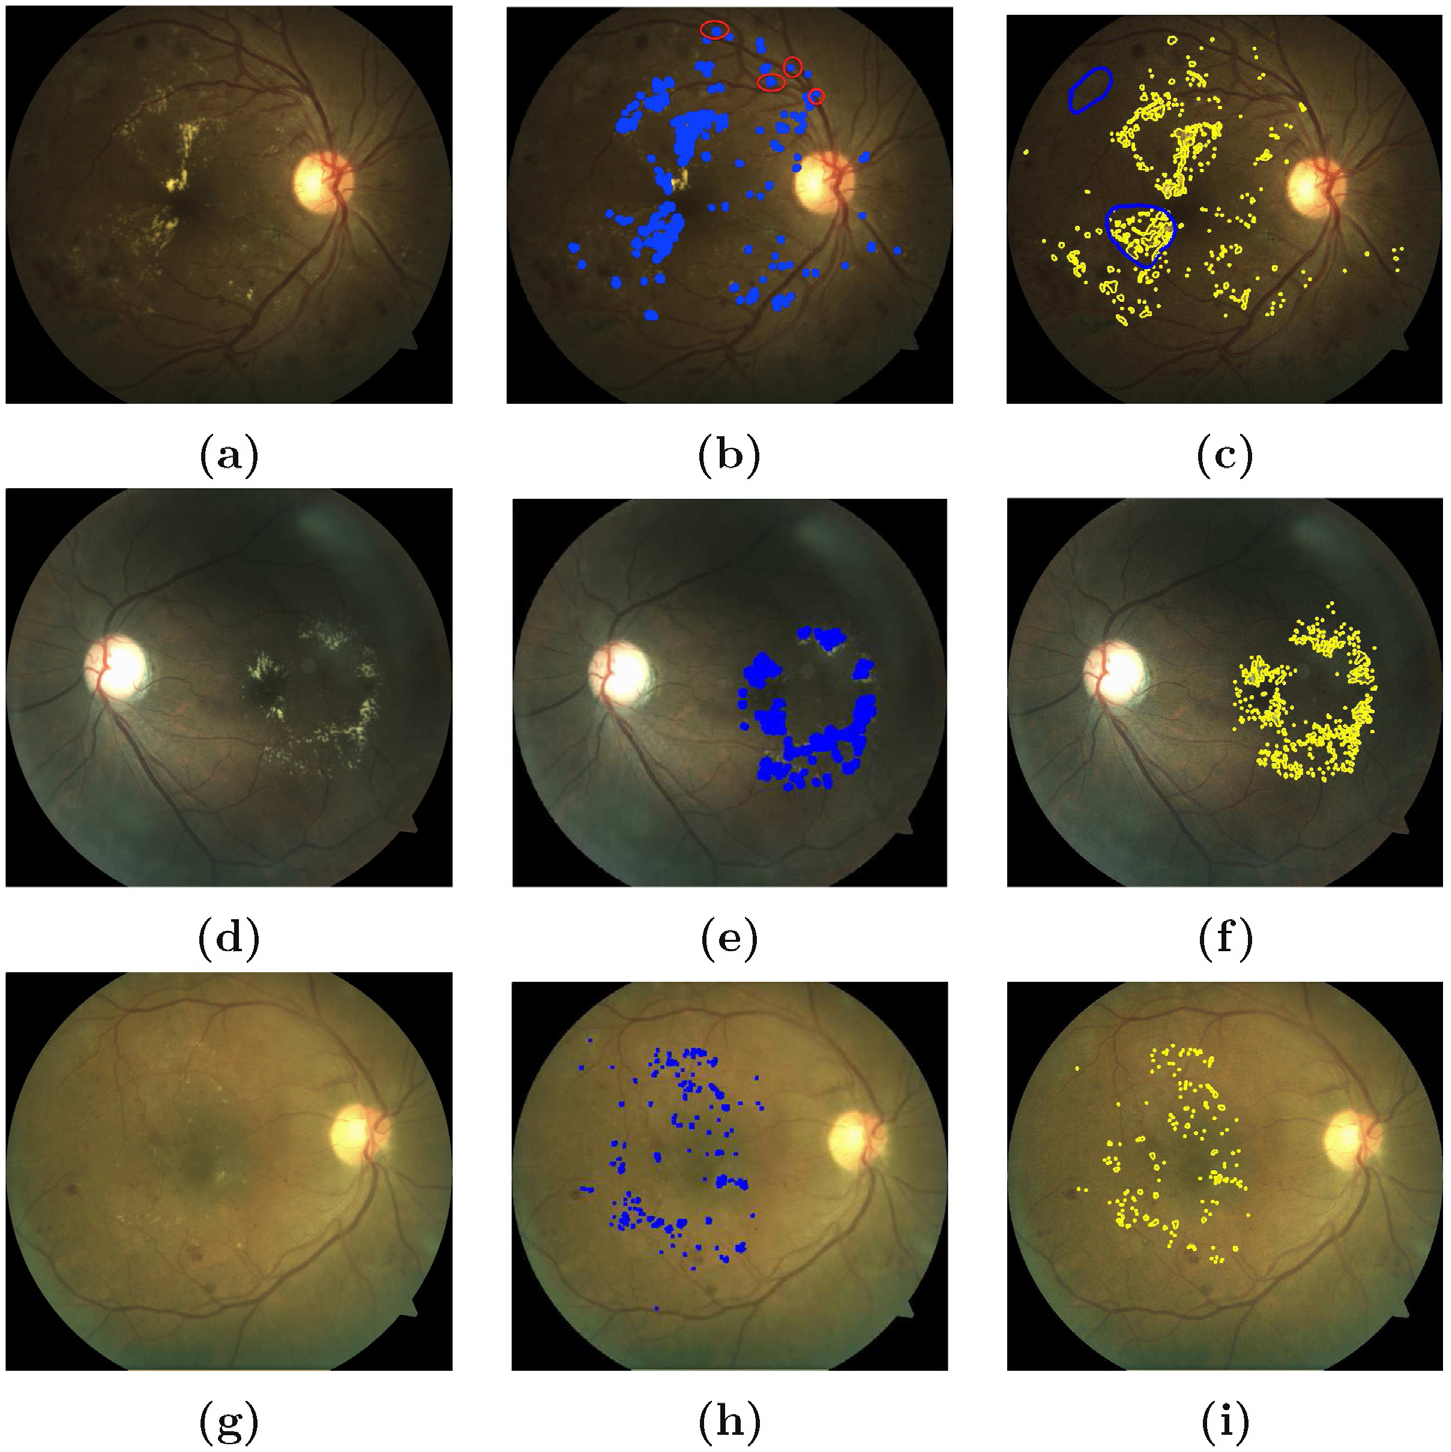
Results of exudate segmentation: on the left column (a, d, g) are original images; in middle column (b, e, h) are images with labelled exudates from the output of the algorithm (thres = 0.6) and on the right column (c, f, i) are the ground truths annotated by an ophtalmologist [12]. On the topmost right column (c), the blue circles represent bright lesions which might not be possibly hard exudates. The percentage accuracy for exudate segmentation are 82%, 85% and 89% in (b), (e) and (h) respectively. Strong imaging artefacts as in (a) affected the accuracy of the proposed method. The red circles in (b) shows the FP detections in such conditions.
From the FROC curve shown in Fig. 10; it is clear that using 2D-Riesz filter with Kirsch edge operator gives higher sensitivity which is 82.5% at 70% FP’s per image which is an improvement of 6% while using the methods separately. As explained in previous section, Riesz filters here increases TP’s of the exudate detection but at the same time also increases the FP detection per image due to its wider band. Kirsch operator has a narrow band comparatively and thus when it is used with Kirsch operator, it limits the FP detection rate thereby increasing the sensitivity of the exudates detection. As we can see in the curve that at lower false positive rates the sensitivity is almost similar in all the cases but when the FP’s increases the combined post-processing scheme has comparatively higher sensitivity.
Our experiments show that using the steerable filters for the enhancement of the edge-like bright lesions from the suppressed distance image worked well after combining with the Kirsch operator. The area under the curve for all these methods are shown in Table 1.
4.2. Result comparison with reference methods
The presented method of the statistical atlas based exudates segmentation has been compared with other two most recent reference methods in literature [22,9] for DME segmentation. The results has been shown in Fig. 12. The results obtained from our method is highly comparable to both of these methods in literature. The proposed atlas based exudate segmentation method achieves an accuracy of 82.60% which is almost similar to Giancardo et al. [9] but higher than Sanchez et al. [22]. The sensitivity of the method in presence of large number of FP’s per image is increasing giving better detection of the lesions. be confused with the detection rate accuracy used for diagnosis of the patient which means finding 1 significant lesion. We are not presenting the ROC curve here because we are concerned with the overall exudate segmentation. However, we are confident that this approach can help in better candidate selection for the automatic diagnosis of the patients with diabetic macular edema. One major drawback of this comparison is that we did not have GT in atlas-space so we had to warp it back onto the original image-space. During the interpolation process we will have few pixels error thus we believe that having the GT in the same space will definitely increase the detection accuracy presented in this paper.
Fig. 12.
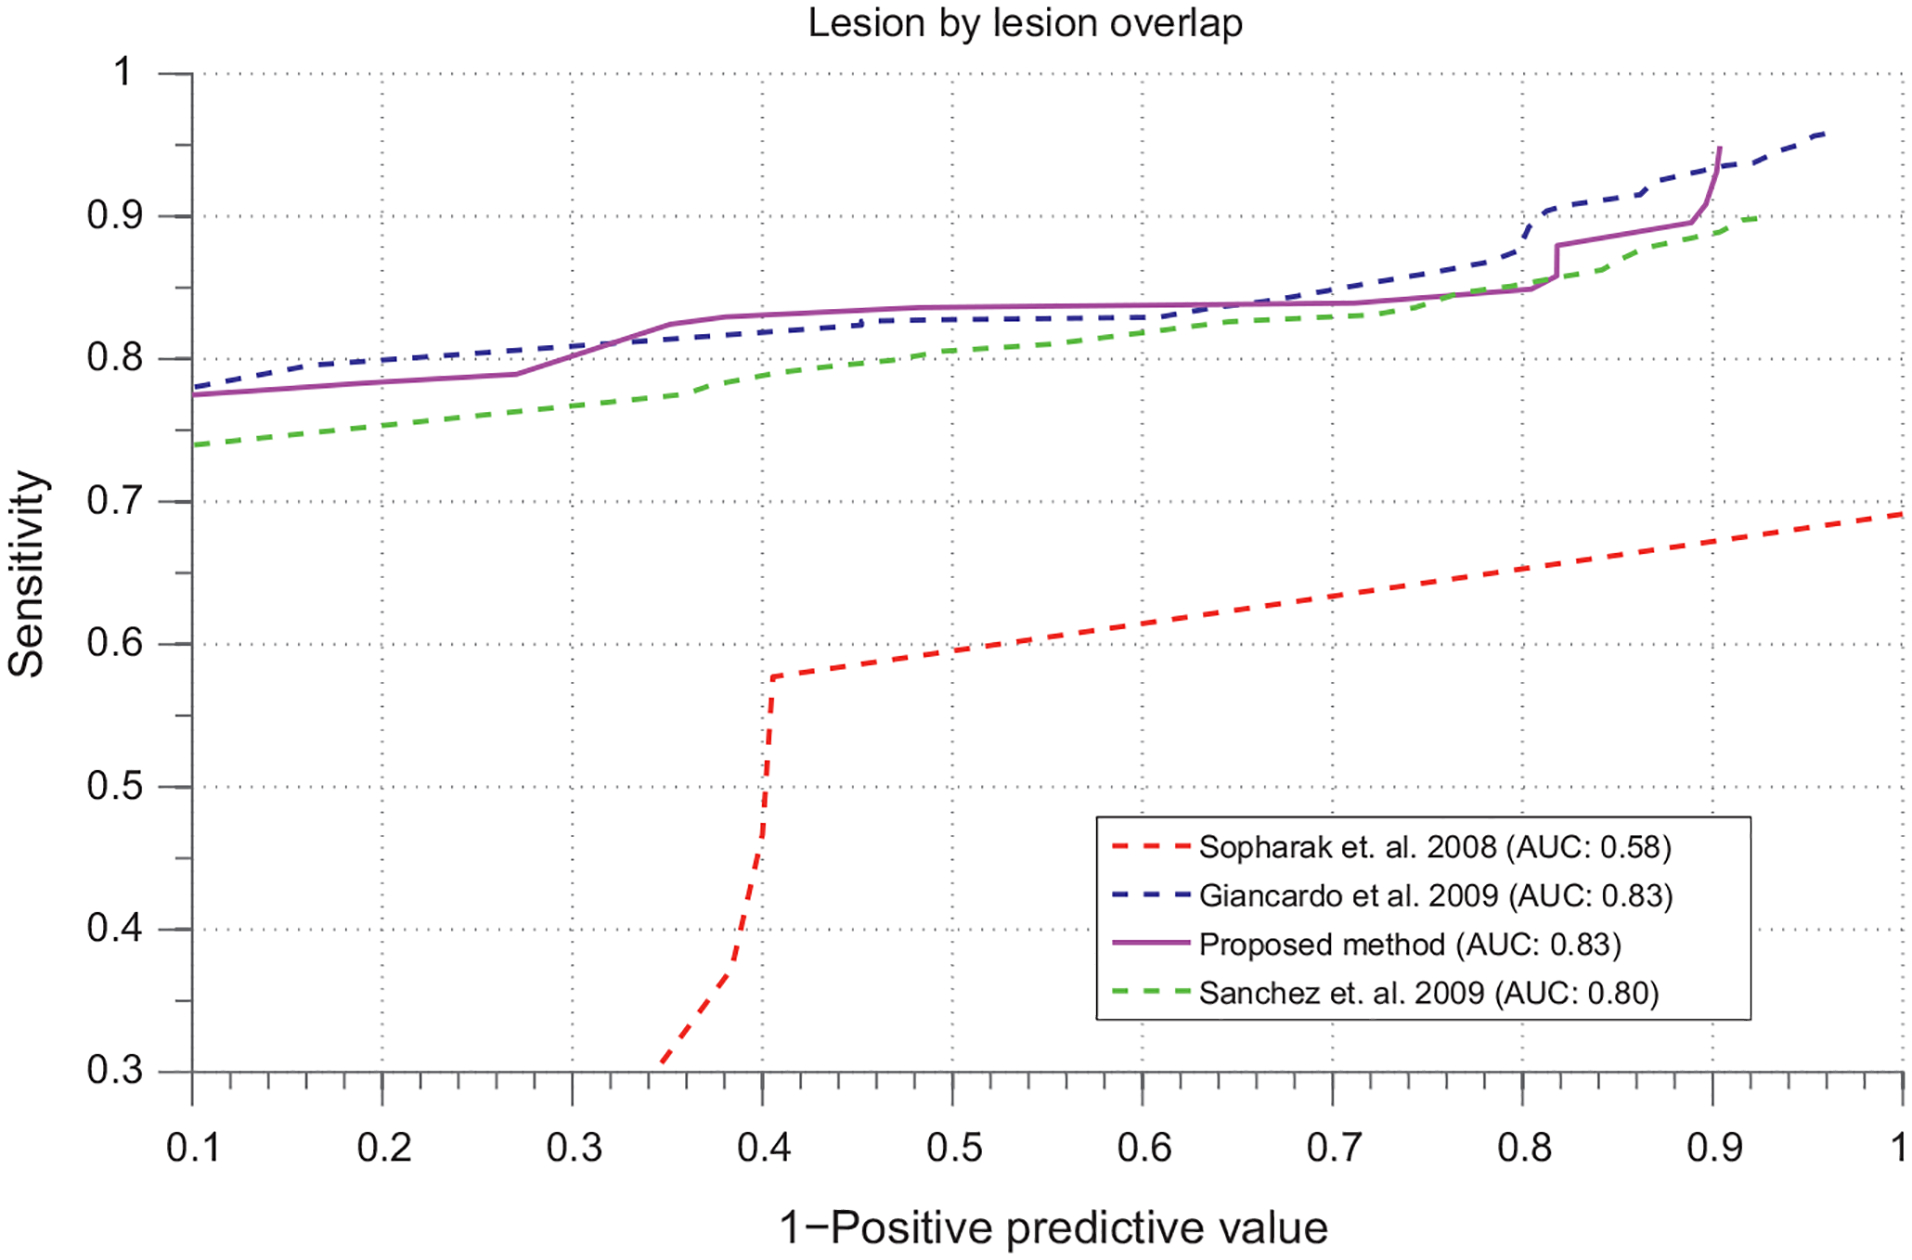
FROC curves for evaluation of the method.
5. Conclusion
In this article, we have presented a novel method of image registration, retinal atlas building and atlas based segmentation of the exudates for retinal image analysis. An automatic landmark generation method has been presented which removes manual annotation of the landmarks for vessel arch estimation and warping. A gold standard is built with distinct retinal landmarks including optic disc, macula, superior and inferior vessel arches and the pigmentation of the retinal epithelium. We showed that unlike other methods in literature, we can segment the bright lesion onto the atlas space without doing much pre-processing steps like image normalization, optic disc and vessel removal etc. The lesions are more apparent relative to the background vasculatures in the distance image on the atlas space. This method can also be used for retinal image grading and for potential follow-up of the lesion growth. We have evaluated the global segmentation performance of the method on a publicly available dataset are found our method to be simpler and equally comparable with the other best methods in literature.
Acknowledements
This work has been conducted in collaboration between University of Burgundy, France and Oak Ridge National Laboratory, USA. We would like to thank “Regional Burgundy Council” for co-sponsoring the work.
Biographies
Mr. Sharib Ali received his bachelor degree in electronics and communication engineering from Purbanchal University, Nepal. He received his master degree in computer vision from Université de Bourgogne, France, in 2012. He accomplished his master thesis on retinal image analysis as a collaborative work between Le2i laboratory, Le Creusot, France, and Oak Ridge National Laboratory, Oak Ridge, TN. He is currently a Ph.D. student at Université de Lorraine, France. His research interests include computer vision, image processing and medical image analysis.
Mr. Désiré Sidibé got his master degree from Ecole Centrale de Nantes and his Ph.D. from Université de Montpellier in 2004 and 2007, respectively. Since 2009, he has been an assistant professor at Université de Bourgogne and a member of the Le2i laboratory. His main research areas include object detection and tracking, and medical image analysis.
Mr. Kedir M. Adal received his B.Sc. in electrical engineering from Mekelle University, Ethiopia, and master degree in computer vision from Université de Bourgogne, France. He accomplished his master thesis on retinal image analysis as a collaborative work between Le2i laboratory and ORNL. His research interests include computer vision and image processing.
Mr. Luca Giancardo is a postdoc at the Istituto Italiano di Tecnologia, Italy. He received his B.Sc. (Honours) in software engineering from the Southampton Solent University, his M.Sc. in computer vision and robotics M.Sc. by three different European institutions: Heriot-Watt University Edinburgh (UK), Universitat de Girona (Spain) and Université de Bourgogne (France) and his Ph.D. at the Oak Ridge National Laboratory (USA) and Université de Bourgogne. His main interests are biomedical image analysis, machine learning and computer vision.
Dr. Edward Chaum is the Plough Foundation professor of retinal diseases at the Hamilton Eye Institute, and Professor of Ophthalmology, Pediatrics, Anatomy & Neurobiology, & Biomedical Engineering at the University of Tennessee Health Science Center, Memphis, TN. He obtained his Ph.D. and M.D. from Cornell University and is Board certified in both Pediatrics and Ophthalmology with fellowship training in medical and surgical retina at the Massachusetts Eye & Ear Infirmary. He is a member of the AOA Honor Medical Society, and is the recipient of numerous awards including a Research Career Award from the National Eye Institute, a Senior Scientist Award from Research to Prevent Blindness, an R&D100 Award, an ATA Innovation Award, and has been voted by his peers as a best doctors in America® annually since 2006. He is the author of over 60 papers and 6 book chapters in the fields of molecular biology, biomedical engineering, image analysis, and clinical medicine and is a listed co-author in over 80 national clinical trials publications in the field of Ophthalmology. He is the author of seven patent applications including 2 issued patents. He is a serial entrepreneur, co-founder and chief medical officer of 3 venture-backed startup companies.
Mr. Thomas P. Karnowski is an R&D staff member in the Imaging, Signals and Machine Learning (ISML) Group at ORNL. He received his B.S. in electrical engineering from the University of Tennessee-Knoxville in 1988 and his M.S. in electrical engineering from North Carolina State University in 1990. In 1990 he joined the Real-Time Systems Group of Oak Ridge National Laboratory and joined the ISML Group in 1995. His current research interests are retina image processing, machine learning for medical applications, deep machine learning, and image segmentation of vehicular data. He is a co-inventor of four patents and author or co-author on 40 papers in the field of optical and image processing and pattern recognition. He received a National Federal Laboratory Consortium Award for Excellence in Technology Transfer in 1998 and 2002 and R&D 100 awards in 2002 and 2007.
Prof. Fabrice Mériaudeau received the M.S. degree in physics, the engineering degree (FIRST) in material sciences in 1994, and the Ph.D. degree in image processing in 1997 from Dijon University, Dijon, France. He was a postdoctoral researcher for one year with The Oak Ridge National Laboratory, Oak Ridge, TN. He is currently a Professeur des Universits and the director of the Le2i, Unite Mixte de Recherche, Centre National de la Recherche Scientifique 6306, Université de Bourgogne, Le Creusot, France. He has authored or coauthored more than 200 international publications. He is the holder of three patents. His research interests are focused on image processing for artificial vision inspection, particularly on nonconventional imaging systems (UV, IR, polarization, etc.) and medical or biomedical imaging. Dr. Mériaudeau was the chairman of The International Society for Optical Engineers Conference on Machine Vision Application on industrial inspection. He is also a member of numerous technical committees of international conferences in the area of computer vision.
References
- [1].Yau JWY, Rogers SL, Kawasaki R, Lamoureux EL, Kowalski JW, Bek T, et al. Global Prevalence and Major Risk Factors of Diabetic Retinopathy. Diabet Care. [DOI] [PMC free article] [PubMed] [Google Scholar]
- [2].Phillips R, Forrester J, Sharp P. Automated detection and quantification of retinal exudates. Graefes Arch Clin Exp Ophthalmol 1993;231:90–4. [DOI] [PubMed] [Google Scholar]
- [3].Ege B, Larsen O, Hejlesen O. Detection of abnormalities in retinal images using digital image analysis. 1999;833–40. [Google Scholar]
- [4].Sinthanayothin C, Boyce JF, Williamson TH, Cook HL, Mensah E, Lal S, et al. Automated detection of diabetic retinopathy on digital fundus images. Diabet Med J Brit Diabet Assoc 2002;19:105–12. [DOI] [PubMed] [Google Scholar]
- [5].Sopharak A, Uyyanonvara B, Barman S. Automatic exudate detection from non-dilated diabetic retinopathy retinal images using fuzzy c-means clustering. Sensors 2009;9(3):2148–61. [DOI] [PMC free article] [PubMed] [Google Scholar]
- [6].Zhang X, Chutatape O. Detection and classification of bright lesions in color fundus images. In: 2004 International Conference on Image Processing 2004 ICIP 04. 2004. p. 139–42. [Google Scholar]
- [7].Niemeijer M, van Ginneken B, Russell SR, Suttorp-Schulten MSA, Abramoff MD. Automated detection and differentiation of drusen, exudates, and cotton-wool spots in digital color fundus photographs for diabetic retinopathy diagnosis, Invest. Ophthalmol Vis Sci 2007;48(5):2260–7. [DOI] [PMC free article] [PubMed] [Google Scholar]
- [8].García M, Sánchez CI, López MI, Abásolo D, Hornero R. Neural network based detection of hard exudates in retinal images. Comput Methods Prog Biomed 2009;93(1):9–19. [DOI] [PubMed] [Google Scholar]
- [9].Giancardo L, Meriaudeau F, Karnowski TP, Li Y, Tobin KW, Chaum E. Automatic retina exudates segmentation without a manually labelled training set. In: ISBI. 2011. p. 1396–400. [Google Scholar]
- [10].Dupas B, Walter T, Erginay A, Ordonez R, Deb-Joardar N, Gain P, et al. Evaluation of automated fundus photograph analysis algorithms for detecting microaneurysms haemorrhages and exudates and of a computer-assisted diagnostic system for grading diabetic retinopathy. Diabet Metab 2010;36(3): 213–20. [DOI] [PubMed] [Google Scholar]
- [11].Feroui A, Messadi M, Hadjidj I, Bessaid A. New segmentation methodology for exudate detection in color fundus images. J Mech Med Biol 2013;13(01):1350014. [Google Scholar]
- [12].Giancardo L, Meriaudeau F, Karnowski TP, Li Y, Garg S, Tobin KW, et al. Exudate-based diabetic macular edema detection in fundus images using publicly available datasets. Med Image Anal 2012;16:216–26. [DOI] [PMC free article] [PubMed] [Google Scholar]
- [13].Jaafar HF, Nandi AK, Al-Nuaimy W. Automated detection of red lesions from digital colour fundus photographs. Conf Proc IEEE Eng Med Biol Soc 2011;2011:6232–5. [DOI] [PubMed] [Google Scholar]
- [14].Lopez MI, Sanchez C, Hornero R. Retinal image analysis to detect and quantify lesions associated with diabetic retinopathy. Assoc Res Vis Ophthalmol 2003. [DOI] [PubMed] [Google Scholar]
- [15].Bourne RRA. Ethnicity and ocular imaging. Eye 2011;25:297–300. [DOI] [PMC free article] [PubMed] [Google Scholar]
- [16].Li Y, Karnowski T, Tobin K, Giancardo L, Morris S, Sparrow S, et al. A health insurance portability and accountability act-compliant ocular telehealth network for the remote diagnosis and management of diabetic retinopathy. Telemedicine and e-Health. [DOI] [PMC free article] [PubMed] [Google Scholar]
- [17].Bay H, Ess A, Tuytelaars T, Van Gool L. Speeded-up robust features (surf). Comput Vis Image Underst 2008;110(3):346–59. [Google Scholar]
- [18].Lowe DG. Distinctive image features from scaleinvariant keypoints. Int J Comput Vis 2004:91–110. [Google Scholar]
- [19].Frangi A, Niessen W, Vincken K, Viergever M. Multiscale Vessel Enhancement Filtering; 1998. p. 130–7. [Google Scholar]
- [20].Can A, Shen H, Turner JN, Tanenbaum HL, Roysam B. Rapid automated tracing and feature extraction from retinal fundus images using direct exploratory algorithms. IEEE Trans Inform Technol Biomed 1999;3(2):125–38. [DOI] [PubMed] [Google Scholar]
- [21].Bookstein FL. Principal warps: thin-plate splines and the decomposition of deformations. IEEE Trans Pattern Anal Mach Intel 1989;11(6):567–85. [Google Scholar]
- [22].Sánchez CI, García M, Mayo A, López MI, Hornero R. Retinal image analysis based on mixture models to detect hard exudates. Med Image Anal 2009;13(4):650–8. [DOI] [PubMed] [Google Scholar]
- [23].Sopharak A, Uyyanonvara B, Barman S, Williamson TH. Automatic microaneurysm detection from non-dilated diabetic retinopathy retinal images. Comput Med Imaging Graph Off J Comput Medical Imaging Soc 2011;32(8):720–7. [Google Scholar]
- [24].Otsu N A threshold selection method from gray-level histograms. IEEE Trans Syst Man Cybern 1979;9(1):62–6. [Google Scholar]
- [25].Foracchia M, Grisan E, Ruggeri A. Luminosity and contrast normalization in retinal images. Med Image Anal 2005;9(3):179–90. [DOI] [PubMed] [Google Scholar]
- [26].Kirsch RA. Computer determination of the constituent structure of biological images. Comput Biomed Res 1970:315–28. [DOI] [PubMed] [Google Scholar]
- [27].Kthe U, Felsberg M. Riesz-transforms vs. derivatives: on the relationship between the boundary tensor and the energy tensor. In: Proc. Scale Space Conference (this, Springer; ). 2005. p. 179–91. [Google Scholar]
- [28].Kirsch RA. Computer determination of the constituent structure of biological images. Comput Biomed Res 1970:315–28. [DOI] [PubMed] [Google Scholar]
- [29].Freeman WT, Adelson EH. The design and use of steerable filters. IEEE Trans Pattern Anal Mach Intell 1991;13(9):891–906. [Google Scholar]
- [30].Ali S, Adal KM, Sidibé D, Chaum E, Karnowski TP, Mériaudeau F. Steerable wavelet transform for atlas based retinal lesion segmentation. Proc SPIE Med Imaging Image Process 2013;8669:86693D–10. [Google Scholar]
- [31].Unser M, Van De Ville D. Wavelet steerability and the higher-order Riesz transform. IEEE Trans Image Process 2010;19(3):636–52. [DOI] [PubMed] [Google Scholar]


