Abstract
Purpose
This study aimed to examine the impact of high-risk cytogenetic abnormalities (HRA) on the survival outcomes of multiple myeloma patients with extramedullary disease (EMD) in the era of novel agents, utilizing the largest dataset of extramedullary multiple myeloma patients in China.
Methods
This study included a total of 371 patients with EMD, comprising 113 patients with de novo EME and 258 patients with EMB.
Results
Patients with one HRA and those with ≥ 2 HRA demonstrated significantly worse overall survival (OS) (P < 0.01) and progression-free survival (PFS) (P < 0.01) compared to patients without HRA. Additionally, 1q21 gain/amplification (1q21 +) remained a predictor of poor prognosis in EMD. CD38 monoclonal antibody-based therapy and single transplantation were less effective in improving survival outcomes for EMD with ≥ 2 HRA. Multivariable analysis identified LDH levels > 250 U/L, creatinine levels > 177 μmol/L, extramedullary extraosseous (EME), 1 HRA, and ≥ 2 HRA as independent adverse prognostic factors in patients with EMD.
Conclusion
Patients with EMD who had ≥ 2 HRA experienced an extremely poor prognosis, which could not be improved by single transplantation or CD38 monoclonal antibody-based treatment. The number of HRA could serve as an important factor in guiding treatment choices and predicting prognosis in patients with EMD. Furthermore, 1q21 + remained a significant factor associated with worse survival outcomes in EMD.
Keywords: Extramedullary multiple myeloma, High risk cytogenetic abnormalities, CD38 monoclonal antibody, Transplantation, 1q gain/amplification
Introduction
High-risk cytogenetic abnormalities in multiple myeloma include 1q21 + , deletion of 17p (17p-), t(4;14), t(14;16), and t(14;20), all of which are associated with poor clinical outcomes [1–4]. Patients with two HRA represent a subgroup with a higher likelihood of early relapse and disease progression [5–7]. It is estimated to occur in approximately 6% of multiple myeloma patients, according to extensive meta-analyses. Triple-hit multiple myeloma, defined by three or more HRA, also demonstrates an extremely poor prognosis [8]. Extramedullary disease (EMD), which includes extramedullary bone-related (EMB) and extramedullary extraosseous (EME) subtypes, is similarly associated with poor outcomes, presenting an ongoing clinical challenge [8–10].
While the impact of the presence of ≥ 2 HRA has been well-studied in multiple myeloma, its specific characteristics and implications within EMD remain unclear. Despite significant improvements in survival for newly diagnosed multiple myeloma (NDMM) patients due to novel agents such as immunomodulatory drugs (IMiDs), proteasome inhibitors (PIs), and CD38 monoclonal antibodies, the prognosis for multiple myeloma patients with ≥ 2 HRA remains challenging in clinical practice [11–13]. For EMD with ≥ 2 HRA, considered ultra-high-risk MM, further exploration is needed regarding its clinical outcomes and the effectiveness of CD38 monoclonal antibodies and other current treatments in improving survival outcomes.
Therefore, we conducted this multicenter study to assess the clinical outcomes of EMD patients without HRA, those with one HRA, and those with two or more HRA. This is the first clinical study to focus on the outcomes of EMD patients with HRA, representing a unique subgroup within the multiple myeloma population.
Methods
Patient population
Clinical data from Sun Yat-sen University Cancer Center and the First Hospital of Jilin University were retrospectively analyzed for patients newly diagnosed with EMB and de novo EME between January 2016 and October 2023, with a final follow-up on March 26, 2024. The Institutional Ethical Review Board of Sun Yat-sen University Cancer Center approved the anonymized data analysis and waived informed consent. Rigorous procedures ensured data accuracy and completeness.
The inclusion criteria for our study encompassed patients diagnosed with EMB or de novo EME at initial diagnosis from both centers. Exclusion criteria included patients without PET/CT or MRI examinations, those lost to follow-up, patients diagnosed with primary plasma cell leukemia or solitary plasmacytoma, and those without fluorescence in situ hybridization (FISH) results. Both centers used the same inclusion and exclusion criteria across four multiple myeloma groups.
Notably, all EME patients in our study were de novo EME cases. EME referred to patients with soft tissue or visceral plasmacytoma not connected to the bone. EMB was identified as paraskeletal plasmacytoma. Patients with both EMB and EME were classified as EME. Patients initially diagnosed with non-EMD who later developed EMB remained classified as non-EMD. EMB and EME diagnoses were confirmed by PET/CT and biopsy. In this study, a total of 371 patients were included, categorized into 258 patients with EMB and 113 patients with de novo EME based on the location of the extramedullary site. This study included 238 patients from Sun Yat-sen University Cancer Center and 133 patients from the First Hospital of Jilin University.
Bone marrow biopsies were performed on all patients before initial treatment. Bone marrow aspirations were sorted using CD138 magnetic beads to purify plasma cells, which were then analyzed by FISH (Fluorescence In Situ Hybridization) for chromosomal abnormalities, including (del) (13q14) (13q-), del(17p) (17p-), t(4;14), t(11;14), t(14;16), and gain/amplification of 1q (1q21 +). The probes utilized in this study included CKS1B for 1q, TP53 for 17p-, FGFR3 for t(4;14), MAF for t(14;16), and CCND1 for t(11;14), RB1 for 13q-.
The response was assessed according to the guidelines established by the International Myeloma Working Group (IMWG) [14].
For the transplant process in our study, during the mobilization phase, we utilized long-term Granulocyte colony stimulating factor (G-CSF) combined with Plerixafor and cyclophosphamide administered at a dose of 2.5 g/m2. After mobilization, we collected CD34 + stem cells, targeting a minimum of 2 × 10⁶ cells/kg, with an ideal target of 5 × 10⁶ cells/kg. Prior to CD34 + stem cell infusion, patients underwent conditioning therapy with Melphalan at a dose of 200 mg/m2. Following the conditioning treatment, patients received stem cell infusion.
High-risk cytogenetic abnormalities (HRA) included 1q21 + , t(4;14), t(14;16), and del(17p).
Based on the number of high-risk cytogenetic abnormalities (HRA) carried, patients were categorized into three groups: 215 patients without HRA, 113 patients with one HRA, and 43 patients with ≥ 2 HRA.
Patients with at least one HRA were classified as high-risk, while those without HRA were classified as standard-risk. Due to the limited number of patients with ≥ 3 HRA, patients with 2 HRA and those with ≥ 3 HRA were classified into those having ≥ 2 HRA in our study. A P-value of less than 0.05 was considered statistically significant.
Statistical analysis
Baseline characteristics were compared between treatment groups using Fisher's exact test and the Chi-squared test for categorical variables, and the Wilcoxon rank-sum test or Student’s t-test for continuous variables. OS was defined as the time from induction initiation to death from any cause, while PFS was the time from induction initiation to death or progression. Kaplan–Meier curves were used to visualize OS and PFS across different groups. Follow-up was calculated using reverse Kaplan–Meier method. A univariate Cox proportional hazards model was applied to select variables with a P value < 0.05, which were then included in a multivariate Cox proportional hazards model. The multivariate model was used to assess the impact of selected variables on survival outcomes in patients with MM. All analyses were conducted using CRAN R Version 4.3.2 (The R Foundation for Statistical Computing, Vienna, Austria).
Results
Baseline characteristics
In this study, there were 215 patients without HRA, 113 with 1 HRA, 43 with ≥ 2HRA. The median follow-up time for the entire cohort was 23 months (95%CI: 21–25). The median follow-up times were 21 months (95%CI: 19–27) for those without HRA, 23 months (95%CI: 21–29) for those with 1 HRA, 25 months (95%CI: 15-NR) for those with ≥ 2 HRA. Baseline characteristics were recorded at initial diagnosis before the first treatment. Baseline characteristics included induction treatment regimen, sex, age, immunoglobulin type, Eastern Cooperative Oncology Group (ECOG) score, transplantation status, cytogenetic risk stratification, 17p-, t(4;14), t(14;16), 13q-, t(11;14), 1q21 + , ISS stage, RISS stage, bone marrow plasma cell percentage (BMPC%), lactate dehydrogenase (LDH), creatinine (Cr), and calcium (Ca) and hemoglobin (HGB). Notably, there were significant differences in sex, immunoglobulin type, ISS stage, RISS stage, BMPC%, calcium levels, and hemoglobin levels among the three groups (Tables 1 and 2).
Table 1.
Characteristics at baseline in the entire cohort
| All patients | |
|---|---|
| n | 371 |
| Drug (%) | |
| PI plus IMiDs | 196 (55.5) |
| CD38-based | 64 (18.1) |
| PI or IMiDs | 93 (26.3) |
| Unknown | 18 |
| Sex (%) | |
| Female | 147 (39.6) |
| Male | 224 (60.4) |
| Age | |
| ≥ 65 | 136 (36.7) |
| < 65 | 235 (63.3) |
| MM Type | |
| IgA | 80 (21.6) |
| IgG | 154 (41.6) |
| IgD | 23 (6.2) |
| Light Chain Only | 75 (20.3) |
| Non-secretory | 37 (10.0) |
| Biclonal | 1 (0.3) |
| Unknown | 1 |
| ECOG Score (%) | |
| 0–1 | 206 (55.5) |
| ≥ 2 | 165 (44.5) |
| Transplantation (%) | |
| Yes | 75 (21.2) |
| No | 278 (78.8) |
| Unknown | 18 (4.9) |
| Risk stratification (%) | |
| High risk | 156 (42.0) |
| Standard risk | 215 (58.0) |
| 13q- | 101 (28.7) |
| t (11;14) | 39 (11.8) |
| 17p- (%) | 29 (7.8) |
| t (4;14) (%) | 27 (7.7) |
| t (14;16) (%) | 8 (2.3) |
| 1q21 + (%) | 141 (38.0) |
| ISS stage (%) | |
| 1 | 99 (27.3) |
| 2 | 109 (30.1) |
| 3 | 154 (42.5) |
| Unknown | 9 |
| RISS stage (%) | |
| 1 | 85 (24.1) |
| 2 | 215 (61.1) |
| 3 | 52 (14.8) |
| Unknown | 19 |
| BMPC% | |
| < 50% | 287 (80.4) |
| ≥ 50% | 70 (19.6) |
| Unknown | 14 |
| LDH (%) | |
| ≥ 250 | 55 (14.9) |
| < 250 | 313 (85.1) |
| Unknown | 3 |
| Cr (%) | |
| ≥ 177 | 66 (17.8) |
| < 177 | 305 (82.2) |
| Ca (%) | |
| ≥ 2.75 | 38 (10.2) |
| < 2.75 | 333 (89.8) |
| HGB (%) | |
| ≥ 100 | 196 (52.8) |
| < 100 | 175 (47.2) |
ECOG Score Eastern Cooperative Oncology Group Score; ISS stage International Staging System; RISS stage Revised International Staging System; BMPC% Bone marrow plasma cell percentage; LDH: Lactate dehydrogenase; Cr: Creatinine; Ca: Calcium; HGB Hemoglobin
Table 2.
Characteristics at baseline in each HRA group
| 0 HRA | 1 HRA | ≥ 2 HRA | p | |
|---|---|---|---|---|
| n | 215 | 113 | 43 | |
| Drug (%) | 0.535 | |||
| PI plus IMiDs | 116 (58.0) | 58 (52.3) | 22 (52.4) | |
| CD38-based | 36 (18.0) | 18 (16.2) | 10 (23.8) | |
| PI or IMiDs | 48 (24.0) | 35 (31.5) | 10 (23.8) | |
| Unknown | 15 | 2 | 1 | |
| Sex (%) | 0.011 | |||
| Female | 74 (34.4) | 48 (42.5) | 25 (58.1) | |
| Male | 141 (65.6) | 65 (57.5) | 18 (41.9) | |
| Age | 0.828 | |||
| ≥ 65 | 77 (35.8) | 44 (38.9) | 15 (34.9) | |
| < 65 | 138 (64.2) | 69 (61.1) | 28 (65.1) | |
| MM Type | 0.035 | |||
| IgA | 38 (17.8) | 33 (29.2) | 9 (20.9) | |
| IgG | 92 (43.0) | 41 (36.3) | 21 (48.8) | |
| IgD | 7 (3.3) | 13 (11.5) | 3 (7.0) | |
| Light Chain Only | 51 (23.8) | 17 (15.0) | 7 (16.3) | |
| Non-secretory | 25 (11.7) | 9 (8.0) | 3 (7.0) | |
| Biclonal | 1 (0.5) | 0 (0.0) | 0 (0.0) | |
| Unknown | 1 | 0 | 0 | |
| ECOG Score (%) | 0.745 | |||
| 0–1 | 123 (57.2) | 60 (53.1) | 23 (53.5) | |
| ≥ 2 | 92 (42.8) | 53 (46.9) | 20 (46.5) | |
| Transplantation (%) | 0.857 | |||
| Yes | 43 (21.5) | 22 (19.8) | 10 (23.8) | |
| No | 157 (78.5) | 89 (80.2) | 32 (76.2) | |
| Unknown | 15 (7.0) | 2 (1.8) | 1 (2.3) | |
| ISS stage (%) | 0.003 | |||
| 1 | 70 (33.5) | 24 (21.6) | 5 (11.9) | |
| 2 | 66 (31.6) | 32 (28.8) | 11 (26.2) | |
| 3 | 73 (34.9) | 55 (49.5) | 26 (61.9) | |
| Unknown | 6 | 2 | 1 | |
| RISS stage (%) | < 0.001 | |||
| 1 | 67 (33.0) | 18 (16.8) | 0 (0.0) | |
| 2 | 125 (61.6) | 74 (69.2) | 16 (38.1) | |
| 3 | 11 (5.4) | 15 (14.0) | 26 (61.9) | |
| Unknown | 12 | 6 | 1 | |
| BMPC% | < 0.001 | |||
| < 50% | 178 (87.7) | 83 (74.1) | 26 (61.9) | |
| ≥ 50% | 25 (12.3) | 29 (25.9) | 16 (38.1) | |
| Unknown | 12 | 1 | 1 | |
| LDH (%) | 0.2 | |||
| ≥ 250 | 26 (12.2) | 20 (17.9) | 9 (20.9) | |
| < 250 | 187 (87.8) | 92 (82.1) | 34 (79.1) | |
| Unknown | 2 | 1 | 0 | |
| Cr (%) | 0.171 | |||
| ≥ 177 | 32 (14.9) | 23 (20.4) | 11 (25.6) | |
| < 177 | 183 (85.1) | 90 (79.6) | 32 (74.4) | |
| Ca (%) | 0.002 | |||
| ≥ 2.75 | 17 (7.9) | 10 (8.8) | 11 (25.6) | |
| < 2.75 | 198 (92.1) | 103 (91.2) | 32 (74.4) | |
| HGB (%) | < 0.001 | |||
| ≥ 100 | 136 (63.3) | 48 (42.5) | 12 (27.9) | |
| < 100 | 79 (36.7) | 65 (57.5) | 31 (72.1) |
ECOG Score Eastern Cooperative Oncology Group Score; ISS stage International Staging System; RISS stage Revised International Staging System; BMPC% Bone marrow plasma cell percentage; LDH: Lactate dehydrogenase; Cr: Creatinine; Ca: Calcium; HGB Hemoglobin
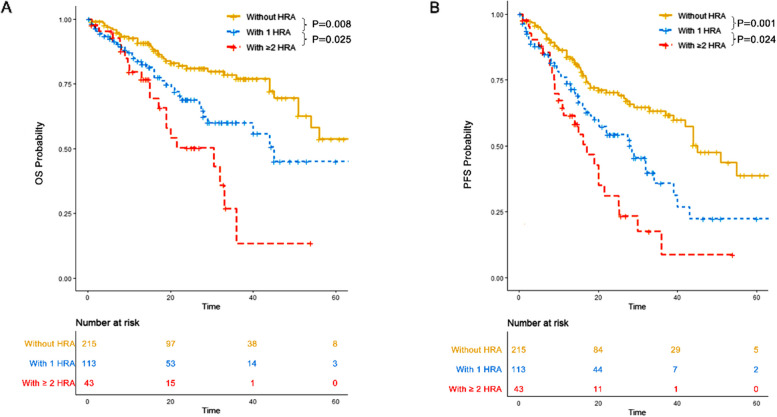
Both 1 HRA and ≥ 2 HRA were associated with worse OS and PFS compared to 0 HRA, and ≥ 2 HRA conferred worse OS and PFS compared to 1 HRA
OS
In the 0 HRA group, the three-year OS was 77% (95% CI: 69.8–85%) with a median OS of 65 months (95% CI: 54-NR). In the 1 HRA group, the three-year OS was 60.1% (95% CI: 49.2–73.3%) with a median OS of 45 months (95% CI: 29-NR). In the ≥ 2 HRA group, the three-year OS was 13.5% (95% CI: 2.7–67.3%) with a median OS of 30 months (95% CI: 19-NR). Patients without HRA had significantly better OS compared to those with 1 HRA (P = 0.008) and ≥ 2 HRA (P < 0.001). Additionally, those with 1 HRA had significantly better OS than those with ≥ 2 HRA (P = 0.025) (Fig. 1A).
Fig. 1.
Overall survival (OS) and progression free survival (PFS) of patients in each HRA group. A OS of patients without HRA, those with 1 HRA and those with ≥ 2 HRA. B PFS of patients without HRA, those with 1 HRA and those with ≥ 2 HRA
PFS
In the 0 HRA group, the three-year PFS was 63.2% (95% CI: 55.3–72.3%) with a median PFS of 45 months (95% CI: 42-NR). In the 1 HRA group, the three-year PFS was 35.8% (95% CI: 24.4–52.5%) with a median PFS of 28 months (95% CI: 20–39). In the ≥ 2 HRA group, the three-year PFS was 8.8% (95% CI: 1.7–45.2%) with a median PFS of 17 months (95% CI: 11–25). Patients without HRA had significantly better PFS compared to those with 1 HRA (P = 0.001) and ≥ 2 HRA (P < 0.001). Additionally, those with 1 HRA had significantly better PFS compared to those with ≥ 2 HRA (P = 0.024) (Fig. 1B).
Single transplantation significantly improved the survival outcomes of patients in the 0 HRA and 1 HRA groups, but did not have the same effect in the ≥ 2 HRA group
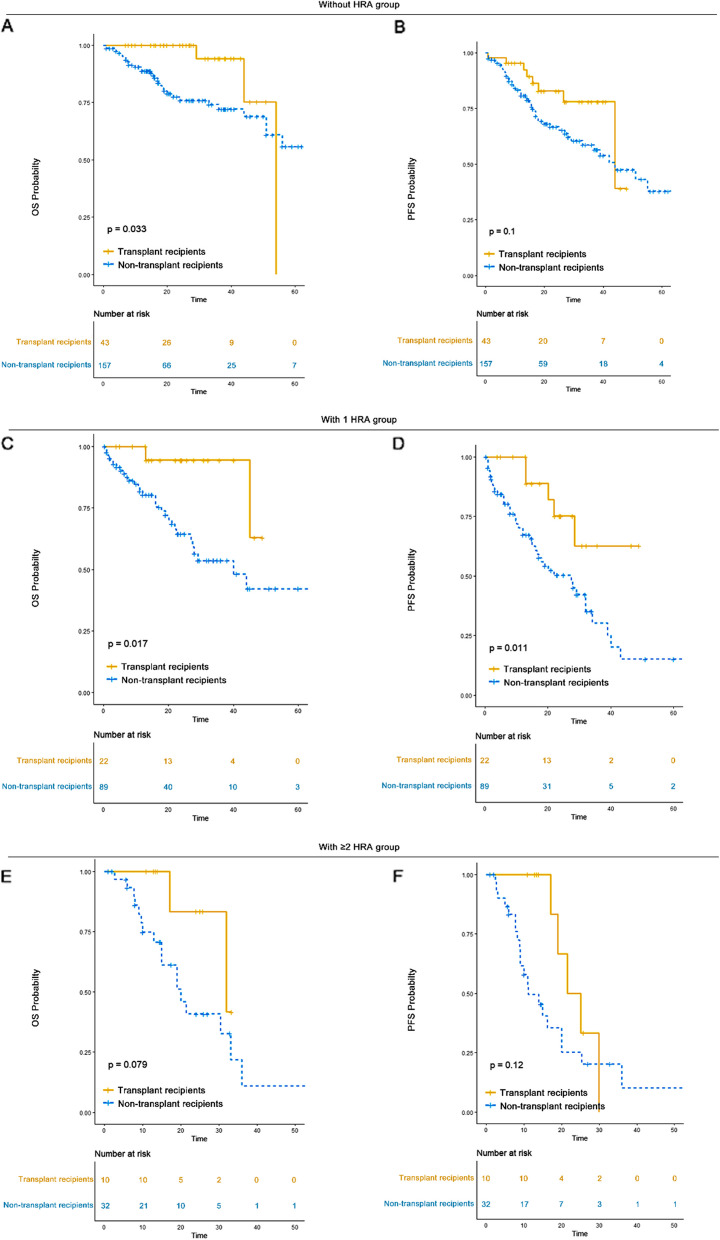
In our study, 21.5% of patients without HRA (n = 43) underwent transplantation, as did 19.8% of patients with 1 HRA (n = 22) and 23.8% of those with ≥ 2 HRA (n = 10). Among transplant recipients, the median OS was 54 months (95% CI: 44-NR) for those without HRA, not reached (95% CI: 45-NR) for those with 1 HRA, and 32 months (95% CI: 32-NR) for those with ≥ 2 HRA. The median PFS was 44 months (95% CI: 44-NR) for patients without HRA, not reached (95% CI: 28-NR) for those with 1 HRA, and 23 months (95% CI: 19-NR) for those with ≥ 2 HRA. Among non-transplant patients, the median OS was 65 months (95% CI: 51-NR) for those without HRA, 40 months (95% CI: 27-NR) for those with 1 HRA, and 20 months (95% CI: 15-NR) for those with ≥ 2 HRA. The median PFS was 44 months (95% CI: 33-NR) for those without HRA, 27 months (95% CI: 16–34) for those with 1 HRA, and 11 months (95% CI: 9–25) for those with ≥ 2 HRA. A significantly better survival outcome was observed for transplant recipients compared to non-transplant patients in the 0 HRA and 1 HRA groups. However, there was no significant difference in OS (P = 0.079) and PFS (P = 0.12) between transplant recipients and non-transplants in the ≥ 2 HRA group (Fig. 2). Transplantation should still be considered a cornerstone treatment for patients with ≤ 1 HRA. The role of tandem autologous stem cell transplantation (ASCT) requires further exploration in patients with ≥ 2 HRA.
Fig. 2.
OS and PFS of transplant recipients versus non-transplants in each HRA group. A OS of transplant recipients versus non-transplants in 0 HRA group. B PFS of transplant recipients versus non-transplants in 0 HRA group. C OS of transplant recipients versus non-transplants in 1 HRA group. D PFS of transplant recipients versus non-transplants in 1 HRA group. E OS of transplant recipients versus non-transplants in ≥ 2 HRA group. F PFS of transplant recipients versus non-transplants in ≥ 2 HRA group
No significant differences in OS or PFS were observed between single-site and multisite involvement, or between visceral and non-visceral involvement, in de novo EME patients
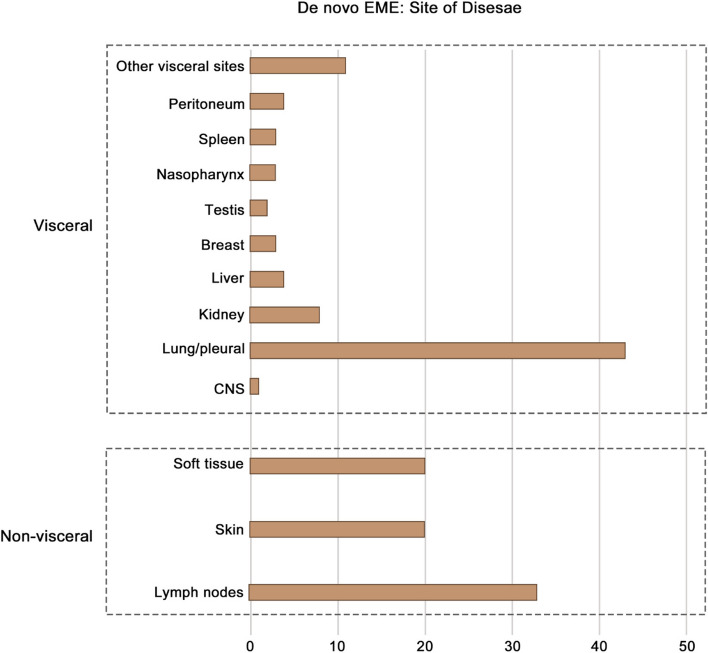
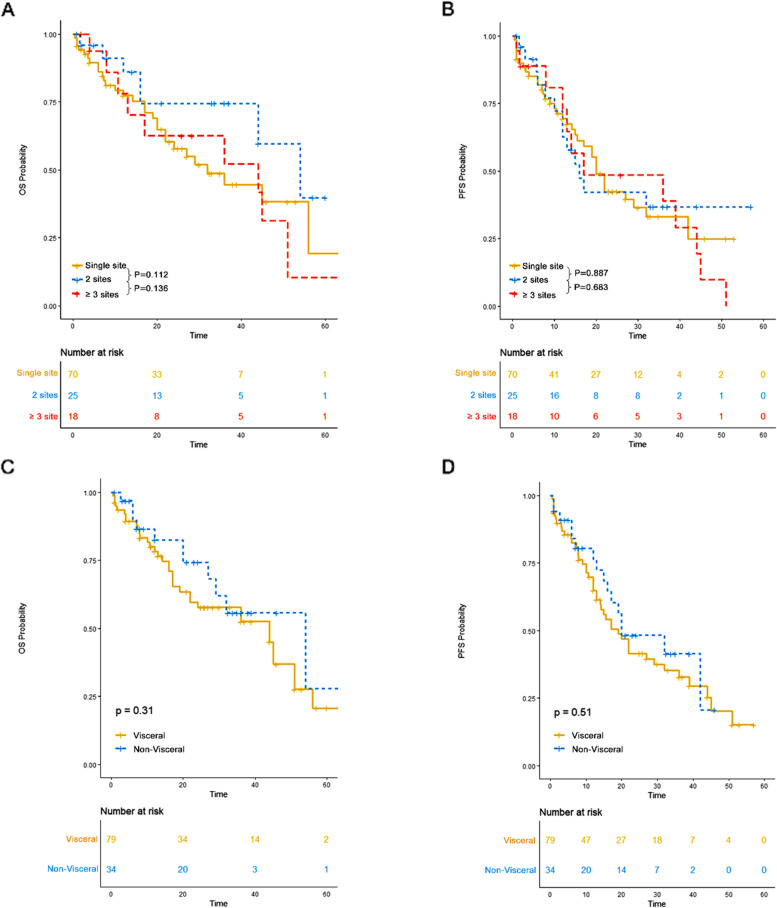
The distribution of extramedullary sites is shown in Fig. 3. The most common visceral site involved was the lung/pleura, followed by the kidney. In the de novo EME group, 70 patients had a single site involved, 25 had two sites, and 18 had three or more sites. There was no significant difference in OS (P > 0.1) or PFS (P > 0.1) among patients with different numbers of extramedullary sites involved. Additionally, no significant difference in OS (P = 0.31) or PFS (P = 0.51) was observed between patients with visceral involvement and those without (Fig. 4). The site of extramedullary multiple myeloma may not have an impact on the survival outcome for patients with extramedullary multiple myeloma.
Fig. 3.
The distribution of extramedullary sites of de novo EME
Fig. 4.
The impact of sites of de novo EME on survival outcomes. A OS of patients with varying numbers of extramedullary sites. B PFS of patients with varying numbers of extramedullary sites. C OS of patients with visceral involvement versus those without. D PFS of patients with visceral involvement versus those without
Treatment evaluation in different multiple myeloma groups
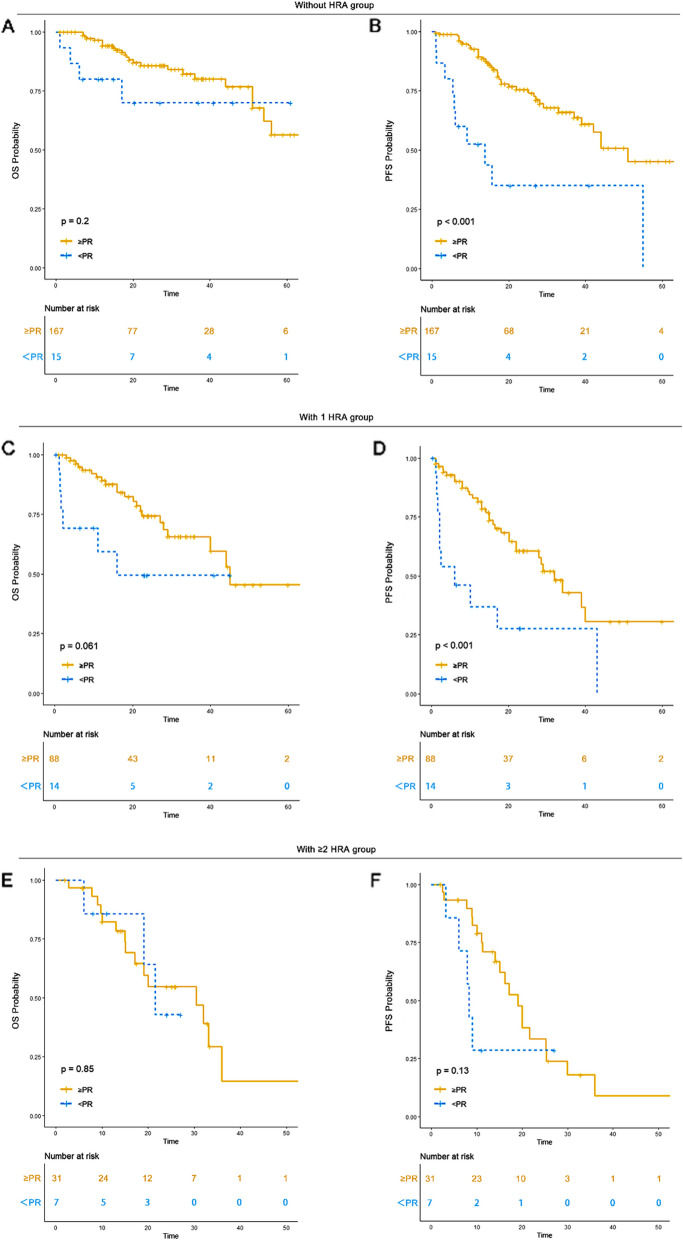
Achieving ≥ partial remission (PR) to induction treatment was associated with improved survival outcomes in the 0 HRA and 1 HRA groups but not in the ≥ 2 HRA group
Treatment response evaluations were available for 182 patients without HRA, 102 with 1 HRA, and 38 with ≥ 2 HRA. Among them, 91.7% (n = 167) in the 0 HRA group, 86.2% (n = 88) in the 1 HRA group, and 81.6% (n = 31) in the ≥ 2 HRA group achieved a PR or better response to induction therapy. In the 0 HRA group, patients with ≥ PR had a median OS of 65 months (95% CI: 54-NR) and a median PFS of 51 months (95% CI: 42-NR), while those with < PR had an unreached OS (95% CI: 17-NR) and a median PFS of 14 months (95% CI: 6-NR). In the 1 HRA group, those with ≥ PR had a median OS of 45 months (95% CI: 40-NR) and a median PFS of 32 months (95% CI: 22-NR), while those with < PR had a median OS of 16 months (95% CI: 2-NR) and a median PFS of 6 months (95% CI: 2-NR). In the ≥ 2 HRA group, patients with ≥ PR had a median OS of 30 months (95% CI: 17-NR) and a median PFS of 19 months (95% CI: 15–30), while those with < PR had a median OS of 21 months (95% CI: 19-NR) and a median PFS of 8 months (95% CI: 6-NR). Achieving a PR or better response conferred a significantly better OS and PFS in the 0 HRA and 1 HRA groups compared to < PR. However, no significant OS (P = 0.85) or PFS (P = 0.13) benefit was observed for ≥ PR compared to < PR in the ≥ 2 HRA group (Table 3) (Fig. 5). Achieving ≥ PR could serve as a reliable predictor of better prognosis in the 0 HRA and 1 HRA groups.
Table 3.
Response to induction treatment in each HRA group
| Response n/(%) | 0 HRA (n = 182) | 1 HRA (n = 102) | 2 HRA (n = 38) | P value |
|---|---|---|---|---|
| sCR/CR | 81 (44.5) | 44 (43.1) | 16 (42.1) | 0.313 |
| VGPR | 47 (25.8) | 23 (22.5) | 9 (23.7) | |
| PR | 39 (21.4) | 21 (20.6) | 6 (15.8) | |
| MR | 5 (2.7) | 0 (0.0) | 2 (5.3) | |
| SD | 7 (3.8) | 12 (11.8) | 4 (10.5) | |
| PD | 3 (1.6) | 2 (2.0) | 1 (2.6) |
CR Complete remission; VGPR Very good partial remission; PR Partial remission; MR Minimal residual disease; SD Stable disease; PD Progressive disease
Fig. 5.
OS and PFS of patients based in response to induction treatment in each HRA group. A OS of patients achieving ≥ PR to induction treatment versus those achieving < PR in 0 HRA group. B PFS of patients achieving ≥ PR to induction treatment versus those achieving < PR in 0 HRA group. C OS of patients achieving ≥ PR to induction treatment versus those achieving < PR in 1 HRA group. D PFS of patients achieving ≥ PR to induction treatment versus those achieving < PR in 1 HRA group. E OS of patients achieving ≥ PR to induction treatment versus those achieving < PR in ≥ 2 HRA group. F PFS of patients achieving ≥ PR to induction treatment versus those achieving < PR in ≥ 2 HRA group
OS and PFS in IMiDs plus PI, CD38 monoclonal antibody and IMiDs or PI groups
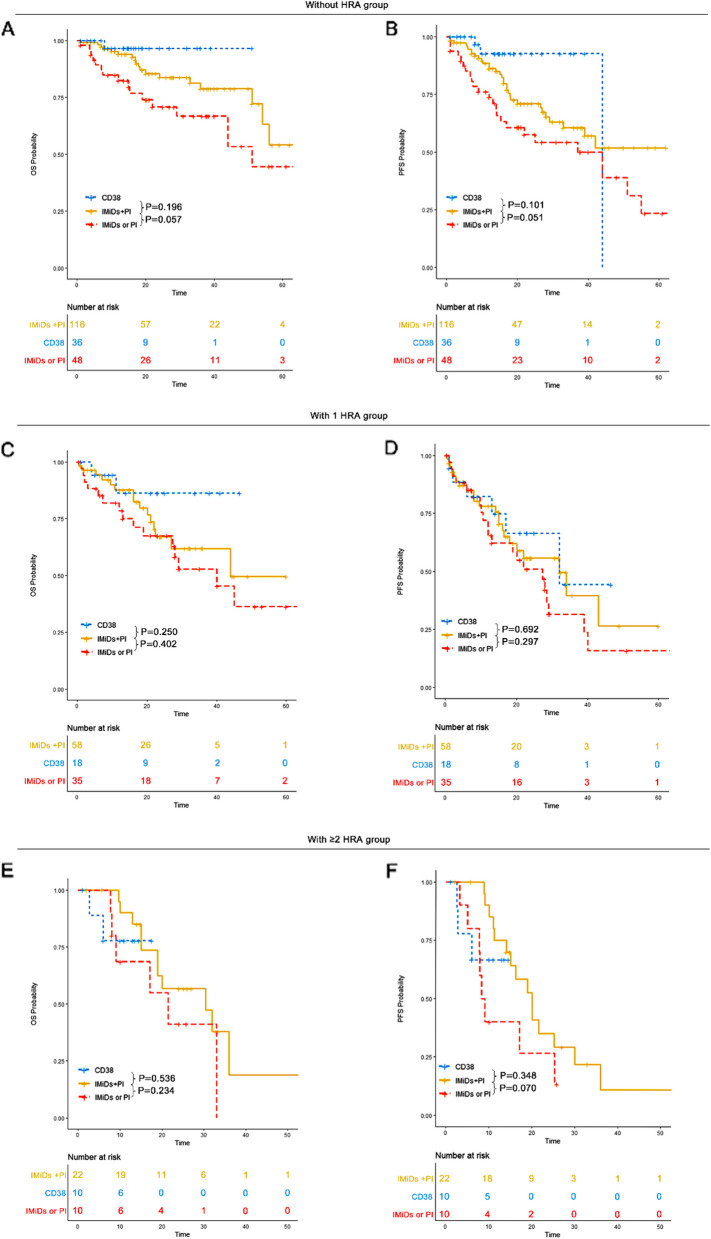
Induction treatments were categorized into three groups: immunomodulatory agents (IMiDs) plus proteasome inhibitors (PI) [e.g., bortezomib lenalidomide dexamethasone (VRD), bortezomib thalidomide dexamethasone (VTD), Ixazomib lenalidomide dexamethasone (IRD), CD38 monoclonal antibody-based regimens [e.g., daratumumab bortezomib lenalidomide dexamethasone (DVRD), daratumumab lenalidomide dexamethasone (DRD), and IMiDs or PI-based regimens [e.g., bortezomib doxorubicin dexamethasone (PAD), bortezomib cyclophosphamide dexamethasone (VCD)]. The CD38 monoclonal antibody used in our study was daratumumab. The impact of these regimens on survival outcomes was compared across multiple myeloma subgroups.
In the 0 HRA group, patients who received IMiDs plus PI had a median OS of 65 months (95% CI: 54-NR) and an unreached median PFS (95% CI: 33-NR). Those treated with CD38 monoclonal antibody-based regimens had an unreached median OS (95% CI: NR-NR) and a median PFS of 44 months (95% CI: NR-NR). Patients receiving IMiDs or PI alone had a median OS of 51 months (95% CI: 44-NR) and a median PFS of 44 months (95% CI: 17-NR).
In the 1 HRA group, patients treated with IMiDs plus PI had a median OS of 44 months (95% CI: 27-NR) and a median PFS of 32 months (95% CI: 18-NR). Those treated with CD38 monoclonal antibody-based therapy had an unreached median OS (95% CI: NR-NR) and a median PFS of 32 months (95% CI: 17-NR). Patients receiving IMiDs or PI had a median OS of 40 months (95% CI: 27-NR) and a median PFS of 27 months (95% CI: 13–40).
In the ≥ 2 HRA group, patients treated with IMiDs plus PI had a median OS of 30 months (95% CI: 19-NR) and a median PFS of 20 months (95% CI: 15-NR). Those receiving CD38 monoclonal antibody-based regimens had an unreached median OS (95% CI: NR-NR) and an unreached PFS (95% CI: 6-NR). Patients receiving IMiDs or PI had a median OS of 21 months (95% CI: 9-NR) and a median PFS of 9 months (95% CI: 8-NR).
In the 0 HRA group, CD38 monoclonal antibodies-based treatment and IMiDs plus PI regimens conferred a superior survival advantage compared to IMiDs or PI alone. However, no significant OS or PFS benefit was observed for CD38 monoclonal antibodies or IMiDs plus PI compared to IMiDs or PI alone in the 1 HRA and ≥ 2 HRA groups (Fig. 6). Daratumumab-based therapy should be recommended for patients without HRA. More effective therapies for EMD patients with ≥ 1 HRA are needed.
Fig. 6.
OS and PFS of patients across different induction treatment groups. A OS of patients across different induction treatment groups in the 0 HRA group. B PFS of patients across different induction treatment groups in the 0 HRA group. C OS of patients across different induction treatment groups in the 1 HRA group. D PFS of patients across different induction treatment groups in the 1 HRA group. E OS of patients across different induction treatment groups in the ≥ 2 HRA group. F PFS of patients across different induction treatment groups in the ≥ 2 HRA group
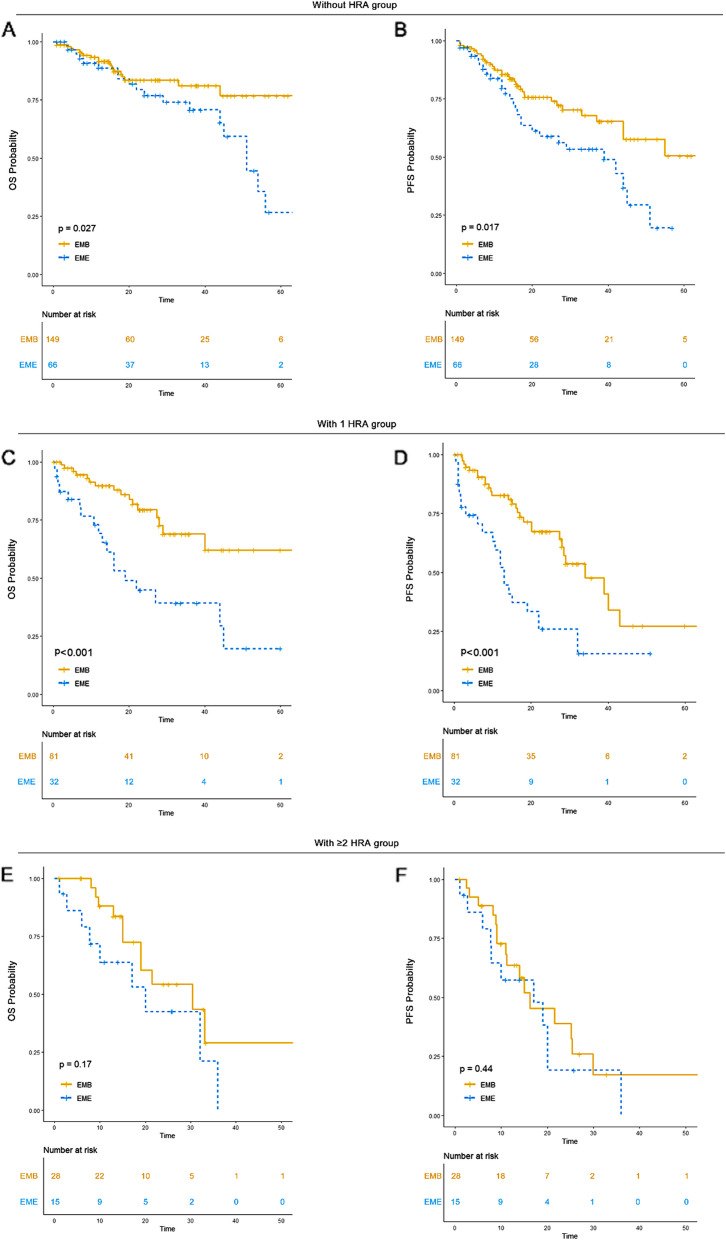
De novo EME was associated with significantly worse survival outcomes compared to EMB in the 0 HRA and 1 HRA groups, but not in the ≥ 2 HRA group
According to the existing literature, EME has been associated with worse survival outcomes compared to EMB [15, 16]. However, the comparison between EME and EMB in patients with different numbers of HRA has not been previously investigated. Therefore, we explored this aspect in our study.
For patients without HRA, EMB patients had an unreached median OS (95% CI: NR-NR) and an unreached PFS (95% CI: 44-NR), while EME patients had a median OS of 51 months (95% CI: 45-NR) and a median PFS of 39 months (95% CI: 20-NR). In patients with 1 HRA, EMB patients had an unreached OS (95% CI: 40-NR) and a median PFS of 34 months (95% CI: 28-NR), while EME patients had a median OS of 19 months (95% CI: 13-NR) and a median PFS of 13 months (95% CI: 10–22). In the ≥ 2 HRA group, EMB patients had a median OS of 30 months (95% CI: 19-NR) and a median PFS of 16 months (95% CI: 11-NR), while EME patients had a median OS of 20 months (95% CI: 10-NR) and a median PFS of 17 months (95% CI: 8-NR) (Fig. 7).
Fig. 7.
OS and PFS of EMB versus EME in each HRA group. A OS of EMB versus EME in 0 HRA group. B PFS of EMB versus EME in 0 HRA group. C OS of EMB versus EME in 1 HRA group. D PFS of EMB versus EME in 1 HRA group. E OS of EMB versus EME in ≥ 2 HRA group. F PFS of EMB versus EME in ≥ 2 HRA group
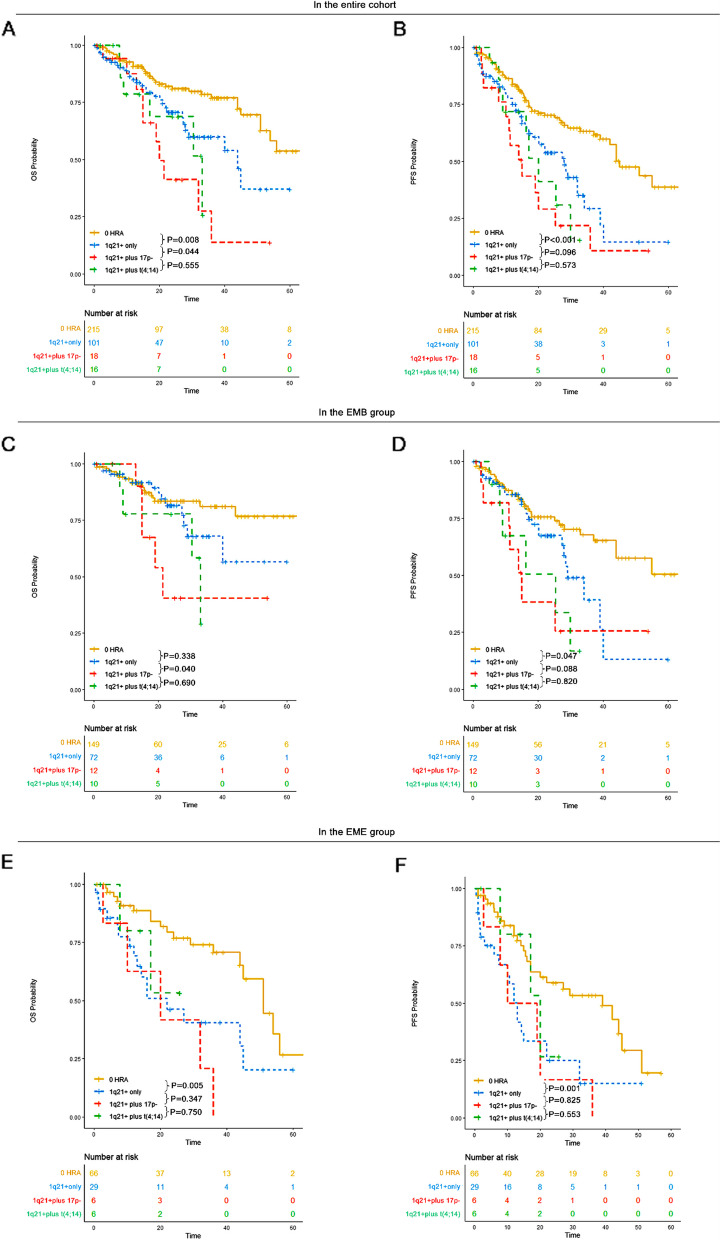
1q21 + alone was associated with worse survival outcomes compared to 0 HRA, while 1q21 + combined with other HRA conferred worse survival outcomes compared to 1q21 + alone
1q21 + has been previously associated with poor prognosis in multiple myeloma patients [17–21]. However, the impact of 1q21 + on prognosis in patients with EMD remains poorly investigated. Additionally, concomitant 1q21 + and t(4;14) have been reported to confer worse survival outcomes in multiple myeloma populations [22]. Therefore, it was important to explore the influence of 1q21 + and 1q21 + plus other HRA in EMD patients.
In our study, across the whole cohort, patients with 1q21 + only had a median OS of 44 months (95% CI: 29-NR) and a median PFS of 28 months (95% CI: 20–39). Those with 1q21 + plus 17p- had a median OS of 20 months (95% CI: 15-NR) and a median PFS of 15 months (95% CI: 11-NR). Patients with 1q21 + plus t(4;14) had a median OS of 33 months (95% CI: 17-NR) and a median PFS of 20 months (95% CI: 16-NR). In EMD populations, 1q21 + conferred a poorer prognosis compared to those without HRA, and 1q21 + plus 17p- was associated with a significantly worse prognosis compared to 1q21 + alone.
In the EMB subgroup, patients with 1q21 + only had an unreached OS (95% CI: 40-NR) and a median PFS of 29 months (95% CI: 28-NR). Those with 1q21 + plus 17p- had a median OS of 21 months (95% CI: 15-NR) and a median PFS of 15 months (95% CI: 11-NR). Those with 1q21 + plus t(4;14) had a median OS of 33 months (95% CI: 30-NR) and a median PFS of 25 months (95% CI: 9-NR). In the EMB population, 1q21 + conferred a poorer prognosis compared to those without HRA, and 1q21 + plus 17p- was associated with significantly worse outcomes compared to 1q21 + alone.
In the de novo EME subgroup, patients with 1q21 + only had a median OS of 22 months (95% CI: 13-NR) and a median PFS of 13 months (95% CI: 10–22). Those with 1q21 + plus 17p- had a median OS of 20 months (95% CI: 10-NR) and a median PFS of 15 months (95% CI: 8-NR). Patients with 1q21 + plus t(4;14) had an unreached OS (95% CI: 17-NR) and a median PFS of 20 months (95% CI: 17-NR). In the EME population, 1q21 + conferred a poorer prognosis compared to those without HRA. However, no significant differences in OS and PFS were observed between 1q21 + and 1q21 + plus other HRA in the de novo EME population (Fig. 8). The presence of 1q21 + could serve as a prognostic biomarker in both EMB and de novo EME patients.
Fig. 8.
OS and PFS of patients without HRA, those with 1q21 + only, those with 1q21 + plus 17p- and those with 1q21 + plus t(4;14) in each group. A OS of patients without HRA, those with 1q21 + only, those with 1q21 + plus 17p- and those with 1q21 + plus t(4;14) in the entire cohort. B PFS of patients without HRA, those with 1q21 + only, those with 1q21 + plus 17p- and those with 1q21 + plus t(4;14) in the entire cohort. C OS of patients without HRA, those with 1q21 + only, those with 1q21 + plus 17p- and those with 1q21 + plus t(4;14) in the EMB group. D PFS of patients without HRA, those with 1q21 + only, those with 1q21 + plus 17p- and those with 1q21 + plus t(4;14) in the EMB group. E OS of patients without HRA, those with 1q21 + only, those with 1q21 + plus 17p- and those with 1q21 + plus t(4;14) in the EME group. F PFS of patients without HRA, those with 1q21 + only, those with 1q21 + plus 17p- and those with 1q21 + plus t(4;14) in the EME group
How does age and gender affect correlation between HRA and OS or PFS
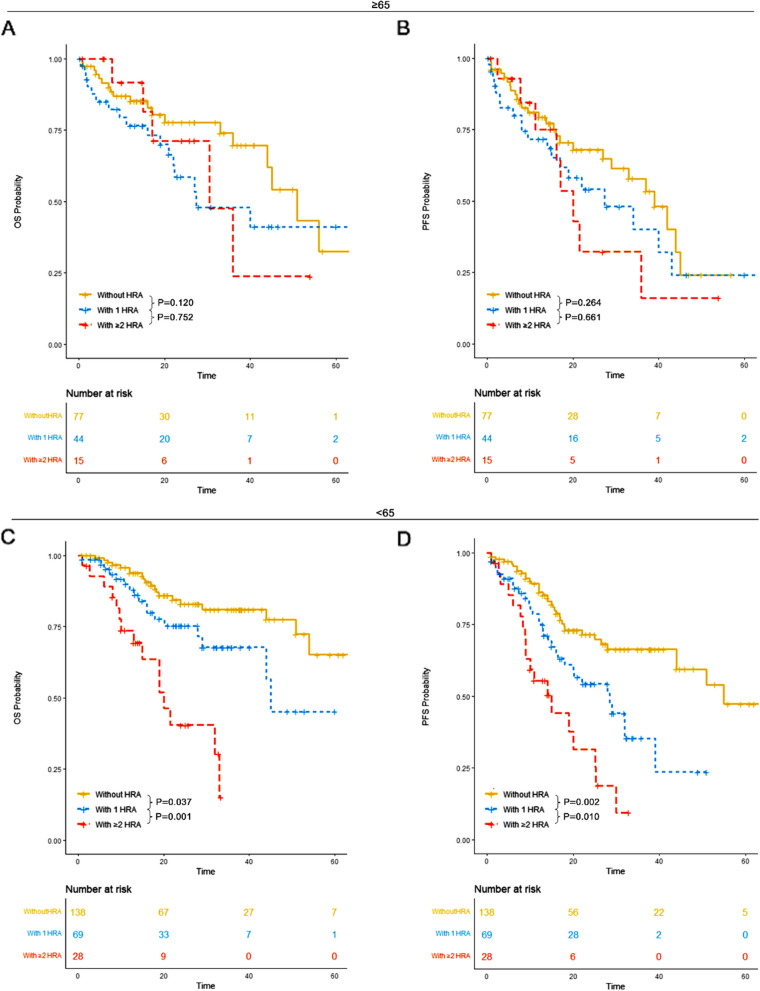
In our study, patients were categorized into two groups: those aged ≥ 65 years and those aged < 65 years. For patients aged ≥ 65 years, those without high-risk cytogenetic abnormalities (HRA) had a median overall survival (OS) of 51 months (95% CI: 44-NR) and a median progression-free survival (PFS) of 39 months (95% CI: 29-NR). Patients with 1 HRA had a median OS of 27 months (95% CI: 22-NR) and a median PFS of 27 months (95% CI: 17-NR). Those with ≥ 2 HRA had a median OS of 30 months (95% CI: 17-NR) and a median PFS of 20 months (95% CI: 16-NR). No significant differences in OS or PFS were observed among the three groups.
For patients aged < 65 years, those without HRA had a median OS of 65 months (95% CI: 54-NR) and a median PFS of 55 months (95% CI: 44-NR). Patients with 1 HRA had a median OS of 45 months (95% CI: 44-NR) and a median PFS of 28 months (95% CI: 18-NR). Patients with ≥ 2 HRA had a median OS of 20 months (95% CI: 15-NR) and a median PFS of 15 months (95% CI: 9-NR). Patients without HRA demonstrated significantly superior OS and PFS compared to those with 1 HRA and those with ≥ 2 HRA. Furthermore, patients with 1 HRA had significantly better OS and PFS compared to those with ≥ 2 HRA (Fig. 9).
Fig. 9.
OS and PFS of patients in each HRA group for patients ≥ 65 years old and those < 65 years old. A OS of patients without HRA, those with 1 HRA and those with ≥ 2 HRA for patients ≥ 65 years old. B PFS of patients without HRA, those with 1 HRA and those with ≥ 2 HRA for patients ≥ 65 years old. C OS of patients without HRA, those with 1 HRA and those with ≥ 2 HRA for patients < 65 years old. D PFS of patients without HRA, those with 1 HRA and those with ≥ 2 HRA for patients < 65 years old
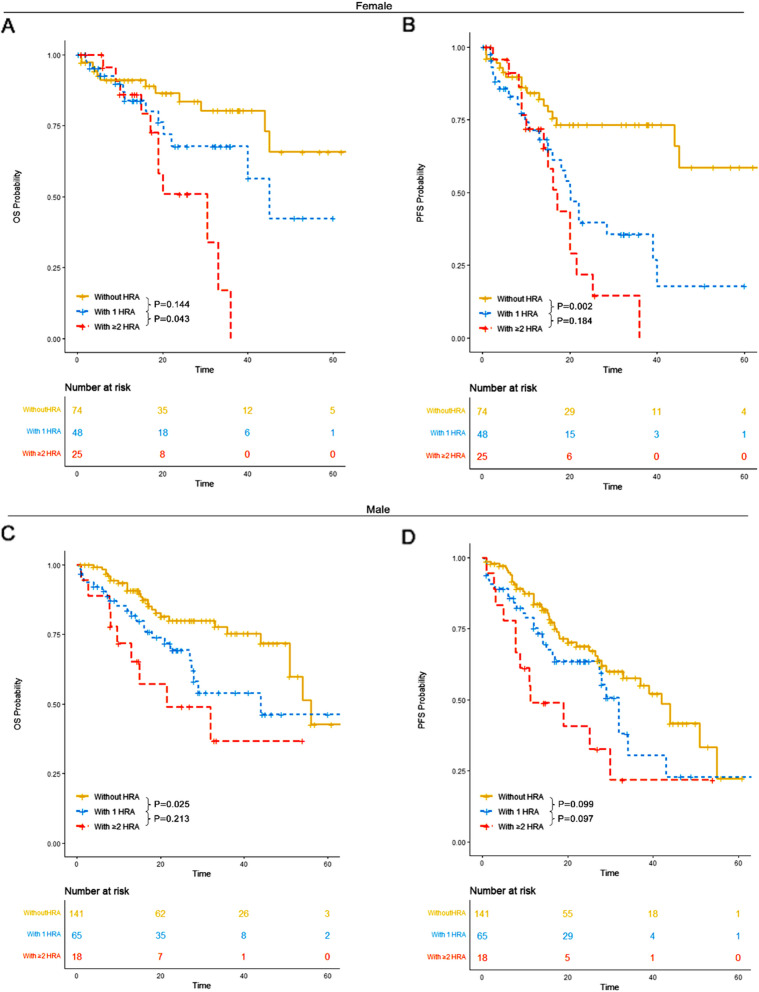
Patients were also analyzed by sex. Among female patients, those without HRA had a median OS of 65 months (95% CI: 45-NR) and an unreached median PFS (95% CI: 45-NR). Patients with 1 HRA had a median OS of 45 months (95% CI: 40-NR) and a median PFS of 20 months (95% CI: 16-NR). Those with ≥ 2 HRA had a median OS of 30 months (95% CI: 19-NR) and a median PFS of 17 months (95% CI: 14-NR). Both 1 HRA and ≥ 2 HRA conferred significantly worse survival outcomes compared to patients without HRA. A statistically significant improvement in OS was observed in patients with 1 HRA compared to those with ≥ 2 HRA.
Among male patients, those without HRA had a median OS of 56 months (95% CI: 51-NR) and a median PFS of 42 months (95% CI: 29-NR). Patients with 1 HRA had a median OS of 44 months (95% CI: 27-NR) and a median PFS of 32 months (95% CI: 27-NR). Those with ≥ 2 HRA had a median OS of 21 months (95% CI: 13-NR) and a median PFS of 11 months (95% CI: 8-NR). Both patients with 1 HRA and those with ≥ 2 HRA exhibited significantly worse survival outcomes compared to those without HRA (Fig. 10).
Fig. 10.
OS and PFS of patients in each HRA group for female patients and male patients. A OS of patients without HRA, those with 1 HRA and those with ≥ 2 HRA for female patients. B PFS of patients without HRA, those with 1 HRA and those with ≥ 2 HRA for female patients. C OS of patients without HRA, those with 1 HRA and those with ≥ 2 HRA for male patients. D PFS of patients without HRA, those with 1 HRA and those with ≥ 2 HRA for male patients
Univariable analysis and multivariable analysis
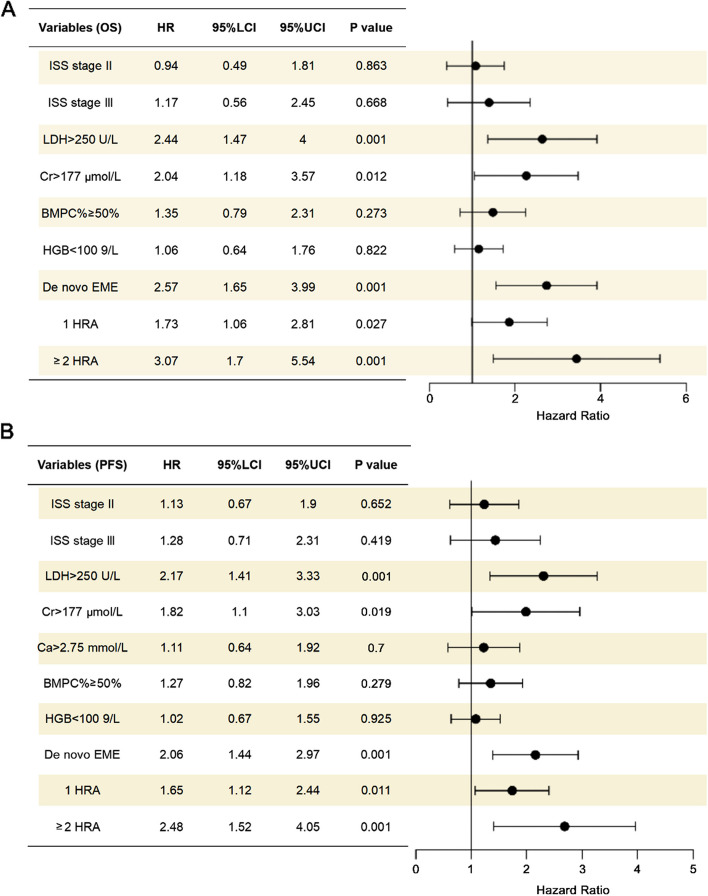
In the univariable analysis, ISS stage, LDH level, Cr level, BMPC%, HGB level, EME, 1 HRA and ≥ 2 HRA were identified as significant variables associated with OS in the whole cohort (P < 0.05). For PFS, ISS stage, LDH level, Cr level, Ca level, BMPC%, HGB level, EME, and 1 HRA and ≥ 2 HRA were significant variables (P < 0.05) (Table 4). Variables with a P value of less than 0.05 were selected for the multivariable analysis. In the multivariable analysis, LDH level, Cr level, EME, and 1 HRA and ≥ 2 HRA were significantly associated with both OS and PFS in the whole cohort (P < 0.05) (Fig. 11).
Table 4.
Univariable analysis of the entire cohort
| Univariable analysis | ||||
|---|---|---|---|---|
| PFS | OS | |||
| HR | P value | HR | P value | |
| Age | 0.306 | 0.059 | ||
| < 65 | 1 | 1 | ||
| ≥ 65 | 1.19(0.85 − 1.67) | 1.47(0.98 − 2.22) | ||
| Sex | 0.745 | 0.985 | ||
| Female | 1 | 1 | ||
| Male | 0.95 (0.67–1.33) | 1 (0.66–1.51) | ||
| ISS Stage | ||||
| I | 1 | 1 | ||
| II | 1.62 (0.99–2.65) | 0.057 | 1.38 (0.75–2.53) | 0.302 |
| III | 2.4 (1.52–3.8) | 0.001 | 2.33 (1.34–4.07) | 0.003 |
| LDH | 0.001 | 0.001 | ||
| < 250 | 1 | 1 | ||
| ≥ 250 | 2.86(1.92 − 4.17) | 3.13(2.00 − 5.00) | ||
| Cr | 0.001 | 0.001 | ||
| < 177 | 1 | 1 | ||
| ≥ 177 | 2.13(1.45 − 3.13) | 2.22(1.41 − 3.57) | ||
| Ca | 0.005 | 0.103 | ||
| < 2.75 | 1 | 1 | ||
| ≥ 2.75 | 1.92(1.22 − 3.03) | 1.64(0.91 − 2.94) | ||
| BMPC% | 0.018 | 0.042 | ||
| < 50% | 1 | 1 | ||
| ≥ 50% | 1.63 (1.09–2.44) | 1.67 (1.02–2.73) | ||
| HGB | 0.008 | 0.018 | ||
| ≥ 100 | 1 | 1 | ||
| < 100 | 1.57 (1.13–2.2) | 1.64 (1.09–2.47) | ||
| 13q- | 2.04 (1.44–2.9) | 0.001 | 2.1 (1.36–3.23) | 0.001 |
| t (11;14) | 1.31 (0.77–2.23)) | 0.322 | 1.76 (0.94–3.29) | 0.078 |
| 1q21 + | 2.19 (1.56–3.07) | 0.001 | 2.12 (1.41–3.21) | 0.001 |
| 17p- | 1.74 (1.06–2.85) | 0.029 | 2 (1.13–3.54) | 0.017 |
| t (4;14) | 2.24 (1.32–3.79) | 0.003 | 2.38 (1.26–4.52) | 0.008 |
| t (14;16) | 3.47 (1.4–8.58)) | 0.007 | 4.25 (1.54–11.77) | 0.005 |
| MM type | 0.001 | 0.001 | ||
| EMB | 1 | 1 | ||
| De novo EME | 1.96 (1.41–2.74) | 0.001 | 2.25 (1.5–3.38) | |
| HRA | ||||
| 0 HRA | 1 | 1 | ||
| 1 HRA | 1.84 (1.27–2.67) | 0.001 | 1.86 (1.17–2.94) | 0.008 |
| ≥ 2 HRA | 3.1 (1.96–4.9) | 0.001 | 3.47 (2.01–6) | 0.001 |
ISS stage International Staging System; LDH Lactate dehydrogenase; Cr Creatinine; Ca Calcium; BMPC% Bone marrow plasma cell percentage; HGB Hemoglobin
Fig. 11.
Forest plot of multivariable analysis in the whole cohort. A Forest plot of multivariable analysis for OS. B Forest plot of multivariable analysis for PFS
Discussion
In this study, our primary aim was to examine the impact of HRA on the prognosis of patients with EMD, a rarely explored aspect in previous literature. To address this, we constructed the largest dataset on EMD, including 258 patients with EMB involvement and 113 patients with de novo EME in China.
In our study, patients were divided into three groups based on the number of HRA they carried: 0 HRA, 1 HRA, and ≥ 2 HRA. Our findings demonstrated that patients with 1 HRA had worse survival outcomes compared to those without HRA (P < 0.01), and those with ≥ 2 HRA had significantly worse survival outcomes compared to those with only 1 HRA (P < 0.01). Consistent with previous studies, the strong independent prognostic value of carrying at least 2 HRA was confirmed in multiple myeloma patients [23, 24].
Previous studies have suggested that while single ASCT may not effectively improve survival outcomes in patients with EME, tandem transplantation could potentially overcome this limitation [25, 26]. In our study, we investigated whether transplantation could enhance survival outcomes for EMD patients with varying numbers of HRA. Our results indicated that single transplantation significantly prolonged survival in EMD patients with 0 HRA and 1 HRA. However, patients with ≥ 2 HRA derived limited benefit from single transplantation. Therefore, transplantation should still remain a part of frontline treatment for EMD patients with 0 or 1 HRA. Due to the small number of patients undergoing tandem transplantation in our cohort, we were unable to analyze its impact, and further studies should explore this important aspect.
In our study, we categorized patients with de novo EME into three groups based on the number of extramedullary sites involved. Our findings demonstrated that having multiple extramedullary sites did not lead to worse survival outcomes compared to those with a single site, which aligns with conclusions from a Mayo Clinic study. Additionally, there was no statistically significant difference in OS or PFS between patients with visceral involvement and those without, a result also consistent with the Mayo Clinic's findings [10].
With the introduction of CD38 monoclonal antibodies, the prognosis of multiple myeloma has significantly improved [27–29]. However, the efficacy of daratumumab in patients with extramedullary multiple myeloma remains limited, as reported in previous literature [10, 30]. In our study, we explored the effectiveness of CD38 monoclonal antibodies across each HRA group. In EMD patients with 0 HRA, CD38 monoclonal antibody-based therapy effectively improved survival outcomes. However, in the 1 HRA and ≥ 2 HRA groups, the effectiveness of CD38 monoclonal antibodies was limited. This suggests that treatment choices for patients with EMD should be guided by the number of HRA.
The limited efficacy of daratumumab observed in our study is consistent with findings from previous studies conducted at seven Czech hematological centers and the Mayo Clinic [10, 30]. However, a study suggested that daratumumab combined with dexamethasone, cyclophosphamide, etoposide, and cisplatin (DARA-DCEP) holds promise as an effective therapeutic option for extramedullary plasmacytoma, potentially improving treatment outcomes [31].
Overall, the current treatment remained limited in improving survival outcome for extramedullary multiple myeloma patients with HRA. However, would those patients with HRA could respond to DNA damaging drugs like Topoisomerase inhibitors or poly adenosine diphosphate (ADP) ribose polymerase (PARP) inhibitors was an interesting question and deserved further exploration. Topoisomerase inhibitors disrupt the ligation phase of the cell cycle, resulting in DNA single- and double-strand breaks, triggering apoptotic cell death. PARP inhibitors can bind to the PARP-1 protein at single-stranded DNA breaks or lesions, interfering with its catalytic activity. This interference result replication fork progression, ultimately resulting in double-strand breaks.
DNA topoisomerase I and II have been shown to be expressed in multiple myeloma cells [32]. Recent studies have demonstrated that the topoisomerase inhibitor P8-D6 exhibits antitumor activity both in vitro and in vivo [33]. Additionally, the combination of XPO1 inhibitors and topoisomerase II inhibitors has proven effective in overcoming acquired drug resistance in MM models [34]. PARP1 has been identified as a prognostic biomarker in multiple myeloma patients, highlighting its potential significance in the disease [35]. Furthermore, a study published in Leukemia supports the evaluation of PARP inhibitors in MM patients [36]. However, the effectiveness of topoisomerase inhibitors and PARP inhibitors still requires further exploration in multiple myeloma patients.
EME is considered a subgroup that confers a worse prognosis compared to EMB. In this study, we compared the survival outcomes of patients with EME and EMB across each HRA group. In the 0 HRA and 1 HRA groups, EME exhibited a significantly worse survival outcome compared to EMB. Similar shorter survival outcomes in EME patients have also been reported in previously published studies from Balkan Myeloma Study Group, Barcelona University and Hospital Clínic from Barcelona [37, 38]. However, in the ≥ 2 HRA group, no significant difference in OS or PFS was observed between the two groups, suggesting that the presence of ≥ 2 HRA in multiple myeloma patients is a significant factor associated with an extremely poor prognosis.
Additionally, 1q21 + conferred a worse prognosis in patients with EMD, confirming its classification as one of the HRA in multiple myeloma. Moreover, the presence of 1q21 + in conjunction with other HRA was associated with significantly worse prognosis compared to 1q21 + alone. These findings underscore the necessity of investigating the role of 1q21 + in EMD.
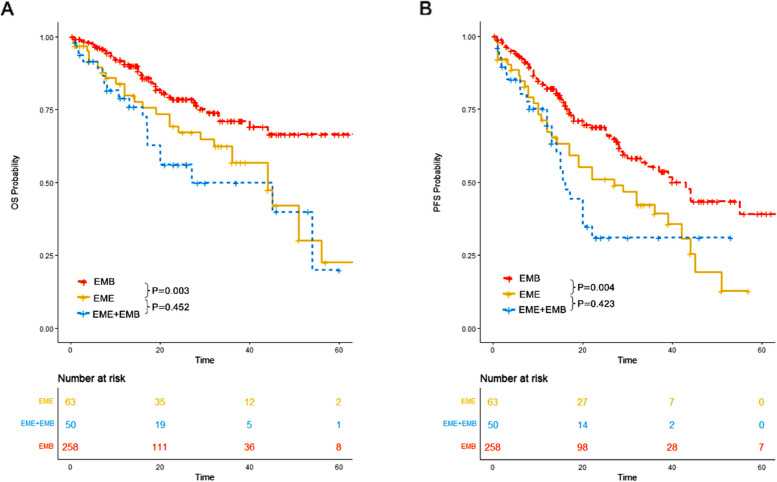
In our study, we also evaluated the survival outcomes of patients with de novo EME only, de novo EME plus EMB, and EMB only at initial diagnosis. Our results indicated that patients with de novo EME only and those with de novo EME plus EMB had significantly worse survival outcomes compared to patients with EMB only. However, no significant differences in OS (P = 0.452) or PFS (P = 0.423) were observed between patients with de novo EME only and those with de novo EME plus EMB (Fig. 12). Consequently, we categorized patients with de novo EME and those with de novo EME plus EMB into a single group termed “de novo EME”.
Fig. 12.
OS and PFS of patients with de novo EME only, those with both de novo EME and EMB and those with EMB only. A OS of patients with de novo EME only, those with both de novo EME and EMB and those with EMB only. B PFS of patients with de novo EME only, those with both de novo EME and EMB and those with EMB only
In the multivariable analysis, LDH level, Cr level, EME, and the presence of 1 HRA or ≥ 2 HRA were identified as significant variables associated with OS and PFS in the entire cohort.
The strength of our study lies in its status as the largest dataset regarding EMD in China. Therefore, the findings from our study are reliable and can represent real-world outcomes concerning this aspect. Compared to studies conducted at Hospital Clínic in Barcelona, our study includes a larger number of patients with EMB and EME, and it encompasses patients treated during the era of novel agents, which better reflects the current treatment paradigm [38]. As a result, the findings from our study may offer more reliable insights. In comparison to the study from Mayo Clinic, we have a higher number of patients with de novo EME, providing a more representative analysis of this type of extramedullary plasmacytoma [10]. Additionally, compared to a study published in Bone Marrow Transplantation, our study includes more patients who received ASCT, offering further exploration of the impact of ASCT on improving survival outcomes for patients with EMD [39]. However, limitations still exist. First, it was a retrospective study, which may have introduced bias. In real-world settings, patients may change their treatment regimen due to economic constraints, personal preferences, or other factors. Unlike controlled clinical trials, real-world studies are subject to statistical biases stemming from such treatment changes. Addressing this bias is challenging, making conclusions about treatment outcomes less definitive and requiring cautious interpretation. Second, the number of patients with three or more HRA was small, making it insufficient to thoroughly investigate this aspect. Third, the small number of patients who underwent tandem ASCT in our study limits the investigation of this potentially effective treatment in patients with ≥ 2 HRA.
In summary, the presence of ≥ 2 HRA in extramedullary multiple myeloma remains a significant factor associated with extremely poor survival outcomes. Risk stratification based on the number of HRA can guide treatment decisions in EMD populations. Single transplantation and CD38 monoclonal antibodies-based therapy can significantly improve the survival outcomes of EMD patients with 0 or 1 HRA, but they do not confer similar benefits for those with ≥ 2 HRA. Additionally, 1q21 + remains an independent factor associated with poor prognosis in EMD populations.
Acknowledgements
Not applicable.
Abbreviations
- HRA
High-risk cytogenetic abnormalities
- EMD
Extramedullary disease
- EME
Extramedullary extraosseous
- EMB
Extramedullary bone-related
- OS
Overall survival
- PFS
Progression free survival
- 1q21 +
1Q21 gain/amplification
- NDMM
Newly diagnosed multiple myeloma
- IMiDs
Immunomodulatory drugs
- PIs
Proteosome inhibitors
- FISH
Fluorescence In Situ Hybridization
- IMWG
International Myeloma Working Group
- G-CSF
Granulocyte colony stimulating factor
- MM
Multiple myeloma
- Non-EMD
Non-extramedullary disease
- PET/CT
Positron emission tomography/computed tomography
- ECOG
Eastern Cooperative Oncology Group
- LDH
Lactate dehydrogenase
- Cr
Creatinine
- Ca
Calcium
- HGB
Hemoglobin
- ISS
International staging system
- RISS
Revised international staging system
- ASCT
Autologous stem cell transplantation
- PR
Partial remission
- VRD
Bortezomib lenalidomide dexamethasone
- VTD
Bortezomib thalidomide dexamethasone
- IRD
Ixazomib lenalidomide dexamethasone
- DVRD
Daratumumab bortezomib lenalidomide dexamethasone
- DRD
Daratumumab bortezomib lenalidomide dexamethasone
- PAD
Bortezomib doxorubicin dexamethasone
- VCD
Bortezomib cyclophosphamide dexamethasone
- PARP
Poly adenosine diphosphate (ADP) ribose polymerase
Authors’ contributions
HW, FYJ, YL and DL conceived the paper. DL, YRY, SRB, WLX, QLW, DMF, MZ, XMN, YF, XQC and ZJX collected the data. DL wrote the manuscript. DL, QLW and HW revised the manuscript.
Funding
HW is supported by the National Natural Science Foundation of China (Grant No. 81700148) and Natural Science Foundation of Guangdong Province (Grant Nos. 2021A1515010093 and 2023A1515011862).
FYJ is supported by Department of Science and Technology of Jilin Province (Grant Nos. 20190201042JC, 20190201163JC, 20210509010RQ), National Natural Science Foundation of China (Grant Nos. 81471165, 81,670,190,81,971,108, 82,370,202), and Interdisciplinary Integration and Innovation Project of Jilin University.
YL is supported by Sun Yat-sen University Start-Up Funding grant 201,603, the Program for Guangdong Introducing Innovative and Entrepreneurial Teams (2017ZT07S096) and National Natural Science Foundation of China grant 81,873,428.
Data availability
Data can be obtained from the corresponding author upon reasonable request.
Declarations
Ethics approval and consent to participate
This study was approved by Institutional Ethical Review Board of Sun Yat-Sen university cancer center. Informed consent requirements were also waived by Institutional Ethical Review Board of Sun Yat-Sen university cancer center. The International Conference on Harmonization's Good Clinical Practice standards and the 1964 Helsinki Declaration and its later revisions served as the foundation for the study's methodology.
Consent for publication
Not Applicable.
Competing interests
The authors declare no competing interests.
Footnotes
Publisher's Note
Springer Nature remains neutral with regard to jurisdictional claims in published maps and institutional affiliations.
Dong Liang, Yurong Yan and Shenrui Bai contributed equally to this work.
Contributor Information
Yang Liang, Email: liangyang@sysucc.org.cn.
Fengyan Jin, Email: fengyanjin@jlu.edu.cn.
Hua Wang, Email: wanghua@sysucc.org.cn.
References
- 1.An G, Xu Y, Deng S, et al. Chromosome 1q21 gains confer inferior outcomes in multiple myeloma treated with bortezomib but copy number variation and percentage of plasma cells involved have no additional prognostic value. Blood. 2013;122(21):1992. [DOI] [PMC free article] [PubMed] [Google Scholar]
- 2.Lakshman A, Painuly U, Rajkumar SV, et al. Impact of acquired del (17p) in multiple myeloma. Blood Adv. 2019;3(13):1930–8. [DOI] [PMC free article] [PubMed] [Google Scholar]
- 3.Geng C, Yang G, Zhou H, et al. Prognostic value of t (4; 14) translocation in newly diagnosed multiple myeloma patients in novel agent era. Hematology. 2023;28(1):2161222. [DOI] [PubMed] [Google Scholar]
- 4.Goldman-Mazur S, Jurczyszyn A, Castillo JJ, et al. A multicenter retrospective study of 223 patients with t (14; 16) in multiple myeloma. Am J Hematol. 2020;95(5):503–9. [DOI] [PubMed] [Google Scholar]
- 5.Ozga M, Zhao Q, Huric L, et al. Concomitant 1q+ and t (4; 14) influences disease characteristics, immune system, and prognosis in double-hit multiple myeloma. Blood Cancer Journal, 2023, 13(1): 167. 10.1038/s41408-023-00943-2 [DOI] [PMC free article] [PubMed]
- 6.Singh C, Panakkal V, Sreedharanunni S, et al. Presentation and impact of double and triple hit cytogenetics in patients with multiple myeloma in the real world. Clinical Lymphoma Myeloma and Leukemia, 2022, 22(8): e685-e690. 10.1016/j.clml.2022.03.005 [DOI] [PubMed]
- 7.Shah V, Sherborne AL, Walker BA, et al. Prediction of outcome in newly diagnosed myeloma: a meta-analysis of the molecular profiles of 1905 trial patients. Leukemia. 2018;32(1):102–10. [DOI] [PMC free article] [PubMed] [Google Scholar]
- 8.Wang Y, Liu A, Xu T, et al. Bone-Related Extramedullary Disease in Newly Diagnosed Myeloma Patients is an Independent Poor Prognostic Predictor. Clinical Medicine Insights: Oncology. 2022;16:11795549221109500. 10.1177/11795549221109500. [DOI] [PMC free article] [PubMed] [Google Scholar]
- 9.Multiple extramedullary-bone related and/or extramedullary extraosseous are independent poor prognostic factors in patients with newly diagnosed multiple myeloma. Frontiers in Oncology, 2021, 11: 668099. 10.3389/fonc.2021.668099. [DOI] [PMC free article] [PubMed]
- 10.Zanwar S, Ho M, Lin Y, et al. Natural history, predictors of development of extramedullary disease, and treatment outcomes for patients with extramedullary multiple myeloma. AM J HEMATOL. 2023;98(10):1540–9. 10.1002/ajh.27023. [DOI] [PubMed] [Google Scholar]
- 11.Sonneveld P, Dimopoulos MA, Boccadoro M, et al. Daratumumab, Bortezomib, Lenalidomide, and Dexamethasone for Multiple Myeloma. NEW ENGL J MED. 2023;390(4):301–13. 10.1056/NEJMoa2312054. [DOI] [PubMed] [Google Scholar]
- 12.Touzeau C, Perrot A, Hulin C, et al. Daratumumab, carfilzomib, lenalidomide, and dexamethasone with tandem transplant for high-risk newly diagnosed myeloma. Blood. 2024;143(20):2029–36. 10.1182/blood.2023023597. [DOI] [PubMed] [Google Scholar]
- 13.Callander NS, Silbermann R, Kaufman JL, et al. Daratumumab-based quadruplet therapy for transplant-eligible newly diagnosed multiple myeloma with high cytogenetic risk. Blood Cancer J. 2024;14(1):69. 10.1038/s41408-024-01030-w. [DOI] [PMC free article] [PubMed] [Google Scholar]
- 14.Kumar S, Paiva B, Anderson KC, et al. International Myeloma Working Group consensus criteria for response and minimal residual disease assessment in multiple myeloma. LANCET ONCOL. 2016;17(8):e328–46. 10.1016/S1470-2045(16)30206-6. [DOI] [PubMed] [Google Scholar]
- 15.Gao, S, Li, Q, Dong, F, et al. Clinical characteristics and survival outcomes of newly diagnosed multiple myeloma patients presenting with extramedullary disease: A retrospective study. LEUKEMIA RES. 2022; 115 106793. 10.1016/j.leukres.2022.106793 [DOI] [PubMed]
- 16.Wang J, Shen N, Shen X, et al. Survival trends and prognostic factors of patients with newly diagnosed multiple myeloma accompanied with extramedullary disease. ANN MED. 2023;55(2):2281657. 10.1080/07853890.2023.2281657. [DOI] [PMC free article] [PubMed] [Google Scholar]
- 17.Wang Y, Xu J, Xu B, et al. The prognostic role of 1q21 gain/amplification in newly diagnosed multiple myeloma: The faster, the worse. CANCER-AM CANCER SOC. 2023;129(7):1005–16. 10.1002/cncr.34641. [DOI] [PubMed] [Google Scholar]
- 18.Chen, Q, Han, X, Zheng, G, et al. The adverse impact of a gain in chromosome 1q on the prognosis of multiple myeloma treated with bortezomib-based regimens: A retrospective single-center study in China. Front Oncol. 2022; 12 1084683. 10.3389/fonc.2022.1084683 [DOI] [PMC free article] [PubMed]
- 19.Skerget M, Skopec B, Zver S, et al. Amplification of Chromosome 1q Predicts Poor Overall Survival in Newly Diagnosed Multiple Myeloma Patients. J HEMATOL. 2023;12(3):109–13. 10.14740/jh1137. [DOI] [PMC free article] [PubMed] [Google Scholar]
- 20.Abdallah N, Greipp P, Kapoor P, et al. Clinical characteristics and treatment outcomes of newly diagnosed multiple myeloma with chromosome 1q abnormalities. BLOOD ADV. 2020;4(15):3509–19. 10.1182/bloodadvances.2020002218. [DOI] [PMC free article] [PubMed] [Google Scholar]
- 21.Schmidt TM, Barwick BG, Joseph N, et al. Gain of Chromosome 1q is associated with early progression in multiple myeloma patients treated with lenalidomide, bortezomib, and dexamethasone. Blood Cancer J. 2019;9(12):94. 10.1038/s41408-019-0254-0. [DOI] [PMC free article] [PubMed] [Google Scholar]
- 22.Ozga M, Zhao Q, Huric L, et al. Concomitant 1q+ and t(4;14) influences disease characteristics, immune system, and prognosis in double-hit multiple myeloma. Blood Cancer J. 2023;13(1):167. 10.1038/s41408-023-00943-2. [DOI] [PMC free article] [PubMed] [Google Scholar]
- 23.Shen M, Yang G, Li X, et al. At least two high-risk cytogenetic abnormalities indicate the inferior outcomes for newly diagnosed multiple myeloma patients: a real-world study in China. LEUKEMIA LYMPHOMA. 2021;62(12):2992–3001. 10.1080/10428194.2021.1948032. [DOI] [PubMed] [Google Scholar]
- 24.Baysal M, Demirci U, Umit E, et al. Concepts of Double Hit and Triple Hit Disease in Multiple Myeloma, Entity and Prognostic Significance. Sci Rep. 2020;10(1):5991. 10.1038/s41598-020-62885-0. [DOI] [PMC free article] [PubMed] [Google Scholar]
- 25.Gagelmann N, Eikema DJ, Iacobelli S, et al. Impact of extramedullary disease in patients with newly diagnosed multiple myeloma undergoing autologous stem cell transplantation: a study from the Chronic Malignancies Working Party of the EBMT. HAEMATOL-HEMATOL J. 2018;103(5):890–7. 10.3324/haematol.2017.178434. [DOI] [PMC free article] [PubMed] [Google Scholar]
- 26.Gagelmann N, Eikema DJ, Koster L, et al. Tandem Autologous Stem Cell Transplantation Improves Outcomes in Newly Diagnosed Multiple Myeloma with Extramedullary Disease and High-Risk Cytogenetics: A Study from the Chronic Malignancies Working Party of the European Society for Blood and Marrow Transplantation. BIOL BLOOD MARROW TR. 2019;25(11):2134–42. 10.1016/j.bbmt.2019.07.004. [DOI] [PubMed] [Google Scholar]
- 27.Voorhees PM, Kaufman JL, Laubach J, et al. Daratumumab, lenalidomide, bortezomib, and dexamethasone for transplant-eligible newly diagnosed multiple myeloma: the GRIFFIN trial. Blood. 2020;136(8):936–45. 10.1182/blood.2020005288. [DOI] [PMC free article] [PubMed] [Google Scholar]
- 28.Facon T, Kumar SK, Plesner T, et al. Daratumumab, lenalidomide, and dexamethasone versus lenalidomide and dexamethasone alone in newly diagnosed multiple myeloma (MAIA): overall survival results from a randomised, open-label, phase 3 trial. LANCET ONCOL. 2021;22(11):1582–96. 10.1016/S1470-2045(21)00466-6. [DOI] [PubMed] [Google Scholar]
- 29.Dimopoulos MA, Oriol A, Nahi H, et al. Overall Survival With Daratumumab, Lenalidomide, and Dexamethasone in Previously Treated Multiple Myeloma (POLLUX): A Randomized, Open-Label. Phase III Trial J CLIN ONCOL. 2023;41(8):1590–9. 10.1200/JCO.22.00940. [DOI] [PMC free article] [PubMed] [Google Scholar]
- 30.Jelinek T, Sevcikova T, Zihala D, et al. Limited efficacy of daratumumab in multiple myeloma with extramedullary disease. Leukemia. 2021;36(1):288–91. 10.1038/s41375-021-01343-w. [DOI] [PubMed] [Google Scholar]
- 31.Byun JM, Min CK, Kim K, et al. Phase II trial of daratumumab with DCEP in relapsed/refractory multiple myeloma patients with extramedullary disease. J Hematol Oncol. 2022;15(1):150. 10.1186/s13045-022-01374-5. [DOI] [PMC free article] [PubMed] [Google Scholar]
- 32.Ishikawa H, Kawano MM, Okada K, et al. Expressions of DNA topoisomerase I and II gene and the genes possibly related to drug resistance in human myeloma cells. BRIT J HAEMATOL. 1993;83(1):68–74. 10.1111/j.1365-2141.1993.tb04633.x. [DOI] [PubMed] [Google Scholar]
- 33.Klausz K, Kellner C, Gehlert CL, et al. The Novel Dual Topoisomerase Inhibitor P8–D6 Shows Anti-myeloma Activity In Vitro and In Vivo. MOL CANCER THER. 2021;21(1):70–8. 10.1158/1535-7163.MCT-21-0119. [DOI] [PubMed] [Google Scholar]
- 34.Turner JG, Dawson JL, Grant S, et al. Treatment of acquired drug resistance in multiple myeloma by combination therapy with XPO1 and topoisomerase II inhibitors. J Hematol Oncol. 2016;9(1):73. 10.1186/s13045-016-0304-z. [DOI] [PMC free article] [PubMed] [Google Scholar]
- 35.Thomas M, Li J, King K, et al. PARP1 and POLD2 as prognostic biomarkers for multiple myeloma in autologous stem cell transplant. HAEMATOL-HEMATOL J. 2023;108(8):2155–66. 10.3324/haematol.2022.282399. [DOI] [PMC free article] [PubMed] [Google Scholar]
- 36.Pawlyn C, Loehr A, Ashby C, et al. Loss of heterozygosity as a marker of homologous repair deficiency in multiple myeloma: a role for PARP inhibition? Leukemia. 2018;32(7):1561–6. 10.1038/s41375-018-0017-0. [DOI] [PMC free article] [PubMed] [Google Scholar]
- 37.Beksac M, Seval GC, Kanellias N, et al. A real world multicenter retrospective study on extramedullary disease from Balkan Myeloma Study Group and Barcelona University: analysis of parameters that improve outcome. HAEMATOL-HEMATOL J. 2019;105(1):201–8. 10.3324/haematol.2019.219295. [DOI] [PMC free article] [PubMed] [Google Scholar]
- 38.Jiménez-Segura R, Rosiñol L, Cibeira MT, et al. Paraskeletal and extramedullary plasmacytomas in multiple myeloma at diagnosis and at first relapse: 50-years of experience from an academic institution. Blood Cancer J. 2022;12(9):135. 10.1038/s41408-022-00730-5. [DOI] [PMC free article] [PubMed] [Google Scholar]
- 39.Kumar L, Gogi R, Patel AK, et al. Multiple myeloma with extramedullary disease: impact of autologous stem cell transplantation on outcome. BONE MARROW TRANSPL. 2017;52(10):1473–5. 10.1038/bmt.2017.165. [DOI] [PubMed] [Google Scholar]
Associated Data
This section collects any data citations, data availability statements, or supplementary materials included in this article.
Data Availability Statement
Data can be obtained from the corresponding author upon reasonable request.


