

Abstract
Parkinson’s disease (PD) is a neurodegenerative brain disorder that causes symptoms such as tremors, sleeplessness, behavioral problems, sensory abnormalities, and impaired mobility, according to the World Health Organization (WHO). Artificial intelligence, machine learning (ML), and deep learning (DL) have been used in recent studies (2015–2023) to improve PD diagnosis by categorizing patients and healthy controls based on similar clinical presentations. This study investigates several datasets, modalities, and data preprocessing techniques from the collected data. Issues are also addressed, with suggestions for future PD research involving subgrouping and connection analysis using magnetic resonance imaging (MRI), dopamine transporter scan (DaTscan), and single-photon emission computed tomography (SPECT) data. We have used different models like Convolutional Neural Network (CNN) and Gated Recurrent Unit (GRU) for detecting PD at an early stage. We have used the Parkinson’s Progression Markers Initiative (PPMI) dataset 3D brain images and archived the 86.67%, 94.02%, accuracy of models, respectively.
Keywords: Artificial intelligence, data preprocessing, Gait, MRI, Parkinson’s Disease, PET
Introduction
Parkinson’s disease, also known as PD, is a long-term, degenerative condition of the central nervous system that impacts both the motor and non-motor systems.[1] Tremors, stiffness, slow movement, and trouble walking are some early signs. Cognitive, behavioral, sleep, and sense system issues are also possible. As the disease progresses, dementia caused by PD becomes more prevalent. There are two sections of the brain where we can detect PD symptoms—motor and non-motor brain regions are shown in Figure 1.
Figure 1.
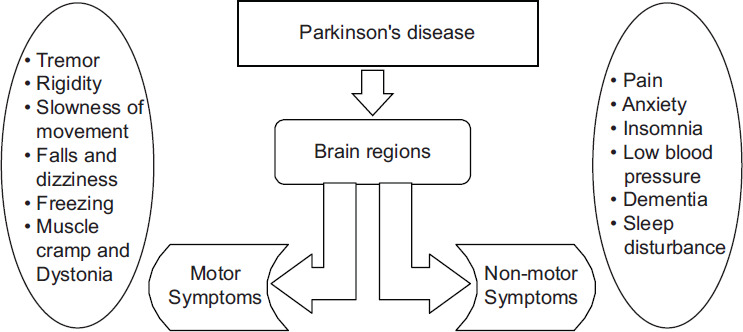
Introduction of brain region for PD
The substantia nigra in the midbrain, which supplies dopamine to the basal ganglia, is where the loss of nerve cells leads to the motor symptoms of the disease. Although the exact etiology of PD is unknown, it is thought that a mix of environmental and genetic variables is responsible. Most diagnoses are based on symptoms, the most common of which are motor complaints. Tests such as the DaTscan, which uses magnetic resonance imaging (MRI) to take a look at dopaminergic neuronal malfunction, can help rule out other disorders.[2] About one percent of adults over the age limit of 60 who have the condition will normally get it.
The main symptom at the start is a slow hand tremor when the hand is still. This tremor goes away when you move the hand or during deep sleep. It often starts in one hand and later affects both. In PD, the hand tremors usually happen at a speed of 4–6 times per second. People often show a symptom where their thumb and index finger touch and move in a circular motion like rolling a pill. The phrase comes from the resemblance between PD patients’ movements and the early medicinal practice of hand-filling pills.[3] PD patients’ computed tomography (CT) scans typically look normal.[4] With advanced MRI techniques using a strong magnetic field (at least 3T), doctors can now better diagnose the disease by looking for specific patterns and the absence of the “swallow tail” image in the substantia nigra.[5]
Dopamine agonists, which work like levodopa, attach to dopamine receptors in the brain. They are often used as the initial treatment for PD motor symptoms to delay the need for levodopa, which helps avoid levodopa-related complications. Initially, these were used as a complementary therapy to levodopa for people feeling levodopa problems.[6] Side effects of dopamine agonists include sleepiness, hallucinations, sleeplessness, nausea, and constipation.
Patients with PD experience non-motor symptoms more frequently than healthy controls with comparable demographics. Many different studies consistently find that people with typical PD often experience a significant number of non-motor symptoms, averaging 8–12 per patient. Early PD investigations have noted increased drooling, urine urgency, constipation, anxiety, forgetfulness or attentional issues, and diminished smell.[7]
PD frequently causes sleep disorders and excessive daytime sleepiness, which have a variety of causes, including the condition itself, sleep-wake disturbances, and dopaminergic drugs. Given that dopaminergic therapies for PD frequently cause sedation and sleepiness, a case-control study was conducted contrasting the Epworth Sleepiness Scale (ESS) and Pittsburgh Sleep Quality Index (PSQI) scales in PD patients receiving dopaminergic medication, PD patients receiving no treatment, and healthy controls.[8]
This study presents various modalities, such as tremors, MRI, and positron emission tomography (PET), which help to collect necessary data for analyzing PD symptoms to detect PD, and also presents a detailed explanation of different types of preprocessing techniques for the data that have accumulated from other available modalities, which are shown in Figure 2. This study flashes some light on additional deep learning (DL) and machine learning (ML) model techniques to detect PD that have been used up to date and explore the usage of other datasets used by researchers for PD. We have used four models with the help of the Parkinson’s Progression Markers Initiative (PPMI) dataset to compare the performance analysis of the collected brain data.
Figure 2.
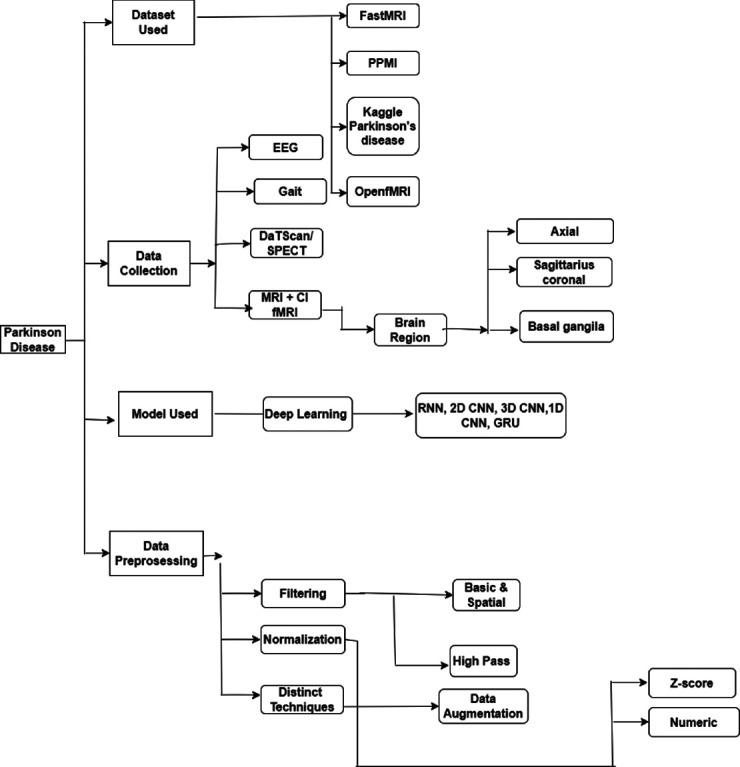
Taxonomy of Parkinson’s disease
The sections of the study are as follows: Section 2 involves discussion and taxonomy of the whole paper, in which different data collections from multiple modalities, data preprocessing techniques, artificial intelligence (AI) models available for detecting PD, and an overview of the different datasets were used by researchers. Section 3 includes the implementation part and a comparison of the results of two different models on three-dimensional (3D) brain images. Section 4 contains challenges and future perspectives. Finally, the article ended with a proper conclusion in Section 5.
Discussion and Taxonomy of PD
This study presented the detection of PD-related work that has been completed with different types of symptoms that can help detect the early stages of PD.
PD is one of the trending diseases in the world. It is most commonly shown in old age, but nowadays, it is shown in youngsters too. Therefore, PD can be considered a severe disease worldwide. Many researchers are working on PD and trying to detect and mitigate it at an early stage. For detecting PD, many researchers used ML and DL algorithms. This study presents some critical points about PD and how the work performed by researchers is shown in Table 1.
Table 1.
Literature review
| References | Modality | Algorithm used | Objective | Source of data | Subjects | Performance |
|---|---|---|---|---|---|---|
| Mohammed et al.[9] | Speech | MLP, RBFANN | Classification PD From healthy control |
UCI-based dataset | 24 PD vs 8HC | 93.22% |
| Oh et al.[10] | EEG | CNN | Classification PD From healthy control |
FP, FP2, F7, etc. channelsfor EEG | 2PD vs 20 HC | 88.25% |
| Priya et al.[11] | Gait | ANN | Classification PD From healthy control |
PhysioNet | 93 PD vs 73 HC | 96.28% |
| Chien et al.[12] | DAT/SPECT | ANN | Classification PD From healthy control |
Collected from participants | 234 PD | 99.22% |
| Mohammed et al.[12] | DAT/SPECT | 2D CNN | Classification of PD From healthy control |
PPMI | 1364 PD vs 1359 HC | 99.34% |
| Vyas et al.[13] | MRI | 2D, 3D CNN | Classification of PD From healthy control |
PPMI | 236 PD vs 82 HC | 88.9%for 2D CNN 72.22%for 3D CNN |
| Yasaka et al.[14] | MRI | 2D CNN | Classification of PD From healthy control |
Collected from participants from Juntendo Hospital | 115 PD vs 115 HC | NA |
| Bhan et al.[15] | MRI | LeNet-5 | Classification PD From healthy control |
PPMI | 30 PD vs 24 HC | 97.92% |
| Mozhdehfarahbakhsh et al.[16] | MRI | CNN | Classification PD From healthy control |
PPMI | 20 PD vs 20 HC | 94% |
Data collection
Many different categories of symptoms are available in the human body for detecting PD very quickly for doctors and researchers and start treatment to mitigate PD as soon as possible. These data collections are classified into nine different categories of non-motor and motor symptoms of the brain’s division, which are shown in Table 2, with radial basis function-artificial neural network (RBF-ANN).
Table 2.
Data collections from different parameters
| References | Modality | Description |
|---|---|---|
| [1] | EEG | PD can cause aberrant EEG patterns, notably in the basal ganglia, where there is decreased beta activity in the waves and higher theta wave activity, reflecting the condition’s typical motor and cognitive difficulties |
| [16] | Gait | PD is characterized by unique shuffling gaits, smaller steps, and a propensity to lean forward. A combination of bradykinesia and rigidity of the muscles can cause balance problems and an elevated risk of falling, and this is the case |
| [18] | DaTscan/SPECT | It measures the brain’s dopamine transporter levels to assist in distinguishing PD from other illnesses that have similar symptomology. Dopamine transporter activity is significantly decreased in PD, particularly in the striatum. Patients with possible Parkinsonian disorders can benefit from DaTscan’s assistance in making an accurate diagnosis and selecting the best course of treatment |
| [19] | MRI/FMRI | PD patient’s brains can have structural and functional abnormalities that can be seen with MRI and functional magnetic resonance imaging (fMRI). While fMRI can record various types of activity in the brain during motor activities, MRI can demonstrate atrophy in particular brain regions, such as the substantia nigra. These methods contribute to a more accurate diagnosis and potential treatment insights by helping to understand the development and neural foundations of PD symptoms |
Electroencephalogram (EEG)
An EEG is a noninvasive neuroimaging. Technology keeps track of the brain’s electrical signals. EEG can aid in studying brain activity and identifying specific patterns linked with PD. There are many EEG categories for detecting PD, which are mentioned as follows. Resting State Abnormalities[17]: EEG recordings during resting states in people with PD may reveal aberrant patterns, such as an increase in low-frequency oscillations (delta and theta waves) and a decrease in higher-frequency oscillations. Bradykinesia and Rigidity[17]: EEG can sometimes reveal distinct patterns related to muscle movement (slowness of movement) and stiffness. These trends may include a drop in magnitude and altered cortical oscillations in the brain’s motor areas. Sleep Disturbances[17]: Sleep problems, such as PD, are usually linked to a sleep pattern involving rapid eye movement problems. The EEG during sleep may reveal aberrant activity associated with certain sleep disorders. Oh et al.’s[10] proposed model was trained using EEG data from people with and without PD. The trained model may have proven capable of recognizing EEG patterns associated with PD, thus aiding in early diagnosis and disease monitoring. The suggested design employs stride pooling layers to minimize the feature map’s size significantly. The suggested convolutional neural network (CNN) outperforms existing state-of-the-art approaches for PD prediction and diagnosis using EEG information.
Gait
It refers to an approach or style of walking, encompassing the pattern of limb movement and body posture when walking. Gait abnormalities are caused mainly by dopamine insufficiency, a neurotransmitter in the brain essential for coordinating activities. In PD, the loss of neurons in a brain area called the substantia nigra, which produces dopamine, leads to the movement symptoms. There are many gait categories for detecting PD, which are mentioned as follows. Shuffling Gait[18]: Steps shorten and the toes drag on the ground. Freezing of Gait:[18] A sudden, transient difficulty to commence or continue walking frequently results in the sensation of being ”stuck” to the floor. Instability and Balance Issues[18]: Balance issues might increase the danger of falling when walking. Priya et al.[11] seek to contribute to developing more effective PD diagnostic tools by utilizing modern signal processing and pattern recognition techniques. The study likely tries to give an objective and quantitative approach to identifying PD while tracking its course by evaluating gait signals, which are altered by the disease’s motor symptoms. They used the ANN-ML model for detecting PD and got 96.28% accuracy.
DAT or single-photon emission computed tomography (SPECT)
SPECT is a medical imaging technology that injects a small quantity of a radioactive tracer into the body to obtain detailed 3D images of internal structures. Dopamine is an essential neurotransmitter for movement regulation and is deficient in PD. SPECT imaging can aid in a variety of ways. Assessment of Dopamine Levels[19]: SPECT scans with certain radiotracers can visualize the brain’s DAT. This sort of SPECT scan is commonly known as a DaTscan, and it aids clinicians in determining whether there is a decrease in dopamine-producing cells throughout the brain. Chien et al.[12] use artificial neural networks to address the problem of identifying PD from other Parkinsonian disorders. The study is likely to focus on examining DAT SPECT pictures, with a particular focus on the putamen region, which is vital for controlling movement and is affected in PD; the accuracy of the ANN model was 99.22%, and the sensitivity was 81.8%. Mohammed et al.’s[9] research focuses on the construction and testing of a DL model for identifying PD using SPECT images. A nuclear medicine technology known as SPECT imaging gives valuable information about the circulation and activity in the brain. It proposed a DL model that uses SPECT scans to diagnose PD illness. DL entails training sophisticated neural networks to acquire patterns and features using existing data, which can be particularly useful for tasks such as medical picture analysis. The CNN model obtained 99.34% accuracy and 99.04% sensitivity.
MRI or functional MRI (fMRI)
This harmless medical imaging method uses strong magnetic fields and radio waves to produce precise photographs of internal body components. In PD, MRI is often used to aid in the diagnosis, monitor disease progression, and understand underlying changes in the brain. Structured MRI Imaging[20]: The brain can be visually visualized structurally using conventional MRI. Structural MRI in PD can aid in ruling out other illnesses that might manifest with comparable symptoms. Additionally, it can demonstrate any atrophy of specific brain areas, such as the substantia nigra. Blood flow changes are measured by fMRI, which can identify active brain regions. It can be used to examine brain networks and connectivity, which can aid in understanding the effects of PD on various brain regions.[21] Indirect visualization of brain dopamine receptors is possible using sophisticated MRI techniques, such as PET-MRI or SPECT-MRI. These methods can provide information about the availability and distribution of dopamine receptors because a dopamine deficit characterizes PD. Mozhdehfarahbakhsh et al.[16] practices in neuromedicine and data from MRIs are thought to be helpful in identifying a variety of disorders in the brain. Additionally, the discipline has recently seen a rise in the use of DL techniques for image processing, frequently with excellent outcomes. Here, the CNN model aids in differentiating between PD stages. The findings indicated that our present CNN model based on MRI might be used as a possible tool for determining between PD stages with a high accuracy rate of 0.94. Bhan et al.[15] has used the DL algorithms, a subset of AI tools that can automatically discover patterns and features from data. They would probably describe how these algorithms might be used to diagnose diseases by applying them to medical imaging data, particularly MRI scans. With the help of the CNN and the LeNet-5 architecture, the MRI data of PD cases and normal controls were successfully separated. When batch normalization was not used, the LeNet-5 model’s training accuracy and test accuracy were 96.65% and 97.62%, respectively. With batch normalization performed, the training accuracy and test accuracy were 95.44% and 97.92%, respectively. Various Brain Regions Such as Axial Region: PD primarily affects the axial region of the brain, which includes regions such as the substantia nigra and basal ganglia, which are important in controlling motor control and producing typical motor symptoms.[22] Basal Ganglia: PD causes significant damage to this crucial area of the brain for motor control because dopaminergic neurons degenerate there, impairing movement and causing tremors, bradykinesia, and stiffness.[22] Sagittal Coronal: It refers to the orientation or parts of the brain, and the midbrain’s substantia nigra and the entire brain’s basal ganglia are the main regions of concern when it comes to PD.[22]
Data preprocessing
Preprocessing is performed to make the data more valuable. All the techniques are shown in Table 3.
Table 3.
Data preprocessing technique II
| Normalization | Z-score | Calculating the data’s mean and standard deviation. For each point, divide by the standard deviation after deducting the mean. Having a unit variance centers the data around zero. Enables variables to be compared on a common scale. |
| Numeric | Adjusting numerical details to a particular range, maintaining the relative differences between the data points, reducing the effect that different magnitudes will have on algorithms | |
| Distinct techniques | Data augmentation | Creating more, varied training instances. Improving the resilience and generalization of the model. Transforming something by rotating, flipping, or scaling diversifying datasets without adding new samples |
Normalization
The normalization process entails aligning and confining MRI data to a detailed anatomic template. The size and shape of each person’s brain vary, so normalization is required to make it simpler to contrast one brain MRI to another and convert the results into a uniform size and shape. Normalization of Z-Scores (ZN): Defining the divergence of demo data from a distribution’s mean is a method of normalizing data to prevent problems with outliers. Normalization of Numbers: The term “numerical normalization,” which describes the technique of transforming numbers into a new range utilizing a function of mathematics, is also present in the study. It helps to enable the comparison of diverse experimental data values across multiple scales, which makes their relationship stand out sharply.
Filtering
It describes altering or improving an image by highlighting particular elements or omitting other features. Space-Time Filtering: Spatial filtering is a method of picture improvement where the value of the currently processed pixel depends on both itself and the pixels to its right and left. Temporal Filtering: Temporal filtering significantly increases the signal-to-noise ratio by removing frequencies from the raw signal that are not relevant.
Distinct techniques
Data augmentation: Techniques for data augmentation are used when the distribution of photographs across classes becomes out of balance.
Model used: Many models used by researchers
Many Deep-learning algorithm are shown in Table 4.
Table 4.
Deep learning models
| References | Model name | Description |
|---|---|---|
| [23] | CNN | PD is categorized using patient information, such as speech or visual attributes. From the incoming data, convolutional layers extract pertinent patterns and characteristics. Using pooling layers, the output is downsampled, yet vital data are kept. Extracted features are processed by fully connected layers for precise illness categorization. Utilizing visual or spectrographic input data, CNNs are useful for diagnosing PD because they are excellent at collecting spatial patterns |
| [24] | RNN | PD is categorized using sequential patient data. To detect temporal patterns, time-series features such as movement and voice data are supplied into the RNN. Recurrent connections in the model allow it to take into account historical data, which is necessary for precise disease identification. To reliably diagnose PD from sequential input, training requires adjusting the RNN’s parameters to reduce classification mistakes |
| [25] | GRU | It is applied to classify PD using sequential patient data, such as time-series measurements of movement or voice characteristics. The RNN’s recurrent connections enable it to capture temporal dependencies and patterns within the data. By considering historical information, the model can accurately distinguish PD. Training involves optimizing the RNN’s parameters to minimize classification errors, facilitating reliable disease detection from sequential input. RNNs are well suited for tasks where temporal context is crucial, making them valuable for diagnosing PD based on sequential data |
CNN[23]
To distinguish one image from another, a CNN, often called a ConvNet, typically takes input as an image and assigns biases and weights to various parts. CNN uses the convolution operation instead of simple matrix multiplication in at least one layer of its structure. Unstructured datasets (such as pictures and videos) are where it is usually applicable. Only the spatial dimensions (height and breadth) are used using 2D-CNN as 2D-CNNs can only take one slice as input, they cannot gather context information from adjacent slices.
Recurrent neural network (RNN)[24]
RNNs are referred to as memory networks because they can recall the past and use that knowledge to inform their decisions. Because 2D-CNNs can only take one slice as input, they cannot gather context information from adjacent slices. The primary and most crucial characteristics of RNN are its hidden state. The concealed form is used to aid with recalling specifics in a sequence. Every input uses the same parameters, as each must complete the same task on all inputs (hidden layers) to produce the output. In contrast to previous NNs, this one reduces the complexity parameters.
Gated Recurrent Unit (GRU)[25]
The GRU, a particular form of RNN architecture, was created to overcome some of the shortcomings of conventional RNNs, particularly in collecting long-range dependencies in sequential data. The processing of natural language, speech recognition, and economic market analysis are just a few examples of the sequential or time-series data-intensive applications for which RNNs are frequently used. To learn and transfer information across lengthy sequences, classical RNNs can have vanishing gradient difficulties, which makes it difficult. The reset gate and the update gate are the two gates that make up his gating system. Here is a quick breakdown of these elements: Update Gate: The update gate decides how much of the former concealed state should be included in the present candidate state. It determines how much of the past should be remembered or forgotten. Reset Gate: When calculating the new candidate state, the reset gate aids the network in deciding which elements of the previous concealed state should be disregarded.
Datasets used
It is a collection of data that can be used to learn from past data and train the model from the past data. Many datasets are used for PD, which are shown in Table 5.
Table 5.
Dataset information
| References | Dataset | Description |
|---|---|---|
| [26] | fastMRI | It gives FLAIR pictures and 3T MRI data from 6970 demo brain images of axial regions |
| [27] | PPMI | A thorough analysis of clinical, imaging, and genetic details from those suffering from PD and unaffected controls is included in the PPMI dataset. Research on disease evaluation and treatment will be aided by the identification of indicators for disease progression in this long-term study |
| [27] | OpenfMRI | It is capable of helping identify PD and includes 95 MRI samples of 3372 people |
FastMRI[26]
The FastMRI dataset’s main objective is to offer a substantial and varied set of MRI raw data to create and test image reconstruction methods. Traditional MRI acquisitions could take a long time, making the patient uncomfortable and resulting in image motion artifacts. Accelerated MRI techniques are used to reduce acquisition time while retaining diagnostic picture quality. The dataset is focused on quickening the acquisition of MRI data.
PPMI[27]
Detecting biomarkers of PD progression is possible using the PD PPMI public domain database. SPECT and raw and processed MRI images are included in the PPMI study dataset. The PPMI dataset’s main objective is to give researchers access to extensive clinical, genetic, imaging, and biomarker data to further understand how PD develops. This knowledge can help with early detection, better diagnostic precision, and the creation of focused treatments.
OpenfMRI[27]
OpenfMRI is a project that provides free and openly accessible fMRI datasets for researchers in the field of neuroimaging. These datasets are made available to promote collaboration, reproducibility, and the advancement of neuroscientific research. OpenfMRI aims to facilitate the sharing of raw fMRI data, analysis scripts, and results to enhance the transparency and reliability of neuroimaging studies.
Proposed methodology
It is a review paper, so we are not proposing any framework, but we have mentioned the proposed methodology for collecting data and the comparison result, which is shown in Figure 3. We used the image resizing method to generate the same image size from the dataset. The normalization method is required to make it simpler to contrast one brain MRI to another and convert the results into a uniform size and shape. Gaussian Filtering: The Gaussian smoothing operator performs a weighted average of surrounding pixels based on the Gaussian distribution. Median filtering is helpful in eliminating periodic patterns and random noise, particularly when the noise amplitude probability density has big tails. To apply the median filter, a window is simply slid over the picture.
Figure 3.
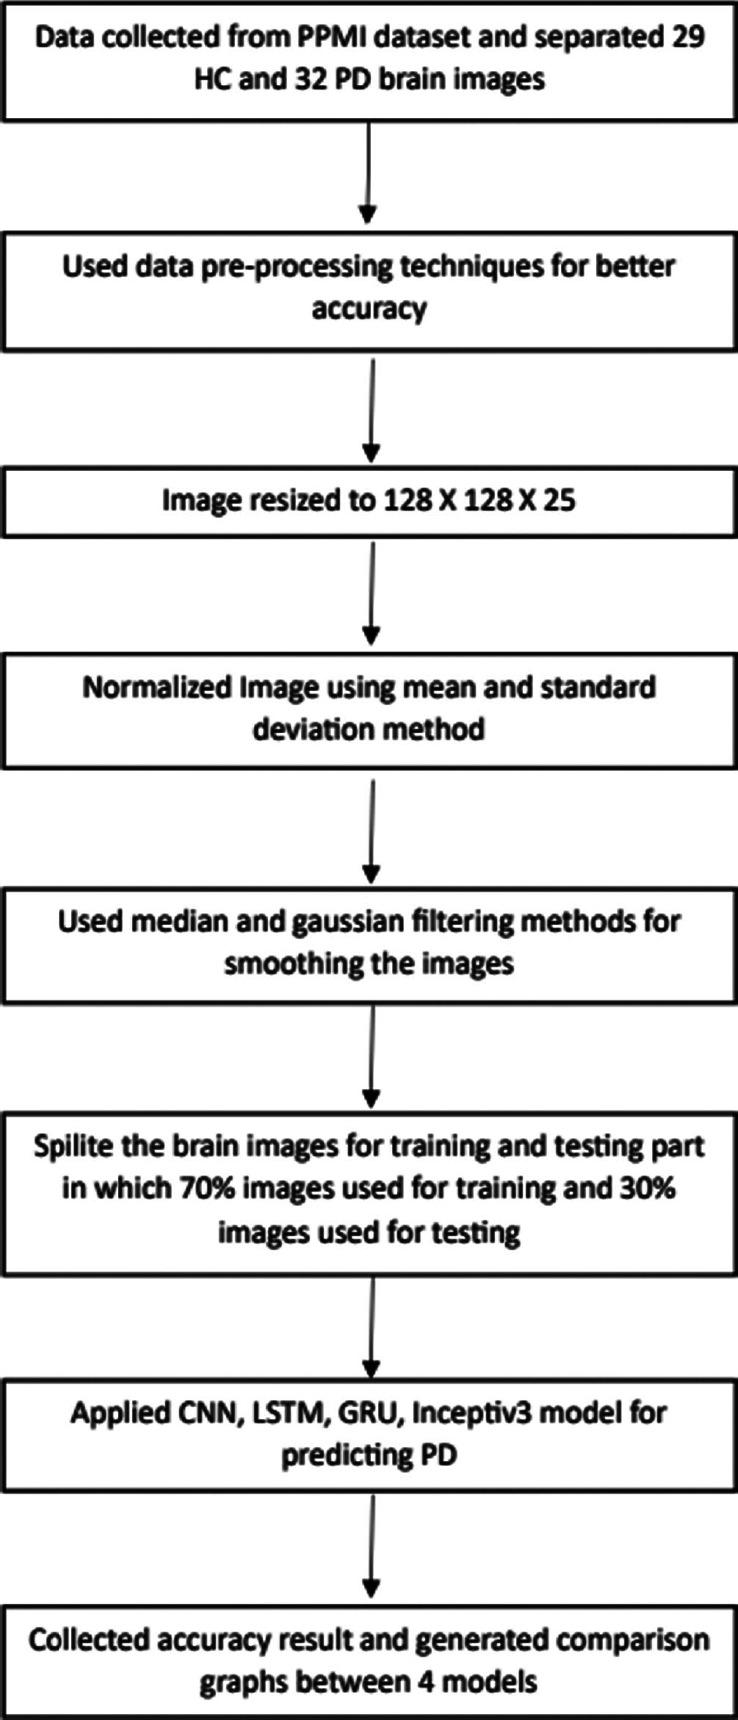
Proposed methodology
Performance analysis
A machine equipped with an Intel Core 10th-generation processor was utilized. We have used the same PPMI dataset in Google Colab to create our DL models. It has a virtual random access memory (RAM) of 12.7 GB. Our implementation execution speed has been accelerated through the utilization of the built-in GPU. RAM for our system is 8 GB. We have preprocessed data using a variety of techniques, including normalization, Gaussian and median filtering, and resizing. Using these system configurations, we have applied four models to 32 PD and 29 HC brains and obtained the following accuracies as shown in Table 6.
Table 6.
Accuracy and loss comparison between four different model
| Model name | Accuracy | Loss of data | Epochs |
|---|---|---|---|
| CNN 3D | 86.67% | 0.65 | 15 |
| GRU | 94.02% | 0.13 | 15 |
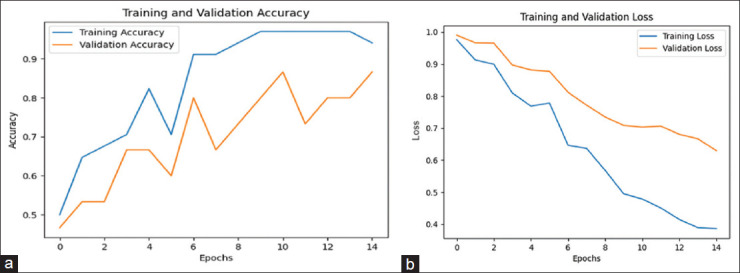
Figure 4a shows the training and validation accuracy of the CNN model, which is 86.67%. Figure 5a represents the training and validation accuracy of the GRU model, which is 94.02% higher than all other models.
Figure 4.
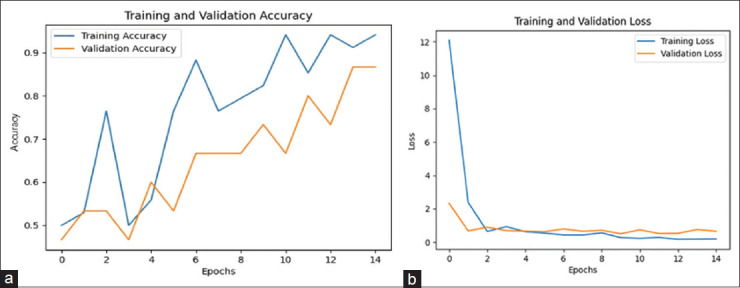
(a) Training and validation accuracy of the CNN model. (b) Training and validation loss of the CNN model
Figure 5.
(a) Training and validation accuracy of the GRU model. (b) Training and validation loss of the GRU model
Figure 4b shows the training and validation loss of the CNN model, which is 0.65. Figure 5b represents the training and validation loss of the GRU model, which is 0.13 lesser than all other models.
Issues with multimodality datasets for PD detection
Multimodal neuroimaging data, such as EEG-fMRI, MRI-PET, and fMRI-magnetoencephalography (MEG) prove valuable in accurately diagnosing brain diseases such as PD. However, acquiring diverse and high-quality datasets for training AI models can be time-consuming and challenging due to privacy concerns and the lower prevalence of PD compared with other medical conditions. This can lead to imbalanced datasets, potentially impacting the model’s performance in PD diagnosis.
Issues with ML and DL techniques
The heterogeneity of PD complicates AI model training, requiring consideration of various symptoms and patient profiles. Stringent ethical and privacy guidelines are essential when using health data, and clinical validation is necessary for medical AI model development. Continuous disease monitoring and adaptation to changing patient conditions are challenging. The adoption of AI-based diagnoses in healthcare settings faces barriers due to infrastructure and training costs. To address image variability, transfer learning and improved image preprocessing techniques are vital.
Conclusion
In this article, we have examined different modalities to gather data for detecting PD at an early stage. The most popular DL-ML techniques have been explored for detecting PD neurological disorders from different modalities, such as MRI and gait. In the middle of the article, different preprocessing data techniques have been discussed, and at the same time, fastMRI, Kaggle PD, PPMI, OpenfMRI, NAMIC, and NTUA datasets have been explored mainly for PD. We have applied two models that is CNN and GRU for detecting PD at an early stage with same PPMI dataset and achieved the best accuracy that is 86.67%, 94.04%, respectively. In the end, the remaining issues and potential developments have been discussed. This gives individuals who are battling the illness hope as a result.
Financial support and sponsorship
Nil.
Conflicts of interest
There are no conflicts of interest.
Acknowledgment
The authors thank the respondents of this study for sparing their valuable time to take the survey. The authors would also like to thank Prof. Shivani Desai (Assistant Professor, Nirma University, Ahmedabad) for his assistance in framing and improving the article.
References
- 1.Spears C. Dopamine agonists retrieved. 2018. Available from: http://www.parkinson.org/understanding/parkinsons/treatment/prescription-medications .
- 2.Armstrong MJ Okun MS. Diagnosis and treatment of Parkinson disease: A review. JAMA. 2020;323:548–60. doi: 10.1001/jama.2019.22360. [DOI] [PubMed] [Google Scholar]
- 3.Valls-Solé, Josep. and Francesc Valldeoriola. “Neurophysiological correlate of clinical signs in Parkinson’s disease.”. Clinical neurophysiology. 113(6):2002, 792–805. doi: 10.1016/s1388-2457(02)00080-9. [DOI] [PubMed] [Google Scholar]
- 4.Brooks DJ. Imaging approaches to Parkinson disease. J Nucl Med. 2010;51:596–609. doi: 10.2967/jnumed.108.059998. [DOI] [PubMed] [Google Scholar]
- 5.Schwarz ST, Afzal M, Morgan PS, Bajaj N, Gowland PA, Auer DP. The ‘swallow tail’appearance of the healthy nigrosome–A new accurate test of Parkinson’s disease: A case-control and retrospective cross-sectional MRI study at 3t. PLoS One. 2014;9:e93814. doi: 10.1371/journal.pone.0093814. [DOI] [PMC free article] [PubMed] [Google Scholar]
- 6.National Collaborating Centre for Chronic Conditions. Parkinson's Disease. London: Royal College of Physicians; 2006. “Symptomatic pharmacological therapy in Parkinson’s disease.”; pp. 59–100. [Google Scholar]
- 7.Duncan GW, Khoo TK, Yarnall AJ, O’Brien JT, Coleman SY, Brooks DJ, et al. Health-related quality of life in early Parkinson’s disease: The impact of nonmotor symptoms. Mov Disord. 2014;29:195–202. doi: 10.1002/mds.25664. [DOI] [PubMed] [Google Scholar]
- 8.Fabbrini G, Barbanti P, Aurilia C, Vanacore N, Pauletti C, Meco G. Excessive daytime sleepi- ness in de novo and treated Parkinson’s disease. Mov Disord. 2002;17:1026–30. doi: 10.1002/mds.10193. [DOI] [PubMed] [Google Scholar]
- 9.Mohammed F, He X, Lin Y. Retracted: An easy-to-use deep-learning model for highly accurate diag- nosis of Parkinson’s disease using spect images. Comput Med Imaging Graph. 2021;87:101810. doi: 10.1016/j.compmedimag.2020.101810. [DOI] [PubMed] [Google Scholar]
- 10.Oh S, Hagiwara Y, Raghavendra U, Yuvaraj R, Arunkumar N, Murugappan M, et al. A deep learning approach for Parkinson’s disease diagnosis from eeg signals. Neural Comput Appl. 2020;32:10927–33. [Google Scholar]
- 11.Priya SJ, Rani AJ, Subathra M, Mohammed MA, Damaševičius R, Ubendran N. Local pattern transformation based feature extraction for recognition of parkinson’s disease based on gait signals. Diagnostics. 2021;11:1395. doi: 10.3390/diagnostics11081395. [DOI] [PMC free article] [PubMed] [Google Scholar]
- 12.Chien C-Y, Hsu S-W, Lee T-L, Sung P-S, Lin C-C. Using artificial neural network to discriminate Parkinson’s disease from other Parkinsonisms by focusing on putamen of dopamine transporter spect images. Biomed. 2020;9:12. doi: 10.3390/biomedicines9010012. [DOI] [PMC free article] [PubMed] [Google Scholar]
- 13.Vyas T, Yadav R, Solanki C, Darji R, Desai S, Tanwar S. Deep learning-based scheme to diagnose parkinson’s disease. Exp Syst. 2022;39:e12739. [Google Scholar]
- 14.Yasaka K, Kamagata K, Ogawa T, Hatano T, Takeshige-Amano H, Ogaki K, et al. Parkinson’s disease: Deep learning with a parameter-weighted structural connectome matrix for diagnosis and neural circuit disorder investigation. Neuroradiology. 2021;63:1451–62. doi: 10.1007/s00234-021-02648-4. [DOI] [PMC free article] [PubMed] [Google Scholar]
- 15.Bhan A, Kapoor S, Gulati M, Goyal A. Early diagnosis of parkinson’s disease in brain mri using deep learning algorithm. In 2021 Third International Conference on Intelligent Communication Technologies and Virtual Mobile Networks (ICICV) IEEE. 2021:1467–70. [Google Scholar]
- 16.Mozhdehfarahbakhsh A, Chitsazian S, Chakrabarti P, Chakrabarti T, Kateb B, Nami M. An MRI based deep learning model to predict Parkinson’s disease stages. medRxiv. 2021 doi: 10.1101/2021.02.19.21252081. [Google Scholar]
- 17.Maitin AM, Muñoz JPR, Garcia-Tejedor AJ. Survey of machine learning techniques in the analysis of EEG signals for Parkinson’s disease: A systematic review. Appl Sci. 2022;12:6967. [Google Scholar]
- 18.Boktor JC, Sharon G, Verhagen Metman LA, Hall DA, Engen PA, Zreloff Z, et al. Integrated multi-cohort analysis of the Parkinson’s disease gut metagenome. Mov Disord. 2023;38:399–409. doi: 10.1002/mds.29300. [DOI] [PubMed] [Google Scholar]
- 19.Khachnaoui H, Khlifa N, Mabrouk R. Machine learning for early Parkinson’s disease identification within swedd group using clinical and datscan spect imaging features. J Imaging. 2022;4:97. doi: 10.3390/jimaging8040097. [DOI] [PMC free article] [PubMed] [Google Scholar]
- 20.Symms M, Jager HR, Schmierer K, Yousry T. A review of structural magnetic resonance neuroimaging. J Neurol Neurosurg Psychiatry. 2004;75:1235–44. doi: 10.1136/jnnp.2003.032714. [DOI] [PMC free article] [PubMed] [Google Scholar]
- 21.Kaplan E, Altunisik E, Firat YE, Barua PD, Dogan S, Baygin M, et al. Novel nested patch-based feature extraction model for automated Parkinson’s disease symptom classification using MRI images. Comput Methods Programs Biomed. 2022;224:107030. doi: 10.1016/j.cmpb.2022.107030. [DOI] [PubMed] [Google Scholar]
- 22.Blumenreich S, Nehushtan T, Barav OB, Saville JT, Dingjan T, Hardy J, et al. Elevation of gangliosides in four brain regions from Parkinson’s disease patients with a GBA mutation NPJ Parkinson’s Disease. 2022;8:99. doi: 10.1038/s41531-022-00363-2. [DOI] [PMC free article] [PubMed] [Google Scholar]
- 23.Sarraf S, Tofighi G. Classification of Alzheimer’s disease using FMRI data and deep learning convolu- tional neural networks. arXiv. 2016 doi: 10.48550/arXiv.1603.08631. [Google Scholar]
- 24.Warule P, Mishra SP, Deb S. Time-frequency analysis of speech signal using chirplet transform for automatic diagnosis of Parkinson’s disease. Biomed Eng Lett. 2023;13:613–23. doi: 10.1007/s13534-023-00283-x. [DOI] [PMC free article] [PubMed] [Google Scholar]
- 25.Rehman R, Saba T, Mujahid M, Alamri FS, ElHakim N. Parkinson’s disease detection using hybrid lstm-gru deep learning model. Electronics. 2023;12:2856. [Google Scholar]
- 26.Cousineau M, Jodoin PM, Morency FC, Rozanski V, Grand’Maison M, Bedell BJ, et al. A test-retest study on parkinson’s PPMI dataset yields statistically significant white matter fascicles. Neuroimage Clin. 2017;16:222–33. doi: 10.1016/j.nicl.2017.07.020. [DOI] [PMC free article] [PubMed] [Google Scholar]
- 27.Poldrack RA, Gorgolewski KJ. Openfmri: Open sharing of task FMRI data. Neuroimage. 2017;144:259–61. doi: 10.1016/j.neuroimage.2015.05.073. [DOI] [PMC free article] [PubMed] [Google Scholar]