

Abstract
Background
Metabolic dysfunction-associated fatty liver disease (MAFLD) is a typical hepatic steatosis with metabolic dysfunction. The composite dietary antioxidant index (CDAI) measures individual antioxidant capacity, and the relationship with MAFLD has received little attention. Our goal is to explore the association of CDAI with MAFLD.
Methods
Participants were selected from the National Health and Nutrition Examination Survey (NHANES) from 2013 to 2020. CDAI was calculated basing on six dietary antioxidants, including zinc, selenium, carotenoids, and vitamins A, C, and E. Univariate regression and multivariable logistic regression analysis were conducted to evaluate the correlation between CDAI and MAFLD. We performed subgroup analysis to study the correlation in various populations.
Results
A total of 18,163 participants, including 13,969 MAFLD and 4,194 non-MAFLD, were included. CDAI was significantly negatively correlated with MAFLD. After adjusting for all confounders (including age, gender, race, marital status, poverty ratio, education level, drinking status, smoking status, and physical activity), individuals in the highest quartile of CDAI exhibited a 27% lower likelihood of developing MAFLD than those in the lowest quartile (OR = 0.73; 95% CI [0.66, 0.81], p < 0.001). Physical activity subgroup analysis showed that this negative association was significant in the moderate-intensity physical exercise population (Model 3 in Q4, OR = 0.72; 95% CI [0.58–0.89], p < 0.001). Additionally, the changes in vitamins C were independently associated with MAFLD (Model 3, OR = 0.90; 95% CI [0.86–0.93], p < 0.001).
Conclusions
We found a negative relationship between higher CDAI scores and MAFLD. This study provided a new reference for exploring dietary interventions that affect MAFLD to reduce its incidence.
Supplementary Information
The online version contains supplementary material available at 10.1186/s12876-024-03556-6.
Keywords: Metabolic dysfunction-associated fatty liver disease, Composite dietary antioxidant index, Healthy diet, Oxidative stress
Introduction
Metabolic dysfunction-associated fatty liver disease (MAFLD) is a new definition introduced in 2020 [1], which replaces non-alcoholic fatty liver disease (NAFLD) [1, 2]. Alarmingly, MAFLD affects more than 33% of the population worldwide [3] with a prevalence rate of 50.7%, particularly pronounced among overweight and obese adults [4]. Extensive research has underscored the association of MAFLD with cardiovascular diseases (CVD) and malignancies [5–7], highlighting its significant health implications. The progression of MAFLD involves a dynamic, bidirectional relationship with oxidative stress [8], offering a promising target for non-pharmacological interventions [9]. Notably, diet quality has emerged as a significant determinant of the MAFLD phenotype [10], underscoring the potential of dietary modifications as a therapeutic strategy [11]. Specifically, daily consumption of antioxidants has been shown to bolster antioxidant defenses and mitigate oxidative stress [12], suggesting that dietary adjustments may constitute an effective means of combating MAFLD by reducing the body’s oxidative stress burden.
The Composite Dietary Antioxidant Index (CDAI) is commonly used to measure an individual’s antioxidant capacity and is calculated based on the intake of several dietary antioxidants, including vitamins A, C, and E, as well as carotene, selenium, zinc [13]. This index is crafted to evaluate the cumulative impact of dietary antioxidants on human health outcomes [14]. Extensive research has revealed that elevated CDAI score is negatively associated with mortality stemming from osteoporosis [15], depression [16], cancer [17], and cardiovascular diseases [18], underlining its protective effects. Furthermore, studies have demonstrated that a higher CDAI score is positively correlated with delayed biological aging [19], and can reduce the risk of diabetes [20], hypertension [21], obesity [22], and cancers such as colorectal cancer [17] and lung cancer [14]. However, a direct investigation into the relationship between CDAI and MAFLD remains elusive, highlighting an area of research that warrants further exploration.
In this study, we aim to deeply explore the potential association of CDAI with MAFLD, Our objective is to provide valuable insights for developing novel intervention measures for MAFLD patients through dietary guidance.
Materials and methods
Data sources and participants
The National Health and Nutrition Examination Survey (NHANES) (https://www.cdc.gov/nchs/nhanes/) was a population-based and cross-sectional survey that aimed to gather comprehensive data on health and nutrition in the American household population. In this study, various data on nutrition and health from 2013–2014, 2015–2016, and 2017–2020 were downloaded from NHANES. The three NHANES cycles were combined to extract demographic variables such as age, gender, race/ethnicity, marital status, poverty ratio, and educational attainment. In addition, the body mass index (BMI), waist circumference, smoking status, physical activity, alcohol consumption, diabetes, and hypertension data were extracted. Furthermore, we collected data of oral glucose tolerance test (OGTT), fasting blood glucose (FBG), glycated hemoglobin (HbA1c), triglyceride (TG), and high-density lipoprotein cholesterol (HDL-C). The ethical review of this study was exempted because the database was accessible to the public.
Study variables
Ascertainment of MAFLD
MAFLD was defined as steatosis combined with metabolic dysfunction. The criteria for diagnosing MAFLD included the fulfillment of one of the following three standards:
-
(A)
Overweight (BMI≥25 kg/m2);
-
(B)
Type 2 diabetes mellitus (defined as meeting any of the following criteria: antidiabetic drugs use, fasting glucose≥7.0 mmol/L, glycated hemoglobin [HbA1c]> 6.4%, or based on an oral glucose tolerance test [OGTT]≥11.1mmol/L;
-
(C)
The following combinations of at least two metabolic abnormalities: (1) waist circumference >102 cm for males and >88 cm for females; (2) blood pressure≥130/85 mm Hg or taking antihypertensive drugs; (3) plasma triglyceride≥1.70 mmol/L or lipid-lowering drugs treatment; (4) high-density lipoprotein cholesterol (HDL-C) <1.0 mmol/L in men and HDL-C<1.3 mmol/L in women or lipid-lowering drug treatment; (5) prediabetes defined as fasting blood glucose 5.6–6.9 mmol/L, HbA1c 5.7%−6.4%, or the matched OGTT 7.8–11.1mmol/L; (6) homeostatic model assessment of insulin resistance≥2.5; or (7) c-reactive protein (CRP) level>2 mg/L.
Herein, in this work, the information of a total of 35,706 participants were obtained from the NHANES database (from 2013–2020). The following individuals were excluded: 1) less than 18 years old, 2) with incomplete MAFLD related information, 3) with incomplete CDAI information. Finally, there were 18,163 samples in our present study, and the detailed flowchart was shown in Fig. 1.
Fig. 1.
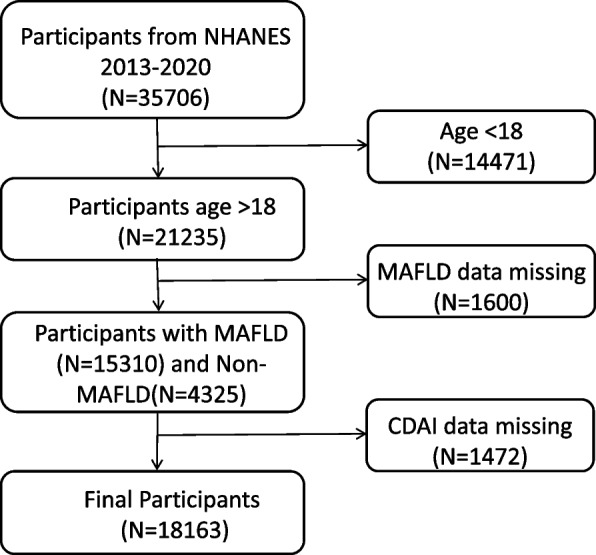
Flowchart of the participant’s selection from NHANES 2013–2020
Ascertainment of CDAI
The NHANES collected participants’ food intake over two consecutive days through 24-h dietary recall interviews. The average daily intake was then calculated based on data from the two dietary recalls. CDAI was composed of six dietary antioxidants, including zinc, selenium, carotenoids, and vitamins A, C, and E. CDAI was calculated by the measurement method proposed by Wright [14] as follows:
where the represented the daily intake of antioxidants, the represented the mean of , and the represented the standard deviation for . Subsequently, CDAI was divided into four groups: Q1, Q2, Q3 and Q4 according to quartile values.
Covariates
To assess the effects of other potential confounding factors, we included several important covariates, including age (19 < age ≤ 39 years, 40 < age ≤ 59 years, and age ≥ 60 years), gender (male and female), race/ethnicity (Mexican American, Non-Hispanic White, Non-Hispanic Black, Non-Hispanic Asian, Other Hispanic, and Other Race), education level (college or above, high school or equivalent, and less than high school), poverty ratio (the ratio of income to poverty; low level < 1.5, moderate level 1.5–3.5, and high level > 3.5), marital status (married: married/living with a partner, separated: widowed/divorced/separated, and never married), drinking status (Never, moderate: 1–2 drinks per day for men or 1 drinks per day for women, and heavy: more than 2 drinks per day for men or more than 1 drinks per day for women), smoking status (never: no more than 100 cigarettes in life, ever: smoking more than 100 cigarettes but no longer smoking, now: smoking over 100 cigarettes, and sometimes or consistently), and physical activity (low level: < 600 min/week, moderate: 600–8000 min/week, and high level: ≥ 8000 min/week). Regarding physical activity, the physical activity questionnaire (NHANES variable name prefix PAQ) was performed basing on the Global Physical Activity Questionnaire (GPAQ), which consisted of questions related to daily activities (including working activity and fitness activity), leisure time activities, and sedentary activities. The physical activity data in our study was the sum of all types of activities mentioned above.
Statistical analysis
Continuous variables were presented as the mean ± standard deviation (SD), while categorical variables were reported as the number and percentage of subjects. The weighted t test and the weighted Chi-square test were used to evaluate the differences between the continuous and categorical variables, respectively. Univariate regression analysis was used to analyze the relationship between MAFLD and variables. The multivariable logistic regression analysis was used to construct a multivariate model and estimate the odds ratio (OR) and 95% confidence interval (CI) of CDAI and MAFLD. Model 1 was adjusted for nothing, while Model 2 was adjusted for age, gender, and race. Model 3 was further adjusted for age, gender, race, marital status, poverty ratio, education level, drinking status, smoking status, and physical activity. All statistical analyses were performed using R (version: 4.3.3), and p < 0.05 was considered statistically significant.
Results
Population characteristics
Based on the 18,163 participants’ data in NHANES ranging from 2013–2020, a summary of the baseline characteristics of the participants have been provided (Table 1). The average age of the participants was 49.12 ± 17.92 years. There were 9,404 females and 8,759 males. Among all participants, 4,194 were with non-MAFLD and 13,969 were with MAFLD. Among them, MAFLD patients (50.9 ± 17.31 years) exhibited a greater mean age than non-MAFLD (43.22 ± 18.64 years). Significant disparities were observed in the non-MAFLD and MAFLD patients in terms of race/ethnicity, educational level, marital status, diabetes, poverty ratio, drinking status, smoking status, and physical activity. Notably, the average triglycerides, OGTT, HbA1c, and plasma fasting glucose of MAFLD were all significantly higher than those of non-MAFLD. Regarding the six dietary antioxidants relating to CDAI, there was no significant difference between non-MAFLD and MAFLD patients, while in MAFLD participants, there was relatively lower intake of all six dietary antioxidants (Table 1).
Table 1.
Characteristics of participants classified by MAFLD
| Variables | Level | Overall | Non-MAFLD | MAFLD | p -value |
|---|---|---|---|---|---|
| N | 18163 | 18163 | 4194 | 13969 | |
| Age [mean ± SD] | 49.12 ± 17.92 | 43.22 ± 18.64 | 50.90 ± 17.31 | < 0.001 | |
| Gender (%) | 0.672 | ||||
| Female | 9404 (51.78) | 2184 (52.07) | 7220 (51.69) | ||
| Male | 8759 (48.22) | 2010 (47.93) | 6749 (48.31) | ||
| Race/ethnicity (%) | < 0.001 | ||||
| Mexican American | 2520 (13.87) | 337 (8.04) | 2183 (15.63) | ||
| Non-Hispanic Asian | 1923 (10.59) | 824 (19.65) | 1099 (7.87) | ||
| Non-Hispanic Black | 4226 (23.27) | 864 (20.6) | 3362 (24.07) | ||
| Non-Hispanic White | 6813 (37.51) | 1636 (39.01) | 5177 (37.06) | ||
| Other Hispanic | 1950 (10.74) | 368 (8.77) | 1582 (11.33) | ||
| Other Race—Including Multi-Racial | 731 (4.02) | 165 (3.93) | 566 (4.05) | ||
| Education (%) | < 0.001 | ||||
| College or above | 10181 (56.05) | 2546 (62.01) | 7635 (55.1) | < 0.001 | |
| High school or equivalent | 6336 (34.88) | 1363 (33.2) | 4973 (35.89) | ||
| Less than high school | 1445 (7.96) | 197 (4.8) | 1248 (9.01) | ||
| Marital status (%) | < 0.001 | ||||
| Married | 10458 (57.58) | 2176 (54.7) | 8282 (60.29) | ||
| Separated | 3882 (21.37) | 701 (17.62) | 3181 (23.16) | ||
| Never married | 3375 (18.58) | 1101 (27.68) | 2274 (16.55) | ||
| Diabetes (%) | |||||
| Diabetes | 3371 (18.56) | 0 (0%) | 3371 (24.78) | < 0.001 | |
| Prediabetes | 6386 (35.16) | 1177 (29.6) | 5209 (38.28) | ||
| Normal | 7826 (43.09) | 2800 (70.4) | 5026 (36.94) | ||
| Poverty ratio [mean ± SD] | 0.001 | ||||
| High | 5029 (27.69) | 1273 (33.51) | 3756 (30.03) | ||
| Moderate | 5401 (29.74) | 1188 (31.27) | 4213 (33.69) | ||
| Low | 5875 (32.35) | 1338 (35.22) | 4537 (36.28) | ||
| Drinking status (%) | < 0.001 | ||||
| Heavy | 6427 (35.39) | 1572 (46.83) | 4855 (44.21) | ||
| Moderate | 5564 (30.63) | 1341 (39.95) | 4223 (38.45) | ||
| Never | 2348 (12.93) | 444 (13.23) | 1904 (17.34) | ||
| Smoking status (%) | < 0.001 | ||||
| Ever | 4234 (23.31) | 689 (16.43) | 3545 (25.38) | ||
| Never | 10541 (58.04) | 2574 (61.37) | 7967 (57.03) | ||
| Now | 3388 (18.65) | 931 (22.2) | 2457 (17.59) | ||
| Physical activity (%) | 0.176 | ||||
| High | 1338 (7.37) | 335 (17.23) | 1003 (15.93) | ||
| Moderate | 4206 (23.16) | 997 (51.29) | 3209 (50.96) | ||
| Low | 2697 (14.85) | 612 (31.48) | 2085 (33.11) | ||
| CDAI | < 0.001 | ||||
| Q1 | 4553 (25.07) | 949 (22.63) | 3604 (25.8) | ||
| Q2 | 4533 (24.96) | 995 (23.72) | 3538 (25.33) | ||
| Q3 | 4532 (24.95) | 1041 (24.82) | 3491 (24.99) | ||
| Q4 | 4545 (25.02) | 1209 (28.83) | 3336 (23.88) | ||
| Vitamin A [mean ± SD] | 1117.53 ± 1034.86 | 1090.5 ± 871.7 | 1057.5 ± 1079.7 | 0.22 | |
| Vitamin C [mean ± SD] | 148.78 ± 144.22 | 146.1 ± 144.0 | 139.8 ± 148.7 | 0.141 | |
| Vitamin E [mean ± SD] | 16.16 ± 11.17 | 16.9 ± 12.0 | 16.2 ± 11.2 | 0.05 | |
| Carotenoid [mean ± SD] | 16682.83 ± 18182.28 | 16507.1 ± 17826.6 | 15960.0 ± 17290.1 | 0.279 | |
| Selenium [mean ± SD] | 208.92 ± 108.68 | 221.9 ± 117.2 | 220.1 ± 114.1 | 0.583 | |
| Zinc [mean ± SD] | 19.56 ± 11.59 | 20.9 ± 12.0 | 20.4 ± 13.5 | 0.132 | |
| Body Measure | BMI | 29.65 ± 7.33 | 21.91 ± 2.04 | 31.92 ± 6.75 | < 0.001 |
| Waist | 100.17 ± 16.97 | 81.18 ± 7.39 | 105.82 ± 14.77 | < 0.001 | |
| BPXDI | 124.14 ± 18.45 | 68.8 ± 11.11 | 72.45 ± 12.62 | < 0.001 | |
| BPXSY | 71.60 ± 12.38 | 118.89 ± 17.94 | 125.72 ± 18.31 | < 0.001 | |
| Biochemistry | Cholesterol—HDL (mmol/L) | 1.38 ± 0.42 | 1.62 ± 0.45 | 1.31 ± 0.39 | < 0.001 |
| Triglycerides (mmol/L) | 1.28 ± 1.19 | 0.83 ± 0.42 | 1.42 ± 1.31 | < 0.001 | |
| OGTT (mmol/L) | 6.68 ± 2.87 | 5.61 ± 1.6 | 7.08 ± 3.12 | < 0.001 | |
| HbA1c (%) | 5.80 ± 1.12 | 5.33 ± 0.36 | 5.94 ± 1.22 | < 0.001 | |
| Plasma Fasting Glucose (mmol/L) | 6.18 ± 2.08 | 5.34 ± 0.51 | 6.43 ± 2.29 | < 0.001 |
Abbreviations: MAFLD Metabolic dysfunction-associated fatty liver disease, CDAI composite dietary antioxidant index, BMI body mass index, BPXDI Diastolic blood pressure (mm Hg), BPXSY Systolic blood pressure (mm Hg), HDL high-density lipoprotein, OGTT oral glucose tolerance test, HbA1c glycated hemoglobin
The continuous variables were analyzed employing weighted t test, presented in mean ± SD. The categorical variables were analyzed using weighted Chi-square test, presented in value (ratio %)
Subsequently, according to the quartile, CDAI was divided into four groups including Q1 (CDAI < −2.87), Q2 (−2.87 < = CDAI < = 0.6), Q3 (0.6 < CDAI < = 2.1), and Q4 (CDAI > 2.1). Notably, significant CDAI disparities were observed between non-MAFLD and MAFLD patients. Furthermore, the baseline characteristics of participants were analyzed among Q1, Q2, Q3, and Q4 CDAI subgroups, and the results indicated that all variables exhibited significant differences in different CDAI subgroups (p < 0.001) (Table 2). Participants in Q4 were younger (48.41 ± 17.31 years old). A male predilection was observed in Q4, whereas female predilection was observed in Q1. Most of the participants with a “college or above” education level were in Q4 (66.21%). Among the married population, the higher the CDAI score, the greater the proportion of married individuals, whereas among the separated population, the opposite trend was observed. Participants with a higher poverty ratio were more prevalent in Q4 (38.7%). Overall, in contrast, the highest CDAI quartile group tended to be younger, male (62.07), non-Hispanic white (38.9), highly educated (66.21%), married (63.3%), better financial status (38.7%), non-smoking (59.58%), and moderate-intensity physical activity (51.59%). Moreover, the intake of all six antioxidants included in CDAI was obviously increased in the highest CDAI quartile (Table 2).
Table 2.
Characteristics of participants classified by CDAI scores
| Variables | Level | Overall | Q1 | Q2 | Q3 | Q4 | p -value |
|---|---|---|---|---|---|---|---|
| CDAI | <−2.87 | −2.87∼0.6 | 0.6~2.1 | >2.1 | |||
| N | 18163 | 4553 | 4533 | 4532 | 4545 | ||
| Age [mean ±SD] | 49.12 ± 17.92 | 49 ± 18.37 | 49.60 ± 18.26 | 49.48 ± 17.73 | 48.41 ± 17.3 | <0.001 | |
| Gender | <0.001 | ||||||
| Female | 9404 (51.78) | 2817 (61.87) | 2589 (57.11) | 2274 (50.18) | 1724 (37.93) | ||
| Male | 8759 (48.22) | 1736 (38.13) | 1944 (42.89) | 2258 (49.82) | 2821 (62.07) | ||
| Race/ethnicity (%) | <0.001 | ||||||
| Mexican American | 2520 (13.87) | 612 (13.44) | 650 (14.34) | 619 (13.66) | 639 (14.06) | ||
| Non-Hispanic Asian | 1923 (10.59) | 456 (10.02) | 403 (8.89) | 494 (10.9) | 570 (12.54) | ||
| Non-Hispanic Black | 4226 (23.27) | 1209 (26.55) | 1109 (24.47) | 969 (21.38) | 939 (20.66) | ||
| Non-Hispanic White | 6813 (37.51) | 1513 (33.23) | 1715 (37.83) | 1817 (40.09) | 1768 (38.9) | ||
| Other Hispanic | 1950 (10.74) | 573 (12.59) | 471 (10.39) | 460 (10.15) | 446 (9.81) | ||
| Other Race - Including Multi-Racial | 731 (4.02) | 190 (4.17) | 185 (4.08) | 173 (3.82) | 183 (4.03) | ||
| Education (%) | <0.001 | ||||||
| College or above | 10181 (56.05) | 2017 (45.06) | 2457 (54.7) | 2723 (60.69) | 2984 (66.21) | ||
| High school or equivalent | 6336 (34.88) | 1907 (42.61) | 1673 (37.24) | 1442 (32.14) | 1314 (29.15) | ||
| Less than high school | 1445 (7.96) | 552 (12.33) | 362 (8.06) | 322 (7.18) | 209 (4.64) | ||
| Marital status (%) | <0.001 | ||||||
| Married | 10458 (57.58) | 2345 (53.27) | 2487 (56.25) | 2804 (63.24) | 2822 (63.3) | ||
| Separated | 3882 (21.37) | 1153 (26.19) | 1076 (24.34) | 874 (19.71) | 779 (17.47) | ||
| Never married | 3375 (18.58) | 904 (20.54) | 858 (19.41) | 756 (17.05) | 857 (19.22) | ||
| Diabetes (%) | <0.001 | ||||||
| Diabetes | 3371 (18.56) | 940 (21.51) | 912 (20.73) | 794 (18.05) | 725 (16.43) | ||
| Normal | 7826 (43.09) | 1906 (43.61) | 1912 (43.46) | 1968 (44.74) | 2040 (46.22) | ||
| Prediabetes | 6386 (35.16) | 1525 (34.89) | 1575 (35.8) | 1637 (37.21) | 1649 (37.36) | <0.001 | |
| Poverty ratio [mean ± SD] | <0.001 | ||||||
| High | 5029 (27.69) | 859 (21.59) | 1184 (28.96) | 1383 (33.76) | 1603 (38.7) | ||
| Moderate | 5401 (29.74) | 1292 (32.48) | 1379 (33.73) | 1409 (34.39) | 1321 (31.89) | ||
| Low | 5875 (32.35) | 1827 (45.93) | 1525 (37.3) | 1305 (31.85) | 1218 (29.41) | ||
| Drinking status (%) | |||||||
| Heavy | 6427 (35.39) | 1595 (46.57) | 1619 (45.14) | 1564 (43.03) | 1649 (44.66) | <0.001 | |
| Moderate | 5564 (30.63) | 1143 (33.37) | 1431 (39.89) | 1493 (41.07) | 1497 (40.55) | ||
| Never | 2348 (12.93) | 687 (20.06) | 537 (14.97) | 578 (15.9) | 546 (14.79) | ||
| Smoking status (%) | <0.001 | ||||||
| Ever | 4234 (23.31) | 904 (19.86) | 1027 (22.66) | 1147 (25.31) | 1156 (25.43) | ||
| Never | 10541 (58.04) | 2550 (56.01) | 2641 (58.26) | 2642 (58.3) | 2708 (59.58) | ||
| Now | 3388 (18.65) | 1099 (24.14) | 865 (19.08) | 743 (16.39) | 681 (14.98) | ||
| Physical activity (%) | 0.003 | ||||||
| High | 1338 (7.37) | 365 (17.88) | 281 (13.73) | 323 (16.05) | 369 (17.24) | ||
| Moderate | 4206 (23.16) | 1008 (49.39) | 1063 (51.93) | 1031 (51.22) | 1104 (51.59) | ||
| Low | 2697 (14.85) | 668 (32.73) | 703 (34.34) | 659 (32.74) | 667 (31.17) | ||
| MAFLD | <0.001 | ||||||
| Yes | 13969 (76.91) | 3604 (79.16) | 3538 (78.05) | 3491 (77.03) | 3336 (73.4) | ||
| No | 4194 (23.09) | 949 (20.84) | 995 (21.95) | 1041 (22.97) | 1209 (26.6) | ||
| CDAI component | Vitamin A [mean ± SD] | 1065.6 ± 1032.7 | 417.9 ± 267.3 | 777.5 ± 370.1 | 1108.4 ± 495.8 | 1934.5 ± 1573.9 | <.001 |
| Vitamin C [mean ± SD] | 141.3 ± 147.6 | 52.6 ± 54.0 | 100.7 ± 80.6 | 150.7 ± 109.6 | 258.0 ± 203.5 | <.001 | |
| Vitamin E [mean ± SD] | 16.4 ± 11.4 | 7.5 ± 3.6 | 12.8 ± 4.8 | 17.4 ± 6.1 | 27.6 ± 14.8 | <.001 | |
| Carotenoid [mean ± SD] | 16093.8 ± 17423.0 | 5428.1 ± 4994.1 | 10859.3 ± 7782.1 | 16197.3 ± 11169.2 | 31451.4 ± 24672.7 | <.001 | |
| Selenium [mean ± SD] | 220.6 ± 114.9 | 116.4 ± 46.3 | 187.2 ± 52.4 | 243.8 ± 69.4 | 332.0 ± 132.6 | <.001 | |
| Zinc [mean ± SD] | 20.5 ± 13.1 | 10.3 ± 4.4 | 16.8 ± 5.2 | 22.3 ± 6.9 | 32.3 ± 18.0 | <.001 |
The continuous variables were analyzed employing weighted t test, presented in mean ± SD. The categorical variables were analyzed using weighted Chi-square test, presented in value (ratio %)
Association between all covariables with MAFLD
After identifying the potential covariables, to further confirm various covariables’ effects on the risk of MAFLD, the univariate logistic regression analysis was employed to explore the correlation between covariables and MAFLD occurrence (Fig. 2). The results indicated that MAFLD was significantly positively associated with age (OR = 1.86; 95%CI [1.72–2.02], p < 0.001), education level, and marital status. Specifically, individuals with a higher education level (OR = 2.34; 95%CI [1.76–3.09], p < 0.001) had less probability of MAFLD compared to those with less than high school degree (OR = 4.93; 95%CI [3.59–6.77], p < 0.001). Additionally, individuals who were never married (OR = 1.92; 95%CI [1.58–2.35], p < 0.001) had a lower probability of MAFLD than those who were married (OR = 3.54; 95%CI [2.93–4.92], p < 0.001) or separated (OR = 4.22; 95%CI [3.45–5.17], p < 0.001). Furthermore, MAFLD was significantly negatively associated with race, poverty ratio, smoking status, and physical activity. Notably, MAFLD was significantly negatively associated with CDAI, meaning that individuals were less likely to develop MAFLD as their CDAI scores increased.
Fig. 2.

The forest plot of association between each variable and MAFLD based on univariate logistic regression analysis
The association between CDAI and MAFLD
To explore the relationship between CDAI and MAFLD, we developed a logistic regression weighted model (Table 3). We found a significant negative correlation between CDAI and MAFLD across all three models (OR < 1, p < 0.001). After stratifying the CDAI to quartiles, we observed a significant negative association between the highest quartile (Q4) and MAFLD in all models (OR < 1, p < 0.001). Additionally, we found a decrement in the risk of MAFLD with every incremental increase in CDAI scores. In particular, in the model3, individuals with the highest CDAI quartile demonstrated a 27% reduced risk of developing MAFLD compared to those in the lowest quartile (model3: OR = 0.73; 95%CI [0.66–0.81], p < 0.001).
Table 3.
Association of CDAI scores and MAFLD
| Variable | Level | Overall | MAFLD | Model1 | p -value | Model2 | p -value | Model3 | p -value |
|---|---|---|---|---|---|---|---|---|---|
| ( N = 18163) | ( N = 13969) | OR (95% CI) | OR (95% CI) | OR (95% CI) | |||||
| Continuous CDAI | 0.02 ± 4.2 | −0.1 ± 4.1 | 0.97 (0.96–0.98) | < 0.001 | 0.97 (0.97–0.98) | < 0.001 | 0.97 (0.96–0.98) | < 0.001 | |
| CDAI | Q1 | 4553 (25%) | 3604 (25.8%) | 1 | 1 | 1 | |||
| Q2 | 4533 (25%) | 3538 (25.3%) | 0.94 (0.85–1.04) | 0.198 | 0.93 (0.84–1.03) | 0.14 | 0.91 (0.82–1.01) | 0.005 | |
| Q3 | 4532 (25%) | 3491 (25%) | 0.88 (0.80–0.98) | 0.014 | 0.91 (0.82–1.00) | 0.057 | 0.86 (0.77–0.95) | 0.004 | |
| Q4 | 4545 (25%) | 3336 (23.9%) | 0.73 (0.66–0.80) | < 0.001 | 0.77 (0.69–0.85) | < 0.001 | 0.73(0.66–0.81) | < 0.001 | |
| P for trend | < 0.001 | < 0.001 | < 0.001 | ||||||
Model 1: no covariates were adjusted
Model 2: adjusted for age, gender, and race
Model 3: adjusted for age, gender, race, marital status, poverty ratio, education level, drinking status, smoking status, and physical activity
Abbreviations: OR odds ration, 95% CI 95% confidence interval, MAFLD Metabolic dysfunction-associated fatty liver disease), CDAI composite dietary antioxidant index
The multivariate logistic regression analysis was used to construct a multivariate model and estimate the OR and 95% CI as well as p value
Furthermore, we conducted a subgroup analysis by gender, age, race/ethnicity, drinking status, smoking habits, and physical activity levels (Table S1). After adjusting for all confounders, the gender-based analysis revealed a significant negative correlation between CDAI (Q3: OR = 0.81; 95%CI [0.70–0.93], p < 0.001 and Q4: OR = 0.66; 95%CI [0.56–0.76], p < 0.001) with MAFLD in females, while in males, there was only Q4 demonstrated a statistically significant negative relationship with MAFLD (OR = 0.77; 95%CI [0.66–0.90], p < 0.001). In participants with various ages, there was significant negative correlation between CDAI and MAFLD after adjusting all confounders, with 25%- 37% reduced MAFLD risk (p < 0.001, Table S1). Specifically, among individuals over 60 years, those in the highest CDAI quartile exhibited a 37% reduced risk of MAFLD compared to those in the lowest quartile (model 3: OR = 0.63; 95% CI [0.51–0.78], p < 0.001). Notably, the physical activity-based subgroup analysis highlighted that only those engaging in moderate-intensity physical activity exhibited a statistically significant negative correlation between CDAI and MAFLD (Q3: OR = 0.64; 95%CI [0.52–0.80], p < 0.001 and Q4: OR = 0.72; 95%CI [0.58–0.89], p < 0.001), whereas no such significance was observed among those with either high or low physical activity intensities. This observation underscored the potential of moderate physical activity in enhancing CDAI scores, thereby mitigating the risk of MAFLD.
The association between antioxidant components and MAFLD
Subsequently, the association between the six antioxidant components of CDAI and MAFLD was evaluated employing the multivariable logistic regression analysis. Among all six antioxidant components, vitamin C intake showed significant negative correlation with MAFLD risk across three models (p for trend < 0.001, Table 4), implying that elevating vitamin C intake would be helpful in MAFLD prevention. As for vitamin A, after adjusting covariates (in Model 2 and Model 3), the intake increase of vitamin A was significantly correlated with reduced MAFLD risk (p for trend < 0.05, Table 4).
Table 4.
Association of six antioxidant components and MAFLD
| Variable | Model1 | p for trend | Model2 | p for trend | Model3 | p for trend |
|---|---|---|---|---|---|---|
| OR (95% CI) | OR (95% CI) | OR (95% CI) | ||||
| Vitamin A | 0.97 (0.93–1.01) | 0.181 | 0.95 (0.91–0.99) | 0.028 | 0.94 (0.90–0.99) | 0.009 |
| Vitamin C | 0.93 (0.89–0.96) | < .001 | 0.91 (0.88–0.95) | < .001 | 0.90 (0.86–0.93) | < .001 |
| Vitamin E | 0.97 (0.93–1.01) | 0.12 | 0.97 (0.93–1.01) | 0.171 | 0.96 (0.92–1.01) | 0.084 |
| Carotenoid | 0.98 (0.95–1.02) | 0.387 | 1.02 (0.98–1.06) | 0.371 | 1.01 (0.97–1.05) | 0.749 |
| Selenium | 1.02 (0.98–1.07) | 0.284 | 1.06 (1.01–1.11) | 0.022 | 1.07 (1.02–1.12) | 0.008 |
| Zinc | 0.98 (0.93–1.03) | 0.366 | 0.97 (0.93–1.02) | 0.279 | 0.98 (0.93–1.02) | 0.321 |
Model 1: no covariates were adjusted
Model 2: adjusted for age, gender, and race
Model 3: adjusted for age, gender, race, marital status, poverty ratio, education level, drinking status, smoking status, and physical activity
Abbreviations: OR odds ratio, 95% CI 95% confidence interval, MAFLD Metabolic dysfunction-associated fatty liver disease, CDAI composite dietary antioxidant index
The multivariate logistic regression analysis was used to construct a multivariate model and estimate the OR and 95% CI as well as p value
In addition, the subgroup analysis by gender, age, race/ethnicity, drinking status, smoking habits, and physical activity levels further studied the correlations between six antioxidant components of CDAI and MAFLD. Our data showed that vitamin A intake was significantly associated with MAFLD in male, low physical activity, and moderate physical activity subgroups (p < 0.05), meanwhile vitamin A was associated with MAFLD cross all age-subgroups (p < 0.05) (Table S2). Vitamin C was significantly associated with MAFLD whatever the gender, age, drinking status, as well as physical activity levels (p < 0.05, Table S2). Moreover, vitamin E was significantly associated with MAFLD in 19 < age ≤ 39 years, ≥ 60 years, non-hispanic white, other hispanic, never using alcohol, and high physical activity subgroups (p < 0.05, Table S2). Our results suggested that the importance of the daily intake of vitamin A, C and E in various populations.
Discussion
Dietary antioxidants played protective roles in many diseases. In this study, we found a significant negative association between CDAI and MAFLD among adult Americans. This relationship remained significant even after rigorous adjustments for confounding variables, implying that a higher CDAI served as a protective factor against the development of MAFLD. It had been reported that the main pathogenesis of MAFLD was oxidative stress and inflammation [9]. Oxidative stress disturbed the normal function of hepatocytes, leading to the production and accumulation of reactive oxygen species (ROS), which subsequently triggered the inflammatory and fibrotic pathways that drive MAFLD progression [23, 24]. Moreover, our results found that the average triglycerides, OGTT, HbA1c, and plasma fasting glucose were all significantly elevated in MAFLD compared to those in non-MAFLD, indicating an elevated risk of diabetes associated with MAFLD. Notably, excessive ROS generation damaged hepatocytes, contributing to the onset of Type 2 Diabetes (T2D) by disrupting pancreatic β-cell homeostasis and enhancing insulin resistance [25]. Therefore, antioxidant therapy was an effective strategy for the treatment of MAFLD [26].
Past research had provided evidence that dietary antioxidants, through their bioactive molecules, could exert antioxidant effects, mediate the integration process, and regulate gene expression under conditions of oxidative stress, thereby mitigating oxidative stress levels [27]. The CDAI, which encompassed various dietary antioxidants such as carotenoids, zinc, selenium, and vitamins A, C, and E, served as a comprehensive score reflecting an individual’s antioxidant status [17]. An investigation demonstrated that consuming a diet abundant in antioxidants significantly reduced mortality risk in the general US population [18]. Additionally, increasing the intake of dietary antioxidants had shown to be protective against numerous diseases, including Type 2 Diabetes Mellitus (T2DM) [28]. Therefore, increasing the intake of dietary antioxidants might be an effective measure to prevent individuals from developing MAFLD, as confirmed by our findings. Furthermore, factors influencing MAFLD included dietary habits, smoking status, alcohol consumption, and physical activity [29], and the role of dietary intervention in the management of MAFLD was crucial [30]. Our analysis revealed that individuals in the highest CDAI quartile (Q4) tended to be younger, male, non-smokers, and engage in moderate physical activity, indicating that particular attention would be given to encouraging moderate physical exercise and maintaining a healthy, smoke-free lifestyle, as a means of potentially mitigating MAFLD risk.
To delve deeper into the individual contributions of the six antioxidants encompassed within the CDAI, we constructed models to assess their correlations with MAFLD and discovered that vitamin C and vitamin E exhibited significant associations with this condition. Vitamin C, a pivotal circulating antioxidant, had been documented to possess potent anti-inflammatory properties [31], playing a crucial role in cancer prevention strategies [32, 33]. Some studies had shown that serum levels of vitamin C were negatively associated with MAFLD [34], and an increased intake of dietary vitamin C was beneficial to improve glucose metabolism and liver function [35]. Concurrently, vitamin E, an essential nutrient in human physiology, exerted its antioxidant effects [36], conferring health benefits primarily through mitigating oxidative stress and exhibiting anti-inflammatory activities [37, 38]. Notably, vitamin E exerted beneficial impacts on NAFLD through diverse mechanisms, including the optimization of lipid and glucose metabolism [39]. Collectively, these findings underscored the importance of optimizing dietary habits and lifestyle, with a particular focus on enhancing the CDAI, particularly through the consumption of vitamin C and vitamin E, as a potentially effective strategy for preventing MAFLD.
Conclusion
This cross-sectional investigation based on comprehensive data spanning three cycles (2013–2020) from the NHANES database uncovered a significant association between elevated CDAI scores and a decreased risk of MAFLD. This study provided a new reference for exploring dietary interventions that affect MAFLD to reduce its incidence.
Supplementary Information
Supplementary Material 1: Table S1. Association of CDAI scores and MAFLD in subgroups.
Supplementary Material 2: Table S2. Association of six antioxidant components and MAFLD in subgroups.
Acknowledgements
All authors thank the National Center for Health Statistics of the Centers for Disease Control and Prevention for providing the National Health and Nutrition Examination Survey data.
Authors’ contributions
Jia-xin Dong: Conceptualization, Methodology, Software, Validation, Formal analysis, Writing - Original Draft. Li-li Jiang, Yan-peng Liu: Data Curation, Visualization. Ai-xi Zheng: Writing - Review & Editing, Project administration.
Funding
Not applicable.
Data availability
No datasets were generated or analysed during the current study.
Declarations
Ethical approval and consent to participate
The ethical review of this study was exempted because the database was accessible to the public.
Consent for publication
Not applicable.
Competing interests
The authors declare no competing interests.
Footnotes
Publisher’s Note
Springer Nature remains neutral with regard to jurisdictional claims in published maps and institutional affiliations.
References
- 1.Eslam M, Newsome PN, Sarin SK, Anstee QM, Targher G, Romero-Gomez M, et al. A new definition for metabolic dysfunction-associated fatty liver disease: an international expert consensus statement. J Hepatol. 2020;73(1):202–9. 10.1016/j.jhep.2020.03.039. [DOI] [PubMed] [Google Scholar]
- 2.Eslam M, Sanyal AJ, George J, Panel International Consensus. MAFLD: a consensus-driven proposed nomenclature for metabolic associated fatty liver disease. Gastroenterology. 2020;158(7):1999–20141. 10.1053/j.gastro.2019.11.312. [DOI] [PubMed] [Google Scholar]
- 3.Chan KE, Koh TJL, Tang ASP, Quek J, Yong JN, Tay P, et al. Global prevalence and clinical characteristics of metabolic-associated fatty liver disease: a meta-analysis and systematic review of 10 739 607 individuals. J Clin Endocrinol Metab. 2022;107(9):2691–700. 10.1210/clinem/dgac321. [DOI] [PubMed] [Google Scholar]
- 4.Liu J, Ayada I, Zhang X, Wang L, Li Y, Wen T, et al. Estimating global prevalence of metabolic dysfunction-associated fatty liver disease in overweight or obese adults. Clin Gastroenterol Hepatol. 2022;20(3):e573–82. 10.1016/j.cgh.2021.02.030. [DOI] [PubMed] [Google Scholar]
- 5.Badmus OO, Hinds TD Jr, Stec DE. Mechanisms linking Metabolic-Associated Fatty Liver Disease (MAFLD) to cardiovascular disease. Curr Hypertens Rep. 2023;25(8):151–62. 10.1007/s11906-023-01242-8. [DOI] [PMC free article] [PubMed] [Google Scholar]
- 6.Ng CH, Huang DQ, Nguyen MH. Nonalcoholic fatty liver disease versus metabolic-associated fatty liver disease: prevalence, outcomes and implications of a change in name. Clin Mol Hepatol. 2022;28(4):790–801. 10.3350/cmh.2022.0070. [DOI] [PMC free article] [PubMed] [Google Scholar]
- 7.Semmler G, Wernly S, Bachmayer S, Leitner I, Wernly B, Egger M, et al. Metabolic Dysfunction-Associated Fatty Liver Disease (MAFLD)-rather a bystander than a driver of mortality. J Clin Endocrinol Metab. 2021;106(9):2670–7. 10.1210/clinem/dgab339. [DOI] [PubMed] [Google Scholar]
- 8.Clare K, Dillon JF. Brennan pn reactive oxygen species and oxidative stress in the pathogenesis of MAFLD. J Clin Transl Hepatol. 2022;10(5):939–46. 10.14218/JCTH.2022.00067. [DOI] [PMC free article] [PubMed] [Google Scholar]
- 9.Seidita A, Cusimano A, Giuliano A, Meli M, Carroccio A, Soresi M, et al. Oxidative stress as a target for non-pharmacological intervention in MAFLD: could there be a role for EVOO? Antioxidants (Basel). 2024:13(6). 10.3390/antiox13060731. [DOI] [PMC free article] [PubMed]
- 10.Tian T, Zhang J, Xie W, Ni Y, Fang X, Liu M, et al. Dietary quality and relationships with Metabolic Dysfunction-Associated Fatty Liver Disease (MAFLD) among United States adults, results from NHANES 2017–2018. Nutrients. 2022;14(21). 10.3390/nu14214505. [DOI] [PMC free article] [PubMed]
- 11.Rong L, Zou J, Ran W, Qi X, Chen Y, Cui H, et al. Advancements in the treatment of non-alcoholic fatty liver disease (NAFLD). Front Endocrinol (Lausanne). 2022;13:1087260. 10.3389/fendo.2022.1087260. [DOI] [PMC free article] [PubMed] [Google Scholar]
- 12.Daneshzad E, Keshavarz SA, Qorbani M, Larijani B, Azadbakht L. Dietary total antioxidant capacity and its association with sleep, stress, anxiety, and depression score: A cross-sectional study among diabetic women. Clin Nutr ESPEN. 2020;37:187–94. 10.1016/j.clnesp.2020.03.002. [DOI] [PubMed] [Google Scholar]
- 13.Wu D, Wang H, Wang W, Qing C, Zhang W, Gao X, et al. Association between composite dietary antioxidant index and handgrip strength in American adults: data from National Health and Nutrition Examination Survey (NHANES, 2011–2014). Front Nutr. 2023;10:1147869. 10.3389/fnut.2023.1147869. [DOI] [PMC free article] [PubMed] [Google Scholar]
- 14.Wright ME, Mayne ST, Stolzenberg-Solomon RZ, Li Z, Pietinen P, Taylor PR, et al. Development of a comprehensive dietary antioxidant index and application to lung cancer risk in a cohort of male smokers. Am J Epidemiol. 2004;160(1):68–76. 10.1093/aje/kwh173. [DOI] [PubMed] [Google Scholar]
- 15.Chen Y, Tang W, Li H, Lv J, Chang L, Chen S. Composite dietary antioxidant index negatively correlates with osteoporosis among middle-aged and older US populations. Am J Transl Res. 2023;15(2):1300–8. [PMC free article] [PubMed] [Google Scholar]
- 16.Zhao L, Sun Y, Cao R, Wu X, Huang T, Peng W. Non-linear association between composite dietary antioxidant index and depression. Front Public Health. 2022;10:988727. 10.3389/fpubh.2022.988727. [DOI] [PMC free article] [PubMed] [Google Scholar]
- 17.Yu YC, Paragomi P, Wang R, Jin A, Schoen RE, Sheng LT, et al. Composite dietary antioxidant index and the risk of colorectal cancer: Findings from the Singapore Chinese Health Study. Int J Cancer. 2022;150(10):1599–608. 10.1002/ijc.33925. [DOI] [PMC free article] [PubMed] [Google Scholar]
- 18.Wang L, Yi Z. Association of the Composite dietary antioxidant index with all-cause and cardiovascular mortality: a prospective cohort study. Front Cardiovasc Med. 2022;9:993930. 10.3389/fcvm.2022.993930. [DOI] [PMC free article] [PubMed] [Google Scholar]
- 19.He H, Chen X, Ding Y, Chen X, He X. Composite dietary antioxidant index associated with delayed biological aging: a population-based study. Aging (Albany NY). 2024;16(1):15–27. 10.18632/aging.205232. [DOI] [PMC free article] [PubMed] [Google Scholar]
- 20.Chen X, Lu H, Chen Y, Sang H, Tang Y, Zhao Y. Composite dietary antioxidant index was negatively associated with the prevalence of diabetes independent of cardiovascular diseases. Diabetol Metab Syndr. 2023;15(1):183. 10.1186/s13098-023-01150-6. [DOI] [PMC free article] [PubMed] [Google Scholar]
- 21.Wu M, Si J, Liu Y, Kang L, Xu B. Association between composite dietary antioxidant index and hypertension: insights from NHANES. Clin Exp Hypertens. 2023;45(1):2233712. 10.1080/10641963.2023.2233712. [DOI] [PubMed] [Google Scholar]
- 22.Gu X, Wang X, Wang S, Shen Y, Lu L. Composite Dietary Antioxidant Index is inversely associated with visceral adipose tissue area among U.S. adults: a cross-sectional study. Nutr Res. 2024;124:13–20. 10.1016/j.nutres.2024.01.011. [DOI] [PubMed] [Google Scholar]
- 23.Angelico F, Alcantara-Payawal D, Rani RA, Mustafa N, Thongtang N, Chaiteerakij R, et al. Review and expert opinion on MAFLD, oxidative stress and multifunctional management. Drugs Context. 2024;13. 10.7573/dic.2023-9-3. [DOI] [PMC free article] [PubMed]
- 24.Li S, Tan HY, Wang N, Zhang ZJ, Lao L, Wong CW, et al. The role of oxidative stress and antioxidants in liver diseases. Int J Mol Sci. 2015;16(11):26087–124. 10.3390/ijms161125942. [DOI] [PMC free article] [PubMed] [Google Scholar]
- 25.Bhatti JS, Sehrawat A, Mishra J, Sidhu IS, Navik U, Khullar N, et al. Oxidative stress in the pathophysiology of type 2 diabetes and related complications: current therapeutics strategies and future perspectives. Free Radic Biol Med. 2022;184:114–34. 10.1016/j.freeradbiomed.2022.03.019. [DOI] [PubMed] [Google Scholar]
- 26.Arroyave-Ospina JC, Wu Z, Geng Y, Moshage H. Role of oxidative stress in the pathogenesis of non-alcoholic fatty liver disease: implications for prevention and therapy. Antioxidants (Basel). 2021;10(2). 10.3390/antiox10020174. [DOI] [PMC free article] [PubMed]
- 27.De Oliveira NG, Teixeira IT, Theodoro H, Branco CS. Dietary total antioxidant capacity as a preventive factor against depression in climacteric women. Dement Neuropsychol. 2019;13(3):305–11. 10.1590/1980-57642018dn13-030007. [DOI] [PMC free article] [PubMed] [Google Scholar]
- 28.Hirose T, Fukushima M, Kikuchi H, Shinagawa Y. Effects of high temperature on cooperative phenomena observed in membrane potential of parathyroid cells. Nihon Ika Daigaku Zasshi. 1986;53(3):250–7. 10.1272/jnms1923.53.250. [DOI] [PubMed] [Google Scholar]
- 29.Pipitone RM, Ciccioli C, Infantino G, La Mantia C, Parisi S, Tulone A, et al. MAFLD: a multisystem disease. Ther Adv Endocrinol Metab. 2023;14:20420188221145548. 10.1177/20420188221145549. [DOI] [PMC free article] [PubMed] [Google Scholar]
- 30.Kurylowicz A. The role of diet in the management of MAFLD-why does a new disease require a novel, individualized approach? Hepatobiliary Surg Nutr. 2022;11(3):419–21. 10.21037/hbsn-21-562. [DOI] [PMC free article] [PubMed] [Google Scholar]
- 31.Spoelstra-de Man AM, Elbers PW, Oudemans-Van Straaten HM. Vitamin C: should we supplement? Curr Opin Crit Care. 2018;24(4):248–55. 10.1097/MCC.0000000000000510. [DOI] [PMC free article] [PubMed] [Google Scholar]
- 32.Amini L, Chekini R, Nateghi MR, Haghani H, Jamialahmadi T, Sathyapalan T, et al. The effect of combined vitamin c and vitamin e supplementation on oxidative stress markers in women with endometriosis: a randomized, triple-blind placebo-controlled clinical trial. Pain Res Manag. 2021;2021:5529741. 10.1155/2021/5529741. [DOI] [PMC free article] [PubMed] [Google Scholar]
- 33.Kazmierczak-Baranska J, Boguszewska K, Adamus-Grabicka A, Karwowski BT. Two faces of vitamin C-antioxidative and pro-oxidative agent. Nutrients. 2020;12(5) 10.3390/nu12051501. [DOI] [PMC free article] [PubMed]
- 34.Xie ZQ, Li HX, Tan WL, Yang L, Ma XW, Li WX, et al. Association of serum vitamin C with NAFLD and mafld among adults in the United States. Front Nutr. 2021;8:795391. 10.3389/fnut.2021.795391. [DOI] [PMC free article] [PubMed] [Google Scholar]
- 35.Luo X, Zhang W, He Z, Yang H, Gao J, Wu P, et al. Dietary citamin C Intake is associated with improved liver function and glucose metabolism in chinese adults. Front Nutr. 2021;8:779912. 10.3389/fnut.2021.779912. [DOI] [PMC free article] [PubMed] [Google Scholar]
- 36.Miyazawa T, Burdeos GC, Itaya M, Nakagawa K, Miyazawa T. Vitamin E: regulatory redox interactions. IUBMB Life. 2019;71(4):430–41. 10.1002/iub.2008. [DOI] [PubMed] [Google Scholar]
- 37.Xiong Z, Liu L, Jian Z, Ma Y, Li H, Jin X, et al. Vitamin E and Multiple health outcomes: an umbrella review of meta-analyses. Nutrients. 2023;15(15) 10.3390/nu15153301. [DOI] [PMC free article] [PubMed]
- 38.Zainal Z, Khaza’ai H, KuttyRadhakrishnan A, Chang SK. Therapeutic potential of palm oil vitamin E-derived tocotrienols in inflammation and chronic diseases: evidence from preclinical and clinical studies. Food Res Int. 2022;156:111175. 10.1016/j.foodres.2022.111175. [DOI] [PubMed] [Google Scholar]
- 39.He W, Xu Y, Ren X, Xiang D, Lei K, Zhang C, et al. Vitamin E ameliorates lipid metabolism in mice with nonalcoholic fatty liver disease via Nrf2/CES1 signaling pathway. Dig Dis Sci. 2019;64(11):3182–91. 10.1007/s10620-019-05657-9. [DOI] [PubMed] [Google Scholar]
Associated Data
This section collects any data citations, data availability statements, or supplementary materials included in this article.
Supplementary Materials
Supplementary Material 1: Table S1. Association of CDAI scores and MAFLD in subgroups.
Supplementary Material 2: Table S2. Association of six antioxidant components and MAFLD in subgroups.
Data Availability Statement
No datasets were generated or analysed during the current study.