Abstract
The stable isotope composition of meteoric water has been widely used to understand hydrological processes worldwide. We present a unique dataset, with the isotopic composition (δ18O and δ2H) of meteoric waters, derived from a nationwide study in Cuba. It includes monthly composite and event-based precipitations, from January 2017 to December 2021 (N = 526 and N = 111 respectively). Monthly data showed minor seasonal trends (dry vs. rainy), with a notable influence of tropical cyclones. Event-based data demonstrated that precipitation associated with tropical cyclones exhibited lower isotopic compositions. The analysis of potential factors influencing the isotopic composition of precipitation showed a minor influence of the rainfall amount, but negligible influence of factors such are relative humidity, elevation, and air temperature. This data set can be used as a tool not only to understand hydrological processes at the country scale, but also to further improve and develop isotope-enabled modelling for assessing water balances and fluxes, understanding the impact of extreme events, and paleoreconstruction in the Intra-Americas Sea.
Subject terms: Hydrology, Hydrology, Palaeoclimate, Climate and Earth system modelling, Environmental sciences
Background & Summary
Isotope hydrology uses stable and radioactive isotopes —both naturally occurring and artificially produced— as tools to characterize and understand water dynamics within the hydrological cycle. Stable isotopes are naturally incorporated in the water molecule, and their isotopic abundance varies with the occurrence of fractionation and mixing processes. Consequently, they can be used as a traceable fingerprint to investigate specific processes related to the quantity and quality of water resources1–4. These applications include assessing water balance5–9, determining aquifer recharge origin10–13, evaluating water mixing processes14–18, estimating water residence times19–21, understanding groundwater-surface water interactions22–25, identifying anthropogenic impacts26–29, and assessing the vulnerability and sanitation of water resources30–32.
Previous isotope hydrology studies conducted in Cuba have primarily focused on specific case studies related to groundwater salinization, mainly in the western region of the country33–37. However, descriptions of meteoric waters are limited in both spatial and temporal domains, due to heterogeneous sampling conditions in terms of frequency and collection methods. As a result, the local meteoric water lines (LMWLs) reported exhibit considerable discrepancies, as a result of fragmented time series and spatial limitations35.
Here, we present a novel and unique dataset, derived from a nationwide study in Cuba, aiming to characterize the isotopic composition of meteoric waters and evaluate the factors influencing its spatiotemporal variability across the island. It encompassed precipitation data from monthly composite samples (N = 526) between January 2017 and December 2021, as well as event-based samples (N = 111) from July 2019 to August 2021. The event-based samples included regular (non-cyclonic) precipitation events and those associated with two tropical cyclones (TCs) that made landfall in Cuba: tropical storm Elsa (July 2021) and hurricane Ida (August 2021).
Methods
Study area
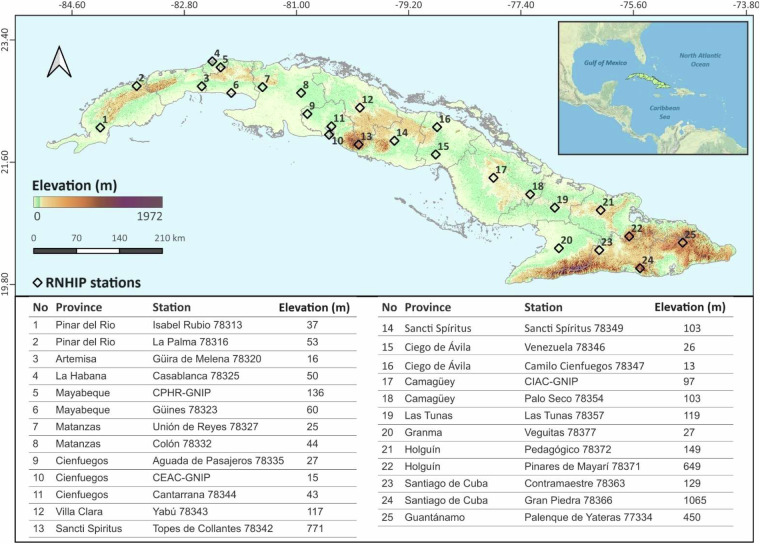
Cuba, the largest archipelago in the Insular Caribbean, is surrounded by the waters of the North Atlantic Ocean and the Caribbean Sea (Fig. 1). The climate is influenced by high solar radiation, trade winds, and high humidity from the North Atlantic Subtropical Anticyclone38. According to the Köppen-Geiger classification, the predominant climate is tropical savanna (Aw), followed by tropical monsoon (Am) and tropical rainforest (Af)39. The climate regime is represented by two main seasons: a rainy season (from May to October) and a dry season (from November to April). Prevailing winds are from the ENE throughout the year. Due to its location, Cuba is affected by both tropical and extra-tropical circulations, with the most significant changes linked to disturbances in the tropical circulation, such as easterly waves and TCs, occurring primarily between June and November40,41.
Fig. 1.
The inset shows the location of Cuba in the Insular Caribbean. Sampling stations are represented by bold-empty diamonds and numbered as described in the table, as part of the National Network for Isotope Hydrology in Precipitations (RNHIP).
Sampling
Rainfall monitoring was conducted by the National Network for Isotope Hydrology in Precipitations (RNHIP), integrated within the supporting framework of 21 stations from the Meteorological Service Network of the National Institute of Meteorology in Cuba (INSMET), and 3 stations from the National Network for Environmental Radiological Surveillance (Fig. 1). Sampling strategies included the collection of: 1) monthly composite samples (nationwide) using PALMEX RS-2 collectors42, from January 2017 to December 2021; and 2) event-based samples (in Cienfuegos) using a set of ground fixed exchangeable passive collectors to cover full event and intra-event sampling (30 min intervals), from July 2019 to August 2021. The event-based samples encompassed both non-cyclonic events and those associated with two TCs that made landfall at the southwestern coast of Cuba.
The TCs sampling covered:
Tropical storm, Elsa (TS Elsa), from the 5:30 p.m. July 4 to 4:55 p.m. July 5. Landfall in Cuba as TS at 08:00 a.m. on July 5, 2021 (UTC-4 time zone)43.
Transition from TS to category 1 hurricane, Ida (TS-H1 Ida), from 10:15 a.m. and 3:15 p.m. on August 27, 2021. Landfall in Cuba as a H1 at 2:00 p.m. UTC-4 on August 27, 2021 (UTC-4 time zone)44.
Stable isotopes
Water stable isotopes (δ18O and δ2H) were determined at three laboratories, using two main analytical techniques. The analytical contribution of each laboratory to the final dataset is divided as follows:
Laser absorption spectroscopy (LAS)
At the Isotope Hydrology Laboratory of the International Atomic Energy Agency (IAEA) in Vienna (24%) using 2140-i (Picarro, Santa Clara, CA, USA), DLT‐100 (Los Gatos Research, San Jose, CA, USA) and TIWA‐24 d (Los Gatos Research) water isotopes analyzers45.
-
At the Stable Isotope Research Group, Chemistry Department, National University of Costa Rica (47%), using two water isotope analyzers, L2120‐i (Picarro, USA) and LWIA-45-EP (Los Gatos Research, San Jose, CA, USA)46.
Isotope ratio mass spectrometry (IRMS)
At the Environmental Isotopes Laboratory of the CEAC (29%). Performed by Continuous Flow IRMS, using gas-water equilibrium method47 with the analytical configuration MultiFlow-Isoprime (Elementar Analyse Systems GmbH, Germany). Results were corrected to the VSMOW-SLAP scale using the two-point normalization method48,49. Two in-house standards LIA-CEAC 1 (δ18O: 3.31‰ ± 0.35‰; δ2H: 12.60‰ ± 1.2‰) and SNOW (δ18O: −23.78‰ ± 0.33‰, δ2H: −179.77‰ ± 0.81‰) were used for normalization purpose; and a third LIA-CEAC 2 (δ18O: −5.00‰ ± 0.22‰; δ2H: −32.92‰ ± 1.28‰), was used as a control in-house standard.
Stable isotope ratios are reported in delta notation (per mil ‰), calculated from the expression δ18O or δ2H = (Rs/Rstd - 1) * 1000. Where R is the isotope ratio 18O/16O or 2H/1H from a sample (s) or standard (std) relative to the Vienna Standard Mean Ocean Water (VSMOW) reference standard. All the values and uncertainties reported were calibrated against internationally certified reference materials VSMOW2 and SLAP250.
Deuterium excess was calculated as: d-excess = δ2H – 8 * δ18O, as described in Dansgaard, 196451. This second-order parameter was used to assess the influence of moisture recycling, transport52,53, and the occurrence of kinetic fractionation in low-humidity conditions during below-cloud evaporation54.
Metadata and supplementary variables
Metadata reported at each RNHIP station included location (latitude N and longitude W, in decimal degrees WGS84), elevation (meters above sea level, masl), distance from the coast (shortest distance in km), and sampling date/time frame (sampling period, season, start and end date). Monthly sampling included supplementary variables, such as cumulative rainfall amount (mm), air temperature (°C), relative humidity (%), and atmospheric pressure (hPa). These last three parameters were reported as monthly means based on synoptical observations every three hours at each of the stations according to the regular procedures for meteorological monitoring of the INSMET. Event-based sampling included collection time (min), rainfall amount (mm), rainfall intensity (mm/h), and rainfall classification (light, moderate, and heavy precipitation)55.
Additionally, the Sequential No. of samples by station is reported as metadata. This number represents the sequential number attributed to each entry of the primary sampling record at each station, and constitutes an evidence of the non-homogeneous representativity of the data. The missing values corresponded to samples rejected in the case of: 1) missing samples; 2) quality control of the samples before analysis (too low volume, unsealed or broken flasks, or any evidence of sample perturbation); and 3) quality control of the isotope data (evidence of strong evaporation, outliers, and replicates with significant differences unresolved by reanalysis).
Back-trajectories
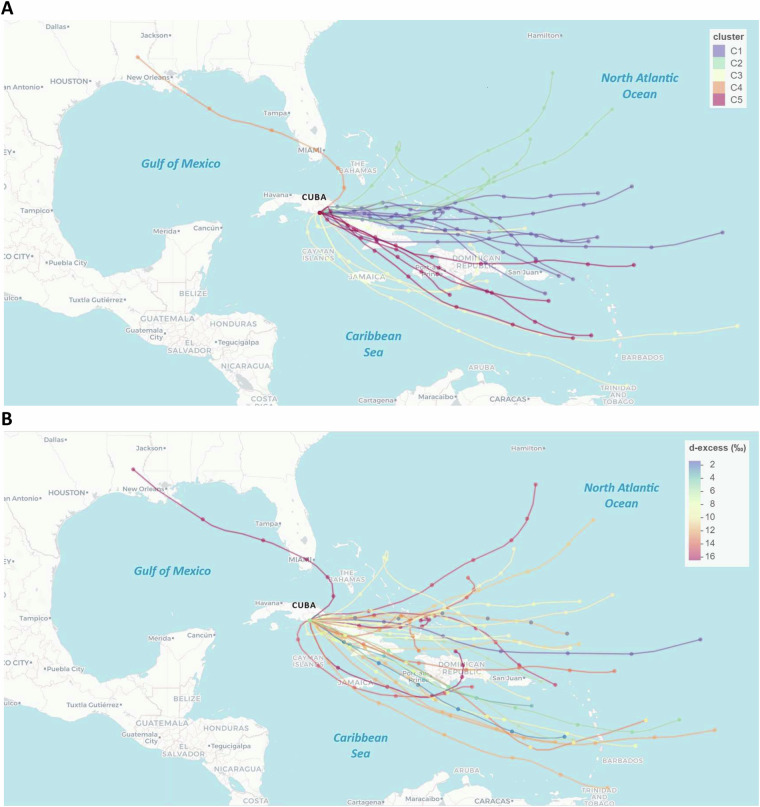
To address the moisture source origin of the event-based samples, 72 h back-trajectories (BTs) were computed using the Hybrid Single Particle Lagrangian Integrated Trajectory (HYSPLIT) model56 and the Global NOAA-NCEP/NCAR reanalysis data files57. BTs were run at 3 h intervals starting at ground levels of 50, 500, and 1000 m for each rainfall event. This information was used to determine moisture source origin and transport paths. The main BTs regions were classified as the North Atlantic Ocean (NAO), Eastern Caribbean Sea (ECS), and Continental/Gulf of Mexico (CGM). Spatial trajectory clustering estimations and maps were produced using the OpenAir R package58.
Data Records
The dataset is available at 10.6084/m9.figshare.26061526.v259 . It consists of an Excel file (.xlsx) named “IsotopeDataBaseCubaPrecip10.06.2024_v2”, containing four spreadsheets:
Spreadsheet 1. Monthly Composite Stations: corresponds to 25 inputs characterizing each “monthly composite” monitoring station from the RNHIP, incorporated in 10 columns of categorical and numerical data, including a station ID (see detailed explanation in the original dataset description, referenced above.
Spreadsheet 2. Monthly Composite Data: corresponds to 531 independent observations obtained from the monthly composite monitoring of precipitations of the RNHIP, between January 2017 and December 2021. It is structured in 16 columns covering: station identification; sampling accompanying information; isotopic composition of samples; and data source.
Spreadsheet 3. Event-Based Data: corresponds to 111 independent observations obtained from event-based monitoring at 3 stations in Cienfuegos province, between July 2019 and August 2021. It is structured in 17 columns covering: sample identification; detailed time frame of the sampling, sampling accompanying information; isotopic composition of samples; and data source.
Spreadsheet 4. Calculations: contains basic calculations for specific parameters that can be used for the hydrological interpretation and further usage of the dataset in specific contexts or case studies.
Technical Validation
Isotopic composition of monthly precipitations in Cuba
Monthly results are based on the regular monitoring carried out by the RNHIP (Fig. 1), within a period of 4 years from January 2017 to December 2021. This dataset (Spreadsheet 1), presents 526 results of dual isotopes δ18O and δ2H from monthly composite samples of meteoric waters in Cuba, representing 63% of the total samples collected during the period (840 samples). δ18O results ranged between −9.59‰ and 2.03‰, with an arithmetic mean of −2.42‰ (±1.89‰), and a volume-weighted mean of −3.24‰. δ2H results ranged between −64.42‰ and 18.00‰, with an arithmetic mean of −8.32‰ (±14.64‰), and a volume-weighted mean of −14.89‰. The d-excess, varied between 0.57‰ and 23.38‰, with an arithmetic mean of 11.07‰ (±4.07‰). Rainfall amount ranged from 0.07 mm to 737.89 mm, with an average value of 121.80 mm (±110.06 mm).Other variables were also monitored and included in the dataset (air temperature, atmospheric pressure, and relative humidity).
Local Meteoric Water Lines (LMWLs) resulting from this dataset were calculated form all the monthly data (N = 526) using two different regression methods: 1) Ordinary Least Square Regression (OLSR)60; and 2) Precipitation Amount Weighted Least Squares Regression (PWLSR)61. These lines are based on rainfall isotopic data obtained at different physical-geographical conditions in the country (location, orography, climate, and vapor source origin of precipitations), covering a 4-year study period (2017 to 2021) (Fig. 2). Descriptive statistics for regression lines can be found in Table 1.
Fig. 2.
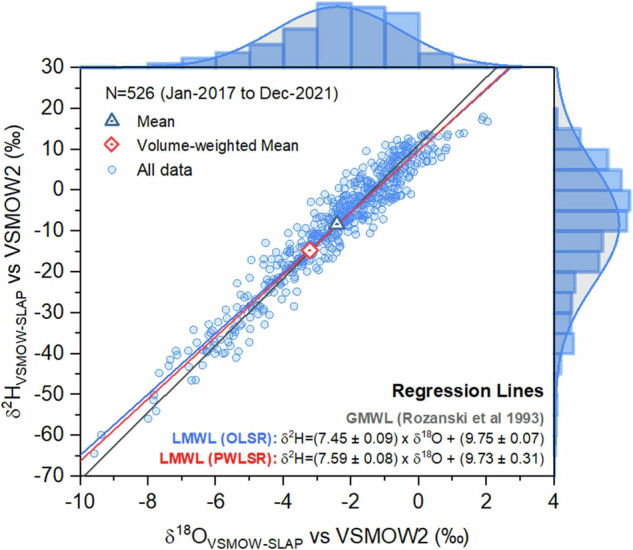
Dual isotope plot of meteoric waters in Cuba (input data from January 2017 to December 2021, N = 526). Blue and red lines denote the calculated LMWL using the OLSR60 and PWLSR61 methods, respectively. The blue and red empty symbols denote the arithmetic and volume-weighted mean values.
Table 1.
Summary of descriptive statisticians on regressions lines calculated for the isotopic composition of meteoric waters in Cuba.
| LMWL (n = 526) | a ± σa | b ± σb | r2 | SEE | Δa |
|---|---|---|---|---|---|
| OLSR | 7.45 ± 0.09 | 9.75 ± 0.07 | 0.93 | 3.94 | 0.14 |
| PWLSR | 7.59 ± 0.08 | 9.73 ± 0.32 | 0.94 | 3.77 |
OLSR: ordinary least square regression.
PWLSR: precipitation-weighed least square regression.
a: slope (y = a * x + b).
b: intercept (y = a * x + b).
r2: coefficient of determination.
SEE: standard error associated to the estimation.
Δa: difference between the slopes (Δa = aPWLSR − aOLSR).
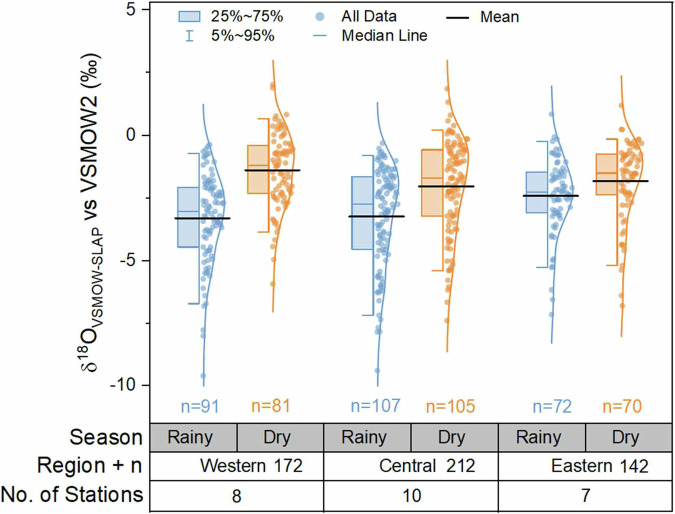
Spatial and temporal variations can be assessed by regions and seasonality (rainy and dry seasons). As classified in the dataset, the regional grouping used a physical-geographic regionalization based on the political-administrative limits between provinces: 1) Western region, from Pinar del Río to Matanzas, 2) Central region from Cienfuegos to Camagüey, 3) Eastern region from Las Tunas to Guantánamo. Regional and seasonal grouping of δ18O values are presented in Fig. 3 for statistical intercomparison purpose among groups
Fig. 3.
Box plots of δ18O compositions for monthly composite samples, grouped by regions and seasonality (blue = rainy and orange = dry). Input data from January 2017 to December 2021, N = 526.
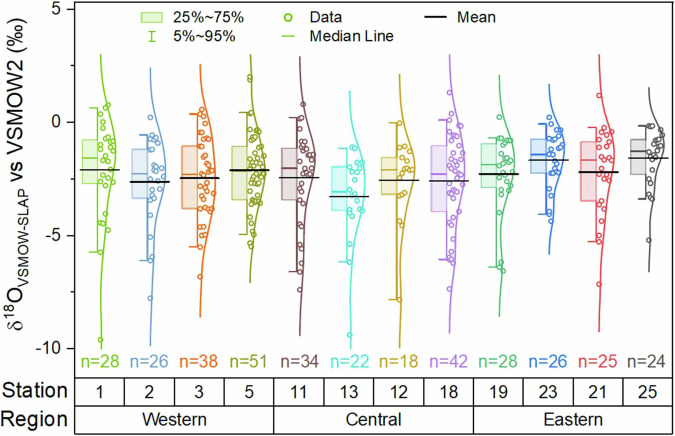
Figure 4 presents a spatial variability analysis across 12 stations, representing the main regions. Physical-geographical representativeness of the data was also considered, including different elevations at each region, and distance from the coastline. The minimum temporal representativity for stations selected to include in this analysis was at least 2 years of data. Overall, no spatial trends or notable differences were observed among stations, exhibiting an homogeneous distribution of the mean isotopic composition of precipitation across the island. Notably, more variability was observed towards the central-western regions. Further statistical analysis are needed to test homoscedasticity among groups.
Fig. 4.
Box plots showing the spatial δ18O (‰) variability in monthly composite samples, grouped by stations (input data from January 2017 to December 2021, n = 362), and regions (Western: 1–5; Central: 11–18; Eastern: 1–25).
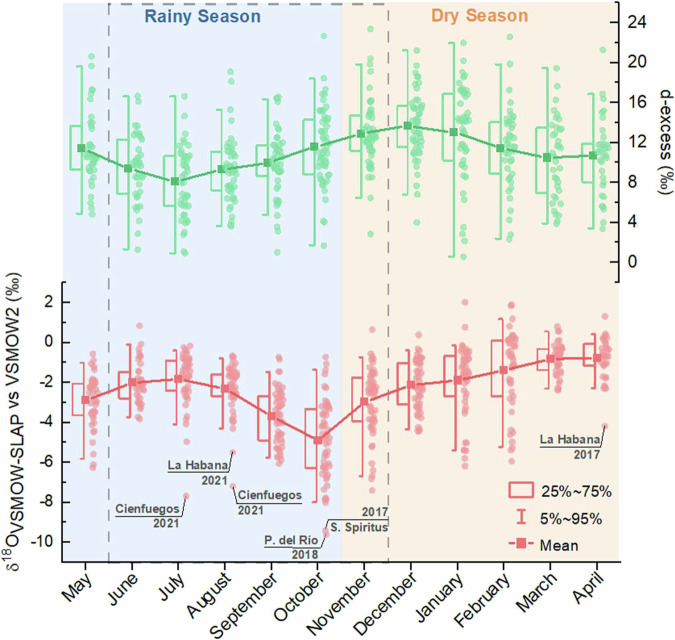
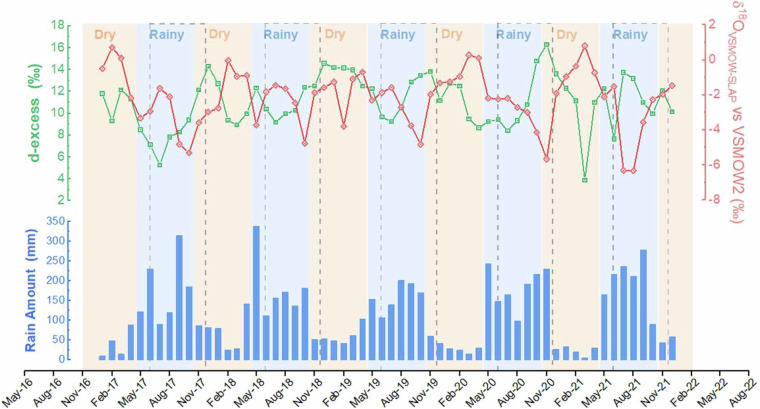
Temporal variations are presented as integrated monthly plots and time series sequence for the monitoring period (Figs. 5, 6, respectively). Both plots showed temporal trends between the dry (November to April) and rainy (May to October) seasons. Notably, during the rainy season, particularly lower δ18O values were observed on specific samples from July, August, and October. These samples align with the LMWLs calculated from the dataset and do not exhibit high d-excess values. The location and sampling period corresponding to each of this data revealed a clear association with the landfall of TCs, such as tropical storms Nate and Philippe (October 201762,63), hurricane Michael (October 201864), tropical storm Elsa (July 202143), and hurricane Ida (August 202144).
Fig. 5.
Monthly isotopic composition of meteoric waters in Cuba (δ18O and d-excess). The dashed grey lines enclose the TCs season between June and November37. Extreme depleted values are identified by date and location. Input data from January 2017 to December 2021, N = 526.
Fig. 6.
Mean isotopic composition of meteoric waters in Cuba (δ18O and d-excess), shown as the monthly mean time sequence for the period studied (input data from January 2017 to December 2021, N = 526). Dashed grey line square represents the time frame defined as the TCs season in the Insular Caribbean38.
Isotopic composition of event-based precipitations in Cuba
The event-based monitoring was carried out between July 2019 and August 2021, encompassing non-cyclonic rainfall and those associated with the occurrence of TCs. These samples were collected as a full event (n = 43) and intra-event 30-minute time intervals (n = 68). From BTs (Fig. 7), three main groups were defined according to their moisture source origin, 51% originating in the NAO and 49% from the ECS. Only one trajectory was associated with the CGM origin.
Fig. 7.
Air mass back-trajectories clusters for event-based samples. (A) detailed clustering by moisture source origin (a simplified grouping was considered for the dataset analysis: CGM, NAO, and ECS, see the section for Methods); (B) d-excess distribution for the computed back-trajectories.
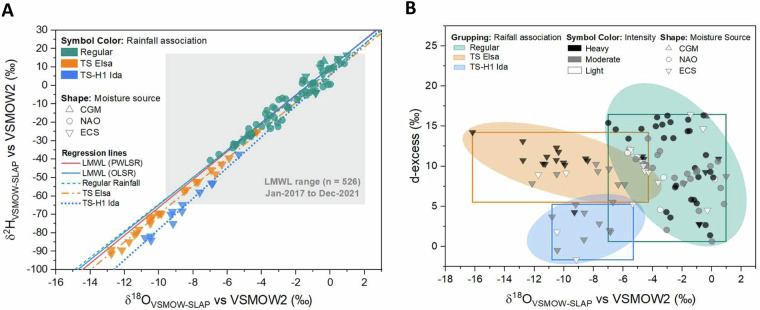
Rainfall amounts in full events ranged from 0.95 mm and 121.59 mm (rainfall intensity between 0.76 mm/h and 127.98 mm/h). The isotopic composition exhibited a wide variation compared to the range of values obtained for monthly composite samples, see Fig. 8A. δ18O ranged from −12.78‰ to 0.97‰, (with a mean value −3.58‰ ± 2.94‰), and δ2H in a range between −89.15‰ and 16.5‰ (with a mean value −18.93‰ ± 22.93‰). The d-excess was in a range between 1.4‰ and 16.46‰ (with a mean value of 9.74‰ ± 4.03‰).
Fig. 8.
Isotopic composition of meteoric waters from event-based samples from regular rainfall, and TCs. (A) Dual isotope plot (δ18O vs. δ2H) showing the nationwide LMWLs, and corresponding OLSR lines for regular rainfall (green), and TCs (orange and blue). The grey shaded area denotes the typically dual isotope space ranges for monthly composite samples. (B) δ18O vs. d-excess plot for event-based data (showing data range as square and distribution grouping as ellipses). Samples are coloured and shape-coded by rainfall intensity and moisture source origin, respectively. TS = tropical storm; H1 = category 1 hurricane; CGM, NAO, and ECS: see the Methods section for details.
Intra-event monitoring revealed rainfall amount and intensity ranging between 0.53 mm and 37.66 mm, and 1.10 mm/h and 150.63 mm/h, respectively. The isotopic composition exhibited the broader range observed in the dataset, compared to both full event and monthly composite samples. δ18O ranged between −16.18‰ and 0.82‰, (with a mean value of −5.47‰ ± 4.22‰), and δ2H ranged from −115.23‰ to 14.64‰ (with a mean value of −34.98‰ ± 34.43‰). The d-excess ranged from −1.65‰ and 16.35‰ (with a mean value of 8.81‰ ± 4.29‰).
Figure 8A illustrates how the isotopic composition of the rainfall associated with TCs was more depleted compared to monthly composite samples. The slope differences for both TC events, with respect to the country LMWL, are presented in Table 2 as Δa61. A notable grouping of the values was observed, highlighted as coloured squares (isotopic range) and ellipses (data grouping) in Fig. 8B. These groups are evident based on d-excess values. Nevertheless, no significant relationship was found between sample grouping and other variables (e.g. moisture source origin, rainfall amount, and rainfall intensity). In such a case, further analysis should be conducted, considering microphysical conditions during the formation and precipitation of raindrops, and the meteorological evolution of these phenomena.
Table 2.
Summary of descriptive statisticians on regressions lines calculated for the isotopic composition of meteoric waters event-based monitoring, and their difference with respect to the LMWL presented for Cuba.
| Regression lines | a ± σa | b ± σb | r2 | SEE | n | Δa |
|---|---|---|---|---|---|---|
| OLSR Regular Events | 7.25 ± 0.21 | 8.06 ± 0.18 | 0.94 | 3.75 | 75 | 0.20 |
| OLSR TS Elsa | 7.57 ± 0.12 | 5.82 ± 0.79 | 0.99 | 1.49 | 24 | −0.11 |
| OLSR TS-H1 Ida | 8.36 ± 0.40 | 5.62 ± 1.59 | 0.98 | 2.20 | 12 | −0.91 |
| PWLSR Regular Events | 6.35 ± 0.27 | 6.21 ± 0.80 | 0.88 | 4.26 | 75 | 1.24 |
| PWLSR TS Elsa | 7.50 ± 0.12 | 5.86 ± 1.32 | 0.99 | 1.08 | 24 | 0.10 |
| PWLSR TS-H1 Ida | 7.78 ± 0.49 | 2.19 ± 4.36 | 0.96 | 1.68 | 12 | −0.19 |
OLSR: ordinary least square regression.
PWLSR: precipitation-weighed least square regression.
a: slope (y = a * x + b).
b: intercept (y = a * x + b).
r2: coefficient of determination.
SEE: standard error associated to the estimation.
Δa: difference of slopes with respect to the LMWL (i.e. Δa = aOLSR LMWL − aOLSR Regular Events).
Key drivers controlling the isotopic composition of meteoric waters in Cuba
The assessment of the potential parameters modulating the isotopic composition of Cuban meteoric waters is a necessary analysis to understand temporal and spatial variations within the island. As reported in previous studies, the most common correlations in tropical regions and small islands, are: 1) amount effect65,66, 2) altitude effect51,67,68, 3) synoptic or seasonality effects65,69,70, 4) moisture source origin46,71,72, 4) rainfall type (Convective vs. Stratiform)54,73,74, and 5) tropical cyclones excursion72,75,76.
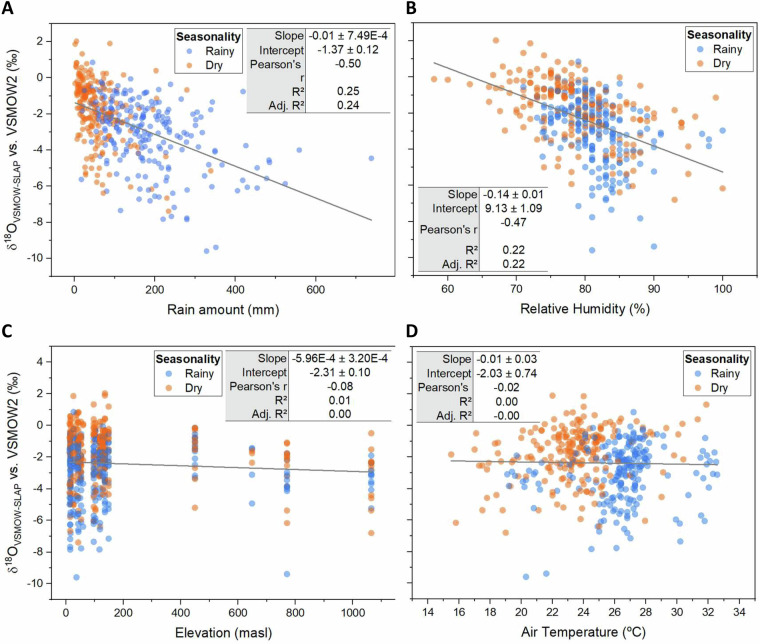
In general terms, all the parameters considered in this dataset showed a relatively weak correlation with the monthly δ18O compositions, see Fig. 9. While the so-called “amount effect” is described as the typical controlling factor for tropical islands51,65, in this study, rainfall amount explains only 25% of the variability observed (Fig. 9A). Similar results were obtained for relative humidity (22%, Fig. 9B), and no influence was observed from other potential effects or drivers such as altitude and temperature (Fig. 9C,D, respectively). This apparent lack of influence on air temperature was expected, considering the study area’s latitudinal location and the relatively homogeneous temperature gradient compared to extratropical latitudes. Nevertheless, seasonality variations should be further investigated, as they appear to significantly affect the variability of the isotopic composition of the meteoric waters in Cuba, as well as the occurrence of heavy rainfalls such as those associated to TCs.
Fig. 9.
Linear regressions of the δ18O compositions in monthly composite samples vs. potential controlling effects: (A) Rainfall amount; (B) Relative Humidity; (C) Elevation above sea level; and (D) Air temperature at the sampling station level.
Usage Notes
To facilitate the use of this dataset, a detailed description of the structure and calculations are available online at figshare59.
This unique dataset includes monthly composite, full event, and intra-event isotopic compositions of meteoric waters from Cuba. Previous data in this region has been scarce, truncated, limited, or non-existent at such a spatial scale. The dataset is particularly useful for improving our understanding of regional atmospheric processes, extreme rainfall events, and terrestrial water partitioning. Other specific potential uses can be described as:
Isoscape mapping
Isotope-enable modeling
Isotope-enabled forecasting
Paleoclimate reconstruction
Acknowledgements
The authors acknowledge the institutional support and technical contribution of the personnel from each of the monitoring networks from the INSMET, and the National Network for Environmental Radiological Surveillance, which facilitated the regular rainfall monitoring. Technical support from Stefan Terzer-Wassmuth and GNIP at the IAEA Isotope Hydrology Section is also recognized. IAEA Technical Cooperation Program and the Coordinated Research Project F31006 “Isotope variability of rain for assessing climate change impacts” were also fundamental for completing this study. The corresponding author recognizes the crucial financial support from the ICTP-IAEA Sandwich Training Educational Program (STEP) as part of his PhD program.
Author contributions
A. Garcia-Moya: conceptualization; methodology; investigation; data curation; formal analysis; visualization; writing – original drat preparation; project administration. C.M. Alonso-Hernández: conceptualization; methodology; investigation; formal analysis; writing – review & editing; project administration; resources. R. Sánchez-Murillo: conceptualization; methodology; investigation; writing – review & editing. Y. Morera-Gómez: conceptualization; methodology; investigation; visualization; writing – review & editing. M. Sánchez-Llull: conceptualization; visualization; investigation; writing – review & editing. O. Diaz Rizo: investigation; writing – review & editing. Osvaldo Cuesta Santos: conceptualization; writing – review & editing. Rosemery López Lee: methodology; data acquisition; writing – review & editing. Osvaldo Brígido Flores: conceptualization; methodology; data acquisition; investigation; writing – review & editing. Enma Odalys Ramos Viltre: conceptualization; methodology; data acquisition; investigation; writing – review & editing. L. Ortega: conceptualization; investigation; formal analysis; writing – review & editing; project administration; resources; funding acquisition.
Code availability
The present study did not used custom code in the generation or processing of datasets. The code used for generating BTs and clustering is referred in the corresponding section for Methods.
Competing interests
The authors declare no competing interests.
Footnotes
Publisher’s note Springer Nature remains neutral with regard to jurisdictional claims in published maps and institutional affiliations.
References
- 1.Gat, J. R. Isotope Hydrology: A Study of the Water Cycle. (World Scientific, 2010).
- 2.Gat, J. R., Mook, W. G. & Meijer, H. A. J. Environmental isotopes in the hydrological cycle - principles and applications. International Hydrological Programme (IHP-V. Technical Documents in Hydrology (2000).
- 3.Vreča, P. & Kern, Z. Use of Water Isotopes in Hydrological Processes. Water12, 2227 (2020). [Google Scholar]
- 4.Jasechko, S. Global Isotope Hydrogeology―Review. Reviews of Geophysics57, 835–965 (2019). [Google Scholar]
- 5.Gibson, J. J. & Edwards, T. W. D. Regional water balance trends and evaporation-transpiration partitioning from a stable isotope survey of lakes in northern Canada. Global Biogeochemical Cycles16, 10-1–10–14 (2002). [Google Scholar]
- 6.Watson, A. et al. Advancing isotope-enabled hydrological modelling for ungauged calibration of data-scarce humid tropical catchments. Hydrological Processes38, e15065 (2024). [Google Scholar]
- 7.Gibson, J. J. et al. Isotopic constraints on water balance and evapotranspiration partitioning in gauged watersheds across Canada. Journal of Hydrology: Regional Studies37, 100878 (2021). [Google Scholar]
- 8.Xiao, X., Zhang, C., He, X. & Zhang, X. Simulating the water δ18O of a small open lake in the East Asian monsoon region based on hydrologic and isotope mass-balance models. Journal of Hydrology612, 128223 (2022). [Google Scholar]
- 9.Bowen, G. J., Kennedy, C. D., Liu, Z. & Stalker, J. Water balance model for mean annual hydrogen and oxygen isotope distributions in surface waters of the contiguous United States. Journal of Geophysical Research116 (2011).
- 10.Li, M., Xie, Y., Dong, Y., Wang, L. & Zhang, Z. Review: Recent progress on groundwater recharge research in arid and semiarid areas of China. Hydrogeol J32, 9–30 (2024). [Google Scholar]
- 11.Ren, X., Li, P., He, X. & Zhang, Q. Tracing the sources and evaporation fate of surface water and groundwater using stable isotopes of hydrogen and oxygen. Science of The Total Environment931, 172708 (2024). [DOI] [PubMed] [Google Scholar]
- 12.Prada, S., Cruz, J. V. & Figueira, C. Using stable isotopes to characterize groundwater recharge sources in the volcanic island of Madeira, Portugal. Journal of Hydrology536, 409–425 (2016). [Google Scholar]
- 13.Liu, Y. & Yamanaka, T. Tracing groundwater recharge sources in a mountain–plain transitional area using stable isotopes and hydrochemistry. Journal of Hydrology464–465, 116–126 (2012). [Google Scholar]
- 14.Bouaissa, M., Gharibi, E., Ghalit, M., Taupin, J. D. & El Khattabi, J. Identifying the origin of groundwater salinization in the Bokoya massif (central Rif, northern Morocco) using hydrogeochemical and isotopic tools. Groundwater for Sustainable Development14, 100646 (2021). [Google Scholar]
- 15.Currell, M. J., Dahlhaus, P. & Ii, H. Stable isotopes as indicators of water and salinity sources in a southeast Australian coastal wetland: identifying relict marine water, and implications for future change. Hydrogeol J23, 235–248 (2015). [Google Scholar]
- 16.Carreira, P. M., Marques, J. M. & Nunes, D. Source of groundwater salinity in coastline aquifers based on environmental isotopes (Portugal): Natural vs. human interference. A review and reinterpretation. Applied Geochemistry41, 163–175 (2014). [Google Scholar]
- 17.Huang, P. et al. Limestone water mixing process and hydrogen and oxygen stable isotope fractionation response under mining action. Environmental Research255, 119208 (2024). [DOI] [PubMed] [Google Scholar]
- 18.Chen, H. et al. Seasonal and spatial variations of water recharging in the Yangtze River using hydrogen and oxygen stable isotopes. Journal of Hydrology639, 131563 (2024). [Google Scholar]
- 19.Brooks, J. R. et al. Stable isotope estimates of evaporation: inflow and water residence time for lakes across the United States as a tool for national lake water quality assessments. Limnology and Oceanography59, 2150–2165 (2014). [Google Scholar]
- 20.Zhou, J. et al. Using stable isotopes as tracer to investigate hydrological condition and estimate water residence time in a plain region, Chengdu, China. Sci Rep11, 2812 (2021). [DOI] [PMC free article] [PubMed] [Google Scholar]
- 21.Gimeno, L. et al. The residence time of water vapour in the atmosphere. Nat Rev Earth Environ2, 558–569 (2021). [Google Scholar]
- 22.Petermann, E. et al. Determination of groundwater discharge rates and water residence time of groundwater-fed lakes by stable isotopes of water (18O, 2H) and radon (222Rn) mass balances. Hydrological Processes32, 805–816 (2018). [Google Scholar]
- 23.García-Santos, S. et al. Water stable isotopes reveal a complex rainfall to groundwater connectivity in central Honduras. Science of The Total Environment844, 156941 (2022). [DOI] [PubMed] [Google Scholar]
- 24.Ortega, L. et al. Unravelling groundwater and surface water sources in the Esteros del Iberá Wetland Area: An isotopic approach. Science of The Total Environment846, 157475 (2022). [DOI] [PubMed] [Google Scholar]
- 25.Eastoe, C. J., Hutchison, W. R., Hibbs, B. J., Hawley, J. & Hogan, J. F. Interaction of a river with an alluvial basin aquifer: Stable isotopes, salinity and water budgets. Journal of Hydrology395, 67–78 (2010). [Google Scholar]
- 26.Bowen, G. J., Cerling, T. E. & Ehleringer, J. R. Stable Isotopes and Human Water Resources: Signals of Change. in Terrestrial Ecology vol. 1 283–300 (Elsevier, 2007).
- 27.Strauch, G. et al. Indicators for assessing anthropogenic impact on urban surface and groundwater. J Soils Sediments8, 23–33 (2008). [Google Scholar]
- 28.Li, X. et al. Anthropogenic Effects on Hydrogen and Oxygen Isotopes of River Water in Cities. International Journal of Environmental Research and Public Health16, 4429 (2019). [DOI] [PMC free article] [PubMed] [Google Scholar]
- 29.Li, C. et al. Seasonal variability of stable isotopes in the Changjiang (Yangtze) river water and its implications for natural climate and anthropogenic impacts. Environ Sci Eur32, 84 (2020). [Google Scholar]
- 30.Ehleringer, J. R., Barnette, J. E., Jameel, Y., Tipple, B. J. & Bowen, G. J. Urban water – a new frontier in isotope hydrology. Isotopes in Environmental and Health Studies52, 477–486 (2016). [DOI] [PubMed] [Google Scholar]
- 31.Kuhlemann, L.-M., Tetzlaff, D. & Soulsby, C. Urban water systems under climate stress: An isotopic perspective from Berlin, Germany. Hydrological Processes34, 3758–3776 (2020). [Google Scholar]
- 32.Shakya, B. M. et al. Tap Water Quality Degradation in an Intermittent Water Supply Area. Water Air Soil Pollut233, 81 (2022). [Google Scholar]
- 33.Arellano, D. M., Feitoo, R., Seiler, K. P., Stichler, W. & Rauert, W. Isotopic Study of the Southern Plain in the Pinar Del Rio Province, Cuba. 229–243, http://inis.iaea.org/search/search.aspx?orig_q=RN:21031097 (1989).
- 34.González Báez, A. E., Seiler, K. P., Stichler, W. & Rauert, W. Estudio Mediante Isótopos Ambientales Del Origen de Las Aguas Subterráneas y de La Intrusión Salina En La Parte Central de La Cuenca Sur de Matanzas, Cuba. 245–258, http://inis.iaea.org/search/search.aspx?orig_q=RN:21031097 (1989).
- 35.Boschetti, T., González-Hernández, P., Hernández-Díaz, R., Naclerio, G. & Celico, F. Seawater intrusion in the Guanahacabibes Peninsula (Pinar del Rio Province, western Cuba): effects on karst development and water isotope composition. Environ Earth Sci73, 5703–5719 (2015). [Google Scholar]
- 36.Molerio-León, L. Miembros geoquímicos terminales y de transición de las aguas cársicas de Cuba (III). Composición e interpretación isotópica de las aguas de lluvia. Gota a gota 70–82 (2020).
- 37.Peralta Vital, J. L. et al. Hidrología isotópica, herramienta nuclear para la gestión sostenible del recurso hídrico. Ingeniería Hidráulica y Ambiental36, 57–72 (2015). [Google Scholar]
- 38.Fernández–Alvarez, J. C., Sorí, R., Pérez–Alarcón, A., Nieto, R. & Gimeno, L. The Role of Tropical Cyclones on the Total Precipitation in Cuba during the Hurricane Season from 1980 to 2016. Atmosphere11, 1156 (2020). [Google Scholar]
- 39.Koppen climate classification | Definition, System, & Map | Britannica. https://www.britannica.com/science/Koppen-climate-classification.
- 40.Barja, B. et al. Atmospheric particulate matter levels, chemical composition and optical absorbing properties in Camaguey, Cuba. Environ. Sci.-Process Impacts15, 440–453 (2013). [DOI] [PubMed] [Google Scholar]
- 41.Taylor, M. A. & Alfaro, E. J. Central America and the Caribbean, Climate of. in Encyclopedia of World Climatology (ed. Oliver, J. E.) 183–189 10.1007/1-4020-3266-8_37 (Springer Netherlands, Dordrecht, 2005).
- 42.Gröning, M. et al. A simple rain collector preventing water re-evaporation dedicated for d18O and d2H analysis of cumulative precipitation samples. Journal of Hydrology448–449, 195–200 (2012). [Google Scholar]
- 43.Cangialosi, J. P., Delgado, S. & Berg, R. HURRICANE ELSA (AL052021). https://www.nhc.noaa.gov/data/tcr/AL052021_Elsa.pdf (2022).
- 44.Beven, J. L. II, Hagen, A. & Berg, R. HURRICANE IDA (AL092021). https://www.nhc.noaa.gov/data/tcr/AL092021_Ida.pdf (2022).
- 45.Wassenaar, L. I. et al. Seeking excellence: An evaluation of 235 international laboratories conducting water isotope analyses by isotope-ratio and laser-absorption spectrometry. Rapid Communications in Mass Spectrometry32, 393–406 (2018). [DOI] [PubMed] [Google Scholar]
- 46.Esquivel-Hernández, G. et al. Moisture transport and seasonal variations in the stable isotopic composition of rainfall in Central American and Andean Páramo during El Niño conditions (2015–2016). Hydrological Processes33, 1802–1817 (2019). [Google Scholar]
- 47.Horita, J. Hydrogen isotope analysis of natural waters using an H2-water equilibration method: A special implication to brines. Chemical Geology: Isotope Geoscience section72, 89–94 (1988). [Google Scholar]
- 48.Nelson, S. T. A simple, practical methodology for routine VSMOW/SLAP normalization of water samples analyzed by continuous flow methods. Rapid Communications in Mass Spectrometry14, 1044–1046 (2000). [DOI] [PubMed] [Google Scholar]
- 49.Paul, D., Skrzypek, G. & Fórizs, I. Normalization of measured stable isotopic compositions to isotope reference scales – a review. Rapid Communications in Mass Spectrometry21, 3006–3014 (2007). [DOI] [PubMed] [Google Scholar]
- 50.IAEA Reference Materials. https://analytical-reference-materials.iaea.org/ (2024).
- 51.Dansgaard, W. Stable isotopes in precipitation. Tellus16, 436–468 (1964). [Google Scholar]
- 52.Froehlich, K., Gibson, J. J. & Aggarwal, P. K. Deuterium Excess in Precipitation and Its Climatological Significance. 54–66, http://inis.iaea.org/search/search.aspx?orig_q=RN:34017972 (2002).
- 53.Jouzel, J. et al. Water isotopes as tools to document oceanic sources of precipitation. Water Resources Research49, 7469–7486 (2013). [Google Scholar]
- 54.dos Santos, V. et al. Isotopic composition of convective rainfall in the inland tropics of Brazil. Atmospheric Chemistry and Physics24, 6663–6680 (2024). [Google Scholar]
- 55.Environment and Climate Change Canada. MANOBS. Manual of Surface Weather Observation Standards. (2021).
- 56.Stein, A. F. et al. NOAA’s HYSPLIT Atmospheric Transport and Dispersion Modeling System. Bulletin of the American Meteorological Society96, 2059–2077 (2015). [Google Scholar]
- 57.Draxler, R. R. & Rolph, G. D. HYSPLIT (HYbrid Single-Particle Lagrangian Integrated Trajectory) Model Access via NOAA ARL READY Websitehttp://www.Arl.Noaa.Gov/HYSPLIT.Php (2015).
- 58.Carslaw, D. C. & Ropkins, K. openair — An R package for air quality data analysis. Environmental Modelling & Software27–28, 52–61 (2012). [Google Scholar]
- 59.Garcia-Moya, A. et al. RNHIP data set on the isotopic composition of meteoric waters in Cuba ‘IsotopeDataBaseCubaPrecip10.06.2024’. figshare10.6084/m9.figshare.26061526.v2 (2024).
- 60.IAEA. Statistical Treatment of Data on Environmental Isotopes in Precipitation. Statistical Treatment of Data on Environmental Isotopes in Precipitation 1 https://www.iaea.org/publications/1435/statistical-treatment-of-data-on-environmental-isotopes-in-precipitation (1992).
- 61.Hughes, C. E. & Crawford, J. A new precipitation weighted method for determining the meteoric water line for hydrological applications demostrated using Australian and global GNIP data 10.1016/j.jhydrol.2012.07.029 (2012).
- 62.Beven, J. L. II & Berg, R. HURRICANE NATE (AL162017). https://www.nhc.noaa.gov/data/tcr/AL092021_Ida.pdf (2018).
- 63.Brown, D. P. HURRICANE PHILIPPE (AL182017). https://www.nhc.noaa.gov/data/tcr/AL092021_Ida.pdf (2018).
- 64.Beven, J. L. II, Berg, R. & Hagen, A. HURRICANE MICHAEL (AL142018). https://www.nhc.noaa.gov/data/tcr/AL092021_Ida.pdf (2019).
- 65.Rozanski, K., Araguás-Araguás, L. & Gonfiantini, R. Isotopic patterns in modern global precipitation. Washington DC American Geophysical Union Geophysical Monograph Series78, 1–36 (1993). [Google Scholar]
- 66.Sánchez-Murillo, R. et al. Spatial and Temporal Variation of Stable Isotopes in Precipitation across Costa Rica: An Analysis of Historic GNIP Records. Open Journal of Modern Hydrology3, 226–240 (2013). [Google Scholar]
- 67.Sánchez-Murillo, R. et al. Key drivers controlling stable isotope variations in daily precipitation of Costa Rica: Caribbean Sea versus Eastern Pacific Ocean moisture sources. Quaternary Science Reviews131, 250–261 (2016). [Google Scholar]
- 68.Algarra, I. et al. Significant increase of global anomalous moisture uptake feeding landfalling Atmospheric Rivers. Nat Commun11, 5082 (2020). [DOI] [PMC free article] [PubMed] [Google Scholar]
- 69.Xia, Z., Welker, J. M. & Winnick, M. J. The Seasonality of Deuterium Excess in Non-Polar Precipitation. Global Biogeochemical Cycles36, e2021GB007245 (2022). [Google Scholar]
- 70.Dores, D., Glenn, C. R., Torri, G., Whittier, R. B. & Popp, B. N. Implications for groundwater recharge from stable isotopic composition of precipitation in Hawai’i during the 2017–2018 La Niña. Hydrological Processes34, 4675–4696 (2020). [Google Scholar]
- 71.Rohrmann, A. et al. Can stable isotopes ride out the storms? The role of convection for water isotopes in models, records, and paleoaltimetry studies in the central Andes. Earth and Planetary Science Letters407, 187–195 (2014). [Google Scholar]
- 72.Sánchez-Murillo, R. et al. Tracing Water Sources and Fluxes in a Dynamic Tropical Environment: From Observations to Modeling. Frontiers in Earth Science8 (2020).
- 73.Risi, C., Bony, S. & Vimeux, F. Influence of convective processes on the isotopic composition (δ18O and δD) of precipitation and water vapor in the tropics: 2. Physical interpretation of the amount effect. Journal of Geophysical Research: Atmospheres113 (2008).
- 74.Kim, H.-J., Lee, K.-O., You, C.-H., Uyeda, H. & Lee, D.-I. Microphysical characteristics of a convective precipitation system observed on July 04, 2012, over Mt. Halla in South Korea. Atmospheric Research222, 74–87 (2019). [Google Scholar]
- 75.Munksgaard, N. C. et al. Stable Isotope Anatomy of Tropical Cyclone Ita, North-Eastern Australia, April 2014. PLOS ONE10, e0119728 (2015). [DOI] [PMC free article] [PubMed] [Google Scholar]
- 76.Lawrence, J. R. et al. Stable isotopic composition of water vapor in the tropics. Journal of Geophysical Research: Atmospheres109 (2004).
Associated Data
This section collects any data citations, data availability statements, or supplementary materials included in this article.
Data Citations
- Garcia-Moya, A. et al. RNHIP data set on the isotopic composition of meteoric waters in Cuba ‘IsotopeDataBaseCubaPrecip10.06.2024’. figshare10.6084/m9.figshare.26061526.v2 (2024).
Data Availability Statement
The present study did not used custom code in the generation or processing of datasets. The code used for generating BTs and clustering is referred in the corresponding section for Methods.


