Abstract
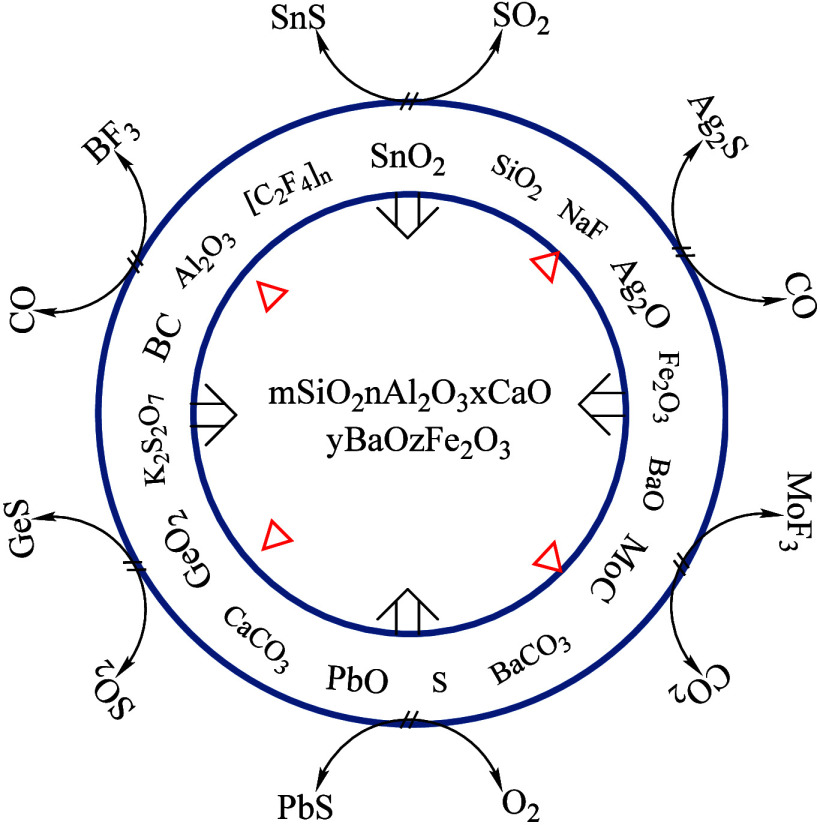
The research, which was a component of a broader initiative, focused on synthesizing a pioneering carrier buffer particularly intended for arc atomic emission spectroscopy. By analyzing various evaporation curves and quickly refining the formula of the novel carrier buffer, a more comprehensive, selective, and expedited condition was established for fractionating the target elements from the sample using the single-electrode carrier distillation method, thereby increasing the sensitivity of atomic emission spectrum analysis. Furthermore, the buffer mechanism was thoroughly investigated, using data from field emission scanning electron microscopy (SEM), X-ray powder diffraction (XRD), and energy-dispersive spectrometry (EDS). The result revealed that multiphase chemical reactions occurred within the cup-shaped electrode micrographite reactor, where the components of the carrier buffer synergistically promoted the fractionation of the measured elements. Moreover, CaCO3 and Fe2O3 had a different “catalytic” impact. Finally, it was reasonable to assume that graphite remained inert in the reaction, and the composite molten body (mSiO2·nAl2O3·xCaO·yBaO·zFe2O3) developed during the interaction between the carrier buffer and sample matrix.
Keywords: Mechanism of carrier buffer, Single electrode carrier distillation method, Atomic emission spectrum, Carrier buffer mechanism, Complex molten mass
1. Introduction
Innovative light sources, spectroscopic methods, and computer technology have opened up new avenues of investigation for atomic emission spectrometry (AES).1−5 Despite the emergence of various technologies, the classic form of AES, which employed an arc as its light source, has continued to be a focal point in domestic and international studies.6 This classic method had retained its significance in the realms of geochemical mapping and mineral resource exploration. According to ref,7 an analytical methodology for silver, boron, molybdenum, tin, and other elements in solid sample emission spectrometry was introduced by the method of single-electrode arc-powder carrier distillation. It has been shown8 that a recently synthesized novel carrier buffer might satisfy the criteria of several regional geochemical surveys and ecological geochemical evaluations. Nonetheless, a deficiency of experimental studies regarding the functioning of the carrier buffer has presented a difficulty for AES investigators.
Xing-guo You et al.9,10 investigated the direct current (DC) arc discharge mechanism, identifying processes such as evaporation, mass transfer, and analyte excitation within the light source. Because inductively coupled plasma (ICP) has replaced arc light sources to a certain extent. They believe that the key to whether DC arc light sources can make significant progress lies in whether targeted theoretical research and “modification research” can be carried out. Specifically, it includes research on the evaporation and excitation mechanism of carrier buffers, research on electrode chemical reactions during arc discharge, and research on the combined technology of DC arc sample preparation and ICP excitation. The authors also investigated the effects of carrier buffers on these reaction processes. The study found that the high-temperature chemical reactions between the carrier and rare earth elements during arc discharge in samples with a carbon powder matrix were significant reasons for the increased evaporation rate and spectral line intensity of the rare earth elements. Shou-gen Chen et al.11 investigated the fundamentals of chemical processes occurring in carbon electrodes for arc AES, with practical applications in the examination of mineral raw materials. For example, the method utilized the thermochemical reagent CdCl2+AgCl, which reacted chemically with the nonvolatile elements Nb, Ta, W, and Hf in the granite within the graphite electrode to form volatile chlorides. This reaction reduced the direct determination limit of these elements to the ppm level and yielded favorable experimental results, thereby making it possible to directly and simultaneously determine these elements in rock minerals. In the field of mechanistic study, Bin Hu et al.12,13 proposed reaction mechanisms by measuring parameters such as evaporation rates, arc temperatures, electron number densities, and ionization degrees of impurity elements in carbon powder under various fluoride conditions. In a special study, researchers utilized thermogravimetric and X-ray diffraction (XRD) analysis techniques to calculate the reaction-free enthalpy (ΔG).14 The Gibbs free energy calculation indicated that when (C2H5)4NI was used as a carrier buffer, oxides such as Cd, As, Bi, Pd, Ag, In, and Sn could form iodides, whereas MoO3 could not. Furthermore, X-ray diffraction analysis, which was employed to study the high-temperature chemical reaction of NaF as a carrier buffer, revealed that NaF chemically reacted with boron in the electrode to generate volatile fluorides. Jian-zhen Yao et al.15 measured high-content tin levels in geochemical samples, employing germanium (Ge) as the internal standard and pyrosulfate, carbon powder, alumina, and sodium fluoride as the carrier buffers, and obtained results consistent with certified values.
In their research on single-electrode carrier distillation, Jing-bo Wu et al.16 introduced a method involving preliminary halogen conversion through chemical processes. Subsequently, halogenation processes occurred within electrode cavities to improve the halogenation efficiency of analytes. Additionally, the authors considered atmospheric factors to enhance the stability of the analysis method. Zhi-hong Hao et al.17,18 established a technology for DC arc full-spectrum direct-reading AES (DC-Arc-AES) to determine trace amounts of boron, molybdenum, silver, tin, and lead in geochemical samples. The authors had reduced the effect of spectral background by using argon as the protective gas to prevent CN band formation. They pointed out that Ar arc discharge significantly improved the detection limit of elements with ionization energies higher than 8.5 eV. When compared with discharge in air, the detection limits of many elements in an argon atmosphere arc were reduced by 3 to 12 times. It was evident that the advantage of controlled argon atmosphere arc discharge lay in its ability to reduce the influence of continuous spectrum background, CN band, and other molecular spectra during sample evaporation and excitation. Numerous literature sources significantly contributed to the development of the classical AES method. Hui-zhi Li et al.19 conducted a study involving the simultaneous determination of 10 rare earth elements, using carbon powder, potassium sulfate, barium sulfate, and strontium sulfate as carrier buffers, with cerium dioxide as an internal standard element. Shu-Ying Wang et al.20 made advancements in determining trace rare earth impurity elements using a novel carrier buffer, potassium borohydride (which is an acute toxicity substance), and carbon powder, which were used in the analysis of rare earth trace elements. It was certain that they promoted the development of carrier emission spectrometry in the field of rare earth element detection. The single-electrode carrier distillation method, applied to 10 rare earth elements (La, Ce, Nd, Sm, Gd, Tb, Dy, Yb, Lu), was expanded to study the determination conditions and interference factors. The recovery rate ranged from 94% to 105%. When n = 9, the relative standard deviation (RSD) was less than 5%, and satisfactory results were obtained for the determination of samples. Bin-Ling Liu et al.21 enhanced the recovery of silver elements by introducing iron oxide into carrier buffers as a stabilizing agent. The experimental results demonstrated that, after the addition of Fe (Fe2O3) with an effective ionization potential into the spectral buffer, the recovery of Ag normalized. Xiao-feng Yu et al.22 presented an innovative research method using the E5000 new full-spectrum direct-reading arc atom emission spectrometer. The full spectrum information on the excited sample was obtained using CCD full spectrum technology, which easily facilitated background subtraction and interference correction of the spectral signal. This technology allowed for the direct acquisition of analysis results without the need for complicated preprocessing steps, such as remeasuring blackness with a traditional quartz prism spectrograph. Additionally, the combination of the internal standard method and the standard addition method further improved the analysis accuracy of complex matrix samples. Consequently, atomic emission spectroscopy, which integrated CCD detectors into its detection system, was recognized as a highly innovative technology. Yi-chuan Zhang et al.23,24 proposed that short exposure benefits volatile elements such as lead, tin, and molybdenum but not silver. In a separate study on silver spectral determination, it was proposed to use the ore sample as a standard rather than an internal standard, enabling the accurate assessment of element concentrations in the original ore sample. Feng-lian Xu et al.25 reported that liquid carrier buffers were unsuitable for analyzing rock and mineral samples with complex matrices. Shu-lan Meng et al.26,27 explored the influence of coexisting rare earth elements on the intensity of measured rare earth elements. A highly valuable research discovery was that coexisting rare earth elements impacted the intensity of the spectral lines of the measured rare earth elements. This impact varied with the content of the coexisting elements, and the same coexisting element also had different effects on the spectral line intensities of different measured elements. Wen-hua Zhang et al.28 detailed the main performance indicators of the AES-7200 instrument, method parameter settings, and prospects for the use of alternating current (AC) and DC arc direct-reading spectrometers. Guang-ming Wang et al.29 determined trace and ultratrace elements in coal ash by arc atom emission spectrometry by employing sodium chloride and ammonium fluoride as carrier buffers that had conducted orthogonal experiments. NaCl and NH4F carrier buffer enhanced the spectral line intensity of Ga, Ge, In, Ni, Bi, and Mn in coal ash, effectively reducing the analytical detection limit. The optimal ratio of NaCl and NH4F was 1:2. Additionally, they provided a detailed explanation of the role of carrier buffer. Ting Yang et al.30 used dual-electrode technology to determine trace boron, tin, silver, and other elements in water sediment samples, enhancing the precision and accuracy of analysis methods. Jiang-bin Liu et al.31 used a deep-hole electrode to rapidly detect tin in rock and mineral samples. Using K2S2O7, Al2O3, and NH4I as carrier buffer, and Ge as the internal standard, medium, low, and trace Sn elements in the ore were tested by selecting multiple wavelength spectra with different sensitivities. This approach effectively broadened the test range of the Sn element and enabled the detection of tin content from 0.001% to 10% in the ore, facilitated by the deep-hole electrode loading technique.
This project aimed to investigate carrier buffer formulations suitable for various silicate and carbonate samples based on the prior establishment of DC-Arc-AES methods for the simultaneous determination of elements such as silver, tin,32−34 molybdenum, boron, lead, and others in geochemical samples. The key research focus was directed toward analyzing the underlying mechanics of a novel carrier buffer, which helped us better understand how they modulate and control their role in arc-powder atomic emission spectroscopic analysis. Finally, the experimental studies were directed toward achieving a thorough improvement in small electrode carrier distillation technology, which presented research findings with potential applications for researchers in atomic emission spectroscopy analysis, both domestically and internationally.
2. Experimental Procedure
2.1. Instrument
The measurements in this study were conducted utilizing the WP1 plane grating spectrometer and the AES-7200 specialized atomic emission spectrometer for geological samples, both of which were developed by Beijing Rui Li Analytical Instruments Co., Ltd. These instruments have been designed for specific elemental analysis (Ag, Sn, Mo, Pb, B, and Ge) in geological exploration and mineral prospecting and function as dedicated automatic detection devices for rapidly analyzing trace and ultratrace elements. The WP1 plane grating spectrometer, which was equipped with a charge-coupled detector data acquisition system, is known for its low cost, lightweight nature, high-speed operation, and full spectral coverage. This design greatly facilitated its application to the spectrometer. These devices incorporated AC or DC arc excitation light sources with a concave grating monochromator and a photomultiplier tube receiver system, introducing an innovative optical path, structure, and appearance that was groundbreaking in China. By setting individual exposure times for each spectral line based on different element evaporation curves, researchers enabled the synchronous measurement of strong and weak characteristic spectral lines. The detection time for a single sample was lowered to 35 s, yielding rapid and sensitive quantitative spectral analysis results. Table 1 shows the basic functioning parametersof a spectrometer. A software suite that was created by the author was used to analyze the data.
Table 1. Working Parameters of the Instrument.
| Configuration
of operational parameters |
||||||
|---|---|---|---|---|---|---|
| Instrument parameters | Channels | High-voltage | Reference element | Background subtraction | Integration time(s) | |
| Ignition method | High-voltage pulse | BK1 | 4 | None | None | 30 |
| Optical path configuration | Paschen-runge | B | 4 | Ge1 | BK1 | 30 |
| Wavelength range | 200–400 nm | Ge1 | 5 | None | None | 30 |
| Concave grating | 750 mm | Pb | 5 | Ge1 | BK1 | 30 |
| Grating density | 2400 strips/mm | Ge2 | 5 | None | None | 30 |
| Dispersion rate | 0.55 nm/mm (Primary) | Mo | 6 | Ge2 | BK2 | 30 |
| Sn | 5 | Ge2 | BK2 | 30 | ||
| Ag | 6 | Ge2 | BK2 | 30 | ||
| BK2 | 4 | None | None | 30 | ||
Scanning electron microscopy (SEM) were used in these experiments, employing two distinct instrument models: the Hitachi S-4800 (manufactured by Hitachi High-Technologies Corporation, Japan) and the EV018 (manufactured by Carl Zeiss Microscopy GmbH, Germany). Energy-dispersive spectroscopy (EDS) was conducted using Oxford Energy-Dispersive Spectroscopy (Oxford EDS), a technology developed and manufactured by Oxford Instruments. XRD analysis was conducted using a Japan-Rigaku Corporation 3015 upgraded D/max-Rc X-ray powder diffractometer under specific testing conditions: Cu Kα radiation, graphite monochromator, λ = 0.15406 nm, tube voltage 40 kV, tube current 45 mA, scanning rate 2°/min, scanning range 2θ = 0°–90°.
2.2. Materials and Methods
In the current study, a meticulous selection process was undertaken to select representative national primary reference materials. GBW07103 (GSR-1) was selected as a reference material for analyzing granite rock composition, exhibiting a silica dioxide content of 72.83%. Simultaneously, GBW07108 (GSR-6) was designated for studying mudstone limestone composition, characterized by a carbonate content of approximately 70%. The collected rock fragments underwent a detailed process, including washing, drying, and size reduction using a jaw crusher to achieve dimensions smaller than 3–5 mm. Subsequent steps involved grinding and mixing with a high-alumina ceramic ball mill, sieving through a 1 mm mesh size, and drying at 120 °C for 24 h. This was followed by further grinding to achieve a particle size of over 98%, passing through a −0.074 mm sieve. GBW07407 (GSS-7) represents red soil obtained from basaltic bricks in Xuwen Town, Guangdong Province. The soil type, which was considered special, contains notable levels of iron and bound water (TFe2O3 = 18.76%, H2O+ = 13.7%). The similar processing steps, which included drying, sieving, mixing, and a subsequent 120 °C drying process for 24 h, ensured the removal of absorbed water and deactivation. After leading to further grinding with a high-alumina ceramic ball mill to achieve a particle size of over 99%, passing through a −0.074 mm sieve.
The recommended novel method for preparing carrier buffer involved an invention patent for atomic emission spectroscopy (applicant or patentee: Kunming Natural Resources Comprehensive Survey Center of China Geological Survey; Patent Number: 202211541597.1). The primary components comprised aluminum oxide, potassium peroxodisulfate, barium carbonate, barium oxide, silicon dioxide, carbon powder, sodium fluoride, sulfur powder, calcium carbonate, polyethylene tetrafluoroethylene, and iron(III) oxide in a precise ratio of 40:20:5:5:10:3:8:4:3:1:2 (including 0.007% Ge dioxide as an internal standard element), meticulously prepared in a quantity of 100 g as per the specified guidelines. The specifications for the spectral pure graphite electrode (manufactured by Shanghai New Type Graphite Material Co., Ltd., China Bao Wu Steel Group) were detailed as follows. The upper electrode manifests as a flat-headed column with dimensions of Φ3.5 mm × 8.0 mm. By contrast, the lower electrode exhibited a slender-necked cup shape with external dimensions of Φ4.2 mm × 4.2 mm × 0.6 mm and a slender neck measuring Φ3 mm × 3 mm. The bottom of the cup featured a minute hole with a diameter of 0.08 mm.
Weighed amounts of the test sample (0.1000 g) and carrier buffer (0.1000 g) were ground for 5 min in an automated agate grinder. The resulting material was then placed the cup graphite electrode. Subsequently, 1–2 drops of a 15% sucrose ethanol solution were added, and the mixture was placed in an electrically heated drying oven set to 70 °C for 1 h. Following the process given in Table 1 and selecting analytical and internal standard spectral lines from Table 2, a preliminary chemical reaction was initiated by applying a current of 4.5 A, which was increased to 16A after 3–5 s and continued for the necessary duration. The sample was analyzed using the WP1 plane grating spectrometer and the AES-7200 direct-reading emission spectrometer. A working curve was fitted and calibrated using logarithmic or cubic curve methods. Subsequently, computer software automatically calculated the content of each target element and generated experimental findings.
Table 2. Analytical and Internal Standard Spectral Lines.
| Elements | Analytical lines/standard lines (nm) | Linear range (μg·g–1) |
|---|---|---|
| Ag | 328.07/Ge303.91 | 0.03–5.0 |
| B | 249.77/Ge270.96 | 1.5–1000 |
| Sn | 288.99/Ge270.96 | 0.6–100 |
| Mo | 317.03/Ge303.91 | 0.3–100 |
| Pb | 283.31/Ge270.96 | 1–200 |
| Pb | 266.32/Ge270.96 | 200–1000 |
After the experiment, the fused material was collected from the graphite electrode. The material was sliced, mounted, polished, and carbon sprayed to prepare SEM samples. The China Geological Survey’s Chengdu Geological Survey Center and the Ministry of Natural Resources’ Kunming Mineral Resource Supervision and Testing Center both conducted SEM observations. The initial examination of the surface morphology of the fused material delineated the testing area for X-ray energy spectroscopy analysis. Representative sections were subsequently analyzed for material composition, including cross sections of vertical and horizontal cuts (including the surface). Finally, after comprehensively extracting image and material composition information, the EDS obtained elemental analysis data for the fused material. Figure 1 presented microscopic images of the fused material after the reaction, capturing overall and local characteristics.
Figure 1.
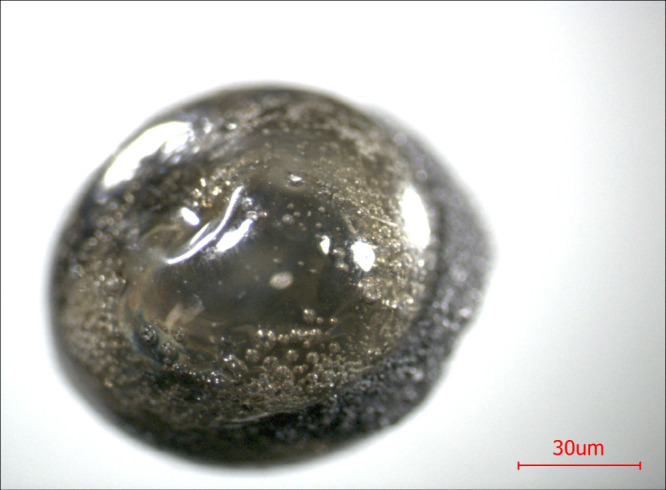
Microscopic image overall and local of a fused material after reaction.
3. Results and Discussion
3.1. Development and Analytical Methods of a Novel Carrier Buffer
This study belonged to the field of classical atomic emission spectroscopy, with a theoretical foundation that defined an optimal atomic vaporization temperature range for various target elements, namely Ag, Sn, Mo, Pb, B, and Ge. The investigation centered on critical aspects, including carrier buffers, evaporation curves, internal standard elements, Tammann temperature, chemical equilibrium, mineralization processes, halogen reactions, matrix effects, and phase transitions. By investigating these contents, we aimed to delve deeper into the intricacies of atomic emission spectroscopy and provide valuable insights into the behavior of specific elements under varying conditions.
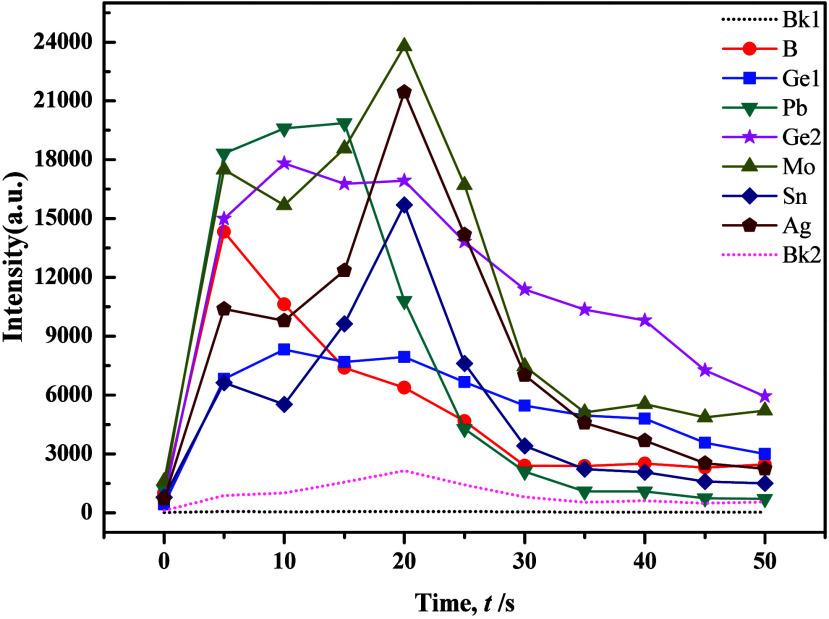
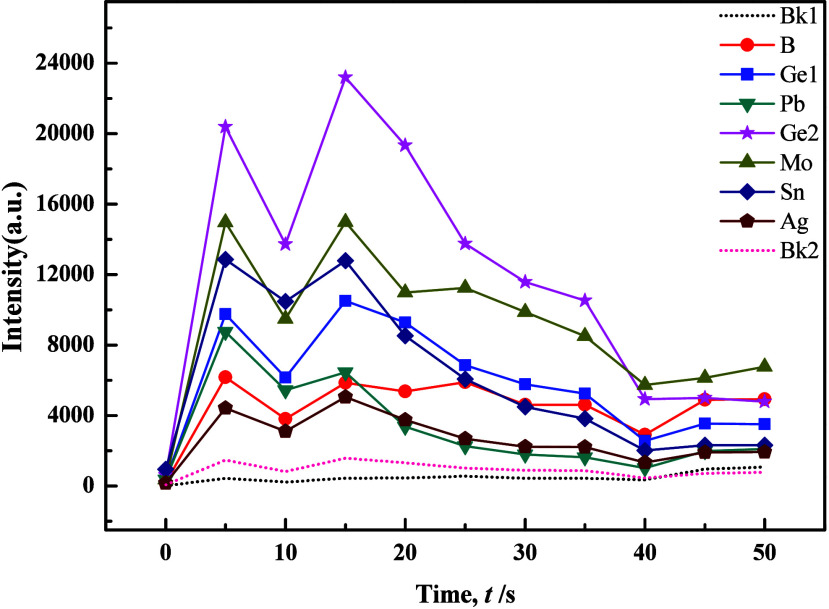
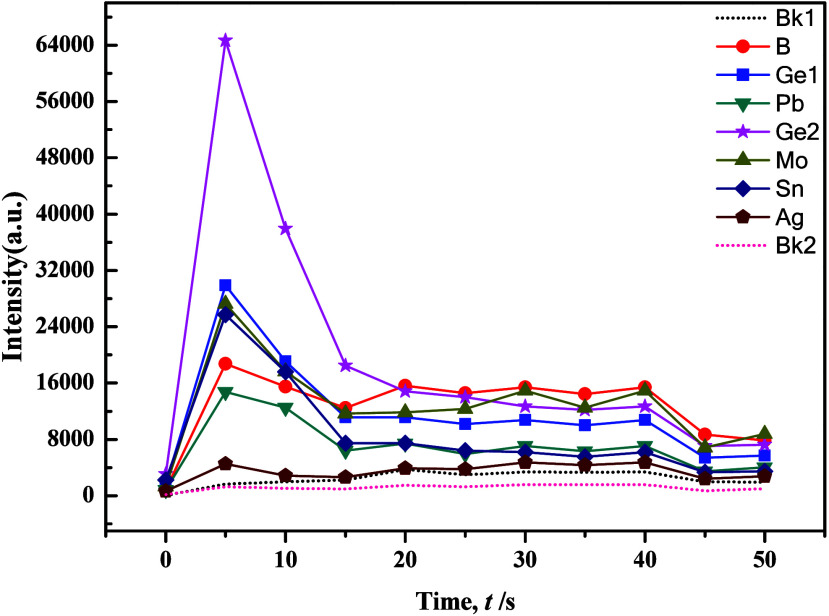
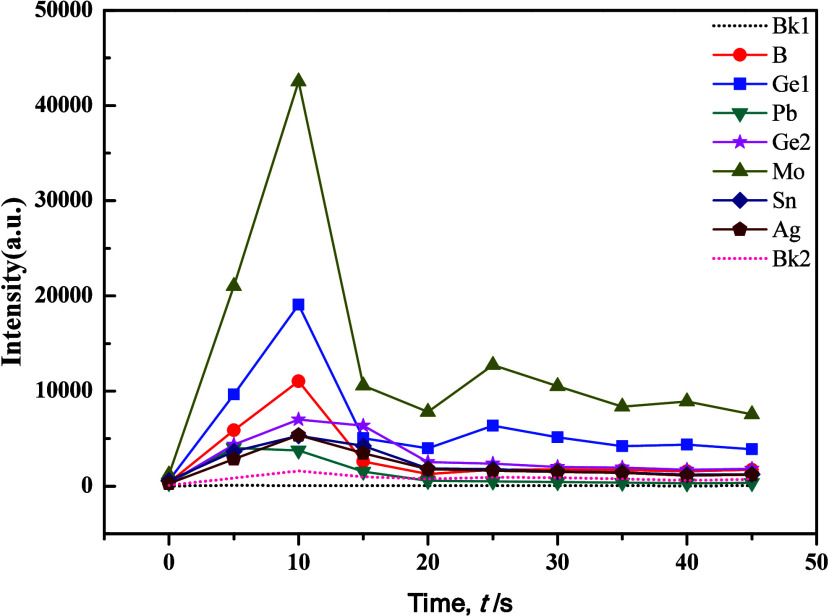
The development of an innovative carrier buffer hinged primarily on the utilization of evaporation curve graphs, which were known as combustion curves for diverse analytical elements. This tool stood as fundamental and indispensable in the realm of atomic emission spectroscopy analysis. Through a meticulous examination of these evaporation curves, the composition of the carrier buffer was optimized to enhance its efficacy in elemental analysis. In the experimental phase, the preliminary composition of the carrier buffer was determined by examining data from the Langfang Institute of Physical and Chemical Exploration and referring to existing literature formulations. The determined composition included Al2O3 (50%), C powder (3%), K2S2O7 (15%), and NaF (25%), with the addition of S powder (4%) and Fe2O3 (3%) while maintaining the GeO2 ratio at 0.007%. As shown in Figures 2 and 3, our experimental results revealed the successful resolution of issues related to the splattering of carbonate samples following the optimization of the carrier buffer composition. This optimization resulted in improved separation of tested elements, and the evaporation behavior became more consistent, which closely resembled the evaporation curves of silicate samples. However, that the evaporation process for Mo, Sn, and Ag exhibited a distinctive double-peak pattern, where a significant tailing of the internal standard element Ge2 could be observed.
Figure 2.
Individual elements evaporation curves of the carrier buffer and GBW07706 (1:1).
Figure 3.
Individual elements evaporation curves of the carrier buffer and GBW07717 (1:1).
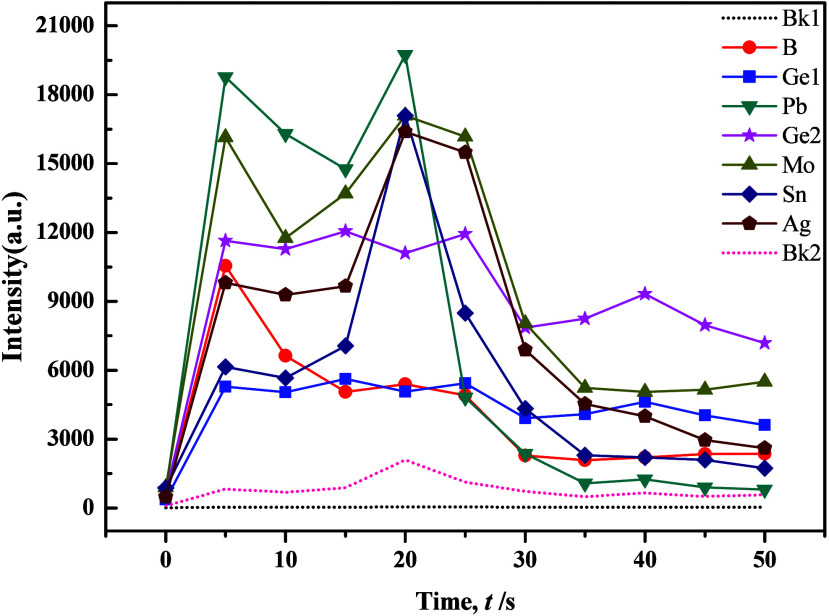
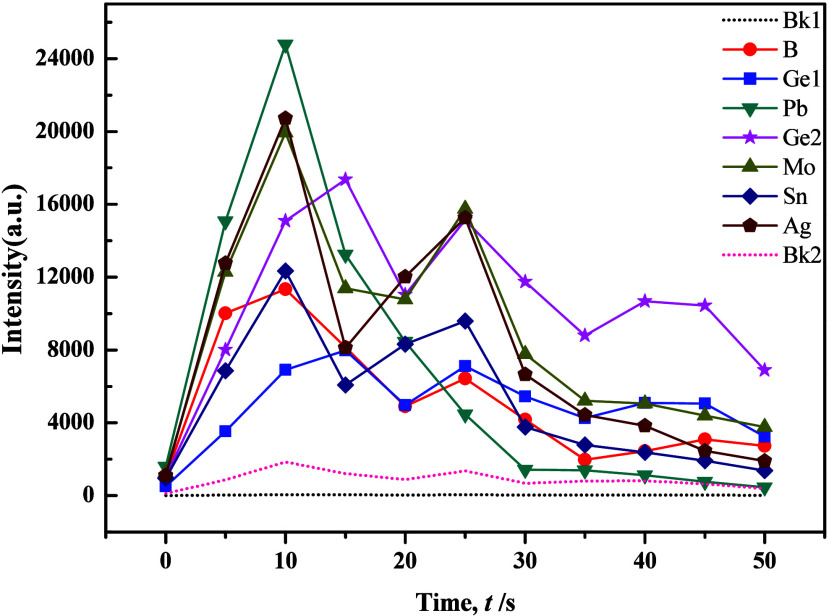
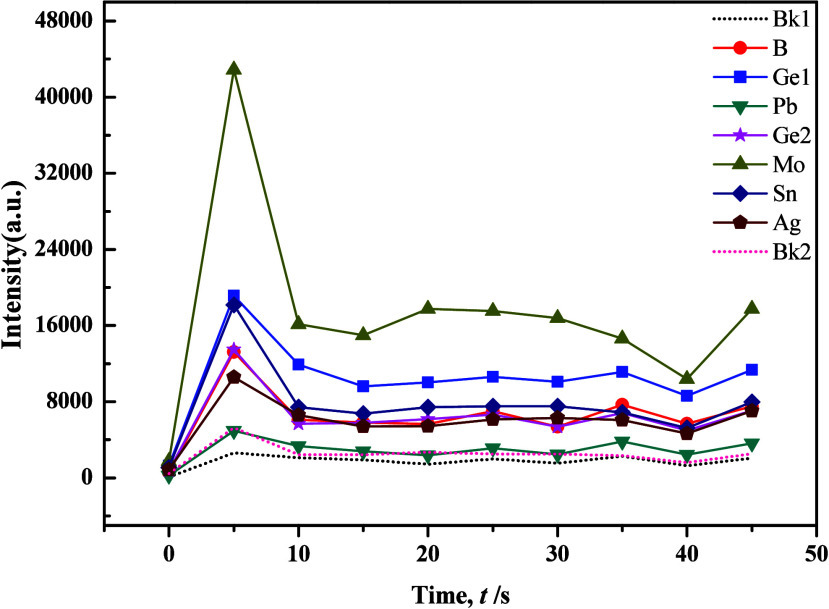
An exemplary carrier buffer exhibited stability, low-background noise, chemical inertness, ease of preparation, and versatility across multiple elements. Decker’s research results indicated that, given sufficient carrier material to control the entire arc-burning process, a proportional relationship existed between the anode temperature and the boiling point of the carrier compound.35 The buffer was critical in managing arc temperature and plasma stability, enabling precise and dependable atomic emission spectroscopy results. To prevent test sample splattering, the above-mentioned carrier buffer used potassium pyrosulfate or potassium sulfate as a fluxing agent. Additionally, ions with low ionization potentials, such as potassium, sodium, and aluminum, were employed to efficiently regulate plasma temperature. However, carrier buffers B and Mo yielded unsatisfactory experimental results due to issues such as splattering.36 Reference literature recommends addressing these concerns by increasing NaF in the carrier buffer, as shown in Figures 4 and 5. These figures illustrated distinct double peaks and tailing occurrences in the evaporation curves of various elements within the silicate matrix. Notably, the double peak and tailing phenomena of the internal standard element Ge2 showed improvement. This improvement could be attributed to the abundance of easily ionizable element Na, which lowered the arc temperature and impacted the excitation efficiency for tested elements, particularly B. The experimental results suggested that adjusting the amount of NaF and appropriately extending the low-temperature prechemical reaction process could effectively control the sample evaporation process.
Figure 4.
Evaporation curves of individual elements in the carrier buffer and GBW07717 (1:1) with the addition of 2% NaF.
Figure 5.
Evaporation curves of individual elements in the carrier buffer and GBW07717 (1:1) with the addition of 5% NaF.
Conversely, the deliberate modulation of the arc temperature had a significant impact on the evaporation and excitation processes of the studied components. Precise control over the arc temperature was instrumental in ensuring that elements with distinct optimal atomization temperatures simultaneously entered the atomized state. During the fluoride reaction, as NaF approached a molten state, its favorable “liquid” properties enhanced the surface fluidity of the molten mass. The distinctive fluorination effect was visibly demonstrated by the glassification phenomenon on the surface of the molten mass and the internal aggregation of numerous bubbles, as shown in Figure 1.
Selecting appropriate internal standard elements was crucial for enhancing the precision and accuracy of analysis, which demanded a delicate balance and optimization based on specific analysis requirements and conditions. Ge, which was a rare element, stood out as the optimal choice for an internal standard element in the analysis of Ag, B, and Sn due to its similar evaporation behavior. Examining the ionization energies of diatomic oxides of various elements, as shown in Figure 6 a and b, revealed that electrode temperature had the most profound impact on B. In the instance of Ag, which often existed as oxides in samples, high electrode temperatures led to decomposition into elemental silver with poor volatility. However, when Ag reacted with elemental sulfur to form sulfides, it significantly enhanced the evaporation efficiency of Ag and Sn, while B and Mo exhibited considerably lower efficiencies. Kuznetsova et al.37 explored the effects of CdS and Sb2S3 as carriers on the evaporation of trace elements from electrode holes, spectral line intensity and reduction of matrix effects. Reference38 used Sb2S3 as a sulfurizing agent. At a relatively low temperature (550 °C), the reagent decomposed into free sulfur that inhibited the evaporation of Fe and formed volatile WS2 with W, which significantly improved the detection limit of W (the detection limit of the method was directly related to the background subtraction corresponding to the dotted line in Figures 2–9), and its lower limit of determination reached 1 μg/g. Further more, the cautionary note was that excessive sulfur content could elevate the background, making it unsuitable for low-background working conditions. The carbonization reaction of W could improve the sensitivity of determining many impurity elements in WO3.39 The addition of carbon powder served to increase the arc temperature, but excessive use could lead to a substantial rise in matrix evaporation and a decrease in the signal-to-background ratio. In addition, in samples with carbon powder as the matrix, the high-temperature chemical reaction between the carrier and the rare earth elements in the arc discharge was an important reason for the increase in the evaporation rate and spectral line intensity of the rare earth elements.
Figure 6.

Evaporation curves of B and Mo compared with Ag and Sn in different matrix carriers.
Figure 9.
Evaporation curves of individual elements in the new carrier buffer and GBW07407 (1:1).
The WP1 planar grating spectrometer utilized an excitation current of 18A for element B analysis and 16A for element Ag and Sn analyses, suggesting the challenging nature of element B determination. Drawing insights from previous studies, we refined the composition of the carrier buffer, adjusting Al2O3 to 40%, BaO to 18%, K2S2O7 to 15%, NaF to 15%, S to 6%, Fe2O3 to 3%, −[C2F4]n– to 1%, and BaCO3 to 2% while maintaining the proportion of GeO2 at 0.007%. Experimental results showed that increasing the quantity of S powder heightened sensitivity for Mo, while it had the opposite effect for B. However, changes in other target elements were less pronounced. Notably, with a set time of 36 s, the minimum intensities of all target elements significantly decreased, accompanied by notable improvements in peak tailing. This indicated the influence of S in promoting the fractionation of target elements. To improve the distillation efficacy of the carrier buffer, successive adjustments were made by introducing SiO2 and BaCO3. Condition tests revealed a high responsiveness of the distillation and excitation processes of target elements to the quantity of BaCO3, as shown in Figures 7 and 8. Results indicated that BaCO3 primarily impacted Mo, B, and Ge, with Ge exhibiting double peaks, particularly improving in silicate samples. However, carbonate samples displayed increased tailing for Mo and Ge, with peak occurrence delayed until 25 s. While the evaporation behavior of each target element remained stable, the results exhibited considerable fluctuations, primarily due to excessive “basicity” in the overall buffering system, which caused an imbalanced acid–alkaline equilibrium that significantly lowered the temperature of the arc flame.
Figure 7.
Evaporation curves of individual elements in the carrier buffer and GBW7103 (1:1) with the addition of 2% BaCO3.
Figure 8.
Evaporation curves of individual elements in the carrier buffer and GBW7108 (1:1) with the addition of 4% BaCO3.
The development of the carrier buffer underscored the significance of incorporating S to markedly enhance the sensitivity of Ag, Sn, and Ge; however, an excess of S could diminish the intensity of B. SiO2, which was known for elevating the arc temperature, induced noticeable tailing effects. Excessive usage of SiO2 resulted in delayed peak emergence for Ag and Sn. However, when its content exceeded 15%, it significantly impacted the peak value of Ag and promoted the peak emergence and tailing of B in subsequent research involving SiO2.
Further experimentation had introduced an additional 3% S, resulting in heightened sensitivity for Ge and B, with consistent peak profiles. Consequently, the adjusted carrier buffer composition stood at Al2O3 (44%), SiO2 (14%), BaO (7%), BaCO3 (4%), K2S2O7 (16%), NaF (5%), S (5%), Fe2O3 (2%), −[C2F4]n– (1%), and CaCO3 (2%) while maintaining a proportion of GeO2 at 0.007%. As shown in Figure 9, when utilizing this carrier buffer, the plotted evaporation curves for typical silicate and carbonate samples showcased a notable enhancement in distillation efficiency. Additionally, 3% C was introduced to address occasional splattering observed in samples with bound water and high Fe content, especially during incomplete drying. This phenomenon was attributed to the high specific surface area of C, providing an effective volatile pathway for the rapid separation of bound H2O in the samples.
In conclusion, after a series of experiments and spectral analyses, the optimal formulation for the carrier buffer was determined as follows: Al2O3 (40%), SiO2 (10%), BaO (5%), BaCO3 (5%), CaCO3 (3%), K2S2O7 (20%), NaF (8%), S (4%), Fe2O3 (2%), C (3%), and −[C2F4]n– (1%) while maintaining GeO2 at 0.007%. This carrier buffer effectively controlled the excitation and evaporation processes of target elements across various sample types, resulting in improved evaporation profiles. Additionally, minor adjustments were made to the composition of the carrier buffer to meet practical production requirements, which focused on enhancing detection thresholds, precision, and accuracy in quantifying elements. Through an extensive series of analytical verification tests (detailed information is available in the Supplementary Table) on aqueous sediments, soil, and rock samples, this carrier buffer was proved instrumental in enhancing the sensitivity and accuracy of measured elements. The carrier buffer was particularly well-suited to the study of regional geochemical exploration samples, encompassing complex carbonate and silicate matrices containing iron oxide and high-bound water. The carrier buffer satisfied the diverse needs of geochemical surveys and eco-geochemical assessments in various regions.
3.2. Mechanism of the Reaction of the Carrier Buffer
The reaction mechanism of the carrier buffer in atomic emission spectroscopy was a complex procedure that required the establishment of microsized graphite reactor conditions. These conditions aimed to more comprehensively, selectively, and swiftly fractionate target elements from the sample material. The graphite electrode facilitated multiphase chemical reactions, especially halogenation reactions, sulfidation reactions, carbide reactions, and oxidation reactions.
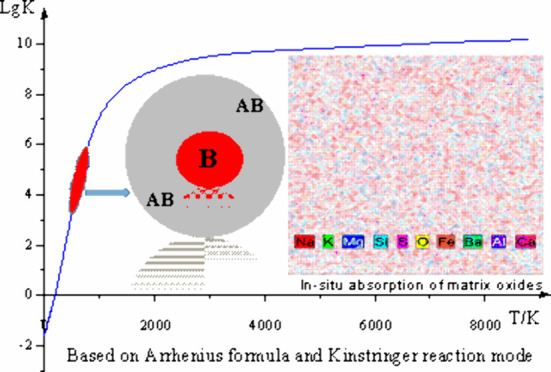
The synergistic effects of various components, coupled with adjustments in content and proportions, achieved optimal fractionation of matrix and impurity elements, which enhanced sensitivity, precision, and accuracy in atomic emission spectroscopy analysis. Throughout the reaction, the elevated electric arc temperature induced the migration of impurity elements to the surface of the crystalline structure. At phase interfaces, these impurity elements engage in chemical reactions with the carrier buffer, forming volatile compounds such as halides, sulfides, carbides, and oxides. These volatile substances then moved away from the reaction zone. The heating temperature surpassed the lattice relaxation temperature and the dissociation temperature of reagents, defined as the Tammann temperature. In fact, the starting temperature of solid-phase reactions was often lower than the melting point of the reactants or the eutectic point of the system. For silicate materials at 0.8–0.9TM (the temperature buffer corresponding to the red area marked in Figure 10), effective solid-phase reactions had to occur above the Tammann temperature. At this sintering start temperature, Al2O3, K2S2O7, and NaF controlled the solid mixture in the graphite electrode within the most suitable prechemical reaction temperature range, promoting the migration and enrichment process of each atom or ion. In the second temperature buffer (the green area marked in Figure 10), the Tammann temperature of the excitation (detection) process was controlled by the phase change process. Easily ionized ions such as K+, Na+, Ba2+, and Al3+ entered the detection zone and controlled its temperature range, making it more suitable for Ag, B, Mo, Sn, Pb, and internal standard element Ge to enter the excitation state. The matrix elements formed metastable −[Si(Al)O4]n– and −[Al(Si)OCaAl]n– sintered bodies and were retained in the melt. These sintered bodies were aggregates containing a large number of crystalline particles and pores, with many grain boundaries present. The catalytic properties of K2S2O7, with a melting point of 400 °C, and the liquid-like characteristics of SiO2 off 500 °C accelerated multiphase chemical reactions in the micrographite reactor. The decomposition of CaCO3 and BaCO3 into the intermediate product Ca3SiO5 tempered the reaction and established a “constant-temperature system” for carrier activation and buffering in the micrographite reactor. Experimental results suggested that maintaining a current of 4.5 A AC for 3–5 s was sufficient during the prereaction stage of this multiphase chemical reaction.
Figure 10.
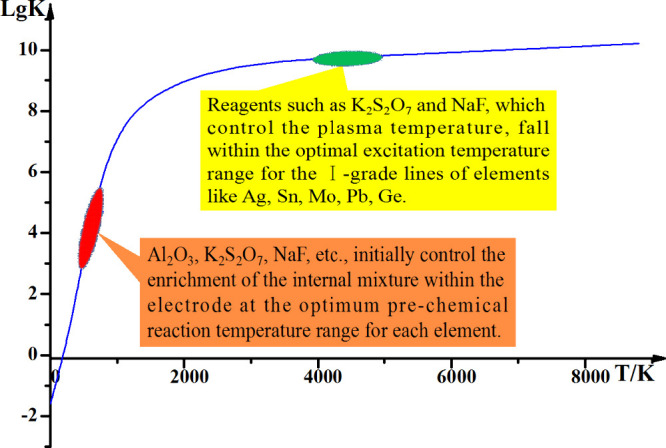
Based on the relationship between the velocity constant and temperature, it is conceivable that the prechemical and carrier distillation stages of the reaction might have occurred.
During the excitation phase, which is characterized by a rapid increase in electrode temperature, a composite salt melt was formed by fusing the sample and carrier buffer, resulting in the formation of a multicomponent fused material (mSiO2·nAl2O3·xCaO·yBaO) that exhibited lower melting points and increased stability while preserving structural integrity. As the arc continued to apply heat, the remaining target elements, alongside K+, Na+, SO2, and other high vapor-pressure compounds, underwent synergistic fractionation, thereby ensuring the comprehensive volatilization of all target elements and their subsequent entry into the plasma. Analysis of the composition of the fused material at different excitation durations (refer to Table 3) revealed trends such as decreasing Na2O, Al2O3, SiO2, and FeO, alongside increasing S and BaO. Although the distribution of other elements lacked regular patterns, which resembled the distribution in glass matrices, a hypothesis emerged, suggesting that AlF3 generated in the process might undergo decomposition beyond 90 s of excitation. This decomposition was anticipated to result in the entry of AlF3, K+, Na+, and a minor amount of Fe3+ into the high-temperature plasma.
Table 3. Analysis of a Fused Material Composition at Different Excitation Times.
| Surface composition of the fusion bead (%) | Interior
composition of the fusion bead (%) |
|||
|---|---|---|---|---|
| Composition of oxides | Excitation for 30 s | Excitation for 30 s | Excitation for 60 s | Excitation for 90 s |
| Na2O | 1.27 | 2.16 | 1.57 | 1.18 |
| MgO | 1.40 | 4.33 | 4.40 | 3.86 |
| Al2O3 | 31.7 | 34.48 | 33.97 | 33.29 |
| SiO2 | 10.65 | 16.58 | 16.2 | 15.87 |
| SO3 | 3.48 | 1.26 | 1.82 | 2.15 |
| K2O | 1.62 | 2.17 | 1.57 | 1.70 |
| CaO | 41.5 | 30.98 | 31.92 | 33.21 |
| FeO | 2.11 | 2.62 | 2.55 | 2.51 |
| BaO | 6.57 | 5.41 | 5.99 | 6.23 |
| Totals | 100.3 | 99.99 | 99.99 | 100 |
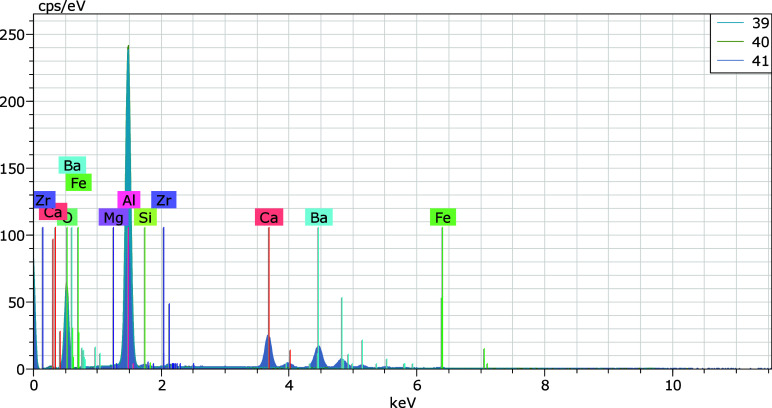
Furthermore, the backscattered electron image in Figure 11 and the energy spectrum in Figure 12 (detailed information is available in the Supplementary Table) revealed concentrated distribution phenomena of Al, Ca, and C elements within the sample. Certain regions, such as point 40 in Figure 11, were predominantly composed of Al2O3, while regions with concentrated carbon distribution were speculated to correspond to graphite.
Figure 11.
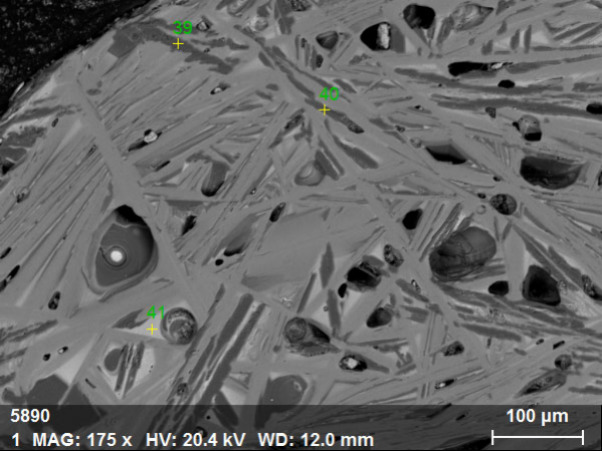
Backscattered electron image of a fused material in final carrier buffer and GBW07105 (1:1) after the reaction.
Figure 12.
EDX pattern of a fused material in final carrier buffer and GBW07105 (1:1) after reaction.
As shown in Figures 13 and 14, which depicted the meticulous analysis of the cross-sectional SEM images of the fused material postreaction, the glassy appearance of the fracture surface of the sample was unveiled. The outer rim of the fused bead showcased needle-like structures (Figure 14) and featured unevenly dispersed pores of varying sizes, suggesting that a substantial quantity of gas was liberated during the formation of the fused material, resulting in the irregular distribution of these pores. Additionally, the rapid cooling effect induced by the water-cooled electrode clamps, which expedited the solidification of the fused material within the electrode, entrapped some of the gas and formed bubbles.
Figure 13.
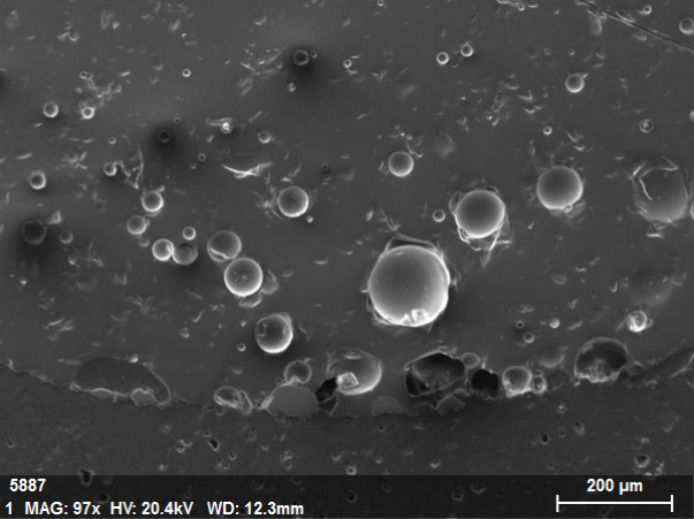
SEM images (200 μm) of a fused material in final carrier buffer and GBW07103 (1:1) after reaction.
Figure 14.
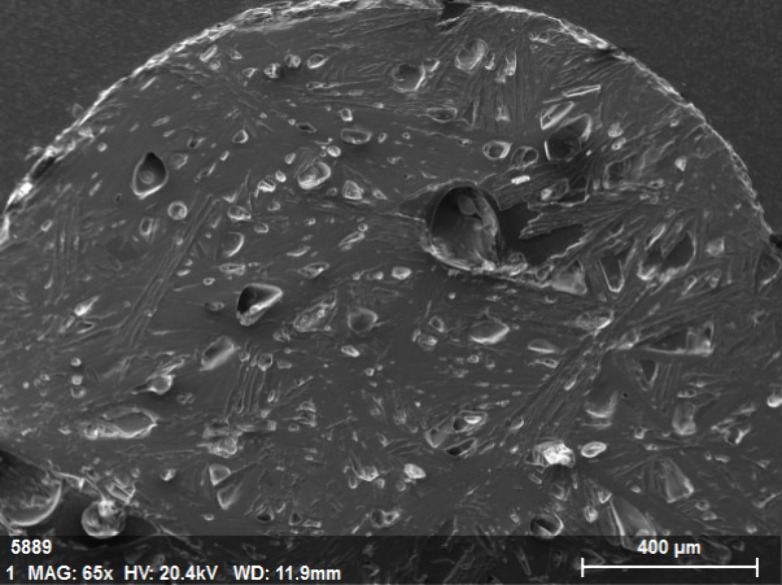
SEM images (400 μm) of a fused material in final carrier buffer and GBW07103 (1:1) after reaction.
Research findings indicated that in the absence of a carrier buffer facilitating the evaporation process of target samples, typical silicate rocks and soils tended to evaporate primarily in oxide forms, following this sequence: Sn, Pb, Ge, Ag, B, Na, K, and Mo. However, employing the aforementioned carrier buffers, in which NaF played a crucial role in curbing the carburization of B, resulting in the generation of more easily volatile BF3 for the measured element B, had a significant impact. The evaporation curves showed that the internal standard element Ge reached its peak concurrently with the measured elements Ag, B, Mo, Sn, and Pb, reducing the evaporation duration and fostering the creation of more readily volatile fluorides, sulfides, and so forth. Figure 15 illustrates the speculated synergistic multiphase chemical reactions between the carrier buffers and the measured components, which graphically demonstrated the evaporation of effective elements in the gas phase and the shrinkage of a large number of matrix elements to form a solid solution that was retained in the final residue.
Figure 15.
Mechanism of multiphase chemical reactions which is speculated to occur between the carrier buffers and the measured components.
Figure 16 presents electron microscopy scan images (A and B) of the fused material resulting from the reaction between the silicate national primary standard substance GBW07106 and the carrier buffers within the graphite electrode. Image A showcased a scanned cross-section, revealing a substantial graphite cover layer on the surface of the silicate matrix (scanning point 13). Furthermore, numerous carbon aggregates were observed. According to the surface composition analysis results in Table 4, the carbon content exceeded 90%. However, scanning points 11–12, which contained other impurities, exhibited only approximately 70% carbon content. This implied a chemical reaction process transitioning from nonexistent to existent, suggesting that the graphite in the buffers did not partake in the chemical reactions within the electrode cavity. Instead, the carbon resulting from the decomposition of polytetrafluoroethylene participated in the prechemical reaction, maintaining the reducing nature of the molten material inside the electrode. Additionally, NaF underwent fluorination, and in its molten state, [F–] could “wet” the surface of the molten material, creating a liquid–solid interface. This fluxing action enhanced the diffusion and migration rates of the analytes.
Figure 16.
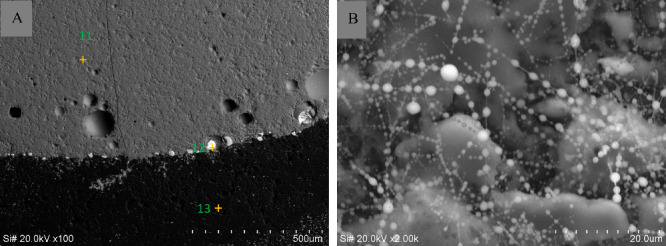
SEM images A (500 μm) and B (20 μm) of a fused material in final carrier buffer and GBW07108 (1:1) after reaction.
Table 4. Surface Composition Analysis Results of Scanning Point 13 in Figure 16A.
| Elements | Contents (%) | Calibration contents (%) | Atomic ratios |
|---|---|---|---|
| C | 96.68 | 96.68 | 97.56 |
| O | 3.18 | 3.18 | 2.41 |
| Fe | 0.14 | 0.14 | 0.03 |
| Totals | 100.00 | 100.00 | 100.00 |
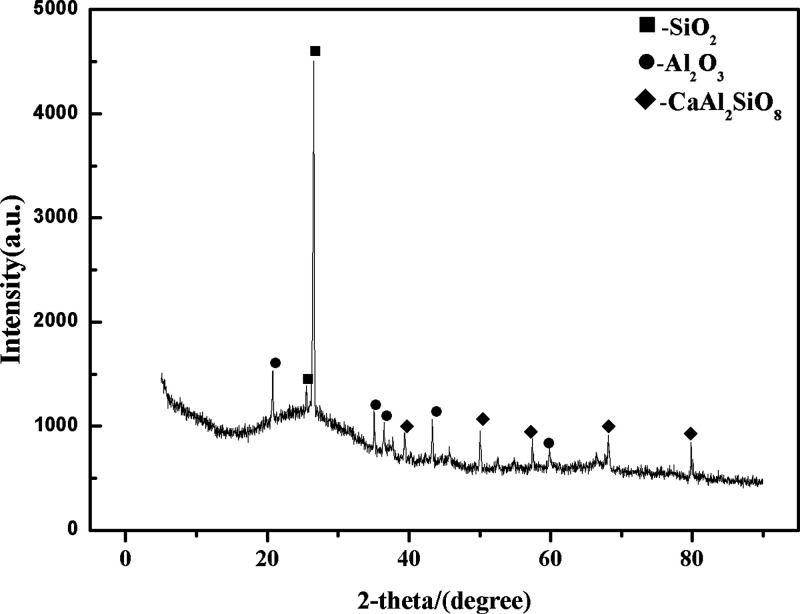
In Figure 16B, distinct regions were observed, revealing chain-like white spherical substances adhered to them, featuring smooth surfaces and lacking apparent edges or corners. This observation aligned with a concentrated distribution of Al, Ca, and Si in the sample, primarily composed of SiO2, Al2O3, CaO, and BaO, while the background area corresponded to graphite. In practical optical analysis work, X-ray diffraction and thermogravimetric analysis were commonly used to analyze the composition and structure of residues in electrode holes to infer possible chemical reactions. Nickel et al.40 employed X-ray diffraction to study the high-temperature chemical reactions when NaF was used as a carrier. The results showed that NaF chemically reacted with boron in the electrode, forming volatile fluorides. XRD analysis was conducted to further substantiate this finding, as shown in Figure 17. This analysis revealed two slightly more prominent diffraction peaks within the 25–35° range, predominantly corresponding to SiO2 and Al2O3 crystalline phases. While some regions exhibited well-defined diffraction peaks characteristic of crystalline structures, others showed dispersed, less symmetrical, and less defined peaks, resembling those typical of amorphous materials. This observation suggested that the glassy molten material comprised many bubble-like amorphous substances (mSiO2·nAl2O3·xCaO·yBaO). The collective experiments above demonstrated that, following the carrier distillation reaction, a substantial portion of matrix elements that were retained in the silicate melt reduced interference with the target elements.
Figure 17.
After the reaction, the XRD images of a fused material are final in the carrier buffer and GBW07108 (1:1).
In specific cases, the analysis involved reaction mechanisms with higher concentrations of iron oxide and bound water content, as indicated in Table 5 (Figure 16A, scanning point 11). The presence of graphite on the surface of the molten material was linked to the catalytic influence of CaO and Fe2O3 in the carrier buffers at elevated temperatures. This hypothesis suggested the formation of a lower melting point solid melt (mSiO2·nAl2O3·xCaO·yBaO·zFe2O3) through cooperative action resembling that of a “mineralizing agent.” Due to potential energy differences, lighter graphite was likely driven to migrate toward the surface of the molten material, which reduced the tendency for agglomeration and impeded the uniform elemental distribution achieved by the sample and carrier buffers. Another function of graphite was to leverage its relatively expansive surface area to adsorb bound water or serve as a “pathway” for rapid evaporation at high temperatures, thereby eliminating the “mass transfer” impediment effect caused by bound water on the entry of analytes into the detection zone.
Table 5. Surface Composition Analysis Results of Scanning point 11 in Figure 16A.
| Elements | Contents (%) | Calibration contents (%) | Atomic ratios | Converted into oxide contents (%) | |
|---|---|---|---|---|---|
| O | 34.73 | 37.05 | 58.15 | ||
| Na | 1.53 | 1.63 | 1.78 | Na2O | 2.2 |
| Al | 18.41 | 19.64 | 18.28 | Al2O3 | 37.1 |
| Si | 10.36 | 11.05 | 9.88 | SiO2 | 23.68 |
| K | 5.34 | 5.69 | 3.66 | K2O | 8.02 |
| Ca | 1.99 | 2.12 | 1.33 | CaO | 2.97 |
| Fe | 9.69 | 10.33 | 4.65 | Fe2O3 | 13.28 |
| Ba | 11.71 | 12.49 | 2.28 | BaO | 13.95 |
| Totals | 93.76 | 100 | 100.01 | 101.2 | |
4. Conclusion
The evaporation process of the tested elements was promoted by the carrier buffer developed in this project through fluorination and sulfidation reactions between each component and the element to be measured. Due to the shielding effect, the evaporation and excitation temperatures of the tested elements were stabilized, the formation of refractory carbides was inhibited, and the average residence time of the tested element atoms in the arc excitation zone was extended. Since Al2O3 as an inert carrier in the carrier buffer was only affected by nonchemical factors such as electrode temperature, electron density, and residence time, Ag and Sn can be selectively excited, thus the peak-to-background ratio was significantly increased and the detection limit of the method was reduced. Furthermore, NaF possessed excellent buffering properties, exhibiting notable fluorination and fluxing effects, making it an ideal buffer component for determining easily volatile and ionized elements. Additionally, with the assistance of K2S2O7, the buffer components (Al2O3, SiO2, BaCO3, and CaCO3) and the sample matrix coalesced to form a solid melt (mSiO2·nAl2O3·xCaO·yBaO) with stable properties and a low melting point from the preexposure of the electrode to the initiation of evaporation and excitation of the measured elements. In particular, under the synergistic influence of K2S2O7 as a flux and NaF, –[C2F4]n–, and S powder, among others, various elements trapped within crystals or inclusions were accelerated for release and fractionation. During the process, the amplitude of temperature fluctuations within the arc was constrained to within 300 °C, facilitating the stabilization of the “arc cloud” within the excitation zone of the measured element.
The paper study an in-depth exploration of the mechanisms underlying the pivotal role of solid powder sample carrier buffers in atomic emission spectroscopy by conducting an extensive review of existing literature and meticulous experimental research, wherein the collaborative interplay among various components within the carrier buffers and multiphase catalytic reactions established an environment conducive to the excitation of analytes, creating an optimal plasma characterized by a densely populated array of charged particles. The SEM results obtained from the molten masses generated after reactions with diverse samples serve to validate that the graphite present in the buffer does not partake in any chemical reactions. However, its significance lies in its capacity to eliminate interfering factors such as bound water within the samples and facilitate the rapid fractionation of analytes, thereby providing substantial impetus to the process. The experimental findings further illuminated the distinctive “catalytic” roles of CaCO3 and Fe2O3 as “mineralizers”, which expedited the separation of matrix elements and created favorable conditions for swift evaporation. Furthermore, the arc column temperature was regulated collaboratively by the shielding effect of K+, Na+, Al3+, Ba2+, and Fe3+ ions, which helped maintain the Taman temperature and the excitation temperature within the ideal range by the carrier buffer element. Following the interaction with sample matrices, the carrier buffers coalesced into a molten mass (mSiO2·nAl2O3·xCaO·yBaO·zFe2O3), which possessed the ability to absorb interfering groups such as CaO and SiO2 selectively. This capability enabled the residual analytes to evaporate with fractional properties, effectively addressing the issue of splattering, especially in samples with elevated iron content and bound water.
Acknowledgments
We thank the Key Laboratory of San-Jiang Metallogeny and Resource Exploration of the Ministry of Natural Resources, Yunnan Province, for support. This support has enabled researchers in analytical testing to have a deeper understanding of the development and mechanism of action of classical carrier buffers in atomic emission spectroscopy. Scanning electron microscopy images and related analytical results were provided by the Kunming Mineral Resources Supervision and Testing Center and the Kunming Comprehensive Geological Survey Center of the China Geological Survey. Our heartfelt gratitude goes out to them for their invaluable contributions. We appreciate additional support by the National Natural Science of China (U2102209; 41671213; 42307058) and Open Research Project from the Key Laboratory of Sanjiang Metallogeny and Resources Exploration and Utilization, MNR and Yunnan Key Laboratory of Sanjiang Metallogeny and Resources Exploration and Utilization (SJSYS202302), and the Project supported by the Foundation of China Geological Survey (ZD20220135) and Guilin Science Research and Technology Development Plan Project (2020010905).
Supporting Information Available
The Supporting Information is available free of charge at https://pubs.acs.org/doi/10.1021/acsmeasuresciau.4c00025.
Detailed experimental data, including comprehensive tabulated statistical method detection limits (DL) and relative standard deviation (RSD) values, is provided. In addition, energy dispersive X-ray spectroscopy (EDX) elemental and oxide analysis results corresponding to scan points 39, 40, and 41 in Figure 11 are provided (Figure 12). The composition and ratio of the solid powder carrier buffer, the internal standard elements used, and other relevant data supporting the findings and conclusions presented in the manuscript are summarized. This Supporting Information is intended to provide further insight into the experimental procedures and verify the key experimental results discussed in this manuscript. (PDF)
Author Contributions
Zhi-xiong Li: Conceptualization, Investigation, Methodology, Writing - original draft. Bo-yu Du: Methodology, Writing - review and editing. Lian-kai Zhang: Project administration, Writing - review. Jing-jiang Yang: Project administration. Shun-rong Xue: Project administration. Gui-ren Chen: Formal analysis. Hui Yang: Formal analysis, Supervision. Can-feng Li: Methodology. Cheng-zhong He: Investigation, Methodology. Qian-shu Lu: Investigation, Methodology. Song Zhang: Investigation, Methodology. Qiang Li: Formal analysis, Project administration. CRediT: Zhi-xiong Li methodology, writing - original draft, writing - review & editing; Bo-yu Du methodology, writing - review & editing; Lian-kai Zhang project administration; Jing-jiang Yang project administration; Shun-rong Xue project administration; Gui-ren Chen formal analysis; Hui Yang formal analysis, supervision; Can-feng Li methodology; Cheng-zhong He investigation, methodology; Qian-shu LU investigation, methodology; Song Zhang investigation, methodology; Qiang Li formal analysis, project administration.
The authors declare no competing financial interest.
Supplementary Material
References
- Antonov D. O.; Silkis E. G.; Zuev B. K. A Direct Method for Determining Sulfur in Carbon Materials by Atomic Emission Spectrometry with an Arc Excitation Source. J. Anal. Chem. 2021, 76 (5), 578–584. 10.1134/S1061934821050063. [DOI] [Google Scholar]
- Evdokimov I. I.; Fadeeva D. A.; Kurganova A. E.; Shiryaev V. S.; Pimenov V. G.; Karaksina E. V. Determination of Matrix Elements and Praseodymium in Ga–Ge–As–Se Glasses by Inductively Coupled Plasma–Atomic Emission Spectrometry. J. Anal. Chem. 2020, 75 (7), 869–877. 10.1134/S1061934820070060. [DOI] [Google Scholar]
- Sedykh E. M.; Dement’eva O. V.; Kartseva M. E.; Roumyantseva T. B.; Tunyan A. A.; Bannykh L. N.; Gromyak I. N.; Rudoy V. M. Possibilities of atomic spectroscopy in the analysis of gold-and silver-based nanoparticles in synthesized sols and biological samples. J. Anal. Chem. 2016, 71 (1), 62–70. 10.1134/S1061934816010123. [DOI] [Google Scholar]
- Yin Q. H.; Zhu D. M.; Yang D. Z.; Hu Q. F.; Yang Y. L. Rapid Determination of Trace Palladium in Active Pharmaceutical Ingredients by Magnetic Solid-Phase Extraction and Flame Atomic Absorption Spectrometry. J. Appl. Spectrosc. 2018, 84 (6), 1084–1088. 10.1007/s10812-018-0592-x. [DOI] [Google Scholar]
- Zhang B.; Qu C.; Pang L.; Chen W.; Tan L.; Zhang Y.; Qian C.; Dai J. Rapid Determination of Cadmium in Rice and Wheat by Solid Sampling Plasma Jet Atomic Emission Spectrometry (PJ-AES). Anal. Lett. 2022, 55 (8), 1207–1216. 10.1080/00032719.2021.1992416. [DOI] [Google Scholar]
- Zuev B. K.; Zhirkov A. A.; Yagov V. V.; Smirnova I. S.; Korotkov A. S. A Pulsed Atomization and Excitation Source of Variable Discharge Gap Geometry in the Analysis of Solutions by Atomic Emission SpectrometryJournal of. Anal. Chem. 2020, 75 (9), 1143–1146. 10.1134/S1061934820090178. [DOI] [Google Scholar]
- Huang H. B.; Yuan J.; Ling B.; Bai X.; Li M. J.; Liu J. K. Technical development of arc-emission spectroscopy and its application in geological sample analysis. East China Geology 2023, 44 (1), 103–117. 10.16788/j.hddz.32-1865/P.2023.01.009. [DOI] [Google Scholar]
- Li Z. X.; Lu Q. S.; Zhang L. K.; Zhang S.; Yang W. T.; Li C. F.; Feng J.; Liu Z. C. Study on the Determination of Silver, Boron, Molybdenum, Tin in Geochemical Samples by the Method of Solid Sampling Carrier Distillation Atomic Emission Spectrum. Spectroscopy and Spectral Analysis 2023, 43 (7), 2132–2138. 10.3964/j.issn.1000-0593(2023)07-2132-07. [DOI] [Google Scholar]
- You X. G.; Jiang Z. C.; Zeng Y. E. Present Status of the Machanism on Direct Current Arc Discharge. Analytical Laboratory 1990, 9 (2), 48–52. [Google Scholar]
- You X. G.; Jiang Z. C.; Hu J.; Zen Y. E. Studies on the Evaporation and Excitation Behaviour of Rare Earth Elements in Ar-N2/D. C. ARC Discharge. Chemical Research In Chinese Universities 1991, 12 (2), 183–185. [Google Scholar]
- Chen S. G.; Yang L. J. Applications of Chemical Reactions in Emission Spectroscopic Analysis—III, Simultaneous Determination of Trace Amounts of Nb, Ta, W, and Hf in Granite. Spectroscopy and Spectral Analysis 1985, 5 (4), 62–65. [Google Scholar]
- Hu B.; Jiang Z. C.; Liao Z. H.; Zeng Y. E. Fluorination Reactions under Ar-O2 Controlled Atmosphere DC Arc Discharge. Chemical Journal of Chinese University 1990, 11 (10), 1129–1131. [Google Scholar]
- Hu B.; Jiang Z. C.; Liao Z. H.; Zeng Y. E. High-Temperature Chemical Reactions in DC Arc Discharge. Rock and Mineral Analysis 1991, 10 (1), 50–55. [Google Scholar]
- Hu B.; Jiang Z. C.; Qin Y. C.; He M.; Liang P. Determination of Trace Metal Impurities in Cerium Oxide by Fluorination-Assisted ETV-ICP-AES after HPLC Separation. Journal of Rare Earths 2004, 22 (2), 197–200. [Google Scholar]
- Yao J. Z.; Hao Z. H.; Tang R. L.; Li X. J.; Li W. G.; Zhang Q. Determination of High Content of Tin in Geochemical Samples by Solid Emission Spectrometry. Spectroscopy and Spectral Analysis 2013, 33 (11), 3124–3127. [PubMed] [Google Scholar]
- Wu J. B.; Li Y. Y. Research on Halogenation Reactions in Spectroscopic Analysis. Spectroscopy and Spectral Analysis 1987, 7 (2), 20–23. [Google Scholar]
- Hao Z. H.; Yao J. Z.; Tang R. L.; Zhang X. M.; Li W. G.; Zhang Q. Methodology for Trace Analysis of Boron, Molybdenum, Silver, Tin, and Lead in Geochemical Samples by Direct Current Arc Atomic Emission Spectroscopy (DC-Arc-AES). Spectroscopy and Spectral Analysis 2015, 35 (2), 527–533. [PubMed] [Google Scholar]
- Hao Z. H.; Yao J. Z.; Tang R. L.; Yang F.; Li W. G.; Bai J. F. Methodology for Determination of Silver, Boron, Tin, Molybdenum, and Lead in Geochemical Samples by Alternating Current Arc Atomic Emission Spectroscopy. Acta Geologica Sinica 2016, 90 (8), 2070–2082. [Google Scholar]
- Li H. Z.; Zhai D. T.; Zhang J.; Pei M. S. Determination of Ten Trace Rare Earth Elements in the Sample by Atomic Emission Spectrometry. Spectroscopy and Spectral Analysis 2005, 25 (9), 1500–1502. [PubMed] [Google Scholar]
- Wang S. Y.; Pan L. H. The Study on a New Carrier KBH4 used to Determinate Trace RE Impurities by Spectral Analysis. Spectroscopy Laboratory 1995, 12 (4), 23–26. [Google Scholar]
- Liu B. L. Application of Fe2O3 as stabilizer in spectral analysis—double internal standard method for determination of gallium in rock ore samples. Physical Testing and Chemical Analysis Part B: Chemical Analysis 1992, 28 (4), 224–225. [Google Scholar]
- Yu X. F.; Li R.; Shou M. J.; Zheng C. J.; Hu Y. P. Development and Application of Full Spectrum Direct Reading Arc Emission Spectrometer E5000 in Geochemical Sample Analysis. Rock and Mineral Analysis 2015, 34 (1), 40–47. 10.15898/j.cnki.11-2131/td.2015.01.005. [DOI] [Google Scholar]
- Zhang Y. C. Observation of the Development Endpoint. Spectroscopy and Spectral Analysis 1992, (1), 126–127. [Google Scholar]
- Zhang Y. C. Study on Determination of Ag in Geologic Chemical Detection Sample by Spectrometry. Chinese Journal of Spectroscopy Laboratory 2007, 24 (6), 1067–1073. [Google Scholar]
- Xu F. L.; Zhang J. Rapid Determination of Trace Elements Silver, Tin, and Molybdenum in Geochemical Samples by Atomic Emission Spectrometry. Xinjiang Nonferrous Metals 2005, (S1), 39–41. [Google Scholar]
- Meng S. L.; Song W. Z.; Wang Z. H. Effect of Coexistent Rare Earth Elements on Spectral Line in Alternating Current Arc. Chinese Journal of Analytical Chemistry 1995, 23 (9), 1028–1031. [Google Scholar]
- Song W. Z.; Meng S. L. Effect of the Composition of Rare Earth Elements on the Spectral Line Intensities with AR ARC in Ar/O2 Atmosphere. Chinese Journal of Analytical Chemistry 1987, 15 (8), 702–705. [Google Scholar]
- Zhang W. H.; Wang Y. D.; Wu D. M.; Zhao Y. Q.; Fu G. Y.; Chang W. Rapid Determination of Silver, Tin, Boron, Molybdenum, and Lead in Geochemical Samples by AC Arc Direct Reading Spectroscopy. Chinese Journal of Inorganic Analytical Chemistry 2013, 3 (4), 16–19. [Google Scholar]
- Wang G. M.; Liao Q. L.; Lu R. H. Determination of Trace and Micro amount Elements in Coal Ash by Spectrographic Analysis with Halide Buffer. Chinese Journal of Spectroscopy Laboratory 1994, 11 (3), 38–43. [Google Scholar]
- Yang T.; Wang J. L.; Guo S.; Duan Y. N.; Guo D. X. Determination of boron, tin, silver in stream sediments by double electrode emission spectrometry. Ji Lin Geology 2011, 30 (2), 111–113. [Google Scholar]
- Liu J. B.; Wu Y. Z. Rapid Determination of Tin in Ores by Atomic Emission Spectrometry. Metallurgical Analysis 2013, 33 (3), 65–68. [Google Scholar]
- Yu Y.; He Z. Y.; Mao Z. C.; Wei Y.; Yuan X. R.; Liu J. B. Determination of Tin by Different Sensitivity Spectral Lines in Alternating Current Arc Emission Spectrometry. Rock and Mineral Analysis 2013, 32 (1), 44–47. [Google Scholar]
- Wang C. J. Determination of High Tin Content in Geochemical Samples by Alternating Current Arc Emission Spectrometry. Chinese Journal of Inorganic Analytical Chemistry 2019, 9 (1), 39–42. [Google Scholar]
- Ma J. Z.; Li G. Y.; Dong X. B. Determination of Tin in Lead Ores by Alternating Current Arc Emission Spectrometry. Metallurgical Analysis 2023, 43 (2), 39–45. [Google Scholar]
- Decker R. J. Electrode temperatures of a d.c. arc used in spectrographic analysis. Spectrochimica Acta Part B: Atomic Spectroscopy 1971, 26 (3), 137–144. 10.1016/0584-8547(71)80015-0. [DOI] [Google Scholar]
- Qiu H. X.; Zhao G.; Liu J. F.; Li K. Y.; Long Z. W.; Li Z. X.; Xiang M. B.; Liu W. H. Improvement of Carrier Buffer for Arc Direct Reading Atomic Emission Spectroscopy Based on Scanning Electron Microscopy. Rock and Mineral Analysis 2018, 37 (3), 283–291. [Google Scholar]
- Kuznetsova A. I.; Chumakova N. L. Determination of the “Difficult” Elements Ag, B, Ge, Mo, Sn, Tl and W in Geochemical Reference Samples and Silicate Rocks of the GeoPT Proficiency Testing Series by DC Arc Atomic Emission Spectrometry. Geostandards Newsletter 2002, 26, 307–312. 10.1111/j.1751-908X.2002.tb00637.x. [DOI] [Google Scholar]
- Špačková A.; Chaudhri M. S. Spectrochemical determination of tungsten and boron in mineral matrix. Microchemical Journal 1982, 27 (1), 97–101. 10.1016/0026-265X(82)90093-5. [DOI] [Google Scholar]
- Yang X. P.; Kong L. X. Emission Spectrum Analysis of Tungsten (Overview). Chinese Journal of Analysis Laboratory, (01) 1983, 38–42. [Google Scholar]
- Nickel H. Considerations on the reaction and evaporation mechanism in oxide-containing graphite electrodes during arc excitation. Spectrochimica Acta Part B: Atomic Spectroscopy 1968, 23 (5), 323–343. 10.1016/0584-8547(68)80011-4. [DOI] [Google Scholar]
Associated Data
This section collects any data citations, data availability statements, or supplementary materials included in this article.


