Abstract
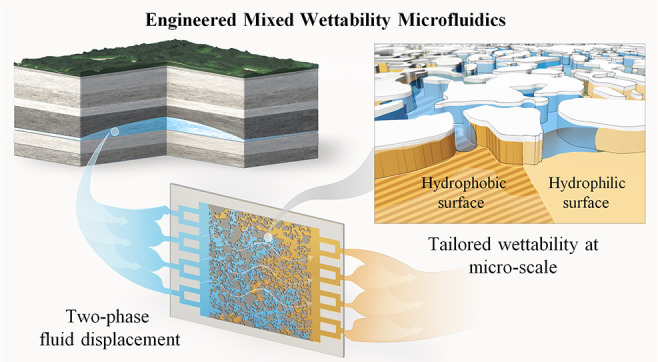
Understanding rock wettability is crucial across various fields including hydrology, subsurface fluid storage and extraction, and environmental sciences. In natural subsurface formations like carbonate and shale, mixed wettability is frequently observed, characterized by heterogeneous regions at the pore scale that exhibit both hydrophilic (water-wet) and hydrophobic (oil-wet) characteristics. Despite its common occurrence, the impact of mixed wettability on immiscible fluid displacement at the pore scale remains poorly understood, creating a gap in effective modeling and prediction of fluid behavior in porous media. The primary objective of this study was to investigate how mixed wettability affects pore-scale fluid displacement dynamics, utilizing microfluidic devices designed to replicate rock-like structures with varied wettability properties. Current techniques for achieving mixed wettability within microfluidic devices often struggle with spatial control and resolution, limiting their accuracy. To address this limitation, a novel approach was employed that combined photolithography and molecular vapor deposition of perfluorodecyltrichlorosilane to precisely and selectively modify wettability within specific pore regions, achieving a mixed wettability distribution correlated with pore size for the first time. The experimental setup included five identical micromodels representing distinct wetting conditions, which were initially saturated with air and subsequently flooded by water. By systematically varying the ratio of hydrophilic to hydrophobic areas, we covered a range from fully hydrophilic to fully hydrophobic and intermediate mixed wettability configurations. Comparative displacement experiments revealed that pore-level mixed wettability has a pronounced effect on fluid displacement behavior, influencing the injection time, spatial invasion patterns, and dynamic pressure profiles. Results indicated that both the injection time and dynamic pressure decreased with an increase in the hydrophilic area fraction. Each wettability configuration displayed unique sequences of pore-filling events, emphasizing the critical role of the wettability distribution in influencing displacement dynamics. While mixed wettability exhibited a clear monotonic effect on invasion time and dynamic pressure, saturation behavior was notably nonmonotonic. Interestingly, mixed wettability scenarios with relatively medium to high hydrophilic fractions demonstrated enhanced overall sweep efficiency compared to the hydrophobic case and reduced the bypassed gas phase relative to the hydrophilic case. However, inefficiently distributed mixed wet zones were found to reduce the sweep efficiency. These findings highlight the critical influence of mixed wettability in fluid displacement processes, with significant implications for applications in oil recovery, CO2 sequestration, and other subsurface energy technologies.
Keywords: microfluidics, hydrophilic, hydrophobic, mixed wettability, pore-scale, fluid displacement
Introduction
Multiphase fluid flow in porous media is a fundamental phenomenon with significant implications for various natural and engineering processes, including hydrology,1 hydrocarbon recovery,2,3 geological carbon storage,4−6 hydrogen storage,7−9 flow in fuel cells,10 and membrane-based separation.11,12 Fluid–fluid displacement in a porous medium, where one fluid displaces another from confined spaces, is typically governed by the interplay of capillary and viscous forces. This interaction is quantified by two dimensionless parameters: the capillary number (Ca) and the viscosity ratio (M) between the invading and defending fluids, as illustrated in Lenormand’s phase diagram.13,14 Wettability of the system, defined as the preference of a solid surface for one fluid compared to another, is widely recognized as a crucial factor influencing pore-scale displacement mechanisms and macroscopic invasion patterns.15,16 However, predicting the impact of wettability on displacement is complex due to changes in rock wettability caused by rock–fluid interactions and varying reservoir fluid conditions.17
Mixed wettability is a common characteristic in different rock formations, marked by varying wetting properties across various regions of the porous medium.18 This property fundamentally differs from neutral or intermediate wettability when the medium exhibits no preferential affinity toward a particular fluid. As illustrated in Figure 1, fluid entrapment is significantly influenced by wettability: under hydrophilic conditions, the aqueous phase adheres to the pore walls, entrapping the nonaqueous phase at the center of the pores. Conversely, under hydrophobic conditions, the nonaqueous phase coats the pore surfaces while the aqueous phase is entrapped centrally. Mixed wettability presents a hybrid scenario, leading to a more complex fluid distribution and entrapment pattern with both aqueous and nonaqueous phases potentially being immobilized depending on the local wetting characteristics.
Figure 1.
Comparative illustration of fluid entrapment in porous media, depicting a hydrophilic system with hydrophilic surfaces causing nonaqueous phase entrapment at the pore centers, a hydrophobic system with hydrophobic surfaces resulting in aqueous phase entrapment at the pore centers, and mixed-wet conditions showing complex fluid distribution with both aqueous and nonaqueous phase entrapment influenced by local wettability variations.
In oil-bearing reservoirs, mixed wettability formation can potentially be correlated to the pore size distribution.19,20 For instance, during the primary drainage process of a water-saturated reservoir, oil typically infiltrates the large pores, while some water persists in smaller pores due to high capillarity. The process is accompanied by the deposition of surface-active hydrocarbon components (e.g., asphaltene and resins) onto the walls of large pores due to prolonged exposure to the oil phase.21,22 Over time, this deposition leads to a local wettability alteration, turning a fraction of the pore surface to be oil-wet, while narrow pore throats remain preferentially water-wet. The deposition mechanism is extensively discussed in various studies.21,23−25 This mechanism was initially hypothesized and later observed through in situ characterization using scanning electron microscopy (SEM) and identified using energy-dispersive X-ray (EDX) analysis, confirming the dual nature of wetting characteristics within the reservoir rock.26 Another form of mixed wettability, often termed patterned or spotted wettability, arises from mineral heterogeneity. This includes organic matter that is oil-wet, such as kerogen, contrasting with inorganic rock minerals that are water-wet.27,28 Although mixed wettability is a common natural occurrence, its impact on immiscible fluid displacement on the pore scale remains poorly understood.
The fluid displacement in mixed-wet systems often displays a complex behavior, different from that in uniform-wet systems. Numerous studies have inferred the effects of mixed wettability from Darcy-scale core flooding experiments.29−33 Although three-dimensional (3D) X-ray microcomputed tomography (microCT) has significantly advanced our understanding of multiphase flow in porous media, it faces limitations, particularly in terms of temporal resolution, which restricts its ability to capture rapid pore-scale dynamics. Furthermore, while core-scale experiments provide broader insights into reservoir behavior, they are costly, time-intensive, and often lack the ability to directly observe and quantify fluid–surface interactions at the pore scale.34
Fully characterizing the wetting properties of naturally mixed-wet porous media is inherently complex, making it difficult to study their influence on fluid displacement. The use of simplified analogue systems with controlled geometries and wettability can greatly facilitate systematic, mechanistic studies on how mixed wettability affects fluid–fluid displacement. Microfluidic technology, a two-dimensional (2D) approach, provides an effective method for isolating and visualizing specific pore-scale mechanisms.35−39 This technique enables rapid, precise, and real-time analysis while allowing the replication of representative pore size models, thus permitting high-resolution direct observations of fluid behavior within porous networks.40
Numerous studies have examined the effects of homogeneous surface wettability on fluid–fluid displacement, ranging from water-wet to oil-wet.41−43 However, fewer investigations have focused on how heterogeneous wettability affects fluid dynamics including both numerical and experimental methods. Chen et al.44 simulated gas–water flow through randomly distributed, heterogeneous wetting particles using a finite element-based method, finding that gas residual saturation increased with a higher hydrophobic particle content. Irannezhad et al.45 applied a dynamic pore network model to study displacement patterns in mixed-wet micromodels across various capillary numbers and wettability fractions. Zhang et al.46 used the lattice Boltzmann method to assess the effect of wettability and capillary number on fluid flow. Another study by Ahmadi-Falavarjani et al.47 investigated the impact of corner flow and nonuniform wettability on low-salinity water flooding using OpenFOAM simulations. These studies primarily rely on numerical approaches, as replicating reservoir-like mixed-wet conditions in the laboratory are challenging yet essential for accurate validation.
In simplified porous systems, glass beads with different wettabilities were utilized to investigate the effects of pore-scale wettability distributions on fluid displacement and capillary behavior.48,49 Geistlinger et al.50 demonstrated that in an air-filled container filled with mixed hydrophilic and hydrophobic glass beads, increasing the hydrophobic bead content leads to an altered trapping efficiency. A similar study by Chang et al.51 investigated the effects of mixed wettability on CO2 storage efficiency in brine-saturated systems. Sun and Torres-Verdín52 created heterogeneous wettability on radial Hele-Shaw cells, which showed altered fingering patterns and displacement efficiency. On the other hand, Irannezhad et al.53 developed an ultraviolet-based platform to alter wettability in photocurable polymer (NOA81) micromodels and create mixed wet clusters. Their findings revealed that invading water selectively occupies highly water-wet pores, encircles weakly water-wet pores, and traps a substantial amount of oil. However, limitations remain, including simplistic pore patterns, uncontrolled wettability alteration, and limited durability of modified surfaces.54,55 Other methods, such as using nanoparticles and surfactants to alter surface wettability, have been proposed,56,57 but they face limitations in precisely controlling treated zones within micromodels. Despite advancements to replicate mixed wet conditions, precise, stable control over the spatial wettability distribution at high resolution is still lacking.
This study focuses on exploring the impact of mixed wettability on immiscible fluid displacement in porous media. Considering the significance of heterogeneity in natural porous rocks on fluid flow, we utilized microfluidic devices fabricated from silicon by using photolithography and dry-etching techniques. These devices replicate pore networks modeled after real rock structures, where we consider both uniform and mixed wettability states. Our recently developed method, combining photolithography with molecular vapor deposition (MVD) of perfluorodecyltrichlorosilane (FDTS), enables precise, stable modification of wettability at the pore scale, including selective alteration in narrow pore throats to represent mixed wettability in geological formations.58 To the best of our knowledge, this is the first study to achieve high-resolution mixed wettability distribution correlated with pore size in microfluidic devices.
A comparative series of experiments was conducted by using identically structured microfluidic chips with varying surface wettability (hydrophilic, mixed, and hydrophobic). Water was injected into air-saturated chips under conditions dominated by capillary forces, simulating natural drainage and imbibition processes. High-resolution imaging captured pore-scale fluid displacement patterns, allowing us to (i) assess the impact of homogeneous versus mixed wettability with varying wetting-pore fractions and distributions on displacement patterns, dynamic pressure, saturation, and sweep efficiency and (ii) reveal how altered pore throats influence flow paths. This study provides insights into the complexity of mixed wettability, offering details often overlooked in simplified models.
Materials and Methods
Micromodel Design and Fabrication
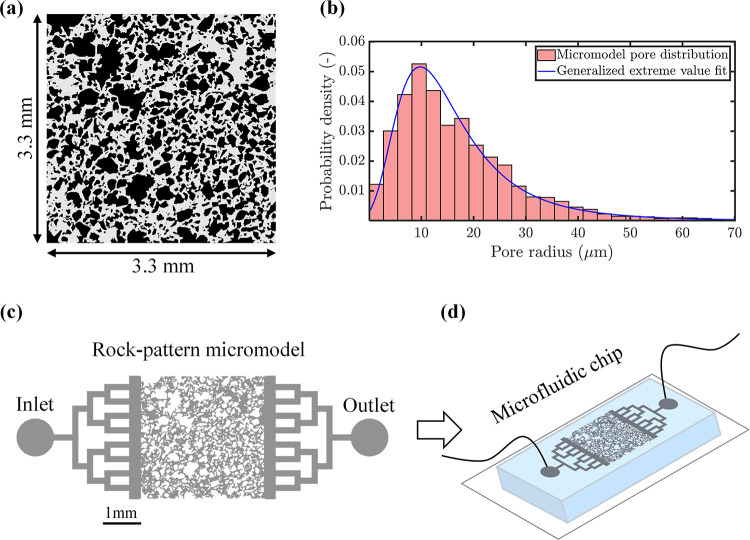
The microfluidic devices were designed to replicate an actual pore network of a reservoir rock. A thin-section image of a sandstone core with an edge length of 3.3 mm was used to obtain detailed pore-structure features.59 The original image was processed using Otsu’s segmentation method to convert it into a binary image,60 as shown in Figure 2a. The binary image was subsequently converted into a micromodel layout design format using CleWin software by WieWeb, while maintaining the original dimensions. The rock-patterned geometry exhibited a porosity of approximately 50%, with an average pore radius of 17 μm and the smallest pore features measuring around 1 μm, as illustrated in the pore-radius distribution presented in Figure 2b. Figure 2c shows the layout of the rock-patterned micromodel, which included inlet and outlet channels with the pore network depicted in gray and solids in white. The inlet and outlet channels were positioned along the full length of the porous media to ensure uniform fluid distribution throughout the entire model.
Figure 2.
Rock-patterned micromodel design: (a) The black and white binarized image represents a sandstone thin section image with an edge length of 3.3 mm. (b) The pore-radius distribution of the rock-patterned porous media used in the micromodel, exhibiting an average pore-throat radius of 17 μm. (c) The micromodel layout design, where the pore network is represented in gray and the solids in white. (d) Illustration of the final fabricated and bonded microfluidic chip.
Silicon-based microfluidic devices were fabricated in-house utilizing state-of-the-art semiconductor fabrication technology at the KAUST Nanofabrication Core Lab. Laser writing was applied to pattern a blank photomask with the desired layout, which was subsequently transferred onto a silicon wafer using standard photolithography processes (see Figure S1). The silicon wafer was dry etched using the Bosch process, which involved alternating cycles of cyclic perfluorocyclobutane (C4F8) and sulfur hexafluoride (SF6) plasma, obtaining an average etching depth of 20 μm. The etching depth was carefully controlled, ensuring that the channel depth exceeded the average pore-radius sizes. This design was selected to ensure that capillarity was predominantly governed by the width of the pore throats. The average depth, pore-throat dimensions, and roughness of the fabricated micromodels were measured using both SEM (Helios 5 DualBeam, Thermo Scientific, United States) and a stylus surface profilometer (DektakXT stylus profilometer, Bruker, United States). The results confirmed that the wall roughness of the micromodels was negligible in comparison with the channel depth. The etched micromodel was bonded with the thin layer of polydimethylsiloxane (PDMS), as depicted in Figure 2d. Detailed descriptions of the fabrication process are available in the Supporting Information.
Mixed Wettability Layout
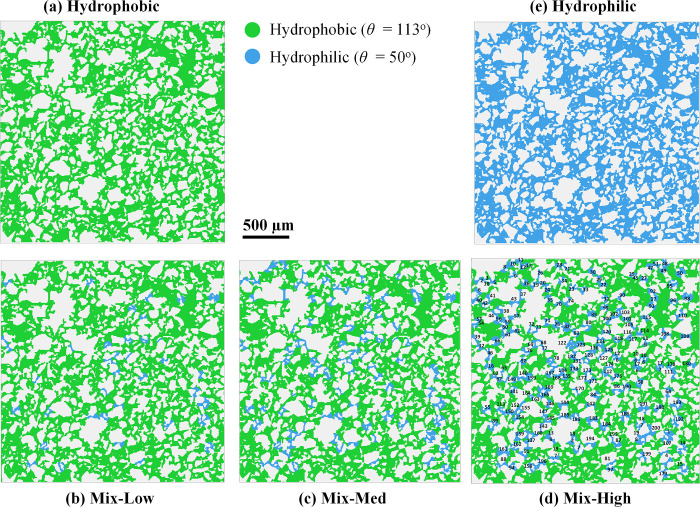
Five micromodels with identical pore-network structures but varying wettability configurations were fabricated, including two homogeneous models (fully hydrophilic, fully hydrophobic) and three spatially heterogeneous (mixed-wettability) models, as shown in Figure 3. Silicon surface is naturally hydrophilic, becoming hydrophobic upon application of an FDTS coating. The initial wettability of both the silicon and the FDTS-coated surfaces was assessed by using static contact angle (θ) measurements, which yielded values of θ = 50° for noncoated silicon and θ = 113° for the FDTS coating. The wettability alteration was achieved through a novel technique.58 The deposition of the FDTS layer was performed using MVD. The long-term stability of the FDTS coating was extensively investigated by AlOmier et al.,58 demonstrating that wettability remained stable with minimal degradation over several months. A photomask containing distinct wettability patterns was fabricated to target local surface modification (Figure S1). The spatial wettability patterning of micromodels was guided by precisely positioning the photomask over the fabricated micromodels during the photolithography process. The selective deposition of the FDTS layer ensured accurate wettability modification directly onto the targeted flow channels.
Figure 3.
Five micromodels were designed with varied wettability through a selective FDTS coating. Hydrophilic and hydrophobic characteristics were distinguished by bulk contact angles θ = 50° (blue) and θ = 113° (green), respectively. Single-wettability models included fully (a) hydrophobic and (e) fully hydrophilic configurations. Mixed wettability models, labeled (b) Mix-Low, (c) Mix-Med, and (d) Mix-High, depict heterogeneous wettability levels based on the pore-throat sizes. In mix-low, mix-med, and mix-high, 20% (the smallest 40 pore throats), 50% (the smallest 100 pore throats), and 100% (all 200 pore throats, shown in panel (d)) were hydrophilic, respectively, while the remaining domain was hydrophobic.
The experimental study included two single-wettability models featuring fully hydrophobic (Figure 3a) and fully hydrophilic (Figure 3e) configurations, representing the two extreme wetting conditions. The design of the mixed-wet micromodels was intended to correlate with the pore size distribution, with narrow pores exhibiting hydrophilic properties and larger pores being hydrophobic. This approach aimed to replicate the typical distribution of mixed wettability found in natural oil-bearing formations. All small pore throats in the model were carefully sorted from the smallest to largest, and a total of 200 small pore throats were designated for specific wettability alteration. The coating was selectively applied to the entire surface, except for the designated pore throats. As a result, the micromodels primarily exhibited hydrophobic characteristics (θ = 113°), with the altered pore throats being hydrophilic (θ = 50°). Three mixed wettability models, labeled Mix-Low, Mix-Med, and Mix-High (Figure 3b–d, respectively), were designed to represent varying levels of heterogeneous wettability distributions based on varying pore-throat sizes. In these configurations, 20% (the smallest 40 pore throats), 50% (the smallest 100 pore throats), and 100% (all 200 pore throats, as shown in Figure 3d) of the pore throats were selectively treated to be hydrophilic, while the remaining pore throats retained their hydrophobic properties.
SEM images were obtained to confirm the precise placement of the coating and the selective alteration of the pore-throat wettability, as depicted in Figure 4. Figure 4a offers a slightly tilted perspective, revealing the overall structure for part of the micromodel and highlighting some channels and features. Figure 4b shows a top-down view focusing on a locally hydrophilic pore throat (appearing as the untreated channel in light gray) and adjacent to a treated pore structure (shown in darker gray), illustrating the contrast in surface treatments. A 3D tilted view of other treated and untreated channels is also shown in Figure 4c, highlighting the distribution of the coating. An enlarged view of a flow channel shows the vertically etched wall profiles (Figure 4d).
Figure 4.
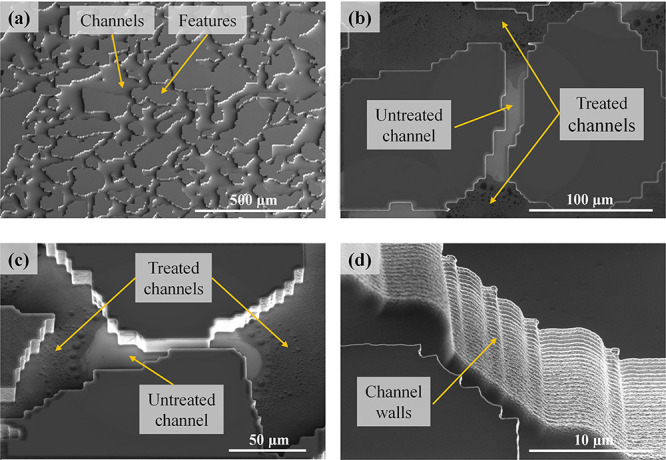
SEM images showing various perspectives of the micromodel: panel (a) presents a slightly tilted view of part of the micromodel showing channels and features, panel (b) displays a top view of a locally hydrophilic channel (untreated in light gray) adjacent to treated pore structures (dark gray), panel (c) shows a tilted view of another treated and untreated channels, and panel (d) provides an enlarged view of vertical channel walls.
Experimental Setup
All experiments were conducted using a high-resolution observation setup, as illustrated in Figure 5. An optical microscope (ZEISS Axio Examiner, Germany) equipped with an EC Epiplan-Neofluar 2.5× magnification objective with a 15.1 mm working distance was used. An ORYX 10GigE high-speed camera (FLIR Systems Inc., United States) was integrated with the microscope for direct observation and recording of flow dynamics. Visualization was conducted using the bright-field technique, capturing the reflected light. The microfluidic chip was positioned on the microscope stage centered beneath the observation lens to provide the required field of view. The flow into the chip was controlled using a PHD ULTRA syringe pump (Harvard Apparatus, United States), with fluid delivered through rigid Teflon tubing with an internal diameter of 1/32 in. The discharge was collected at an atmospheric pressure. The injected fluid was deionized water tagged with sodium fluorescein (Honeywell International Inc., United States) at a concentration of 0.01 M for the coloring and visualization purposes.
Figure 5.
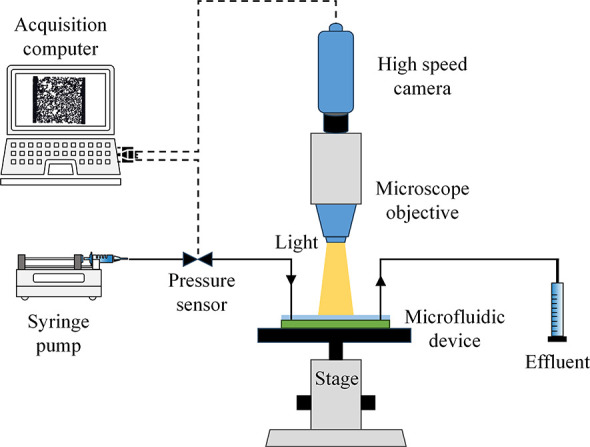
Schematic diagram of the microfluidic experimental setup, consisting of an optical microscope equipped with a magnification objective, a syringe pump, and a data acquisition system responsible for recording displacement images and injection pressure.
Experimental Procedure
Waterflooding experiments in air-filled microfluidic chips were performed at a constant injection rate of Q of 4 nl/min. This rate corresponds to an average velocity of u = 0.006 m/min, calculated based on the average pore size. All experiments were maintained a capillary number Ca = μwateru/γ = 1.35 × 10⁻⁶ and viscosity ratio M = μwater/μair ≈ 55, where γ = 72.8 mN/m represents the interfacial tension between air and water and μwater and μair are the dynamic viscosities of 1 mPa·s and 0.01825 mPa·s, respectively. These conditions indicate a favorable displacement scenario. During injection, pressure and high-resolution pore-scale images were recorded simultaneously. The injection pressure was sampled at 20 Hz, while images were captured at a rate of 5 frames per second. A consistent experimental procedure was followed across all experiments with identical flow boundary conditions to ensure comparability. Each experiment used a newly fabricated, single-use microfluidic chip to maintain precise control over the wettability.
Image Processing
Image processing was performed by using MATLAB to analyze the dynamics of fluid distributions and to calculate the saturations. The recorded color images from the flooding experiments were split into red, green, and blue channels. The water phase was then segmented from the solid phase and open pore spaces by applying global thresholding to the blue color channel. The resulting binary fluid distribution patterns were overlaid onto their corresponding pore space binarized images, captured at each experiment. This process produced a ternary image representing the three distinct phases (solid, water, and gas) for each recorded frame. Given the shallow etch depth (∼20 μm), the micromodel was treated as a 2D system, assuming a uniform fluid distribution throughout its depth. As a result, all calculated quantities, including saturation, were determined based on area measurements.
Results and Discussion
Displacement Patterns
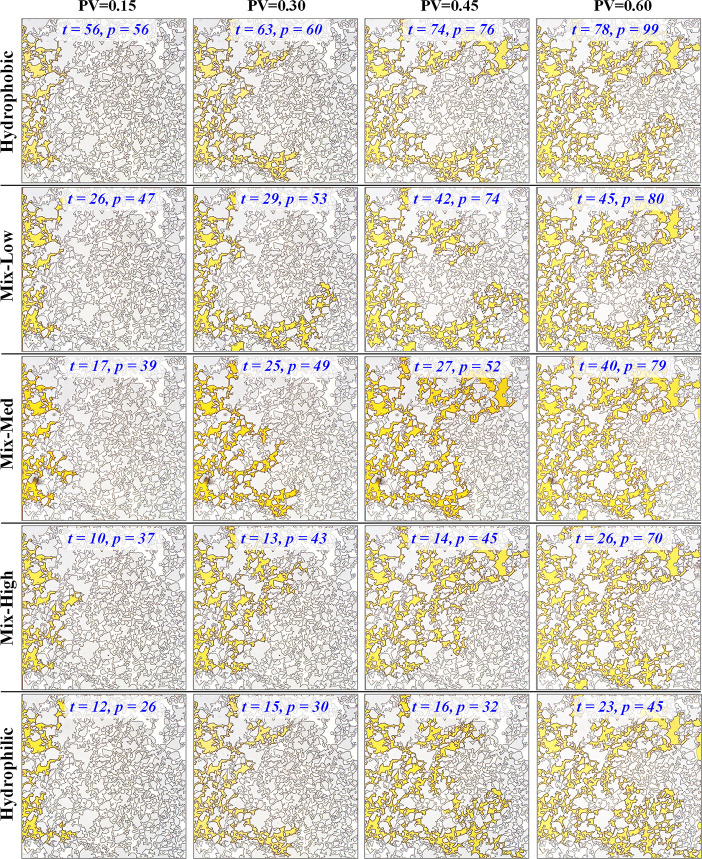
A series of comparative displacement experiments was carried out to assess the impact of mixed wettability on fluid displacement behavior. These flow experiments were conducted across five identical micromodels, each representing a different wetting condition, as shown in Figure 6. These conditions ranged from fully hydrophobic to fully hydrophilic with three intermediate wettability stages: low mixed wettability (Mix-Low), medium mixed wettability (Mix-Med), and high mixed wettability (Mix-High), as depicted in Figure 3. Figure 6 displays the dynamics of the water phase, appearing in yellow, through various stages of pore volume (PV) injection, shown at injected PVs of 0.15, 0.30, 0.45, and 0.60. Each condition, from fully hydrophobic to fully hydrophilic, revealed distinct characteristics of fluid dynamics, reflected in injection time (t in minutes), spatial displacement pattern, and dynamic pressure (p in mbar). Video recordings of the experiments are available in Videos S2 and S3 in the Supporting Information.
Figure 6.
Flow dynamics within five identical micromodels showcasing a spectrum of wetting conditions, ranging from fully hydrophobic to fully hydrophilic, with intermediate stages including low mixed wettability (Mix-Low), medium mixed wettability (Mix-Med), and high mixed wettability (Mix-High). The water phase, appearing in yellow, was shown at various stages corresponding to water pore volumes of 0.15, 0.30, 0.45, and 0.60. Each stage was annotated with the corresponding time (t in minutes) and pressure drop (p in mbar), illustrating the fluid flow dynamics. These models demonstrated varying water distributions, emphasizing the significant impact of wettability on the flow behavior. It should be noted that these images were captured directly from the camera with only minimal processing applied to enhance visibility.
Starting with the hydrophobic condition, the results indicated a notable resistance to water penetration. At the earliest stage (PV = 0.15), substantial time and pressure (t = 56 min and p = 56 mbar) were required to initiate water flow. The longer time was needed to build up the injection pressure to exceed the capillary entry pressure. As the pore volume of infiltrated water increased, both time and pressure continued to rise, reflecting the medium’s resistance to water flow. At PV = 0.60, the pressure increased to 99 mbar, the highest among all conditions, which reflects the injection pressure required to force water through hydrophobic channels.
The mixed-low wettability scenario, which is mostly hydrophobic except for 20% of the selected pore throats, corresponding to about 4.7% of the total pore space that was treated to be hydrophilic (see Figure 3b), showed improved water dynamics. Although the initial times and pressures were still high (t = 26 min and p = 47 mbar at PV = 0.15), they were lower than in the hydrophobic case. As the water pore volume increased, the pressure did rise but remained consistently lower than that observed in the hydrophobic condition, peaking at 80 mbar for PV = 0.60. This suggests that while there was resistance, it was comparatively less severe than in fully hydrophobic models.
Transitioning to Mix-Med wettability, which included 50% of the pore throats selected for alteration, corresponding to about 11.7% of the pore space being hydrophilic (see Figure 3c), there was improvement in flow efficiency. The initial time and pressure were significantly reduced to 17 min and 39 mbar at PV = 0.15. These conditions facilitated a smoother flow through the model. By PV = 0.60, the time increased to 40 min with p = 79 mbar, consistently lower than the previous two cases.
The Mix-High wettability, with 100% of the altered pore throats, corresponding to 24.6% of the total pore space being hydrophilic (Figure 3d), became more similar to the fully hydrophilic scenario. Beginning at t = 10 min and p = 37 mbar at PV = 0.15, the model demonstrated lower resistance to water flow. The progression to PV = 0.60 showed only a moderate increase in time and pressure, reaching 26 min and 70 mbar, respectively, highlighting the effectiveness of mixed wettability in changing the flow dynamics and pressure response.
Finally, the hydrophilic condition exhibited the most optimal flow characteristics. With an initial t = 12 min and a p = 26 mbar at PV = 0.15, it exhibited minimal resistance to water entry, as expected due to favorable wettability. This trend continued with increasing pore volumes, where the pressure slightly rose to 45 mbar by PV = 0.60. The pressures under this condition were consistently lower across all stages compared to those under other conditions, as expected. Moreover, adding mixed wettability effects to the model in the presence of geometrical heterogeneity, the pronounced effect of increasing mixed wettability was clearly observed. The degree of mixed wettability significantly influenced and enhanced the displacement dynamics by accelerating and facilitating fluid movement through the porous media.
Dynamic Pressure and Fluid Saturation
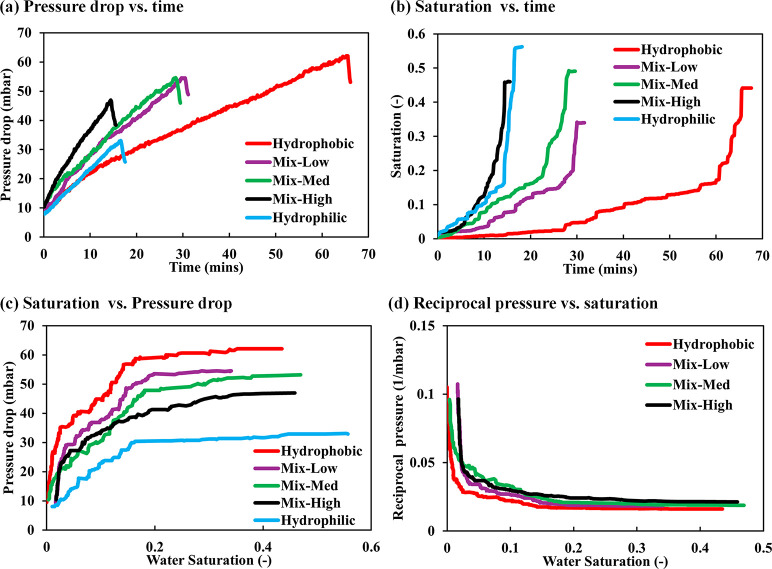
To provide quantitative insights into the displacement process across different wetting scenarios, the evolution of pressure drops (Δp) and saturations (Sw) during the displacement was carefully measured and is provided in Figure 7. The time scale of the experiments was characterized by the breakthrough time (tb), indicating the time required for the displacement front to reach the outlet of the domain, which varied from 15 to 65 min across all experiments. It is corresponded to the noticeable sharp decrease in pressure drop, as shown in Figure 7a. The pressure drop showed a steadily increasing trend as the water advanced through the porous model, reflecting rising hydraulic resistance with more pore space filled. Targeting less accessible throats required higher pressure to overcome capillary barriers. This aligns with water saturation leveling off (Figure 7b), indicating that the displacing phase has established a fully connected pathway from the inlet to the outlet. After water breakthrough, saturation remained stable, as no further pores were filled at the constant injection rate.
Figure 7.
Comparative analysis of water saturation and pressure drop dynamics in micromodels across wettability scenarios, where (a) the corresponding pressure drop over time for all cases, (b) the progression of water saturation over time for all cases, (c) the relationship between pressure drop and water saturation, and (d) the reciprocal of pressure drop plotted against water saturation.
In the hydrophilic case, an accelerated pore-filling process was observed, which is evident from a slight shift in the beginning of the saturation curve due to rapid fluid invasion. Water percolation occurred rapidly, marked by a steep rise in saturation, ultimately achieving the highest saturation at breakthrough (Sw = 55%). This is caused by cooperative pore filling, a phenomenon commonly observed in weakly water-wet conditions that enhances displacement efficiency.61 Conversely, in the hydrophobic case, the displacement process was slow, resulting in a gradual increase in saturation with the longest breakthrough time. This was attributed to the high resistance encountered when invading the pores and overcoming their entry pressure. The hydrophobic case ultimately reached a maximum saturation of (Sw = 44%), which is 10% less than the hydrophilic case. Similar behavior was observed in the context of weak drainage and weak imbibition, where the saturation and displacement efficiency were observed to increase on surfaces with a higher affinity for the invading fluid.42
In mixed wettability cases, breakthrough time occurred sequentially in the order Mix-High, Mix-Med, and Mix-Low, corresponding to the increasing overall percentage of hydrophilicity in the models (Figure 7a,b). The invasion dynamics in the Mix-High scenario closely resembled that of the hydrophilic case. This suggests that the presence of a sufficient number of well-distributed critical hydrophilic pore throats significantly controlled the invasion behavior. Their impact was evident in accelerating the breakthrough time compared to the hydrophilic case. However, the saturation attained in the Mix-High case was slightly lower (Sw = 45%) than in the hydrophilic case, highlighting the role of these altered pore throats in diverting the flow and limiting access to connected areas of the matrix. The Mix-Med case displayed an intermediate invasion dynamic, falling between the hydrophilic and hydrophobic cases but slower than Mix-High due to the relatively fewer altered pore throats. Water saturation in this case was slightly higher (Sw = 49%) than in Mix-High. Despite having relatively fewer altered pore throats, their distinct distribution facilitated an expanded invasion pattern within the matrix. Interestingly, while the Mix-High scenario shares the same altered pore throats as the Mix-Med scenario, the absence of additional altered pore throats in the Mix-Med case disrupted the pressure equilibrium within the connected invading phase, thereby altering the invasion pattern. In the Mix-Low scenario, the scattered and limited number of altered pore throats significantly impacted the maximum saturation (Sw = 33%), the lowest among all cases.
The dynamics of pressure evolution varied significantly among different wettability cases, as depicted in Figure 7c. The hydrophilic case required the lowest injection pressure to breakthrough, owing to the capillary action facilitating fluid imbibition. On the other hand, the hydrophobic case demanded the highest injection pressure to overcome the capillary forces working against the flow. In the mixed wettability scenarios, the pressure response was strongly correlated with the number of hydrophilic zones encountered by the advancing fluid within the matrix. The flow resistance, as indicated by the pressure communication across the matrix, was independent of the spatial distribution of these zones. Instead, it was governed by the delicate balance between the capillary and viscous forces arising from the coexistence of varying wetting states. For instance, the Mix-Low scenario displayed a pressure response similar to that of the hydrophobic case due to its minimal wettability alteration, followed by Mix-Med and then Mix-High. The altered pore throats played a significant role in governing the invasion pressure, as evidenced by the progressive shift in the pressure curves corresponding to the degree of hydrophilicity within the matrix. Figure 7d presents the reciprocal of the pressure drop plotted against water saturation. Although mixed wettability demonstrated a clear monotonic effect on invasion time and dynamic pressure, its influence on saturation displayed a nonmonotonic behavior, governed by the extent and spatial distribution of wettability within the matrix.
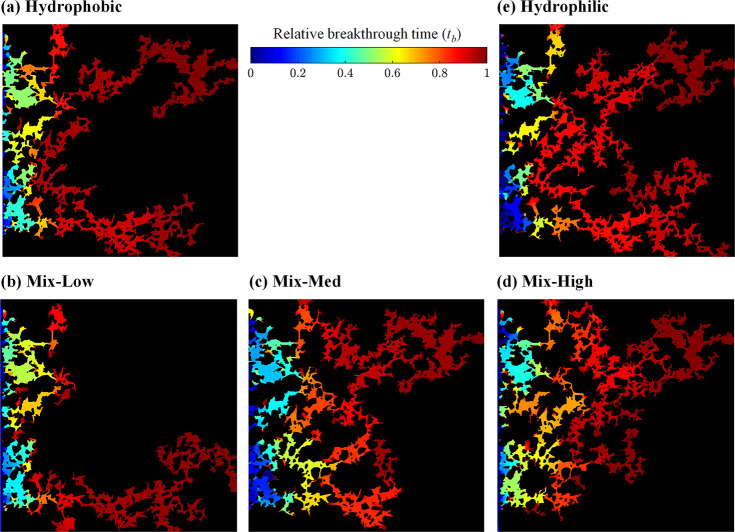
The saturation profiles exhibited a stepwise nature, where water saturation remained constant for an extended period before rapidly increasing, as shown in Figure 7b,c. This behavior was previously described as devil’s staircase-like.62 The sharp stepwise increase in saturation corresponds to distinct pore-filling events, while the stagnant saturation periods resemble pressure buildups along resting static menisci. The fractal nature of the saturation curves and the underlying pore-filling events dominating the displacement dynamics are highlighted in Figure 8. The breakthrough water distributions for all five cases are shown. The color scale reflects the spatial fluid propagation over time. Connected regions of constant color resemble pore-filling events. The breakthrough patterns revealed a flow regime dominated by invasion percolation, where fluid propagation occurs through pressure-driven pore-scale burst events.16 As shown in Figure 8, burst-driven pore filling is represented by uniform color zones, predominantly occurring in hydrophobic pore throats. In contrast, hydrophilic throats encourage cooperative pore-body filling, resulting in more interconnected fluid displacement. All cases exhibit unique sequences of pore filling and distinct temporal displacement patterns. Given that all five models have the same rock pattern, the pivotal impact of wettability alteration on the phase distribution becomes evident. The saturation invasion trend is consistent with the saturation curves depicted in Figure 7b.
Figure 8.
Color maps depicting the breakthrough water distributions for all five cases: (a) hydrophobic, (b) Mix-Low, (c) Mix-Med, (d) Mix-High, and (e) hydrophilic. The color scale represents the spatial propagation of fluid over time where connected areas of uniform color illustrate cooperative pore-filling events, while discontinuous color interfaces signify pressure buildup along static menisci.
We note that we did not observe the occurrence of aqueous corner menisci and snap-off phenomena in all of the wettability cases. According to Blunt (2017), the condition for spontaneous capillary pressure-driven corner menisci formation is given by,
| 1 |
where β is the pore corner half angle and θR is the menisci contact angle.63 Here, the pore corner half angles are β = 45° as induced through the silicon dry-etching method and the subsequent rectangular pore cross-section. Furthermore, the static contact angle of water on silicon is as reported above, θR = 50°. Hence, the corner meniscus formation condition is not fulfilled, which is consistent with the observations. Pore-scale filling events and mixed wettability induced fluid pathways are discussed in the subsequent section.
Pore-Scale Observations
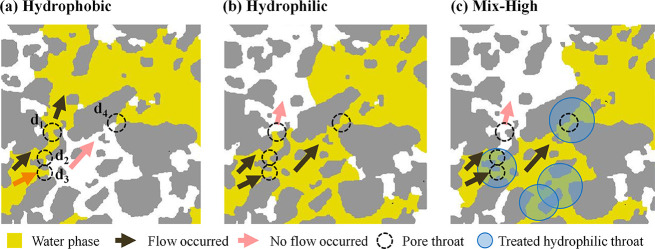
Since pore-scale flow behavior is primarily determined by the balance between viscous and capillary forces, the effect of mixed wettability on displacement was further investigated by observing fluid dynamics at three adjacent conductive pore throats during fluid displacement. These throats, labeled d1, d2, and d3, with sizes 15, 7, and 10 μm, respectively (Figure 9). In the fully hydrophobic scenario, the fluid primarily advanced through the largest pore-throat, d1, upon reaching a junction with three differently sized throats. This was due to d1 having the lowest capillary entry pressure, as depicted in Figure 9a. In contrast, in the fully hydrophilic case, water preferentially invaded the smaller throats, d2 and d3, despite their lower hydraulic conductivity. This behavior, driven by the higher capillary pressure induced by the hydrophilic surface, is illustrated in Figure 9b. Similarly, in the mixed-wettability scenario, where the throats d2 and d3 were selectively treated to be hydrophilic, the fluid favored these smaller throats d2 and d3, resulting in a displacement pattern resembling that of the fully hydrophilic case (Figure 9c). Furthermore, the fluid extended into an even smaller pore throat, d4 (7 μm), bypassing the larger d1, due to the high capillarity generated by the selective treatment of d4.
Figure 9.
Comparative analysis of fluid flow at three neighboring conductive pore throats during fluid displacement under three distinct wettability scenarios: (a) full hydrophobic, (b) full hydrophilic, and (c) mixed wettability (Mix-High). In hydrophobic scenario (a), water flowed through the large pore throat d1, avoiding smaller throats d2 and d3 due to their higher capillary entry pressures. In hydrophilic scenario (b), water flowed through the smaller throats d2 and d3, driven by capillary imbibition. In Mix-High scenario (c), the mixed-wet model demonstrated a similar behavior to hydrophilic scenario (b), water similarly favored throats d2, d3, followed by d4, while avoiding the larger throat d1. This behavior is attributed to the hydrophilic treatment applied to smaller throats.
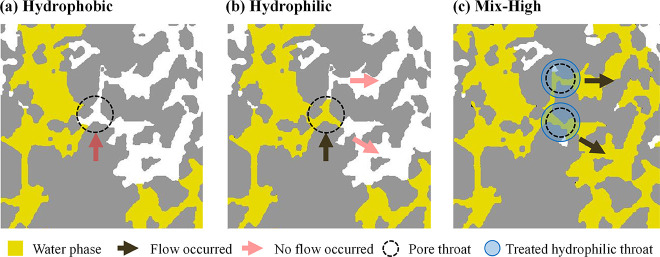
Figure 10 compares flow behaviors across the same pore throat branching under three different wettability conditions: (a) hydrophobic, (b) hydrophilic, and (c) mixed wettability in the Mix-High configuration. In the uniform wettability cases (Figure 10a and b), consistent capillary pressure across throats created flow barriers at critical branching points, hindering fluid progression, and potentially reducing sweep efficiency. Conversely, the mixed wettability case redistributed capillary pressures by varying wettability at specific pore throats, facilitating fluid flow through certain throats and improving sweep efficiency, as shown in Figure 10c. This highlights how mixed-wettability systems can exhibit substantially different behaviors compared to uniform wettability systems, with displacement and sweep efficiencies that may lie outside the range defined by fully hydrophobic or fully hydrophilic conditions.
Figure 10.
Analysis of flow behavior across the same pore throat branching under different wettability conditions: (a) hydrophobic, (b) hydrophilic, and (c) mixed wettability Mix-High, demonstrating the influence of uniform and mixed wettability on creating flow barriers and redirecting fluid flow at the pore scale. Notably, mixed wettability case resulted in higher displacement locally, compared to the uniform wettability cases.
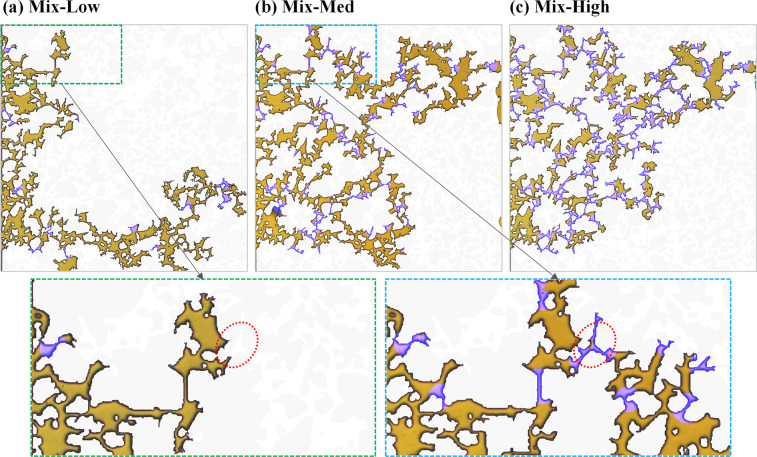
Figure 11 further elucidates the impact of localized wettability adjustments in selected regions of the Mix-Low, Mix-Med, and Mix-High models at the breakthrough time. Enlarged comparisons of regions from the Mix-Low and Mix-Med models clearly demonstrate how targeted wettability alterations significantly redirect fluid flow. The hydrophilic pore throats, highlighted in purple, show how these adjustments lead to distinct flow patterns and variations in displacement efficiency across the models. These observations reaffirm the critical role of pore-scale wettability heterogeneity in shaping displacement dynamics and fluid behavior.
Figure 11.
Water phase distribution at breakthrough times for (a) Mix-Low, (b) Mix-Med, and (c) Mix-High cases, displayed with the water phase in yellow and hydrophilic-treated pore throats highlighted in purple. Distinct variations in water distribution are particularly noticeable between Mix-Low and the other two conditions. Enlarged comparisons of regions from the Mix-Low and Mix-Med models illustrate the influence of localized wettability changes, which can redirect flow, resulting in markedly different flow patterns and displacement efficiencies.
Residual Trapping and Sweep Efficiency
Within this context, it is critical to investigate whether mixed wettability enhances or suppresses trapping and sweep efficiency. This study extends the analysis of mixed wettability to two key phenomena: (i) the bypassed gas phase, representing residual gas trapped within water-flooded zones, and (ii) the volumetric unswept zones, which remain inaccessible to water flooding. These factors provide insight into displacement and volumetric sweep efficiencies across both micro and macro scales.3 Notably, given the abovementioned absence of corner menisci, no trapping by snap-off was observed in this study.
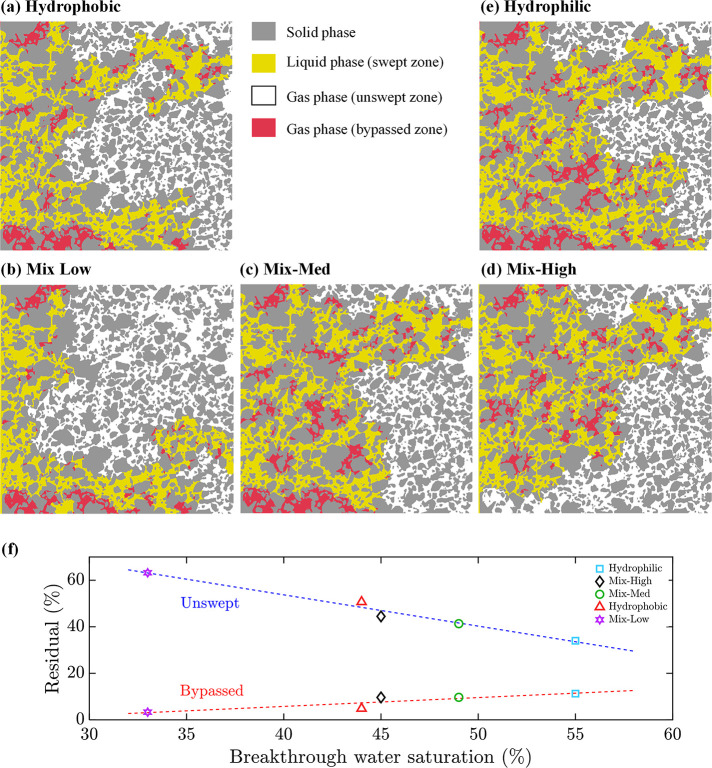
Figure 12a–e illustrates the distribution of the water phase, highlighting the bypassed gas phase in flooded regions as well as the unswept gas phase in unflooded regions. The calculated bypassed and unswept gas phases are plotted against the maximum saturation at breakthrough for all cases in Figure 12f. The hydrophilic case exhibited the highest volumetric sweep efficiency, as reflected in the highest recovery factor. However, it demonstrated the lowest displacement efficiency within the flooded regions. Conversely, the hydrophobic case showed the opposite behavior with higher displacement efficiency but reduced volumetric sweep efficiency.
Figure 12.
Distribution of water and gas phases in microfluidic models with varying wettability conditions. (a–e) illustrate the spatial distribution of the water phase (yellow), highlighting the bypassed gas phase (red) and unswept gas (white) under different wettability scenarios, ranging from hydrophobic to hydrophilic. (f) Flooding performance illustrates the trends of bypassed and unswept phases in relation to breakthrough saturation for each case.
Interestingly, the mixed wettability cases (Mix-High and Mix-Med) improved overall sweeping efficiency compared to the hydrophobic case while reducing the bypassed gas phase compared to the hydrophilic case, leading to higher displacement efficiency. The difference between Mix-High and Mix-Med can be attributed to the spatial distribution of altered wettability in pore throats, as discussed earlier. On the other hand, Mix-Low case resulted in diminished efficiency, indicating that poorly distributed hydrophilic zones can negatively affect recovery. Figure 12f demonstrates a consistent trend in the recovery factor as the degree of hydrophilicity varies across the models. However, it also highlights that the behavior of mixed wettability cases does not necessarily interpolate between the extremes of fully hydrophilic and fully hydrophobic cases. This aligns with observations in relative permeability curves, where mixed wettability systems can exhibit either higher or lower recovery compared to water-wet systems, depending on the interplay between wettability and pore-scale distribution.63
Pressure Drops and Pore Size Distribution
To better understand the effects of wettability and ensure consistency of the results, the pore size distribution was reconstructed using the measured pressure and saturation data. Dynamic pressure measurements served as a proxy for the capillary pressure required to advance the waterfront through the micromodel. The Young–Laplace equation, which typically relates capillary pressure (pc) to equivalent pore size (r), was used to establish a quantitative link between observed pressure changes and the underlying pore structure:
| 2 |
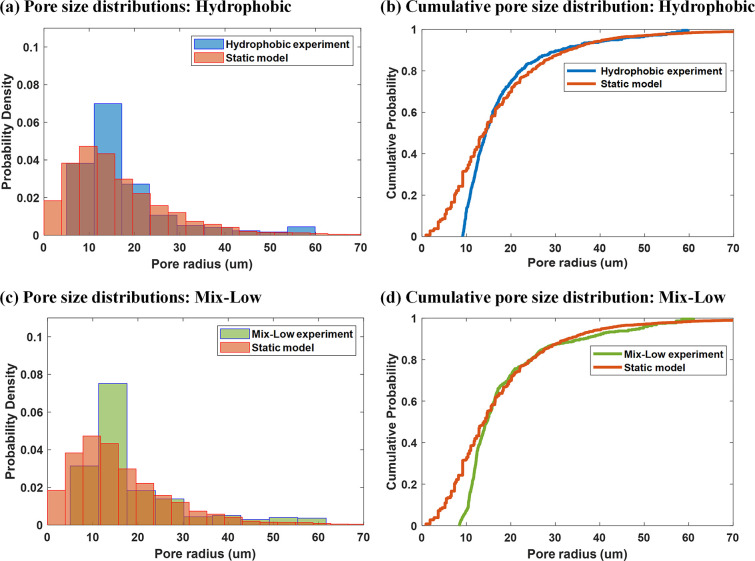
where r (μm) is the effective pore radius, θ is the contact angle reflecting the medium wettability in the water–air system, and γ = 72.8 mN/m is the interfacial tension. It should be noted that this eq 2 does not account for the curvature of the fluid–fluid interface, which can vary with droplet size and surface roughness.64Figure 7d previously demonstrates a linear relationship between the reciprocal of the pressure drop and water saturation, linking the dynamic pressure response to pore sizes for a given wettability condition. Using θ = 113° for the hydrophobic case, the pore size distribution was calculated from eq 2.
Figure 13 presents the pore radius distributions derived from dynamic water injection experiments in contrast with the static geometric model shown in Figure 2. The geometric analysis of static model was based on the micromodel configuration. Figure 13a,b shows both the probabilistic and cumulative pore size distributions for the hydrophobic case. In general, the dynamic and static distributions exhibited strong agreement. However, deviations were observed for smaller pore throats (below 15 μm), where the dynamic model under-represents these tighter pores. This discrepancy arises because smaller pores are less accessible in the hydrophobic scenario due to the higher capillary pressures required for water entry.
Figure 13.
Comparisons of dynamic pore size distributions with those from the static model. (a, b) display the probabilistic and cumulative pore size distributions, respectively, from a hydrophobic model, compared with a static model shown in Figure 2. Similarly, (c, d) present comparisons for the Mix-Low model, highlighting the effects of hydrophilic treatment on tighter pore throats.
For the Mix-Low model, Figure 13c,d presents a similar comparative analysis using θ = 113°, justified by the relatively small proportion of hydrophilic pore throats. In this case, the dynamic model aligns well with the static model, offering an even better representation of smaller pores. This improvement is attributed to the presence of hydrophilic treatments, which lower capillary entry pressures in some regions, thereby enabling better accessibility to smaller pores.
However, such improvements were not observed for the Mix-Med and Mix-High models. In these cases, applying a uniform contact angle across the entire model does not accurately capture the variability in wettability conditions, making the use of the Young–Laplace equation less suitable. This discrepancy highlights the challenges of modeling mixed-wet systems, where heterogeneous wetting properties create a complex interplay between capillary and viscous forces, significantly influencing fluid behavior and pore-filling dynamics. It is also worth noting that the effect of air compressibility on the contact angle was neglected in these experiments, as it was deemed negligible in our setup.
Conclusions
This experimental investigation systematically explored the influence of wettability on immiscible fluid displacement in porous media, employing microfluidic chips featuring rock-like structures with mixed wettability properties. The microfluidic devices were primary hydrophobic, with hydrophilic pore-throats selectively introduced and, for the first time, correlated with pore-throat sizes. This design aimed to replicate the natural spatial distribution of the mixed wettability commonly observed in rock formations. The study was carried out under various wettability conditions, including fully hydrophilic, fully hydrophobic, and three mixed wettability configurations. The findings revealed that pore-level wettability alterations significantly influenced fluid displacement behavior. Each wettability condition, ranging from fully hydrophobic to fully hydrophilic, exhibited distinct fluid dynamics, reflected in variations in the injection time, spatial displacement patterns, and pressure profiles. Combined with geometrical heterogeneity, the pronounced effect of increasing mixed wettability was evident, as it accelerated and facilitated fluid movement through the porous media.
In mixed wettability scenarios, the pressure response and invasion time were strongly influenced by the number and distribution of hydrophilic zones. Notably, higher fractions of hydrophilic zones led to reduced injection time and dynamic pressure for the same injected pore volume. While mixed wettability showed a monotonic effect on invasion time and dynamic pressure, saturation behavior was nonmonotonic, driven by the extent and spatial arrangement of wettability within the matrix. This complexity highlights the challenges in drawing definitive conclusions about mixed wettability impacts due to the complex nature of such systems, with each case exhibiting unique sequences of pore-filling events.
In addition to the critical role of localized wettability alterations in controlling flow paths, a notable variation in flooding efficiency was observed. Mixed-wet configurations with medium to high hydrophilic regions demonstrated enhanced sweep efficiency compared to that of hydrophobic systems and reduced bypassed gas phases relative to hydrophilic cases, ultimately achieving higher displacement efficiency. However, poorly distributed mixed-wettability zones were shown to reduce the efficiency and adversely affect recovery outcomes. Importantly, even a small percentage of mixed-wettability regions can have a profound influence on fluid dynamics.
Overall, the findings revealed that flow behavior in mixed-wettability systems does not simply fall between the extremes of uniform hydrophilic and hydrophobic systems. Instead, mixed-wettability systems exhibit unique displacement dynamics that can either enhance or hinder recovery depending on the specific distribution and balance of wettability conditions. While static and dynamic models face limitations in accurately capturing fluid dynamics in mixed-wet systems, this analysis underscores the importance of pore-scale observations in validating geometric models. Incorporating variable wettability into future modeling frameworks could provide a more accurate representation of heterogeneous wetting properties and their impact on fluid dynamics.
This research emphasizes the crucial role of mixed wettability in shaping fluid displacement and sweep efficiency in porous media. The insights gained here hold significant implications for subsurface energy applications, including enhanced oil recovery, CO2 sequestration, and other fields that depend on effective fluid management in complex porous structures. While this work utilized two contrasting wettability states to explore the impact of mixed wettability, future research could further enhance this approach by incorporating additional wettability conditions and investigating a wider range of fluid pairs, particularly oil–water systems.
Acknowledgments
The authors want to acknowledge EXPEC Advanced Research Center, Saudi Aramco, for the support and for approving this work for publication. Acknowledgment is extended to Nano Fabrication and Thin Film Core Laboratories at King Abdullah University of Science and Technology (KAUST) for supporting and providing the necessary facilities to perform this work. Special thanks to Ulrich Buttner and Qi Liu for their technical discussion and support. Special thanks to KAUST Communication and Publication Services, and to Thom Leach, for the excellent support in drafting the abstract artwork.
Supporting Information Available
The Supporting Information is available free of charge at https://pubs.acs.org/doi/10.1021/acsami.4c13018.
Author Contributions
A.A. was responsible for fabrication, investigation, methodology, visualization, and writing the original draft. M.H. was responsible for investigation, visualization, writing the review, and editing. D.C. was responsible for validation, writing the review, and editing. S.A. was responsible for validation, writing the review, and editing. A.A. was responsible for validation, writing the review, and editing. H.H. was responsible for conceptualization, supervision, validation, writing the review, and editing.
The authors declare no competing financial interest.
Supplementary Material
References
- Cueto-Felgueroso L.; Juanes R. Nonlocal Interface Dynamics and Pattern Formation in Gravity-Driven Unsaturated Flow through Porous Media. Phys. Rev. Lett. 2008, 101 (24), 244504 10.1103/PhysRevLett.101.244504. [DOI] [PubMed] [Google Scholar]
- Alaamri J.; Iglauer S.; Hoteit H. Interplay of Interfacial Tension and Capillarity: Optimizing Surfactant Displacement Efficiency in Reservoirs. J. Mol. Liq. 2024, 395, 123915 10.1016/j.molliq.2023.123915. [DOI] [Google Scholar]
- Lake L.; Johns R.; Rossen B.; Pope G.. Fundamentals of Enhanced Oil Recovery, 1st ed.; Society of Petroleum Engineers: Richardson, TX, 2014. [Google Scholar]
- Chaudhary K.; Bayani Cardenas M.; Wolfe W. W.; Maisano J. A.; Ketcham R. A.; Bennett P. C. Pore-Scale Trapping of Supercritical CO2 and the Role of Grain Wettability and Shape. Geophys. Res. Lett. 2013, 40 (15), 3878–3882. 10.1002/grl.50658. [DOI] [Google Scholar]
- Al-Khdheeawi E. A.; Vialle S.; Barifcani A.; Sarmadivaleh M.; Iglauer S. Impact of Reservoir Wettability and Heterogeneity on CO2-Plume Migration and Trapping Capacity. International Journal of Greenhouse Gas Control 2017, 58, 142–158. 10.1016/j.ijggc.2017.01.012. [DOI] [Google Scholar]
- Basilio E.; Addassi M.; Al-Juaied M.; Hassanizadeh S. M.; Hoteit H. Improved Pressure Decay Method for Measuring CO2-Water Diffusion Coefficient without Convection Interference. Adv. Water Resour 2024, 183, 104608 10.1016/j.advwatres.2023.104608. [DOI] [Google Scholar]
- Zhang H.; Zhang Y.; Al Kobaisi M.; Iglauer S.; Arif M. Effect of Cyclic Hysteretic Multiphase Flow on Underground Hydrogen Storage: A Numerical Investigation. Int. J. Hydrogen Energy 2024, 49, 336–350. 10.1016/j.ijhydene.2023.08.169. [DOI] [Google Scholar]
- Boon M.; Hajibeygi H. Experimental Characterization of H2/Water Multiphase Flow in Heterogeneous Sandstone Rock at the Core Scale Relevant for Underground Hydrogen Storage (UHS). Sci. Rep 2022, 12 (1), 14604. 10.1038/s41598-022-18759-8. [DOI] [PMC free article] [PubMed] [Google Scholar]
- Zhang Y.; Bijeljic B.; Gao Y.; Goodarzi S.; Foroughi S.; Blunt M. J. Pore-scale Observations of Hydrogen Trapping and Migration in Porous Rock: Demonstrating the Effect of Ostwald Ripening. Geophys. Res. Lett. 2023, 50 (7), e2022GL102383 10.1029/2022GL102383. [DOI] [Google Scholar]
- Yang X. G.; Zhang F. Y.; Lubawy A. L.; Wang C. Y. Visualization of Liquid Water Transport in a PEFC. Electrochem. Solid-State Lett. 2004, 7 (11), A408. 10.1149/1.1803051. [DOI] [Google Scholar]
- Nuaimi R. A.; Thankamony R. L.; Liu X.; Cao L.; Zhou Z.; Lai Z. Ultrafiltration Membranes Prepared via Mixed Solvent Phase Separation with Enhanced Performance for Produced Water Treatment. J. Membr. Sci. 2023, 670, 121375 10.1016/j.memsci.2023.121375. [DOI] [Google Scholar]
- Zhu Y.; Wang D.; Jiang L.; Jin J. Recent Progress in Developing Advanced Membranes for Emulsified Oil/Water Separation. NPG Asia Mater. 2014, 6 (5), e101–e101. 10.1038/am.2014.23. [DOI] [Google Scholar]
- Lenormand R.; Touboul E.; Zarcone C. Numerical Models and Experiments on Immiscible Displacements in Porous Media. J. Fluid Mech. 1988, 189, 165–187. 10.1017/S0022112088000953. [DOI] [Google Scholar]
- Lenormand R.; Zarcone C.; Sarr A. Mechanisms of the Displacement of One Fluid by Another in a Network of Capillary Ducts. J. Fluid Mech. 1983, 135 (1), 337. 10.1017/S0022112083003110. [DOI] [Google Scholar]
- Anderson W. G. Wettability Literature Survey - Part 1: Rock/Oil/Brine Interactions and the Effects of Core Handling on Wettability. Journal of Petroleum Technology 1986, 38 (10), 1125–1144. 10.2118/13932-PA. [DOI] [Google Scholar]
- Primkulov B. K.; Pahlavan A. A.; Fu X.; Zhao B.; MacMinn C. W.; Juanes R. Wettability and Lenormand’s Diagram. J. Fluid Mech. 2021, 923, A34. 10.1017/jfm.2021.579. [DOI] [Google Scholar]
- Civan F.Reservoir Formation Damage Fundamentals, Modeling, Assessment, and Mitigation, 4.; Gulf Professional Publishing: California, United States, 2023. 10.1016/C2020-0-03547-4. [DOI] [Google Scholar]
- Tiab D.; Donaldson E. C.. Petrophysics: Theory and Practice of Measuring Reservoir Rock and Fluid Transport Properties; Gulf Professional Publishing: 2015. [Google Scholar]
- Wang J.; Xiao L.; Liao G.; Zhang Y.; Guo L.; Arns C. H.; Sun Z. Theoretical Investigation of Heterogeneous Wettability in Porous Media Using NMR. Sci. Rep. 2018, 8 (1), 13450. 10.1038/s41598-018-31803-w. [DOI] [PMC free article] [PubMed] [Google Scholar]
- Liang C.; Xiao L.; Jia Z.; Guo L.; Luo S.; Wang Z. Mixed Wettability Modeling and Nuclear Magnetic Resonance Characterization in Tight Sandstone. Energy Fuels 2023, 37 (3), 1962–1974. 10.1021/acs.energyfuels.2c03720. [DOI] [Google Scholar]
- Kovscek A. R.; Wong H.; Radke C. J. A Pore-level Scenario for the Development of Mixed Wettability in Oil Reservoirs. AIChE J. 1993, 39 (6), 1072–1085. 10.1002/aic.690390616. [DOI] [Google Scholar]
- Patzek T. W.; Saad A. M.; Hassan A. Multimodal Carbonates: Distribution of Oil Saturation in the Microporous Regions of Arab Formations. Energies 2022, 15 (3), 1243. 10.3390/en15031243. [DOI] [Google Scholar]
- Lebedeva E. V.; Fogden A. Nano-Scale Structure of Crude Oil Deposits on Water-Wet Substrates: Dependence on Aqueous Phase and Organic Solvents. Colloids Surf. A Physicochem Eng. Asp 2011, 380 (1–3), 280–291. 10.1016/j.colsurfa.2011.02.053. [DOI] [Google Scholar]
- Buckley J. S.; Liu Y.; Monsterleet S. Mechanisms of Wetting Alteration by Crude Oils. SPE J. 1998, 3, 54. 10.2118/37230-PA. [DOI] [Google Scholar]
- Salathiel R. A. Oil Recovery by Surface Film Drainage in Mixed-Wettability Rocks. Journal of petroleum technology 1973, 25 (10), 1216–1224. 10.2118/4104-PA. [DOI] [Google Scholar]
- Alhammadi A. M.; Alratrout A.; Singh K.; Bijeljic B.; Blunt M. J. In Situ Characterization of Mixed-Wettability in a Reservoir Rock at Subsurface Conditions. Sci. Rep. 2017, 7 (1), 10753. 10.1038/s41598-017-10992-w. [DOI] [PMC free article] [PubMed] [Google Scholar]
- Fatt I.; Klikoff W. A. Jr. Effect of Fractional Wettability on Multiphase Flow through Porous Media. J. Pet. Technol. 1959, 11 (10), 71–76. 10.2118/1275-G. [DOI] [Google Scholar]
- Skauge A.; Spildo K.; Ho̷iland L.; Vik B. Theoretical and Experimental Evidence of Different Wettability Classes. J. Pet Sci. Eng. 2007, 57 (3–4), 321–333. 10.1016/j.petrol.2006.11.003. [DOI] [Google Scholar]
- Alyafei N.; Blunt M. J. The Effect of Wettability on Capillary Trapping in Carbonates. Adv. Water Resour 2016, 90, 36–50. 10.1016/j.advwatres.2016.02.001. [DOI] [Google Scholar]
- AlRatrout A.; Blunt M. J.; Bijeljic B. Wettability in Complex Porous Materials, the Mixed-Wet State, and Its Relationship to Surface Roughness. Proc. Natl. Acad. Sci. U. S. A. 2018, 115 (36), 8901–8906. 10.1073/pnas.1803734115. [DOI] [PMC free article] [PubMed] [Google Scholar]
- Alhosani A.; Selem A.; Foroughi S.; Bijeljic B.; Blunt M. J. Steady-State Three-Phase Flow in a Mixed-Wet Porous Medium: A Pore-Scale x-Ray Microtomography Study. Adv. Water Resour 2023, 172, 104382 10.1016/j.advwatres.2023.104382. [DOI] [Google Scholar]
- Rücker M.; Bartels W. B.; Singh K.; Brussee N.; Coorn A.; van der Linde H. A.; Bonnin A.; Ott H.; Hassanizadeh S. M.; Blunt M. J.; Mahani H.; Georgiadis A.; Berg S. The Effect of Mixed Wettability on Pore-Scale Flow Regimes Based on a Flooding Experiment in Ketton Limestone. Geophys. Res. Lett. 2019, 46 (6), 3225–3234. 10.1029/2018GL081784. [DOI] [Google Scholar]
- Zou S.; Armstrong R. T.; Arns J. Y.; Arns C. H.; Hussain F. Experimental and Theoretical Evidence for Increased Ganglion Dynamics during Fractional Flow in Mixed-Wet Porous Media. Water Resour Res. 2018, 54 (5), 3277–3289. 10.1029/2017WR022433. [DOI] [Google Scholar]
- Mascini A.; Boone M.; Van Offenwert S.; Wang S.; Cnudde V.; Bultreys T. Fluid Invasion Dynamics in Porous Media with Complex Wettability and Connectivity. Geophys. Res. Lett. 2021, 48 (22), e2021GL095185 10.1029/2021GL095185. [DOI] [Google Scholar]
- AlOmier A.; Sugar A.; Cha D.; Ayirala S.; Alotaibi M.; Yousef A.; Hoteit H.. Novel Mixed Wettability Coating: Application in Microfluidics Fabrication. In SPE Annual Technical Conference and Exhibition?; SPE: 2022, Vol. 2022-October. 10.2118/210141-MS. [DOI] [Google Scholar]
- Kumar Gunda N. S.; Bera B.; Karadimitriou N. K.; Mitra S. K.; Hassanizadeh S. M. Reservoir-on-a-Chip (ROC): A New Paradigm in Reservoir Engineering. Lab Chip 2011, 11 (22), 3785. 10.1039/c1lc20556k. [DOI] [PubMed] [Google Scholar]
- Berejnov V.; Djilali N.; Sinton D. Lab-on-Chip Methodologies for the Study of Transport in Porous Media: Energy Applications. Lab Chip 2008, 8 (5), 689. 10.1039/b802373p. [DOI] [PubMed] [Google Scholar]
- Sugar A.; Serag M.; Buttner U.; Fahs M.; Habuchi S.; Hoteit H. Experimental and Numerical Investigation of Polymer Pore-Clogging in Micromodels. Scientific Reports 2023 13:1 2023, 13 (1), 1–16. 10.1038/s41598-023-34952-9. [DOI] [PMC free article] [PubMed] [Google Scholar]
- Sugar A.; Serag M.; Buttner U.; Habuchi S.; Hoteit H. A Single-Molecule Study on Polymer Fluid Dynamics in Porous Media. Lab Chip 2023, 23 (18), 4104–4116. 10.1039/D3LC00467H. [DOI] [PubMed] [Google Scholar]
- Anbari A.; Chien H. T.; Datta S. S.; Deng W.; Weitz D. A.; Fan J. Microfluidic Model Porous Media: Fabrication and Applications. Small 2018, 14 (18), 1–15. 10.1002/smll.201703575. [DOI] [PubMed] [Google Scholar]
- Cottin C.; Bodiguel H.; Colin A. Influence of Wetting Conditions on Drainage in Porous Media: A Microfluidic Study. Phys. Rev. E 2011, 84 (2), 026311 10.1103/PhysRevE.84.026311. [DOI] [PubMed] [Google Scholar]
- Zhao B.; MacMinn C. W.; Juanes R. Wettability Control on Multiphase Flow in Patterned Microfluidics. Proc. Natl. Acad. Sci. U. S. A. 2016, 113 (37), 10251–10256. 10.1073/pnas.1603387113. [DOI] [PMC free article] [PubMed] [Google Scholar]
- Wang Z.; Pereira J. M.; Sauret E.; Gan Y. Wettability Impacts Residual Trapping of Immiscible Fluids during Cyclic Injection. J. Fluid Mech. 2023, 961, A19. 10.1017/jfm.2023.222. [DOI] [Google Scholar]
- Chen S.; Zhang J.; Mohammed M. Z.; Li F.; Yan Z.; Ding Y. S. Seepage Characteristics of Mixed-Wettability Porous Media on the Phase-Field Model. ACS Omega 2022, 7 (34), 30104–30112. 10.1021/acsomega.2c03143. [DOI] [PMC free article] [PubMed] [Google Scholar]
- Irannezhad A.; Primkulov B. K.; Juanes R.; Zhao B. Characteristics of Fluid–Fluid Displacement in Model Mixed-Wet Porous Media: Patterns, Pressures and Scalings. J. Fluid Mech. 2023, 967, A27. 10.1017/jfm.2023.500. [DOI] [Google Scholar]
- Zhang S.; Li J.; Wang T.; Zhu Q.; Wu K.; Chen Z.; Chen Z.. Modeling of Immiscible Fluid Flow in Mixed-Wetted Porous Media Using the Lattice Boltzmann Method. In ARMA US Rock Mechanics/Geomechanics Symposium; ARMA: 2024. [Google Scholar]
- Ahmadi-Falavarjani A.; Mahani H.; Ayatollahi S. Pore-Scale Simulation of Low-Salinity Waterflooding in Mixed-Wet Systems: Effect of Corner Flow, Surface Heterogeneity and Kinetics of Wettability Alteration. Sci. Rep 2024, 14 (1), 6563. 10.1038/s41598-024-56846-0. [DOI] [PMC free article] [PubMed] [Google Scholar]
- Murison J.; Semin B.; Baret J.-C.; Herminghaus S.; Schröter M.; Brinkmann M. Wetting Heterogeneities in Porous Media Control Flow Dissipation. Phys. Rev. Appl. 2014, 2 (3), 034002 10.1103/PhysRevApplied.2.034002. [DOI] [Google Scholar]
- Hiller T.; Ardevol-Murison J.; Muggeridge A.; Schröter M.; Brinkmann M. The Impact of Wetting-Heterogeneity Distribution on Capillary Pressure and Macroscopic Measures of Wettability. SPE Journal 2019, 24 (01), 200–214. 10.2118/194191-PA. [DOI] [Google Scholar]
- Geistlinger H.; Zulfiqar B.; Schlueter S.; Amro M. New Structural Percolation Transition in Fractional Wet 3D-porous Media: A Comparative Μ-CT Study. Water Resour. Res. 2021, 57 (10), e2021WR030037 10.1029/2021WR030037. [DOI] [Google Scholar]
- Chang C.; Kneafsey T. J.; Wan J.; Tokunaga T. K.; Nakagawa S. Impacts of Mixed-Wettability on Brine Drainage and Supercritical CO2 Storage Efficiency in a 2.5-D Heterogeneous Micromodel. Water Resour Res. 2020, 56 (7), 1–19. 10.1029/2019WR026789. [DOI] [Google Scholar]
- Sun Z.; Torres-Verdín C. Flow Behavior in a Radial Hele-Shaw Cell with Wettability Heterogeneities. Exp. Fluids 2023, 64 (6), 124. 10.1007/s00348-023-03660-5. [DOI] [Google Scholar]
- Irannezhad A.; Primkulov B. K.; Juanes R.; Zhao B. Fluid-Fluid Displacement in Mixed-Wet Porous Media. Phys. Rev. Fluids 2023, 8 (1), L012301 10.1103/PhysRevFluids.8.L012301. [DOI] [Google Scholar]
- Levaché B.; Azioune A.; Bourrel M.; Studer V.; Bartolo D. Engineering the Surface Properties of Microfluidic Stickers. Lab Chip 2012, 12 (17), 3028–3031. 10.1039/c2lc40284j. [DOI] [PubMed] [Google Scholar]
- Masouminia M.; Dalnoki-Veress K.; De Lannoy C. F.; Zhao B. Wettability Alteration of a Thiolene-Based Polymer (NOA81): Surface Characterization and Fabrication Techniques. Langmuir 2022, 39, 2529. 10.1021/acs.langmuir.2c02719. [DOI] [PubMed] [Google Scholar]
- Tabaeh Hayavi M.; Kazemzadeh Y.; Riazi M. Application of Surfactant-Based Enhanced Oil Recovery in Carbonate Reservoirs: A Critical Review of the Opportunities and Challenges. Chem. Phys. Lett. 2022, 806, 139975 10.1016/j.cplett.2022.139975. [DOI] [Google Scholar]
- Rezvani H.; Riazi M.; Tabaei M.; Kazemzadeh Y.; Sharifi M. Experimental Investigation of Interfacial Properties in the EOR Mechanisms by the Novel Synthesized Fe3O4@Chitosan Nanocomposites. Colloids Surf. A Physicochem Eng. Asp 2018, 544, 15–27. 10.1016/j.colsurfa.2018.02.012. [DOI] [Google Scholar]
- AlOmier A.; Cha D.; Ayirala S.; Al-Yousef A.; Hoteit H. Novel Fabrication of Mixed Wettability Micromodels for Pore-Scale Studies of Fluid–Rock Interactions. Lab Chip 2024, 24, 882. 10.1039/D3LC01009K. [DOI] [PubMed] [Google Scholar]
- Saxena N.; Mavko G.; Hofmann R.; Srisutthiyakorn N. Estimating Permeability from Thin Sections without Reconstruction: Digital Rock Study of 3D Properties from 2D Images. Comput. Geosci 2017, 102, 79–99. 10.1016/j.cageo.2017.02.014. [DOI] [Google Scholar]
- Otsu N. A Threshold Selection Method from Gray-Level Histograms. IEEE Trans. Syst. Man Cybern. 1979, 9, 62. 10.1109/TSMC.1979.4310076. [DOI] [Google Scholar]
- Lei W.; Lu X.; Liu F.; Wang M. Non-Monotonic Wettability Effects on Displacement in Heterogeneous Porous Media. J. Fluid Mech. 2022, 942, R5. 10.1017/jfm.2022.386. [DOI] [Google Scholar]
- Thompson A. H.; Katz A. J.; Raschke R. A. Mercury Injection in Porous Media: A Resistance Devil’s Staircase with Percolation Geometry. Phys. Rev. Lett. 1987, 58 (1), 29–32. 10.1103/PhysRevLett.58.29. [DOI] [PubMed] [Google Scholar]
- Blunt M. J.Multiphase Flow in Permeable Media: A Pore-Scale Perspective; Cambridge University Press: 2017, 1–16. 10.1017/9781316145098.002. [DOI] [Google Scholar]
- Aslan S.; Fathi Najafabadi N.; Firoozabadi A. Non-Monotonicity of the Contact Angle from NaCl and MgCl2 Concentrations in Two Petroleum Fluids on Atomistically Smooth Surfaces. Energy Fuels 2016, 30 (4), 2858–2864. 10.1021/acs.energyfuels.6b00175. [DOI] [Google Scholar]
Associated Data
This section collects any data citations, data availability statements, or supplementary materials included in this article.


