Abstract
Introduction
This study aimed to devise a diagnostic algorithm, termed the Refined Radiomics and Deep Learning Features-Guided CatBoost Classifier (RRDLC-Classifier), and evaluate its efficacy in predicting pathological high-grade patterns in patients diagnosed with clinical stage I solid lung adenocarcinoma (LADC).
Methods
In this retrospective study, a total of 371 patients diagnosed with clinical stage I solid LADC were randomly categorized into training and validation sets in a 7:3 ratio. Uni- and multivariate logistic regression analyses were performed to examine the imaging findings that can be used to predict pathological high-grade patterns meticulously. Employing redundancy and the least absolute shrinkage and selection operator regression, a radiomics model was developed. Subsequently, radiomics refinement and deep learning features were employed using a machine learning algorithm to construct the RRDLC-Classifier, which aims to predict high-grade patterns in clinical stage I solid LADC. Evaluation metrics, such as receiver operating characteristic curves, areas under the curve (AUCs), accuracy, sensitivity, and specificity, were computed for assessment.
Results
The RRDLC-Classifier attained the highest AUC of 0.838 (95% confidence interval [CI]: 0.766-0.911) in predicting high-grade patterns in clinical stage I solid LADC, followed by radiomics with an AUC of 0.779 (95% CI: 0.675-0.883), and imaging findings with an AUC of 0.6 (95% CI: 0.472-0.726).
Conclusions
This study introduces the RRDLC-Classifier, a novel diagnostic algorithm that amalgamates refined radiomics and deep learning features to predict high-grade patterns in clinical stage I solid LADC. This algorithm may exhibit excellent diagnostic performance, which can facilitate its application in precision medicine.
Keywords: lung adenocarcinomas, high-grade patterns, clinical stage i solid, radiomics, deep learning, catboost classifier
Introduction
Lung adenocarcinoma (LADC) is the most prevalent malignant tumor globally, with significant mortality and morbidity rates. 1 The 2021 WHO classification for thoracic neoplasms details the histological features of invasive non-mucinous LADC, including lepidic, papillary, acinar, solid, micropapillary, and complex glandular components. 2 LADC often appears as a heterogeneous mix of subtypes, with over 94% of cases showing a combination of pathological elements. 3 Prior research has linked micropapillary or solid components with poor prognoses in LADC patients,4–9 recognized as high-grade patterns by the IASLC grading system. Additionally, some studies suggest that the proportion of high-grade patterns correlates with increased risks of negative outcomes in stage IA LADC cases.7–9
Solid pulmonary nodules (SPNs) are more invasive and diverse than ground glass nodules. Therefore, LADC patients with high-grade patterns more frequently show SPNs in CT scans, and current LADC treatment mainly involves radical resection. 10 Research indicates that LADC with high-grade patterns may require more extensive surgery and aggressive adjuvant chemotherapy.4–6 The heterogeneity of LADC complicates the identification of high-grade patterns, partly due to limitations of preoperative biopsies and intraoperative frozen sections that restrict tissue analysis.11,12 Thus, a precise and non-invasive method is necessary to predict high-grade patterns in LADC patients preoperatively.
Several studies have identified clinico-radiological attributes that may predict high-grade patterns based on CT features and initial clinical data.13,14 However, these attributes are neither representative nor specific, showing significant interobserver variability and unclear utility. Radiomics extracts high-throughput structural and textural features from CT images to describe the morphology and internal characteristics of pulmonary nodules and has been used to assess high-grade patterns in LADC.15,16 However, issues of standardization and interpretability, and the adequacy of the feature number require further attention and improvement. Furthermore, variability in feature engineering and modeling algorithms may limit the robustness and generalizability of radiomics. Deep learning models, including convolutional neural networks, learn abstract feature representations and model complex data through multilayer nonlinear transformations, enhancing the identification and classification accuracy of pulmonary nodules via end-to-end learning with large labeled datasets facilitating high-grade pattern assessments in LADC.17,18 Despite their strong performance in image classification tasks, deep learning models have notable drawbacks.19,20 First, their black-box nature makes their decision-making processes difficult to explain. Second, they are susceptible to adversarial attacks, where even minor perturbations to input images can lead to misclassification. 21 Third, they require extensive parameter tuning, including the selection of network architectures, loss functions, learning rates, and other hyperparameters, demanding significant expertise and time for optimization.
To leverage the advantages and address the limitations of both deep learning and radiomics, we introduced an innovative diagnostic algorithm: the Refined Radiomics and Deep Learning Features-Guided CatBoost Classifier (RRDLC-Classifier). This algorithm synergistically integrates pre-existing radiomic features with extracted deep-learning features to enhance model accuracy and stability, thereby improving diagnostic efficiency. Furthermore, the RRDLC-Classifier has the potential to elucidate the biological dynamics of LADC and inform treatment protocols, including surgical decisions regarding lymph node dissection, thus promoting personalized therapies.
Materials and Methods
We performed a retrospective analysis of surgically excised samples of LADCs at the Hunan Cancer Hospital from January 2018 to June 2022. This study has been approved by the Institutional Review Board (IRB) under approval number [KYJJ-2022-143]. All research activities were conducted in strict adherence to ethical standards and in compliance with IRB guidelines, ensuring the protection of participants’ rights. Due to the retrospective nature of the study, informed consent from the participants was waived. The reporting of this study conforms to TRIPOD guidelines. 22
Inclusion and Exclusion Criteria
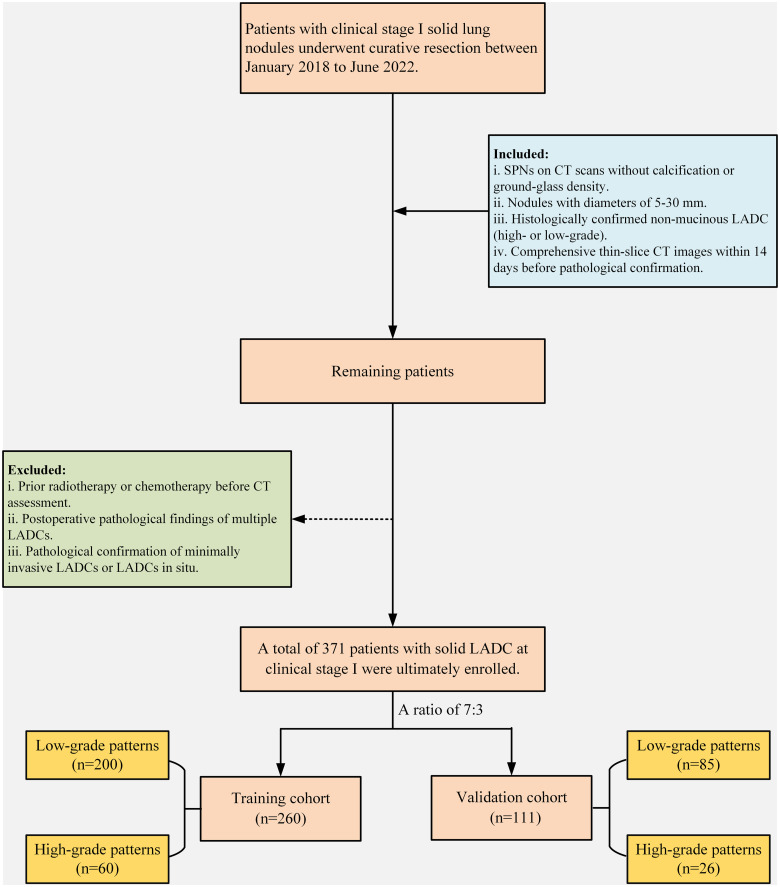
The inclusion criteria were as follows: (1) identification of SPNs on CT scans, lacking calcification and free of ground-glass density; (2) nodules with diameters between 5 mm and 30 mm; (3) histological confirmation of non-mucinous LADC post-operation, categorized into high- and low-grade patterns; and (4) comprehensive thin-slice CT images (0.55−0.625 mm) obtained within 14 days before pathological confirmation. The exclusion criteria included (1) prior radiotherapy or chemotherapy before CT assessment, (2) postoperative pathological findings of multiple LADCs, and (3) pathological indications of minimally invasive LADCs or LADCs in situ. The patient selection process is shown in Figure 1. After applying the inclusion and exclusion criteria, the final participant was enrolled in the study. Subsequently, the study participants were randomly assigned in a 7:3 ratio into the training and validation cohorts.
Figure 1.
Schematic representation of the patient enrollment process.
Acquisition of CT Images
Non-contrast chest CT scans were performed using helical CT scanners equipped with 64-128 detectors, specifically the SOMATOM Definition AS + (Siemens Healthineers, Germany) and the IQon-Spectral CT (Philips Healthcare, Netherlands). The imaging parameters included a tube voltage of 120 kV and a tube current-time product of 180−280 mA, with a matrix size of 512 × 512. Additionally, for image reconstruction, the syngoMMWP software was used for the SOMATOM scanner, while the IQon-Spectral CT utilized the Intellispace Portal. The reconstruction process employed a standard algorithm, with slice thickness and intervals varying between 0.55 mm and 0.625 mm.
Assessment of Imaging Findings
After completing the CT scans, the image data were transferred to a workstation for postprocessing. Multiplanar reconstruction was used to establish lung and mediastinal windows for further analysis. The lung window width ranged from 1500 mm to 2000 mm, with levels from −450 HU to −700 HU. The mediastinal window width varied from 250 HU to 350 HU, with levels between 35 HU and 50 HU. CT image analysis included evaluating various morphological features, such as shape, spiculation, boundary, lobulation, vascular convergence, pleural indentation, and vacuole signs. Clinical baseline data, including pathological diagnosis, age, and sex, were also considered. Two thoracic radiologists, each with over a decade of chest CT imaging experience, independently reviewed the CT findings. Blinded to clinical and histological details, they resolved any qualitative assessment discrepancies through consensus discussions.
Radiomic Features Extraction and Refining
For segmenting lesions, acquired lung CT images were imported into 3D Slicer (version 4.6; https://www.slicer.org). A board-certified cardiothoracic radiologist with 12 years of experience in interpreting and analyzing medical images manually delineated the region of interest and the three-dimensional lesion encompassing the tumor to ensure accuracy and reliability.
Given that we incorporated CT images from multiple hospitals and utilized various CT protocols, we implemented a comprehensive image preprocessing pipeline aimed at mitigating the variability associated with different CT scanners and acquisition parameters. This pipeline included several key steps. First, we performed image resampling using the PyRadiomics package within the Python programming environment to standardize the voxel spacing to 1 × 1 × 1 mm³ (x, y, z). The resampling algorithm employed was based on the B-spline curve, with the interpolator set to sitkBSpline (=3), ensuring smooth and accurate interpolation of the image data. Next, we adjusted the bin width to partition the pixel intensity range of 0 to 255 into five intervals. This binning approach effectively discretized the intensity values, thereby reducing the dimensionality of the feature space and facilitating subsequent analysis.
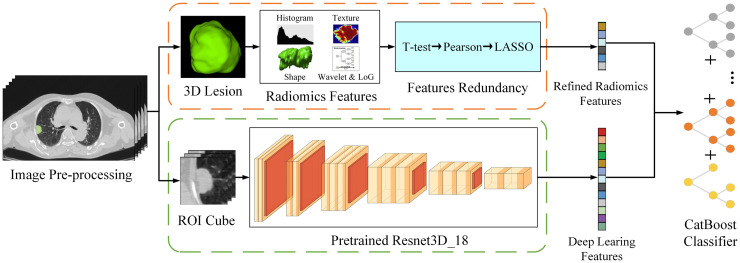
Then, radiomic features were extracted from both the original images and those processed with Laplacian of Gaussian (LoG) filtering using sigma values of 2, 3, 4, and 5, as well as wavelet filtering applied in eight directions. The extracted radiomics features included first-order statistics, shape-based metrics, the gray level dependence matrix, the gray level co-occurrence matrix, the gray level run length matrix, the gray level size zone matrix, and the neighboring gray-tone difference matrix. Overall, 1239 features were extracted for each patient, with the radiomics features extraction process grounded in mathematical formulas.
To improve robustness and reduce redundancy, we used t-tests, correlation analysis, and the least absolute shrinkage and selection operator (LASSO) algorithm. Initially, a t-test was used to identify features with P-values > .05. Subsequently, Pearson's correlation analysis was employed to remove redundant features with a correlation coefficient (r) ≥ 0.90. The LASSO algorithm, effective for high-dimensional data regression, was used to isolate the most influential features (Supplementary Figure 1). These reduction methods are supported by solid mathematical theory. Ten-fold cross-validation (Supplementary Figure 2) was used to determine the optimal lambda (λ) value, excluding features with coefficients <0.01, before constructing the radiomic model.
Deep Learning Features Extraction
Given the limited medical data available, developing a compact deep-learning model based on pre-training is imperative. This study adopted the pre-trained ResNet3D_18 model from MedicalNet,23,24 because only a few pre-trained networks for 3D classification tasks are available. However, the pre-trained network was originally designed for segmentation tasks. Therefore, we adapted its structure by maintaining the encoding part to extract feature images and removed the subsequent deconvolution layer. The input cubes of the pre-trained ResNet3D_18 for deep learning feature extraction had a size of 32 × 32 × 32 voxels, which were cropped at the same center as the 3D lesion. The input image cube was encoded using the pre-trained ResNet3D_18 to obtain 512 deep-learning features. In the present study, only the pre-trained ResNet3D_18 was used to extract deep features and network training was not involved. PyTorch 1.7.1 and Python 3.7.7 were used to implement the feature extraction.
Development of RRDLC-Classifier
Figure 2 illustrates the flowchart depicting the development process of the RRDLC-Classifier. The present study involves a three-stage process where we mathematically extracted and refined radiomics features, which were then combined with high-throughput semantic features obtained from pre-trained neural networks. The stages are as follows: (1) extraction and refinement of radiomics features based on 3D lesions, (2) extraction of deep learning features using a pre-trained model along with cropped image cubes, and (3) application of a machine learning algorithm to refine these features for predicting high-grade patterns in clinical stage I solid LADC.
Figure 2.
Illustration of the study design framework.
This integration expressed the diverse information of the CT images from more aspects, which was conducive to the construction of the final classification model. Additionally, we improved the logistic regression classifier commonly used in medical research by employing a more advanced CatBoost Classifier.25,26 CatBoost is a gradient-boosting algorithm library that can effectively handle categorical features. We further built a combined model by integrating selected radiomic features and deep learning features and feeding them to the CatBoost Classifier.25,26 Our goal was to develop a robust and accurate combined model to predict high-grade patterns in clinical stage I solid LADC.
Statistical Analyses and Model Evaluation
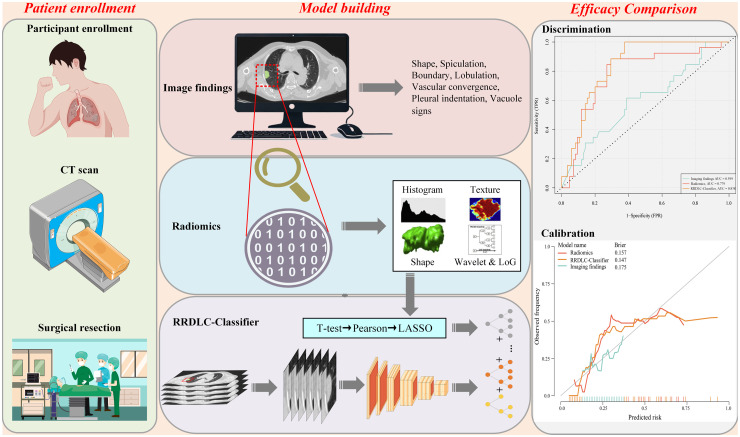
Figure 3 illustrates the study design, covering patient enrollment, the construction of three diagnostic models (image finding, radiomics, and RRDLC-Classifier), and the comparison of diagnostic efficacy. The training cohort was used for both model training and parameter tuning, whereas the validation set was employed to evaluate the performance of the final model. Python version 3.7.7 was used for all data processing and statistical analyses, leveraging the scikit-learn 0.23.2 package. The receiver operating characteristic (ROC) curve was used to evaluate the predictive performances of imaging findings, radiomics, and the RRDLC-Classifier. Various metrics, including the area under the curve (AUC), accuracy, sensitivity, and specificity, were further employed to assess the model's performance. Decision curve analysis (DCA) was also used to assess the clinical net benefit. The significance of the disparity between the RRDLC-Classifier model and others was assessed using the DeLong method, with statistical significance set at 0.05.
Figure 3.
The flow chart of the study design.
Results
We enrolled 371 patients with clinical stage I solid LADC in this study. Of these, 155 (41.8%) were male, with a median age of 61 (interquartile range, 54-66) years. Pathologically, 86 patients (23.2%) had high-grade patterns, and 285 patients (76.8%) had low-grade patterns. We categorized the patients into training (260) and validation (111) groups in a 7:3 ratio. Table 1 summarizes the cohort characteristics, showing no significant differences between the groups (P > .05).
Table 1.
Comparison of Clinical-radiological Characteristics Between the Training and Validation Cohorts.
| Variables | Total (n = 371) | Training cohort (n = 260) | Validation cohort (n = 111) | P-value |
|---|---|---|---|---|
| Location, n (%) | .1 | |||
| RUL | 104 (28) | 68 (26.2) | 36 (32.4) | |
| RLL | 88 (23.7) | 55 (21.2) | 33 (29.7) | |
| RML | 32 (8.6) | 26 (10) | 6 (5.4) | |
| LUL | 92 (24.8) | 68 (26.2) | 24 (21.6) | |
| LLL | 55 (14.8) | 43 (16.5) | 12 (10.8) | |
| Boundary, n (%) | 1.000 | |||
| Ill-Defined | 86 (23.2) | 60 (23.1) | 26 (23.4) | |
| Well-Defined | 285 (76.8) | 200 (76.9) | 85 (76.6) | |
| Shape, n (%) | 1.000 | |||
| Irregular | 210 (56.6) | 147 (56.5) | 63 (56.8) | |
| Regular | 161 (43.4) | 113 (43.5) | 48 (43.2) | |
| Lobulation, n (%) | 1.000 | |||
| Absence | 70 (18.9) | 49 (18.8) | 21 (18.9) | |
| Presence | 301 (81.1) | 211 (81.2) | 90 (81.1) | |
| Spiculation, n (%) | .765 | |||
| Absence | 89 (24) | 64 (24.6) | 25 (22.5) | |
| Presence | 282 (76) | 196 (75.4) | 86 (77.5) | |
| Vascular convergence sign, n (%) | .463 | |||
| Absence | 105 (28.3) | 77 (29.6) | 28 (25.2) | |
| Presence | 266 (71.7) | 183 (70.4) | 83 (74.8) | |
| Vacuole sign, n (%) | .029 | |||
| Absence | 298 (80.3) | 217 (83.5) | 81 (73) | |
| Presence | 73 (19.7) | 43 (16.5) | 30 (27) | |
| Pleural indentation, n (%) | 1.000 | |||
| Absence | 68 (18.3) | 48 (18.5) | 20 (18) | |
| Presence | 303 (81.7) | 212 (81.5) | 91 (82) | |
| Sex, n (%) | 1.000 | |||
| Male | 155 (41.8) | 109 (41.9) | 46 (41.4) | |
| Female | 216 (58.2) | 151 (58.1) | 65 (58.6) | |
| Age, Median (Q1, Q3) | 61 (54, 66) | 61 (54, 66) | 60 (54, 67) | .574 |
| Size(mm), Median (Q1, Q3) | 20.4 (14.8, 26.4) | 20.6 (15.1, 26.3) | 20.4 (14.3, 26.8) | .714 |
| Pathological diagnosis, n (%) | 1.000 | |||
| Low-grade patterns | 285 (76.8) | 200 (76.9) | 85 (76.6) | |
| High-grade patterns | 86 (23.2) | 60 (23.1) | 26 (23.4) |
Abbreviation: LUL Left Upper Lobe, LLL Left Lower Lobe, RUL Right Upper Lobe, RML Right Middle Lobe, RLL Right Lower Lobe.
Imaging Finding Evaluation
Table 2 presents the outcomes of both uni- and multivariate logistic analyses of the predictive capacity of the imaging findings for high-grade patterns in clinical stage I solid LADC. The multivariate logistic analysis identified pleural indentation (Reference: absence; odds ratio [OR], 3.69; 95% confidence interval [CI], 1.25-10.93; P = .018), sex (Reference: male; OR, 0.5; 95% CI, 0.27-0.90; P = .022), and size (OR, 1.03; 95% CI, 0.99-1.08; P = .049) as independent predictors of high-grade patterns in clinical stage I solid LADC. The imaging findings achieved an AUC of 0.599 (95% CI: 0.472-0.726).
Table 2.
Univariate and Multivariate Logistic Analysis for Predicting High-Grade Patterns in Clinical Stage I Solid Lung Adenocarcinoma.
| Low-grade patterns | High-grade patterns | Univariate logistic | Multivariate logistic | ||
|---|---|---|---|---|---|
| Variables | OR (95%CI, p-value) | OR (95%CI, p-value) | |||
| Location | RUL | 50 (25%) | 18 (30%) | ||
| RLL | 40 (20%) | 15 (25%) | 1.04 (0.47-2.32, P = .920) | ||
| RML | 20 (10%) | 6 (10%) | 0.83 (0.29-2.40, P = .736) | ||
| LUL | 52 (26%) | 16 (26.7%) | 0.85 (0.39-1.86, P = .692) | ||
| LLL | 38 (19%) | 5 (8.3%) | 0.37 (0.12-1.07, P = .067) | ||
| Boundary | Ill-Defined | 48 (24%) | 12 (20%) | ||
| Well-Defined | 152 (76%) | 48 (80%) | 1.26 (0.62-2.57, P = .520) | ||
| Shape | Irregular | 114 (57%) | 33 (55%) | ||
| Regular | 86 (43%) | 27 (45%) | 1.08 (0.61-1.94, P = .784) | ||
| Lobulation | Absence | 37 (18.5%) | 12 (20%) | ||
| Presence | 163 (81.5%) | 48 (80%) | 0.91 (0.44-1.88, P = .794) | ||
| Spiculation | Absence | 49 (24.5%) | 15 (25%) | ||
| Presence | 151 (75.5%) | 45 (75%) | 0.97 (0.50-1.90, P = .937) | ||
| Vascular convergence sign | Absence | 63 (31.5%) | 14 (23.3%) | ||
| Presence | 137 (68.5%) | 46 (76.7%) | 1.51 (0.77-2.95, P = .226) | ||
| Vacuole Sign | Absence | 166 (83%) | 51 (85%) | ||
| Presence | 34 (17%) | 9 (15%) | 0.86 (0.39-1.92, P = .715) | ||
| Pleural indentation | Absence | 44 (22%) | 4 (6.7%) | ||
| Presence | 156 (78%) | 56 (93.3%) | 3.95 (1.36-11.49, P = .012) | 3.69 (1.25-10.93, P = .018) | |
| Sex | Male | 76 (38%) | 33 (55%) | ||
| Female | 124 (62%) | 27 (45%) | 0.50 (0.28-0.90, P = .020) | 0.50 (0.27-0.90, P = .022) | |
| Age | Mean ± SD | 59.1 ± 10.0 | 60.8 ± 9.2 | 1.02 (0.99-1.05, P = .227) | |
| Size | Mean ± SD | 20.2 ± 6.7 | 22.1 ± 5.9 | 1.05 (1.00-1.09, P = .09) | 1.03 (0.99-1.08, P = .049) |
Abbreviation: LUL Left Upper Lobe, LLL Left Lower Lobe, RUL Right Upper Lobe, RML Right Middle Lobe, RLL Right Lower Lobe.
Performance of the Radiomics Model
A total of 1239 radiomics features were initially extracted from each SPN. After redundancy assessment using t-tests, 149 features were retained. Subsequently, following Pearson correlation analysis, 144 features were deemed suitable for integration into LASSO regression using 5-fold cross-validation (λ=0.027), ultimately identifying nine key features (Supplementary Figure 3). This radiomic model achieved an AUC of 0.779 (95% CI: 0.675-0.883).
Comparison of Diagnostic Performance among Different Models
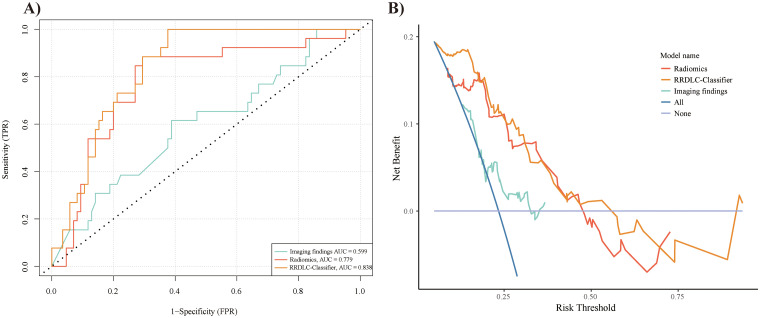
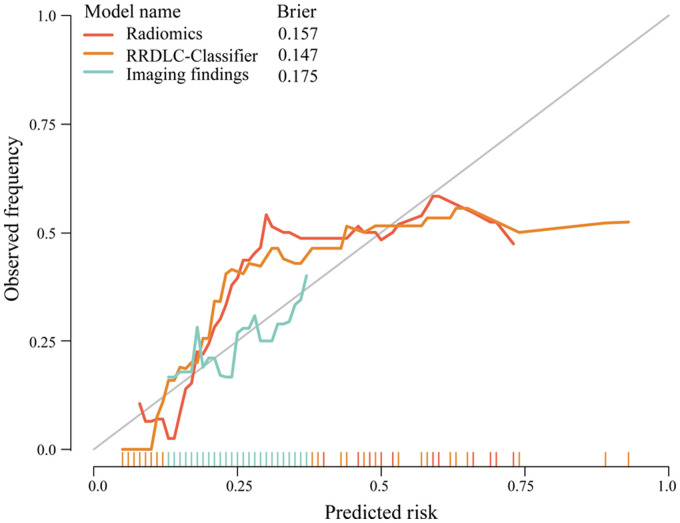
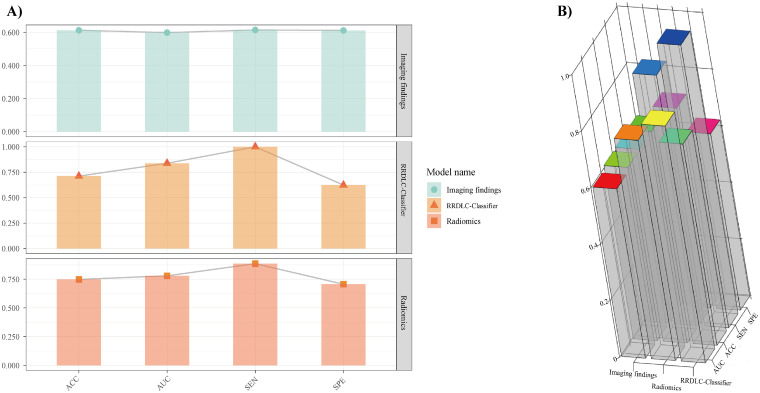
Table 3 shows the discriminative abilities of the models, while Figure 4A and B provide a visual representation of the ROC and DCA comparisons. Analysis of the DCA revealed that the RRDLC-Classifier achieved a better overall net benefit than the imaging findings and radiomics model. The ROC curve evaluation demonstrated that the RRDLC-Classifier achieved significantly better performance than both imaging findings (with a statistically significant DeLong test P-value < .001) and the radiomics model (with a DeLong test p-value of 0.029, indicating significance). Furthermore, the radiomics model showed superiority over imaging findings, as evidenced by a DeLong test p-value of 0.013. The RRDLC-Classifier achieved a remarkable AUC of 0.838 (95% CI: 0.766-0.911). The calibration curve showed strong calibration abilities for the imaging findings, radiomics, and the RRDLC-Classifier (Figure 5). The visual representation of diagnostic performance metrics (AUC, accuracy, sensitivity, and specificity) for the model is shown in Figure 6.
Table 3.
Evaluating Diagnostic Performance Across Models in Predicting High-Grade Patterns in Clinical Stage I Solid Lung Adenocarcinoma.
| Models | AUC | Accuracy | Sensitivity | Specificity |
|---|---|---|---|---|
| Image finding | 0.599 (0.472-0.726) | 0.613 | 0.615 | 0.612 |
| Radiomics | 0.779 (0.675-0.883) | 0.748 | 0.885 | 0.706 |
| RRDLC-Classifier | 0.838 (0.766-0.911) | 0.712 | 1.000 | 0.624 |
Abbreviation: AUC, area under the curve; RRDLC-Classifier, refined radiomics and deep learning features guided catboost classifier.
Figure 4.
Receiver operating characteristic (ROC) curve (A) and decision curve analysis (DCA) curve (B) demonstrating the performance of radiomics, RRDLC classifier, and imaging findings.
Figure 5.
Calibration curve displaying the concordance between predicted and observed outcomes for radiomics, RRDLC classifier, and imaging findings.
Figure 6.
(A) 2D histogram and (B) 3D histogram visualization illustrating the diagnostic accuracy of radiomics, the RRDLC classifier, and imaging findings in predicting high-grade patterns in clinical stage I solid lung adenocarcinoma.
Discussion
This study represents a pioneering attempt to devise a novel diagnostic algorithm, termed the RRDLC-Classifier, integrating refined radiomics and deep learning features through machine learning algorithms to predict high-grade patterns in clinical stage I solid LADC. Significantly, the RRDLC-Classifier surpassed both the radiomics and image findings in terms of performance.
Numerous studies have identified clinico-radiological features, such as tumor size, margin, CT density, and lobulation, as predictors of high-grade patterns by analyzing CT imaging findings and baseline clinical information.13,14 In the present study, multivariate analysis identified tumor size, pleural indentation, and sex as independent predictors of high-grade patterns in clinical stage I solid LADC. Tumor size is widely acknowledged as a criterion for evaluating the invasiveness of early lung cancer malignancy 27 and is, therefore, included in the eighth edition of TNM staging. 10 A higher incidence of LADC among females than among males has also been previously reported. However, a larger proportion of men than women exhibit high-grade patterns of clinical stage I solid LADC. 28 Males commonly have a higher smoking rate than females, and the incidence of lung cancer among male smokers is significantly elevated. Prolonged smoking causes lung tissue damage, which increases the risk of lung cancer progression. 29 Additionally, some evidence suggests that estrogen may play a role in reducing the risk of lung cancer.30,31 Pleural indentation in lung cancer occurs as the tumor grows, exerting pressure on the pleura and causing concave deformation. Tumor invasion into the pleura and the associated inflammation further exacerbate the indentation, leading to characteristic structural changes. Snoeckx et al 32 found that pleural retraction is highly suggestive of the malignant nature of solitary pulmonary nodules. However, in the present study, imaging findings showed a lower performance, with an AUC of 0.6. This may be due to CT imaging findings lacking representativeness and the characteristic diagnostic information not being fully explored and elaborated.
The radiomics approach, which extracts quantitative radiomics features, offers a distinct advantage over mere imaging findings in the evaluation of tumor imaging phenotypes. These models reveal additional heterogeneous factors that are not visually discernible. In our study, the radiomics model showed significant predictive power, with a notably higher AUC (0.779) than the imaging findings (0.599). Furthermore, we integrated refined radiomics and deep learning features using machine learning algorithms to predict high-grade patterns in clinical stage I solid LADC. The RRDLC-Classifier achieved an AUC of 0.838, outperforming both the imaging findings (Delong test, P < .001) and the radiomics model (Delong test, P = .029). We attributed this disparity to several factors, largely because the RRDLC-Classifier overcomes the limitations of both deep learning and radiomic methods while integrating their advantages. First, radiomics offers feature richness and interpretability, extracts diverse features from medical images, and aids in understanding the decision-making process of the model. This facilitates the interpretation of predictive results and supports clinical decision-making. Second, using radiomic-extracted features as inputs for deep learning models accelerates training, significantly reducing time and computational resources. Compared to the direct use of raw images, extracted features often have lower dimensions and clearer semantics, thereby enhancing training efficiency. Finally, we apply the CatBoost algorithm to refine both deep learning and radiomic features for the classification task. CatBoost enhances categorical data handling and boosting by converting categories into numerical features using frequencies and hyperparameters. It uses oblivious trees to efficiently manage categorical variables and explore feature relationships, increasing feature dimensionality. Sorted boosting minimizes noise, prevents gradient bias and prediction shifts, reduces overfitting, and improves accuracy and generalization.25,26
This study had some limitations. First, the retrospective design may have introduced selection bias, which could affect the reliability of the findings. Therefore, future studies should adopt a prospective approach and further divide the data into distinct training, validation, and test sets to better assess the model's feasibility. Second, the training and validation cohorts in the present study had limited sample sizes. Future research should aim to incorporate larger sample sizes to enhance the efficacy of the predictive model. Finally, this investigation focused exclusively on clinical stage I solid lung adenocarcinoma, which may limit the applicability of our results to different disease stages. Future research should aim to include broader enrollment criteria, encompassing both solid and ground-glass nodules, as well as different disease stages, to ensure a balanced dataset for subsequent investigations.
Conclusion
In conclusion, the RRDLC-Classifier, which integrates radiomics and deep learning, can integrate the strengths of both approaches, marking a significant advancement in predicting high-grade patterns in clinical stage I solid LADC. Its superiority over existing models underscores its practical utility in real-world clinical scenarios, where it could be used to facilitate the identification of optimal surgical strategies tailored to individual patient needs.
Supplemental Material
Supplemental material, sj-docx-1-tct-10.1177_15330338241308610 for Predicting High-Grade Patterns in Stage I Solid Lung Adenocarcinoma: A Study of 371 Patients Using Refined Radiomics and Deep Learning-Guided CatBoost Classifier by Hong Zheng, Wei Chen, Jun Liu, Lian Jian, Tao Luo and Xiaoping Yu in Technology in Cancer Research & Treatment
Acknowledgments
We would like to extend our sincere appreciation to Editage for their meticulous language editing services, which have significantly enhanced the quality and readability of this manuscript.
Footnotes
Data Availability: The data for this study are available by contacting the corresponding author upon reasonable request.
The authors declared no potential conflicts of interest with respect to the research, authorship, and/or publication of this article.
Funding: The authors disclosed receipt of the following financial support for the research, authorship, and/or publication of this article: This work has been supported by Scientific Research Project of Hunan Provincial Health Commission, Changsha, China (Grant Number: B202309017964).
Compliance with Ethical Requirements: This study design was approved by the Institutional Review Board of Hunan Cancer Hospital Hospital and followed the guidelines of the Declaration of Helsinki.
Informed Consent Statement: The study protocol was approved by the institutional review board and due to the retrospective nature of the study, the informed consent requirement was waived.
ORCID iD: Wei Chen https://orcid.org/0009-0001-9096-1328
Supplemental Material: Supplemental material for this article is available online.
References
- 1.Sung H, Ferlay J, Siegel RL, et al. Global cancer statistics 2020: GLOBOCAN estimates of incidence and mortality worldwide for 36 cancers in 185 countries. CA Cancer J Clin. 2021;71(3):209-249. [DOI] [PubMed] [Google Scholar]
- 2.Nicholson AG, Tsao MS, Beasley MB, et al. The 2021 WHO classification of lung tumors: Impact of advances since 2015. J Thorac Oncol. 2022;17(3):362-387. [DOI] [PubMed] [Google Scholar]
- 3.Hung JJ, Jeng WJ, Chou TY, et al. Prognostic value of the new international association for the study of lung cancer/American thoracic society/European respiratory society lung adenocarcinoma classification on death and recurrence in completely resected stage I lung adenocarcinoma. Ann Surg. 2013;258(6):1079-1086. [DOI] [PubMed] [Google Scholar]
- 4.Morales-Oyarvide V, Mino-Kenudson M. High-grade lung adenocarcinomas with micropapillary and/or solid patterns: A review. Curr Opin Pulm Med. 2014;20(4):317-323. [DOI] [PubMed] [Google Scholar]
- 5.Yanagawa N, Shiono S, Abiko M, et al. The clinical impact of solid and micropapillary patterns in resected lung adenocarcinoma. J Thorac Oncol. 2016;11(11):1976-1983. [DOI] [PubMed] [Google Scholar]
- 6.Mikubo M, Tamagawa S, Kondo Y, et al. Micropapillary and solid components as high-grade patterns in IASLC grading system of lung adenocarcinoma: Clinical implications and management. Lung Cancer. 2024;187:107445. [DOI] [PubMed] [Google Scholar]
- 7.Liu W, Zhang Q, Zhang T, et al. Minor histological components predict the recurrence of patients with resected stage I acinar- or papillary-predominant lung adenocarcinoma. Front Oncol. 2022;12:1090544. [DOI] [PMC free article] [PubMed] [Google Scholar]
- 8.Chen C, Chen ZJ, Li WJ, et al. Impact of minimal solid and micropapillary components on invasive lung adenocarcinoma recurrence. Ann Diagn Pathol. 2022;59:151945. [DOI] [PubMed] [Google Scholar]
- 9.Huang W, Zhang H, Zhang Z, et al. A prognostic nomogram based on a new classification of combined micropapillary and solid components for stage IA invasive lung adenocarcinoma. J Surg Oncol. 2022;125(4):796-808. [DOI] [PubMed] [Google Scholar]
- 10.Van Schil PE, Asamura H, Rusch VW, et al. Surgical implications of the new IASLC/ATS/ERS adenocarcinoma classification. Eur Respir J. 2012;39(2):478-486. [DOI] [PubMed] [Google Scholar]
- 11.Yeh YC, Nitadori J, Kadota K, et al. Using frozen section to identify histological patterns in stage I lung adenocarcinoma of ≤ 3 cm: Accuracy and interobserver agreement. Histopathology. 2015;66(7):922-938. [DOI] [PMC free article] [PubMed] [Google Scholar]
- 12.Trejo Bittar HE, Incharoen P, Althouse AD, et al. Accuracy of the IASLC/ATS/ERS histological subtyping of stage I lung adenocarcinoma on intraoperative frozen sections. Mod Pathol. 2015;28(8):1058-1063. [DOI] [PubMed] [Google Scholar]
- 13.Lederlin M, Puderbach M, Muley T, et al. Correlation of radio- and histomorphological pattern of pulmonary adenocarcinoma. Eur Respir J. 2013;41(4):943-951. [DOI] [PubMed] [Google Scholar]
- 14.Dong H, Yin LK, Qiu YG, et al. Prediction of high-grade patterns of stage IA lung invasive adenocarcinoma based on high-resolution CT features: A bicentric study. Eur Radiol. 2023;33(6):3931-3940. [DOI] [PubMed] [Google Scholar]
- 15.Liu Y, Chang Y, Zha X, et al. A combination of radiomic features, imaging characteristics, and Serum tumor biomarkers to predict the possibility of the high-grade subtypes of lung adenocarcinoma. Acad Radiol. 2022;29(12):1792-1801. [DOI] [PubMed] [Google Scholar]
- 16.Dong H, Wang X, Qiu Y, et al. Establishment and visualization of a model based on high-resolution CT qualitative and quantitative features for prediction of micropapillary or solid components in invasive lung adenocarcinoma. J Cancer Res Clin Oncol. 2023;149(12):10519-10530. [DOI] [PubMed] [Google Scholar]
- 17.Ding H, Xia W, Zhang L, et al. CT-based deep learning model for invasiveness classification and micropapillary pattern prediction within lung adenocarcinoma. Front Oncol. 2020;10:1186. [DOI] [PMC free article] [PubMed] [Google Scholar]
- 18.Chen LW, Yang SM, Chuang CC, et al. Solid attenuation components attention deep learning model to predict micropapillary and solid patterns in lung adenocarcinomas on computed tomography. Ann Surg Oncol. 2022;29(12):7473-7482. [DOI] [PubMed] [Google Scholar]
- 19.Avanzo M, Stancanello J, Pirrone G, et al. Radiomics and deep learning in lung cancer. Strahlenther Onkol. 2020;196(10):879-887. [DOI] [PubMed] [Google Scholar]
- 20.Bi WL, Hosny A, Schabath MB, et al. Artificial intelligence in cancer imaging: Clinical challenges and applications. CA Cancer J Clin. 2019;69(2):127-157. [DOI] [PMC free article] [PubMed] [Google Scholar]
- 21.Khamaiseh Y, Bagagem D, Al-Alaj A, et al. Adversarial deep learning: A survey on adversarial attacks and defense mechanisms on image classification. IEEE Access. 2022; 10: 102266-102291. [Google Scholar]
- 22.Collins GS, Reitsma JB, Altman DG, Moons KG. Transparent reporting of a multivariable prediction model for individual prognosis or diagnosis (TRIPOD): The TRIPOD statement. Br Med J. 2015;350:g7594. doi: 10.1136/bmj.g7594. [DOI] [PubMed] [Google Scholar]
- 23.Chen S, Ma K, Zheng Y. Med3D: Transfer Learning for 3D Medical Image Analysis. ArXiv.2019.
- 24.He K, Zhang X, Ren S, et al. Deep residual learning for image recognition. In: Proceedings of CVPR, 2016, pp.770-778. [Google Scholar]
- 25.Prokhorenkova L, Gusev G, Vorobev A, et al. Catboost: unbiased boosting with categorical features. In: Neural information processing systems, 2018, pp.6639-6649. [Google Scholar]
- 26.Ye G, Wu G, Li K, et al. Development and validation of a deep learning radiomics model to predict high-risk pathologic pulmonary nodules using preoperative computed tomography. Acad Radiol. 2024;31(4):1686-1697. [DOI] [PubMed] [Google Scholar]
- 27.Liu J, Yang X, Li Y, et al. Predicting the invasiveness of pulmonary adenocarcinomas in pure ground-glass nodules using the nodule diameter: A systematic review, meta-analysis, and validation in an independent cohort. Diagnostics (Basel). 2024;14(2):147. [DOI] [PMC free article] [PubMed] [Google Scholar]
- 28.Otoshi T, Nagano T, Park J, et al. The gut microbiome as a biomarker of cancer progression among female never-smokers with lung adenocarcinoma. Anticancer Res. 2022;42(3):1589-1598. [DOI] [PubMed] [Google Scholar]
- 29.Powell HA, Iyen-Omofoman B, Hubbard RB, et al. The association between smoking quantity and lung cancer in men and women. Chest. 2013;143(1):123-129. [DOI] [PubMed] [Google Scholar]
- 30.Tang W, Zhang WQ, Hu SQ, et al. Incidence and risk factors of suicide in patients with lung cancer: A scoping review. Support Care Cancer. 2022;30(4):2945-2957. [DOI] [PubMed] [Google Scholar]
- 31.Stapleford C, Dammann C, Maser E. Sex-specificity in lung cancer risk. Int J Cancer. 2020;146(9):2376-2382. [DOI] [PubMed] [Google Scholar]
- 32.Snoeckx A, Reyntiens P, Desbuquoit D, et al. Evaluation of the solitary pulmonary nodule: Size matters, but do not ignore the power of morphology. Insights Imaging. 2018;9(1):73-86. [DOI] [PMC free article] [PubMed] [Google Scholar]
Associated Data
This section collects any data citations, data availability statements, or supplementary materials included in this article.
Supplementary Materials
Supplemental material, sj-docx-1-tct-10.1177_15330338241308610 for Predicting High-Grade Patterns in Stage I Solid Lung Adenocarcinoma: A Study of 371 Patients Using Refined Radiomics and Deep Learning-Guided CatBoost Classifier by Hong Zheng, Wei Chen, Jun Liu, Lian Jian, Tao Luo and Xiaoping Yu in Technology in Cancer Research & Treatment


