Abstract
Background
Lower extremity deep vein thrombosis (LEDVT) is a common complication after orthopedic surgery. Currently, a reliable assessment tool is lacking to evaluate the risk of postoperative LEDVT in patients undergoing lumbar fusion surgery. This study aims to explore the risk factors for LEDVT formation after lumbar fusion surgery and establish a predictive model for it.
Methods
Data of patients admitted for multi-center spinal surgery from May 2022 to September 2023 were retrospectively collected. Patients were divided into DVT and non-DVT groups based on the occurrence of LEDVT after surgery. Potential risk factors were initially identified through intergroup comparative analysis and single-factor logistic regression, which were considered candidate indicators. LASSO regression was applied to select candidate indicators, and the filtered variables were included in a multivariable logistic regression model. Nomogram and dynamic nomogram were constructed to visualize the model, and the model was subsequently validated.
Results
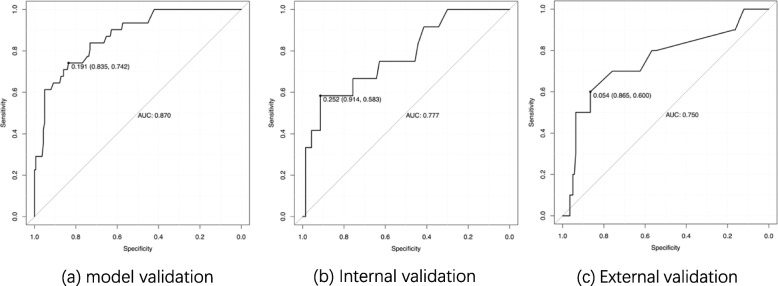
Factors including weakened lower extremity muscle strength, intraoperative blood loss, walking impairment, and Venous reflux/ Varicose veins were included in the multivariable logistic regression model. The results showed that the model had an area under the receiver operating characteristic curve of 0.870, 0.777 and 0.750 for the training set, internal validation set, and external validation set, respectively. Nomograms and web-based dynamic nomograms were created based on the multivariable logistic regression model. The model exhibited good performance in calibration curves and decision analysis.
Conclusion
The study identified weakened lower extremity muscle strength, intraoperative blood loss, walking impairment, and Venous reflux/ Varicose veins as risk factors for LEDVT formation following lumbar fusion surgery. The predictive tool established based on the logistic regression model demonstrated good performance and can be considered for assessing the risk of LEDVT formation after lumbar fusion surgery.
Keywords: Lower extremity deep vein thrombosis, Lumbar fusion surgery, Predict model
Introduction
It is well known that venous thromboembolism (VTE) is a major postsurgical complication and a disease that is common and potentially fatal. It includes pulmonary embolism (PE) and deep venous thrombosis (DVT). VTE leads to reduced quality of life due to leg pain, swelling and redness from lower extremity thrombosis (LEDVT), and even death from PE. The risk for a VTE event increases after patients undergo surgical operations, such as a spinal operation. It has been reported that one-third of patients with LEDVT had silent pulmonary embolism [1]. In the field of spine surgery, relevant literature suggests that the incidence of LEDVT in post-spinal fusion surgery patients ranges from 0.3–31% [2]Therefore, it is necessary to recognize patients with high risks of developing LEDVT after lumbar fusion surgery.
The risk factors for DVT can be categorized into long-term factors, short-term factors, and other non-environmental factors [3–5]. Short-term factors include general anesthesia surgery, in-hospital bed rest time, estrogen therapy, and pregnancy, among others, while long-term factors encompass chronic infections and chronic autoimmune diseases. Non-environmental factors primarily include relevant genetic diseases. In the field of spine surgery, research on thrombosis risk is growing. Previous studies have shown that the incidence of DVT after posterior lumbar fusion surgery is 2.8%, and age, preoperative abnormal D-dimer, and preoperative hypokalemia are associated risk factors for DVT occurrence [6]. In addition, factors such as elevated D-dimer [7], preoperative ambulation impairment [8], neutrophil-lymphocyte ratio, interleukin-18 [9], and the presence of multiple injuries, spinal cord injuries, and a history of previous VTE have also been identified as risk factors for VTE after spine surgery [10].
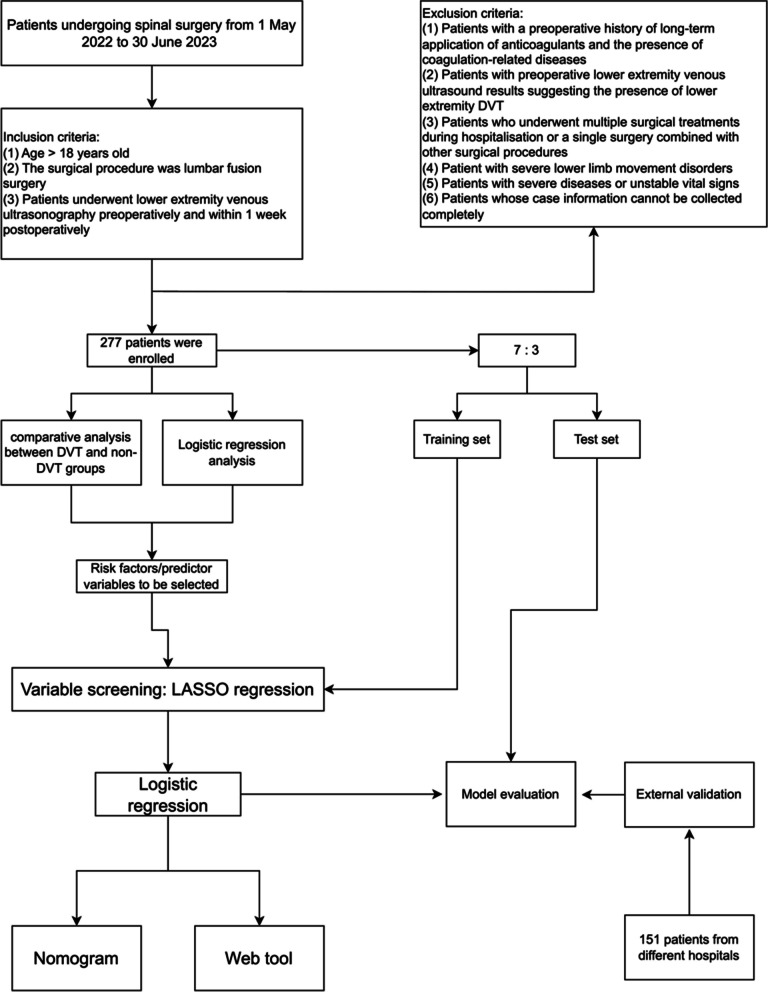
Since existing guidelines are mainly tailored to major orthopedic surgeries, there is a lack of reliable risk assessment tools specifically for spine surgery, especially spinal fusion surgery. This study aims to collect patient medical records, including general information, relevant symptoms and signs, examination, and laboratory results, as preoperative indicators to identify risk factors for LEDVT in patients after lumbar fusion surgery. This study employs logistic regression to establish a predictive model to assess the risk of LEDVT formation after lumbar fusion surgery, developing a convenient and practical prediction tool for early prevention and intervention of LEDVT, reducing the incidence and related complications, improving patients’ outcomes, and relieving the patients’ burden. A diagram of this workflow is illustrated in Fig. 1.
Fig. 1.
Research roadmap
Methods
Participants
In this research, we retrospectively collected data from patients who underwent lumbar fusion surgery in the same ward of Qilu Hospital of Shandong University from May 1, 2022, to June 30, 2023, which was used for screening risk factors and developing predictive models. All surgical procedures and perioperative management were conducted by the same treatment team. For external validation, patients from those who were under lumbar fusion surgery at Yantaishan Hospital and Shandong Provincial Hospital from March 1, 2023, to September 1, 2023 was collected. The study was approved by the Medical Ethics Committee of Qilu Hospital (KYLL-202210-053) and registered at the Chinese Clinical Trial Registry (ChiCTR2300069495).
Inclusion and exclusion criteria are as follows. Inclusion Criteria: Patients aged 18 years or older; Patients undergoing lumbar fusion surgery; Preoperative lower limb venous ultrasound results showing no DVT formation; Complete clinical data. Exclusion Criteria: Patients with a history of long-term use of anticoagulant medications; Patients with preoperative lower limb venous ultrasound results indicating the presence of LEDVT; Patients with a history of previous DVT. Patients who were not treated with surgery during their hospital stay or had multiple surgical procedures prior to lumbar fusion surgery; Patients with pelvic fractures or lower limb fractures; Patients with coagulation-related disorders; Patients with severe underlying medical conditions or unstable vital signs; Patients with lower limb paralysis.
Diagnosis and management of DVT during the period of perioperative
Preoperative Screening: Patients are scheduled to undergo lower limb venous ultrasound and blood D-dimer testing on the day of admission or the following day. we use clinical manifestations, D-dimer testing combined with venous ultrasound of the lower limb can accurately diagnose lower extremity deep vein thrombosis [11, 12].Preoperative Education: Before surgery, the nursing staff organizes daily preoperative education sessions, providing information about preoperative preparation, precautions, and preventive measures for postoperative complications. This education includes guidance on self-initiated exercises to prevent DVT.
Postoperative Management: After surgery, patients routinely did ankle pump exercises, took the anticoagulant medication (Rivaroxaban, initiated on the second postoperative day, 2.5 mg tid until 1 month after surgery), and wore graduated compression stockings. Between 3 and 7 days after the surgery, patients undergo a lower limb venous ultrasound examination before they are encouraged to start getting out of bed.
Data collection
The collected patient information includes general patient data, present medical history, personal history, past medical history, primary diagnosis, preoperative laboratory results, preoperative lower limb venous ultrasound findings, surgical information, and postoperative lower limb venous ultrasound results.
General patient data includes admission date, age, weight, height, and gender. Present medical history data includes information such as the duration of major symptoms, sleep disturbances, difficulty walking or signs of intermittent claudication, lower limb muscle strength (assessing ankle dorsiflexor strength, ankle plantar flexor strength, knee flexor-extensor strength, and toe dorsiflexor strength) equal to or less than grade 3.
Personal history encompasses smoking history, alcohol consumption history, history of drug or food allergies, history of trauma, and surgical history. Past medical history includes conditions such as hypertension, diabetes, and coronary heart disease.
Preoperative laboratory indicators include white blood cell count (WBC), red blood cell count (RBC), platelet count (PLT), lymphocyte count (LYM), neutrophil count (NEU), monocyte count (MON), platelet distribution width (PDW), mean platelet volume (MPV), erythrocyte sedimentation rate (ESR), C-reactive protein (CRP), prothrombin time (PT), activated partial thromboplastin time (APTT), fibrinogen (FIB), thrombin time (TT), D-dimer, albumin (ALB), total cholesterol, low-density lipoprotein cholesterol (LDL-C), high-density lipoprotein cholesterol (HDL-C), alanine aminotransferase (ALT), aspartate aminotransferase (AST), glucose, blood urea nitrogen (BUN), homocysteine (Hcy), blood potassium, blood calcium, blood sodium, blood magnesium, blood chloride, preoperative lower limb venous ultrasound results.
Intraoperative indicators include operative time, number of discs involved, and intraoperative blood loss.
Postoperative lower limb venous ultrasound results indicate whether they are normal, or abnormal and whether lower limb deep vein thrombosis has occurred. The outcome indicator is whether LEDVT has occurred postoperatively.
Body mass index (BMI), neutrophil-lymphocyte ratio (NLR), and preoperative hospitalization days are calculated based on the collected data. Preoperative hospitalization days refer to the number of days between the patient’s admission date and the surgery date. C-reactive protein results are categorized into two groups: less than or equal to 5 mg/L and greater than 5 mg/L. Other laboratory indicators are treated as continuous variables.
Analysis of risk factors for postoperative DVT
The cases were divided into two groups, the DVT Group and the non-DVT Group, based on the presence or absence of DVT after surgery. A comparative analysis was conducted between the two groups for each indicator.
Using the occurrence of LEDVT after surgery as the dependent variable, single-factor logistic regression analysis was applied to each indicator, and a significance level of P < 0.1 was statistically significant enough to be considered for inclusion in the construction of the prediction model.
Establishment and verification of postoperative DVT prediction model
Variable selection
Indicators identified during the risk factors analysis were considered candidate indicators. LASSO regression was employed for further selection. In this study, LASSO regression was applied to the variables using the training set. A 10-fold cross-validation method was used to calculate the mean squared error for each λ value. The final λ value was selected as the one within one standard error of the minimum mean squared error value.
Model building and evaluation
The selected predictive indicators were incorporated into a multiple logistic regression analysis for modeling. Nomograms and dynamic nomograms were constructed. Using the training set, the Receiver Operating Characteristic (ROC) curve was drawn, and the Area Under the Curve (AUC) was calculated. Subsequently, ROC curves for the model were created using the validation set and external validation data, with their respective AUC values calculated.
Calibration curves were generated for the training set, validation set, and external validation data separately. Lastly, Decision curve analysis (DCA) was used to evaluate the model’s clinical value.
Statistics method
All statistical analyses in the study were performed using R language (R, v4.2.2,New Zealand) and the RStudio software (v2022.12.0 Build 353,USA). Continuous variables that followed a normal distribution were expressed as mean ± standard deviation (mean ± SD), while those not following a normal distribution were represented by the median and interquartile range (median, IQR). Categorical data were presented as frequencies and percentages (n, %). For continuous variables, t-tests or non-parametric rank sum tests were performed, depending on the distribution characteristics of the samples. For categorical variables, chi-square tests or Fisher’s exact tests were carried out, depending on the distribution characteristics. A significance level of P < 0.1 was considered statistically significant. The significance level was set at P < 0.1.
Results
This study included a total of 277 patients who underwent lumbar fusion surgery, consisting of 143 male patients and 134 female patients. Among them, 234 patients did not experience lower limb DVT postoperatively, while 43 patients developed lower limb DVT, resulting in an incidence rate of 15.52%. To conduct external validation, an additional 151 patients from different hospitals were collected for use as an external validation dataset.
General characteristics
The comparison of general characteristics between the DVT and non-DVT groups is presented in Table 1. Significant differences were observed in terms of gender. The age of the DVT group was 57 (median) years old, the non-DVT group was 60 (median) years old. DVT group was significantly older than non-DVT group (p < 0.1). In terms of physical signs, there were 34 cases of lower limb muscle weakness in the non-DVT group and 26 cases in the DVT group, which was significantly different between the two groups (P < 0.1). Moreover, there were 80 cases of walking impairment in the non-DVT group and 28 cases in the DVT group, which was significantly different (P < 0.1). Patients with diabetes mellitus were more likely to develop DVT (P < 0.1).
Table 1.
Comparison between general data
| Non-DVT group (n = 234) |
DVT group (n = 43) |
P-value | |
|---|---|---|---|
| Gender (n, %) | 0.084 | ||
| Female | 108 (46.2) | 26 (60.5) | |
| Male | 126 (53.8) | 17 (39.5) | |
| Age (yrs) (median, IQR) | 57 (52,64) | 60 (56,68.5) | 0.003 |
| BMI (kg/m2) (median, IQR) | 25.7 (23.4,27.6) | 24.9 (23.7,26.6) | 0.32 |
| Days before surgery (median, IQR) | 3 (2,4) | 3 (2,4) | 0.527 |
| Weakened lower extremity muscle strength (yes) (n, %) | 34 (14.5) | 26 (60.5) | < 0.001 |
| Walking impairment (yes) (n, %) | 80 (34.2) | 28 (65.1) | < 0.001 |
| Smoking history (yes) (n, %) | 44 (18.8) | 4 (9.3) | 0.130 |
| History of alcohol consumption (yes) (n, %) | 36 (15.4) | 4 (9.3) | 0.297 |
| History of allergies (yes) (n, %) | 18 (7.7) | 1 (2.3) | 0.326 |
| History of trauma (yes) (n, %) | 21 (9) | 6 (14) | 0.398 |
| History of surgery (yes) (n, %) | 84 (35.9) | 18 (41.9) | 0.456 |
| Hypertension (yes) (n, %) | 72 (30.8) | 14 (32.6) | 0.816 |
| Diabetes mellitus (yes) (n, %) | 15 (6.4) | 7 (16.3) | 0.058 |
| Coronary heart disease (yes) (n, %) | 11 (4.7) | 2 (4.7) | 1.000 |
SD standard deviation, median median, IQR quartile, yrs years old, BMI Body mass index
Ultrasound and laboratory test information
A comparative analysis of the ultrasound results and laboratory indicators for the two groups is presented in Table 2. Prior to the surgery, it was observed that the proportion of patients with lower limb venous reflux/varicose veins in the non-DVT group was significantly lower than that in the DVT group (P < 0.1).
Table 2.
Comparison between groups of laboratory test results and operative indicators
| Non-DVT group (n = 234) | DVT group (n = 43) |
P-value | |
|---|---|---|---|
| Varicose veins/venous reflux (n, %) | 62 (26.5) | 28 (65.1) | < 0.001 |
| White blood cells (10^9/L) (median, IQR) | 5.8 (4.9,7.3) | 5.8 (5,6.9) | 0.979 |
| Lymphocytes (10^9/L) (median, IQR) | 1.8 (1.4,2.2) | 1.7 (1.4,2.1) | 0.429 |
| Red blood cells (10^12/L) (mean ± SD). | 4.5 ± 0.5 | 4.3 ± 0.5 | 0.084 |
| Neutrophil (median, IQR) | 3.3 (2.8,4.3) | 3.1 (2.8,4.4) | 0.785 |
| NLR (median, IQR) | 1.9 (1.4,2.5) | 1.8 (1.6,2.3) | 0.938 |
| Monocytes (10^9/L) (median, IQR). | 0.4 (0.3,0.5) | 0.4 (0.4,0.5) | 0.685 |
| Plate (10^9/L) (median, IQR) | 231 (200.2,271.8) | 231 (197,261.5) | 0.694 |
| PDW (fL) (median, IQR) | 12.1 (10.6,15.6) | 12.2 (11,14.9) | 0.621 |
| MPV (fL) (median, IQR) | 10 (9.5,10.6) | 10.2 (9.6,10.7) | 0.25 |
| ESR (mm/h) (median, IQR) | 10 (5,17.8) | 12 (6.5,27) | 0.042 |
| CRP > 5 mg/L (n, %) | 27 (11.5) | 6 (14) | 0.653 |
| PT(s) (median, IQR) | 10.9 (10.5,11.4) | 10.9 (10.2,11.4) | 0.586 |
| APTT(s) (median, IQR) | 30 (28.7,32.2) | 30.6 (28.6,32.8) | 0.817 |
| FIB(g/L) (median, IQR) | 2.9 (2.6,3.3) | 3.1 (2.8,3.4) | 0.071 |
| TT(s) (median, IQR) | 15.1 (14.5,15.8) | 15 (14.4,16.1) | 0.311 |
| D-dimer (ug/ml) (median, IQR) | 0.3 (0.2,0.6) | 0.5 (0.3,1.1) | < 0.001 |
| ALT(U/L) (median, IQR) | 18 (13,25.8) | 17 (12,25) | 0.758 |
| Blood glucose (mmol/L) (median, IQR)) | 5.1 (4.7,5.6) | 5.1 (4.6,5.6) | 0.888 |
| AST(U/L) (median, IQR) | 19 (15,23.8) | 19 (15,21) | 0.548 |
| Albumin (g/L) (mean, IQR). | 43.6 (41.5,45.5) | 43.4 (39.8,44.5) | 0.101 |
| Urea nitrogen (mmol/L) (median, IQR) | 5 (5,6.1) | 5.5 (5,6.3) | 0.143 |
| Total cholesterol (mmol/L) (mean, IQR). | 4.7 (4.2,5.4) | 4.9 (4.6,5.4) | 0.073 |
| LDL-C(mmol/L) (median, IQR) | 2.9 (2.4,3.4) | 2.9 (2.5,3.5) | 0.203 |
| HDL-C(mmol/L) (median, IQR) | 1.2 (1.1,1.4) | 1.3 (1.1,1.5) | 0.167 |
| Hcy(umol/L) (median, IQR) | 11.9 (9.9,14.5) | 11.3 (10,13.3) | 0.524 |
| Blood potassium (mmol/L) (mean, IQR) | 4.1 (3.9,4.3) | 4 (3.8,4.3) | 0.532 |
| Blood sodium (mmol/L) (median, IQR) | 142 (140.2,143) | 142 (141,143.5) | 0.749 |
| Blood magnesium (mmol/L) (mean, IQR) | 0.9 (0.9,0.9) | 0.9 (0.9,0.9) | 0.41 |
| Blood calcium (mmol/L) (median, IQR) | 2.3 (2.2,2.4) | 2.3 (2.2,2.3) | 0.295 |
| Blood chlorine (mmol/L) (median, IQR) | 106 (105,108) | 106 (104,108) | 0.815 |
| Intraoperative blood loss (median, IQR) | 240 (200,280) | 280 (240,300) | < 0.001 |
| Number of discs involved (> 1) (n, %) | 60 (25.6%) | 23 (53.5%) | < 0.001 |
| Operative time (min) (median, IQR) | 150 (135,170) | 150 (137.5,165) | 0.921 |
NLR Neutrophil-lymphocyte ratio, PDW Platelet distribution width, MPV Mean platelet volume, CRP C reactive protein, PT Prothrombin time, APTT Activated partial thromboplastin time, TT Thrombin time, FIB Fibrinogen, LDL-C Low-density lipoprotein cholesterol, HDL-C High-density lipoprotein cholesterol, ALT Alanine aminotransferase, AST Aspartate aminotransferase, Hcy Homocysteine
Regarding preoperative laboratory results, patients in the non-DVT group had significantly lower ESR, D-dimer, total cholesterol, number of discs involved and FIB than patients in the DVT group (P < 0.1). Additionally, RBC in the non-DVT group was significantly higher than those in the DVT group before surgery (P < 0.1).
Logistic regression analysis
To further evaluate the impact of various indicators on the occurrence of DVT, a single-factor logistic regression analysis was conducted on all indicators. The indicators in Table 3 had statistical significance. The indicators which had statistical significance in Tables 1, 2 and 3 were candidate variables to develop the model.
Table 3.
Univariate logistic regression analysis of some indicators
| coefficient | P-value | OR (95% confidence interval). | |
|---|---|---|---|
| Weakened lower extremity muscle strength | 2.197 | < 0.001 | 8.997 (4.464,18.637) |
| Venous reflux /Varicose veins | 1.645 | < 0.001 | 5.178 (2.630,10.564) |
| Intraoperative blood loss | 0.016 | < 0.001 | 1.017 (1.009,1.025) |
| Walking impairment | 1.279 | < 0.001 | 3.593 (1.840,7.270) |
| Number of discs involved (> 1) | 1.205 | < 0.001 | 3.335 (1.714,6.552) |
| Age | 0.062 | 0.002 | 1.064 (1.024,1.109) |
| Diabetes | 1.043 | 0.034 | 2.839 (1.024,7.240) |
| ESR | 0.023 | 0.040 | 1.023 (1.000,1.046) |
| Cholesterol | 0.302 | 0.078 | 1.352 (0.962,1.892) |
| RBC | −0.591 | 0.085 | 0.554 (0.280,1.081) |
| LDL_C | 0.327 | 0.087 | 1.387 (0.958,2.030) |
| Male | −0.579 | 0.087 | 0.560 (0.284,1.080) |
Model building
Variable screening: LASSO regression
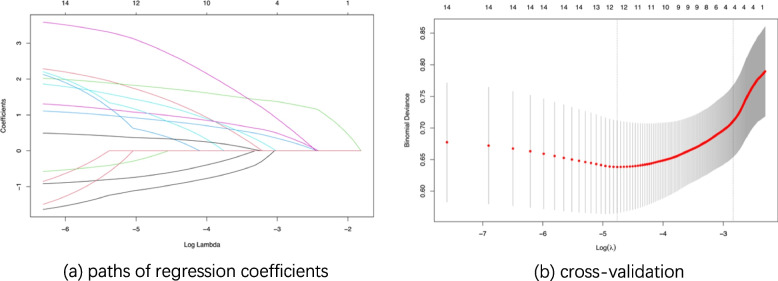
The candidate variables were included in the LASSO regression using the training set data. Fig. 2a illustrates the change in variable coefficients for different values of λ (lambda). The optimal λ value was determined through 10-fold cross-validation and selected as the largest λ value within one standard error of the minimum mean squared error (Fig. 2b), resulting in an optimal λ value of 0.0588.
Fig. 2.
LASSO regression Note: (1) Fig. (3a) illustrates the change in variable coefficients as a function of λ values in LASSO regression. The horizontal axis represents the logarithmic values of λ, and the vertical axis represents the coefficient values. The top numbers indicate the number of variables with non-zero coefficients. (2) Fig. (3b) presents the results of cross-validation in LASSO regression. The vertical axis represents the mean squared error values, and the horizontal axis represents the logarithmic values of λ. The dashed lines on the left side represent the minimum mean squared error value, and the dashed lines on the right side represent the optimal λ value
Ultimately, the selected variables included weakened lower extremity strength, walking impairment, Varicose veins/venous reflux of lower extremities, intraoperative blood loss.
Model construction: logistic regression
The variables screened by LASSO regression were incorporated into the Logistic regression model. Table 4 summarizes the coefficient values of each item in the model.
Table 4.
Logistic regression model coefficients: training set
| Coefficient | The standard error of the coefficient estimate | z-value | P-value | |
|---|---|---|---|---|
| Constant | −8.154 | 1.812 | −4.500 | < 0.001 |
| Weakened lower extremity muscle strength | 1.918 | 0.488 | 3.927 | < 0.001 |
| Intraoperative blood loss | 0.018 | 0.006 | 2.822 | 0.005 |
| Walking impairment | 1.043 | 0.506 | 2.059 | 0.039 |
| Venous reflux/ Varicose veins | 1.427 | 0.494 | 2.892 | 0.004 |
Nomogram & dynamic nomogram
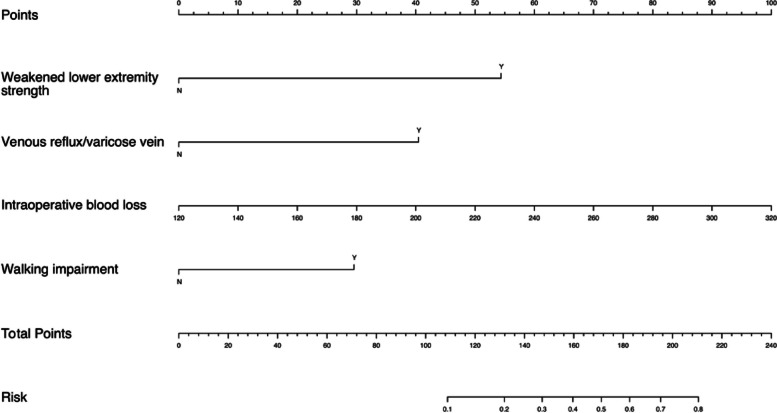
Weakened lower extremity strength, walking impairment, varicose veins/venous reflux of lower extremities, and intraoperative blood loss were selected as predictive indicators. A nomogram (Fig. 3) was created to facilitate risk prediction for LEDVT.
Fig. 3.
Nomogram
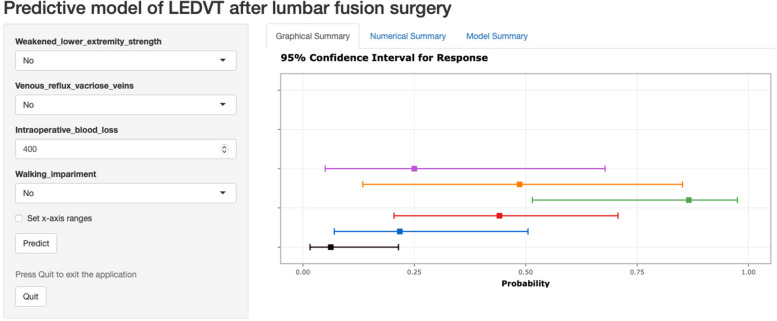
Based on the established model, a web-based dynamic nomogram was also developed (Fig. 4). The results are presented in two formats. The first format is graphical, which includes the prediction probability values and the corresponding 95% confidence intervals. The second format is numerical, providing more detailed prediction values. Additionally, each calculation result performed before closing the page is displayed simultaneously, allowing for dynamic observation.
Fig. 4.
Web Tool: Dynamic Nomogram
This web tool is deployed on the official server of shinyapps.io. The web address is: https://dvt-risk-prediction.shinyapps.io/DynNomapp/.
Model evaluation
The model was evaluated using different datasets. ROCs were generated using the training set (Fig. 5a), validation set (Fig. 5b), and external validation set (Fig. 5c), with AUC of 0.870, 0.777, and 0.750 respectively. These AUC values represent the model’s performance in distinguishing between cases with and without DVT.
Fig. 5.
ROC of Logistic regression model Note: ROC curves of the Logistic regression model were plotted using different datasets. The horizontal axis represents specificity, and the vertical axis represents sensitivity, with the labeled points indicating the cutoff values. The AUC is the area under the curve. (6a) ROC curve plotted using training dataset; (6b) ROC curve plotted using testing dataset; (6c) ROC curve plotted using the external validation dataset
To further evaluate the model, calibration curves were drawn for the training set, validation set, and external validation data (Fig. 6). The calibration curves for all three sets closely aligned with the diagonal line, indicating that the predicted probabilities generated by the model were close to the actual probabilities. This suggests that the model has good accuracy.
Fig. 6.
Calibration curve of logistic regression model Note: Calibration curves of the Logistic regression model were drawn using training data (a), validation data (b), and external validation data (c). In this curve, the vertical axis represents the actual probability, and the horizontal axis represents the model’s predicted probability, with the diagonal line indicating a perfect match between actual and predicted probabilities. Solid and dashed lines represent the model’s performance
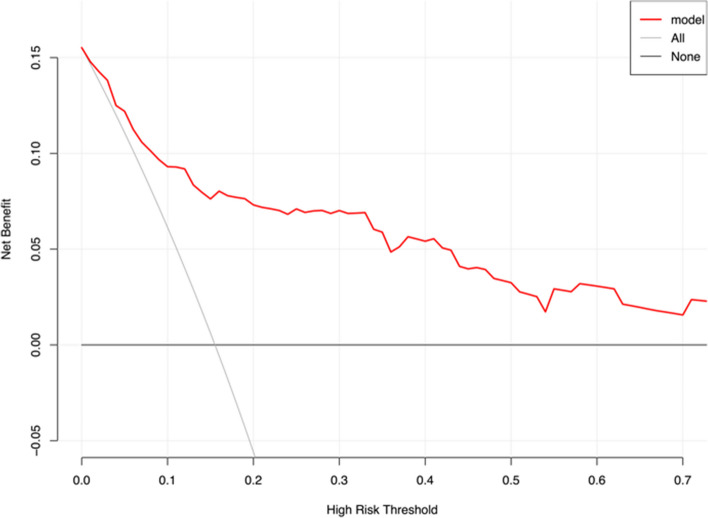
For assessing the clinical benefit of the model, decision curve analysis was employed (Fig. 7). The red curve remained above both the “Treat All” and “Treat None” curves when the threshold probability was less than 60%, indicating that the model can obtain some clinical benefits.
Fig. 7.
Decision curve analysis Note: The clinical decision curve was drawn using data collected from two time points. The x-axis represents the high-risk threshold, the y-axis represents the net benefit. The red curve represents the model’s performance, the gray curve represents the scenario where all interventions are taken, and the black curve represents the scenario where no interventions are taken
Discussion
DVT is one of the main complications in orthopedics, with a high incidence rate and significant risk. Lumbar fusion surgery is a common procedure in spine. Due to the presence of internal implants, patients need to stay strictly bedridden for several days postoperatively to prevent implant loosening. Therefore, LEDVT is slightly higher compared to other spinal surgeries. This also demonstrates the need for healthcare professionals to enhance the perioperative management of surgical patients. There are currently three main areas for perioperative management, including primary prevention, physical prevention, and pharmacological prevention. By undertaking these three things, patients will have a better chance of getting through the perioperative period safely.
Several risk-scoring scales, including the Autar Scale, the RAPT Scale, and the Caprini Scale, are commonly used in orthopedics to stratify patients’ risk of developing VTE. The Autar Scale is more suitable for orthopedics because it contains several orthopedic-related assessment items, but some studies have found that the reliability of this scale is mediocre, and it has not been revised since it was developed in 1996. The RAPT Scale is an assessment scale for trauma patients, which is less suitable for non-trauma elective surgeries. The Caprini Scale may be characterized by a large number of assessments, a long-time consuming process, and a lack of laboratory tests. There is no widely accepted predictive tool to assess the risk of postoperative LEDVT. Therefore, it is crucial to establish a practical and effective predictive tool to prevent the occurrence of LEDVT after lumbar fusion surgery.
In the initial collection of 277 patients, the incidence of lower extremity DVT was 15.52%, like reported in another study [13]. Through the initial selection of collected indicators, this study included 4 preoperative factors: weakened lower extremity muscle strength, intraoperative blood loss, walking impairment, and venous reflux/ varicose veins. In previous research, older age, gender, ESR, diabetes, cholesterol content, intraoperative blood loss, and the presence of venous varicosities or reflux were reported as risk factors associated with a higher incidence of DVT after spinal surgery [8, 13–15]. This is broadly consistent with our research. In addition, it was believed that fixation and immobilization caused venous stasis, which made the formation of deep venous thrombosis of lower limbs more prone to occur [16]. Our study also confirmed this point, because patients with lumbar disorders have lower limb movement disorders, numbness, and reduced muscle strength, preoperative education and postoperative rehabilitation are particularly important. For mild patients, immediate postoperative exercise, passive exercise, or immediate anticoagulation for patients in bed for a long time are effective means to prevent postoperative thrombosis [17, 18].
This study evaluated the model’s discriminative power and accuracy by calculating the AUC and constructing calibration curves. The model exhibited good performance in the training set, validation set, and external validation set. We employ DCA to evaluate the model’s practicality within a threshold probability of 60%, demonstrating its clinical relevance.
This study established a model and tool for predicting the risk of postoperative LEDVT in lumbar fusion surgery patients. However, this research has some limitations. First, Since the patient’s definitive diagnosis of lower extremity thrombosis relied on lower limb venous ultrasound 3–7 days postoperatively, the forecasting ability of this predictive model is limited when making predictions about lower extremity thrombosis occurring 7 days later. Then, patients with several factors that increase thrombotic risk were excluded when the predictive model was constructed using data from the collected cases. Thus, the applicability of this predictive model in cases possessing the above conditions is similarly limited.
Conclusion
The study identified weakened lower extremity muscle strength, intraoperative blood loss, walking impairment, and venous reflux/ varicose veins as potential risk factors for the development of postoperative LEDVT in spinal surgery. Using these factors as predictive indicators, a multivariate logistic regression model was created. This model demonstrated good discriminative ability, accuracy, and clinical utility. The nomogram and dynamic nomogram generated based on the logistic regression model are valuable for improving the model’s practicality.
Authors’ contributions
CL、ZYQ and ZYX conceptualized and designed the study, and they also assisted with drafting or revision of the paper. KXZ wrote the manuscript and collected the data. SKL assisted with collecting the data and revision the manuscript.LZC performed data analysis and assisted with proofreading. All authors read and approved the final manuscript.
Funding
This work was supported by the National Natural Science Foundation of China (82402758).
Data availability
No datasets were generated or analysed during the current study.
Declarations
Ethical approval and consent to participate
The study protocol was approved by the Scientific Review Committee of Qilu Hospital of Shandong University (approval number QLCR20230399). All patients gave informed consent and signed a consent form.
Consent for publication
The authors declare no competing interests.
Competing interests
The authors declare no competing interests.
Footnotes
Publisher’s note
Springer Nature remains neutral with regard to jurisdictional claims in published maps and institutional affiliations.
Yixiang Zhao, Xiangzhen Kong and Kangle Song contributed equally to this work.
Contributor Information
Yuanqiang Zhang, Email: drzhyq@126.com.
Lei Cheng, chenglei@email.sdu.edu.cn.
References
- 1.Stein PD, Matta F, Musani MH, Diaczok B. Silent Pulmonary Embolism in patients with deep venous thrombosis: a systematic review. Am J Med. 2010;123(5):426–31. [DOI] [PubMed] [Google Scholar]
- 2.Glotzbecker MP, Bono CM, Wood KB, Harris MB. Thromboembolic Disease in spinal surgery: a systematic review. Spine. 2009;34(3):291–303. [DOI] [PubMed] [Google Scholar]
- 3.Khan F, Tritschler T, Kahn SR, Rodger MA. Venous thromboembolism. Lancet. 2021;398(10294):64–77. [DOI] [PubMed] [Google Scholar]
- 4.Kruger PC, Eikelboom JW, Douketis JD, Hankey GJ. Deep vein thrombosis: update on diagnosis and management. Med J Aust. 2019;210(11):516–24. [DOI] [PubMed] [Google Scholar]
- 5.Kearon C, Ageno W, Cannegieter SC, Cosmi B, Geersing GJ, Kyrle PA, et al. Categorization of patients as having provoked or unprovoked venous thromboembolism: guidance from the SSC of ISTH. J Thromb Haemost. 2016;14(7):1480–3. [DOI] [PubMed] [Google Scholar]
- 6.Zhang H, Weng H, Yu K, Qiu G. Clinical risk factors and Perioperative Hematological Characteristics of Early Postoperative Symptomatic Deep Vein Thrombosis in posterior lumbar spinal surgery. Spine. 2021;46(19):E1042–8. [DOI] [PubMed] [Google Scholar]
- 7.Ma J, Du P, Qin J, Zhou Y, Liang N, Hu J, et al. Incidence and risk factors predicting deep venous thrombosis of lower extremity following spinal fractures. Sci Rep. 2021;11(1):2441. [DOI] [PMC free article] [PubMed] [Google Scholar]
- 8.Tominaga H, Setoguchi T, Tanabe F, Kawamura I, Tsuneyoshi Y, Kawabata N, et al. Risk factors for venous thromboembolism after spine surgery. Med (Baltim). 2015;94(5):e466. [DOI] [PMC free article] [PubMed] [Google Scholar]
- 9.Zhang Y, Cao M, Ren J. NLR value and IL-18 level and their clinical significance in patients with deep vein thrombosis after receiving the surgery for spinal degeneration. Am J Transl Res. 2021;13(6):7156. [PMC free article] [PubMed] [Google Scholar]
- 10.Wei B, Zhou H, Liu G, Zheng Y, Zhang Y, Hao C, Wang Y, Kang H, Lu X, Yuan Y, Meng Q. Risk factors for venous thromboembolism in patients with spinal cord injury: a systematic review and meta-analysis. J Spinal Cord Med. 2023;46(2):181–93. [DOI] [PMC free article] [PubMed] [Google Scholar]
- 11.Di Nisio M, van Es N, Büller HR. Deep vein thrombosis and pulmonary embolism. Lancet. 2016;388(10063):3060–73. 10.1016/S0140-6736(16)30514-1. Epub 2016 Jun 30. PMID: 27375038. [DOI] [PubMed] [Google Scholar]
- 12.Hirsh J, Lee AY. How we diagnose and treat deep vein thrombosis. Blood. 2002;99(9):3102-10. 10.1182/blood.v99.9.3102. PMID: 11964271. [DOI] [PubMed]
- 13.Yang SD, Liu H, Sun YP, Yang DL, Shen Y, Feng SQ, et al. Prevalence and risk factors of deep vein thrombosis in patients after spine surgery: a retrospective case-cohort study. Sci Rep. 2015;5:11834. [DOI] [PMC free article] [PubMed] [Google Scholar]
- 14.Zhao CM, Zhang Y, Yang SD, Huang AB, Liang ZM, Wu J, Chen Q. Risk factors for lower limb deep vein thrombosis in patients with single-level lumbar Fusion: a prospective study of 710 cases. Clin Appl Thromb Hemost. 2018;24(9suppl):S157–62. [DOI] [PMC free article] [PubMed] [Google Scholar]
- 15.Zhang L, Cao H, Chen Y, Jiao G. Risk factors for venous thromboembolism following spinal surgery: a meta-analysis. Med (Baltim). 2020;99(29):e2095414. [DOI] [PMC free article] [PubMed] [Google Scholar]
- 16.Alhassan S, Pelinescu A, Gandhi V, Naddour M, Singh AC, Bihler E. Clinical presentation and risk factors of venous thromboembolic disease. Crit Care Nurs Q 2017 Jul/Sep;40(3):201–9. [DOI] [PubMed]
- 17.Meng J, Liu W, Xiao Y, Tang H, Wu Y, Gao S. The role of aspirin versus low-molecular-weight heparin for venous thromboembolism prophylaxis after total knee arthroplasty: a meta-analysis of randomized controlled trials. Int J Surg. 2023;109(11):3648–55. [DOI] [PMC free article] [PubMed] [Google Scholar]
- 18.Streiff MB, Lau BD. Thromboprophylaxis in nonsurgical patients. Hematol Am Soc Hematol Educ Program. 2012;2012:631–7. [DOI] [PubMed] [Google Scholar]
Associated Data
This section collects any data citations, data availability statements, or supplementary materials included in this article.
Data Availability Statement
No datasets were generated or analysed during the current study.


