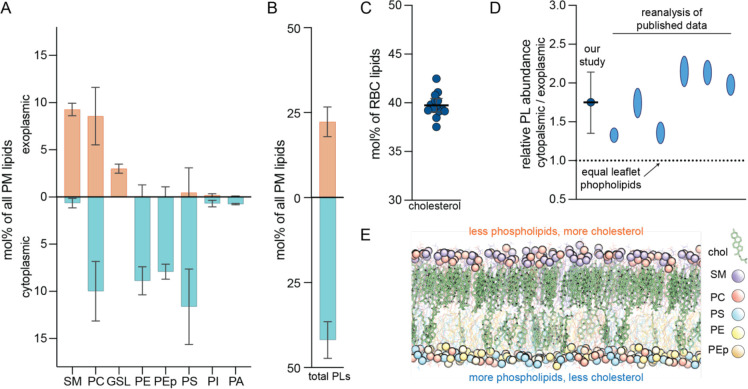
Fig. 1. The exoplasmic leaflet of erythrocyte PMs has fewer phospholipids.
(A) Shotgun mass spectrometry quantifications of asymmetric distribution of major lipid classes in the erythrocyte PM. Exoplasmic and cytoplasmic lipidomes are determined by phospholipase treatment of live cells and include species with a variety of chain compositions. Controls and validations detailed in (Lorent et al., 2020). Values represent mol% of lipid class as a percentage of PM lipids, with interleaflet distribution shown in orange/blue bars. Average ± SD from >3 independent experiments. SM sphingomyelin, PC phosphatidylcholine, GSL glycosphingolipids, PE phosphatidylethanolamine, PEp PE plasmalogen, PS phosphatidylserine, PI phosphatidylinositol, PA phosphatidic acid. Minor classes (<1% not shown). (B) Total phospholipid (including GSLs) abundances of the two PM leaflets obtained by summing the corresponding leaflet components in (A). (C) Cholesterol measured by lipidomics as a mol% of all erythrocyte lipids. The mean is 40 (± 1) mol% of PM lipids, however its transbilayer distribution cannot be resolved by this analysis. (D) Relative total phospholipid (PL) abundances between the two PM leaflets of erythrocytes from this work and from re-analysis of previous reports (Table S1). (E) Snapshot of an equilibrated atomistic computational model of the erythrocyte PM with overabundance of PLs in the cytoplasmic leaflet (Cyto+ model, Table S5). The membrane contains 40 mol% cholesterol, which converges to an asymmetric distribution with ~3-fold enrichment in the exoplasmic leaflet. Lipid classes are color-coded (phosphorous atoms shown as spheres; cholesterol in green). Structures of PLs used in simulations shown in Figure S2.

