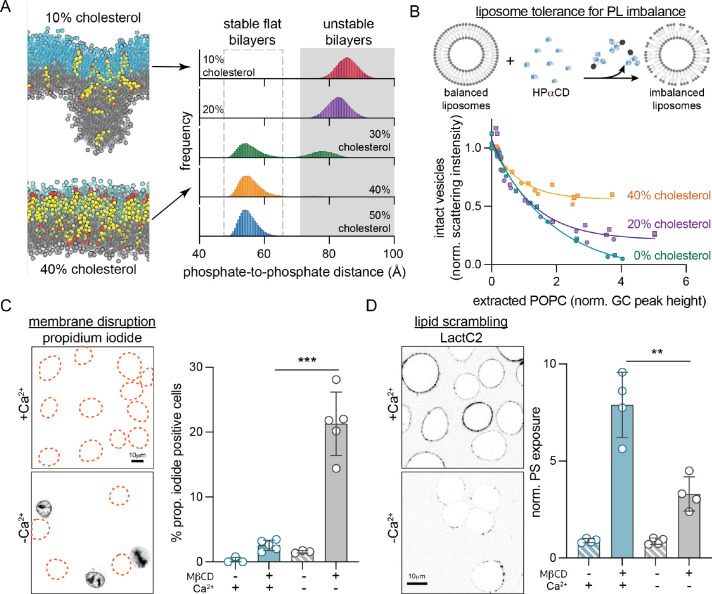
Fig. 2. Cholesterol imparts tolerance for phospholipid abundance imbalance between membrane leaflets.
(A) Coarse-grained simulations of a PM model with 35% more PLs in the cytoplasmic leaflet and varying cholesterol abundance (10–50%, Table S2). Histograms show the distributions of maximal distances between lipid phosphate groups in the two leaflets. Values >70 Å indicate unstable bilayers with non-lamellar morphology. Representative snapshots from simulated bilayers with 10 and 40% cholesterol shown for reference (exoplasmic leaflet PL phosphate groups shown in cyan, cytoplasmic in gray, cholesterol is yellow with hydroxyl headgroup in red). (B) Extraction of external leaflet PLs from extruded liposomes with 0, 20 and 40 mol% cholesterol. POPC is extracted from the external leaflet by HPαCD, which induces PL imbalance between leaflets causing membrane instability and liposome destruction. Amount of extracted lipid is quantified by GC/MS, while the corresponding fraction of intact vesicles is measured by light scattering (data from two independent experiments). (C) Extraction of cholesterol compromises PM integrity, evidenced by propidium iodide (PI) staining of nuclei, if lipid scrambling is suppressed by chelating Ca2+. Outlines represent PI-negative cells. (D) Extraction of cholesterol from the PM of RBL cells with M𝛽CD leads to scrambling of PM lipids evidenced by exposure of PS on the cell surface (binding of external PS-marker, LactC2-mClover), while suppressing scrambling reduces PS exposure. Average intensity of LactC2-mClover on the PM (PS exposure) normalized to -M𝛽CD is shown on the right. Data shown in (C) and (D) is from average ± SD from 3–5 independent experiments. **p<0.01, ***p<0.001.

