

Abstract
This study investigated the role of Ninjurin1 (Ninj1), encoding a small transmembrane protein, in colitis‐associated colon tumorigenesis in relation to sex hormones. Male and female wild‐type (WT) and Ninj1 knockout (KO) mice were treated with azoxymethane (AOM) and dextran sulfate sodium (DSS), with or without testosterone propionate (TP). At week 2 (acute colitis stage), Ninj1 KO exhibited an alleviation in the colitis symptoms in both male and female mice. The M2 macrophage population increased and CD8+ T cell population decreased only in the female Ninj1 KO than in the female WT AOM/DSS group. In the female AOM/DSS group, TP treatment exacerbated colon shortening in the Ninj1 KO than in the WT. At week 13 (tumorigenesis stage), male Ninj1 KO mice had fewer tumors, but females showed similar tumors. In the WT AOM/DSS group, females had more M2 macrophages and fewer M1 macrophages than males, but this difference was absent in Ninj1 KO mice. In the Ninj1 KO versus WT group, the expression of pro‐inflammatory mediators and Ho‐1 and CD8+ T cell populations decreased in both female and male Ninj1 KO mice. In the WT group, M2 macrophage populations were increased by AOM/DSS treatment and decreased by TP treatment. However, neither treatment changed the cell populations in the Ninj1 KO group. These results suggest that Ninj1 is involved in colorectal cancer development in a testosterone‐dependent manner, which was different in male and female. This highlights the importance of considering sex disparities in understanding Ninj1's role in cancer pathogenesis.
Keywords: colitis‐associated neoplasms, NINJ1 protein, sex characteristics, testosterone propionate
What's New?
Ninj1 overexpression in various carcinomas suggests its oncogenic potential, yet its role in inflammation and cancer remains unclear, especially in relation to sex‐based differences. In this colitis‐associated colorectal cancer mouse model, Ninj1 deficiency reduced inflammation and tumor development in both sexes, but with a more significant effect in males. Testosterone propionate treatment significantly increased tumor development in female Ninj1 knockout mice compared to their wild‐type counterparts, suggesting that Ninj1 plays a role in colorectal cancer development in association with testosterone. The findings highlight the importance of considering sex disparities in understanding Ninj1's role in cancer pathogenesis.
1. INTRODUCTION
Colorectal cancer (CRC) is the third most commonly diagnosed cancer and the third leading cause of cancer‐related mortality in the United States in 2023. 1 Globally, there is a well‐established trend of CRC being more common in males than females. 2 , 3 Additionally, females tend to have more right‐sided colon tumors, 4 and high microsatellite instability (MSI) status is mainly found in the proximal colon and accounts for about 15% of CRC cases. 5
Sex hormones play a significant role in these differences. Estrogen, a female sex hormone, is protective against CRC, 6 neurodegenerative diseases, 7 and cardiovascular diseases. 8 Studies suggest that the use of hormones like oral contraceptives and hormone therapy reduce CRC risk in females. 9 , 10 Removing ovaries or suppressing female hormones early can increase CRC risk by 30%. 11 On the other hand, high testosterone levels were linked to a 2.1 times higher risk of CRC. 12 Animal studies also indicated that dihydrotestosterone and testosterone enanthate promote colon adenoma formation. 13
Ninjurin family proteins are transmembrane proteins that respond to nerve injury by promoting cell adhesion and aiding in the regeneration of nerve cells and Schwann cells. 14 There are two types, Ninj1 and Ninj2, which do not interact due to distinct adhesion motifs and are expressed in various tissues, 15 Ninj1 is notably found in macrophages 16 , 17 and has implications in conditions like spinal cord injury, 14 hepatocellular carcinoma, 18 and acute lymphoblastic leukemia. 19 Ninj1's role in inflammation and cancer is debated. In male mice with colitis, Ninj1 knockout (KO) led to severe symptoms, while in female mice with CRC, Ninj1 overexpression reduced tumor growth. 20 , 21 Another study found less severe colitis in Ninj1 KO mice of both sexes. In cell studies, Ninj1 KO reduced the release of nitric oxide and tumor necrosis factor‐α upon inflammation. 22 Ninj1 is overexpressed in various cancers and appears to promote oncogenic activity by suppressing p53, leading to cellular senescence and growth inhibition. 23 However, Ninj1's specific role in colitis and colon cancer, especially concerning sex‐based differences, remains unclear.
The azoxymethane (AOM)/dextran sulfate sodium (DSS) animal model mimics the multistage progression of tumors, allowing researchers to examine specific molecular changes at different stages. 24 Previously, male mice showed severe CRC development induced by AOM/DSS compared to females. 25 Administering 17β‐estradiol (E2) effectively inhibited CRC onset by affecting pathways related to nuclear factor erythropoietin 2‐related factor 2 (Nrf2). 26 A testosterone‐deficient orchiectomy showed a link between testosterone levels and the development of large tumors, especially in the distal colon, and invasive submucosal cancer. 27 Based on this background, we hypothesized that Ninj1 contributes to the sex differences in AOM/DSS‐induced CRC. Therefore, this study aimed to examine the involvement of Ninj1 in the development of colitis‐associated colon tumorigenesis and its potential association with sex hormones.
2. MATERIALS AND METHODS
AOM (#A5486) and olive oil (#O1514) were purchased from Sigma‐Aldrich (St. Louis, MO, USA). An AOM stock solution was prepared by dissolving 10 mg of AOM in 10 mL of phosphate‐buffered saline (PBS), pH 7.4 (#10010‐023; Gibco BRL, Gaithersburg, MD, USA). DSS (36,000–50,000 MW, MP grade) was purchased from MP Biomedicals (#160110; Aurora, OH, USA). A 1.5% DSS solution was prepared by dissolving 15 g of DSS in 1 L of water. Testosterone propionate (TP) was purchased from Tokyo Chemical Industry Co., Ltd. (# T0028, Tokyo, Japan). The TP solutions were prepared by dissolving 2 mg of TP in 10 mL of olive oil.
2.1. Mice
Ninjurin1 KO (Ninj1 −/−) mice (B6.129P2‐Ninj1 tm1Gto, generated by G. T. Oh) were kindly provided by Prof. K‐W. Kim at Seoul National University. WT (Ninj1 +/+) and Ninj1 KO (Ninj1 −/−) mice were obtained by backcrossing with C57BL/6 mice (Orient Bio, South Korea) and Ninj1 KO mice. The breeding colony was established and housed in cages at 23°C with a 12/12‐hour light/dark cycle under specific pathogen‐free conditions. Genomic DNA was obtained using a DNeasy Blood & Tissue Kit (Qiagen GmbH, Hilden, Germany) and used as template DNA for genotyping PCR (Table S1).
2.2. Establishment of colitis‐associated CRC mouse model and study design
1.5% (w/v) DSS was supplied in the drinking water for 7 days starting 1 week after the AOM injection (10 mg/kg) in a 200 μL volume, which was considered Day 0. 28 We evaluated the effects of sex and Ninj1 KO on colitis‐associated CRC development in the AOM/DSS group (Figure 1A). Next, to assess the effect of testosterone on colitis‐associated CRC in female WT and Ninj1 KO mice, TP (0.5 mg/kg) was administered twice a week by intramuscular (i.m.) injection in female AOM/DSS‐treated WT and Ninj1 KO mice (Figure 4A). Olive oil was administered to all other groups. The animals were euthanized by CO2 asphyxiation at weeks 2 (9 weeks of age) and 13 (20 weeks of age) weeks after AOM injection.
FIGURE 1.
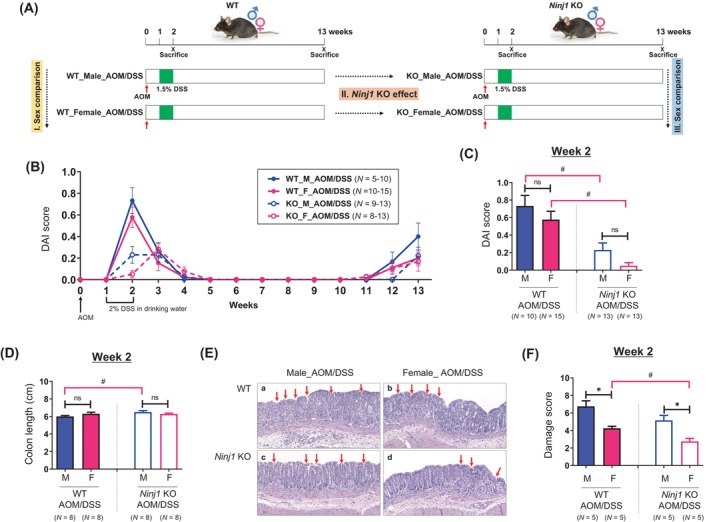
The effect of Ninj1 KO on sex‐based differences in colitis symptoms. (A) Data analysis scheme. Sex‐based differences have been investigated by comparing colitis symptoms and tumor formation between males and females within the WT AOM/DSS‐treated group and the Ninj1 KO AOM/DSS‐treated group. We examined the effect of Ninj1 KO in each sex; based on these results, we investigated the impact of Ninj1 KO on sex‐based differences in colitis symptoms and tumorigenesis. (B, C) DAI score during experimental period (B) and at week 2 (C). (D) AOM/DSS‐mediated colon length shortening in male and female WT and Ninj1 KO mice at week 2. (E) Representative H&E staining images of colon tissues at week 2. Magnification, ×200. Crypt loss and strong inflammatory cell infiltration within the colon tissues (red arrow) are observed in male and female AOM/DSS‐treated WT and Ninj1 KO mice. (F) AOM/DSS‐induced colonic epithelial damage scores at week 2. Data are expressed as the mean ± SEM. Mann–Whitney U test for comparison difference between independent two groups was performed. *p < .05 for male versus female in WT and Ninj1 KO mice. # p < .05 for WT versus Ninj1 KO in male and female mice. AOM, azoxymethane; DAI, disease activity index; DSS, dextran sodium sulfate; F, female; H&E, hematoxylin–eosin; KO, knockout; M, male; Ninj1, Ninjurin1; n.s., not significant; SEM, standard error of the mean, WT, wild‐type.
FIGURE 4.
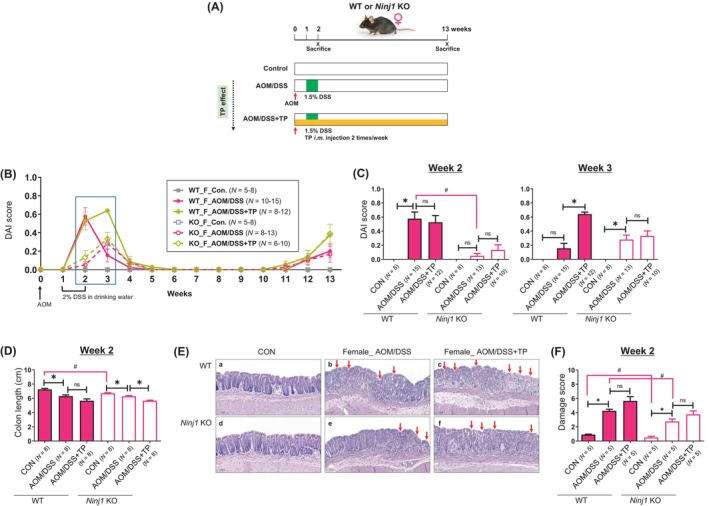
Effect of TP administration in female WT and Ninj1 KO mice in colitis symptoms. (A) Experimental scheme used to evaluate the role of TP on AOM/DSS‐induced colitis (week 2) and CRC (week 13) in female WT and Ninj1 KO mice. AOM (10 mg/kg) is injected to the mice on Day 0. One week later, DSS (1.5%) is provided in the drinking water for 1 week. TP (0.5 mg/kg) is administered twice a week by intramuscular (i.m.) injections. The mice are sacrificed at weeks 2 and 13 after the AOM injection. (B, C) DAI score during experimental period (B) and at week 2 (C, left panel) and week 3 (C, right panel). (D) Effect of TP on AOM/DSS‐mediated colon length shortening in female WT and Ninj1 KO mice at week 2. (E) Representative H&E staining images of colon tissues at week 2. Magnification, ×200. The crypt within colon tissues was normal in WT and Ninj1 KO control mice. However, crypt loss and strong inflammatory cell infiltration within the colon tissues (red arrow) are observed in female AOM/DSS‐treated WT and Ninj1 KO mice. In the WT and Ninj1 KO groups, AOM/DSS‐induced histologic damage is exacerbated by TP supplementation (red arrow). (F) The effect of TP on AOM/DSS‐induced colonic epithelial damage in female WT and Ninj1 KO mice at week 2. Data are expressed as the mean ± SEM. Mann–Whitney U test for comparison difference between independent two groups was performed. *p < .05 for intergroup comparison for AOM/DSS versus CON or AOM/DSS + TP group. # p < .05 for WT versus Ninj1 KO mice in CON, AOM/DSS, and AOM/DSS + TP group. AOM, azoxymethane; CON, control; DAI, disease activity index; DSS, dextran sodium sulfate; H&E, hematoxylin–eosin; KO, knockout; Ninj1, Ninjurin1; n.s., not significant; SEM, standard error of the mean, TP, testosterone propionate; WT, wild‐type.
2.3. Evaluation of clinical symptoms
Clinical symptoms were evaluated using the Disease Activity Index (DAI), which rates body weight loss, stool consistency, and blood in the stool. 29 , 30
2.4. Macroscopic measurement of tumors
Briefly, the colons were opened longitudinally, and stool was washed out with PBS. Colon length was measured from the cecum to the rectum using a ruler. Tumors in the proximal and distal colon regions were counted by two blinded researchers, and they were categorized by size (≤2 mm or >2 mm). 29 , 30 The average number of tumors per mouse for each group was recorded.
2.5. Histopathology
The extracted colon was divided into proximal and distal parts as previously described. 31 Briefly, the proximal colon up to 1.5 cm from the ileocecal valve, the rectum up to 1.5 cm from the anal verge, and sections of the colon containing total polyps were fixed in phosphate‐buffered formalin and embedded in paraffin. Subsequently, 5‐mm‐thick sections were stained with hematoxylin and eosin (H&E). For the 13‐week samples, a specialized histopathologist (E. Shin), blinded to the experimental conditions, analyzed the classification of adenomas as either low‐ or high‐grade adenocarcinoma and determined the depth of invasion into the colonic tissues as mucosal or submucosal. 32 The incidence of adenomas and adenocarcinomas was expressed as a percentage of the total occurrences in the study population (n). For the 2‐week samples, histological severity was assessed using a microscopic damage score, which considered colonic epithelial damage and the depth of inflammatory cell infiltration. 33
2.6. Quantitative real‐time PCR
qRT‐PCR was performed using specific primers (Table S1) and SYBR Green PCR Master Mix on a QuantStudio 7 Flex Real‐Time PCR instrument. The expression levels were normalized to those of Gapdh.
2.7. Measurement of inflammatory cytokines
In colonic tissues, the levels of myeloperoxidase (MPO) and interleukin (IL)‐1β were measured using a mouse MPO enzyme‐linked immunosorbent assay (ELISA) kit and mouse IL‐1β/IL‐1F2 Quantikine ELISA kit, respectively. The 13‐week samples were divided into tumor and non‐tumor groups. All assays were performed in triplicate.
2.8. Isolation of colonic lamina propria cells and flow cytometry analysis
Cells were isolated from the colon using a mouse Lamina Propria Dissociation Kit and gentleMACS Octo Dissociator with Heaters. Briefly, the colon tissue samples were cut into 2–4‐mm pieces and transferred to a gentleMACS™ C tube containing an enzyme mixture prepared. The tubes containing the samples were then incubated in a gentleMACS™ Octo Dissociator at 37°C for 30 min (program: 37C_m_LPDK_1). Following centrifugation, the digested cell suspension was filtered through a 70‐μm cell strainer. Thereafter, the colonic lamina propria (cLP) suspensions were incubated with Fc receptor blocking antibody in FACS buffer (0.5% fetal bovine serum in PBS) for 30 min and then stained with fluorescently labeled specific antibodies. Detailed information regarding the antibodies used is provided in the flow cytometry section of Table S2. Data acquisition was performed using a BD FACSAria™ III flow cytometer (BD Biosciences), and the data were analyzed using BD FACSDiva Software (version 9.0.1; BD Biosciences). Cell subtypes were defined by the presence (expressed as +) of markers expressed on the cell surface. The gating strategies are listed in Table S3 and presented in Figure S2.
2.9. Statistical analysis
Data are presented as mean ± standard error of the mean. The data were analyzed using PASW Statistics for Windows (version 18.0; SPSS Inc., Chicago, IL, USA). Statistical significance was determined using the Mann–Whitney U test or Fisher's exact test. Values of p < .05 were considered statistically significant.
3. RESULTS
3.1. Alleviation of colitis symptoms by Ninj1 KO
We assessed Ninj1's role in sex‐related colitis differences (Figure 1A). In WT mice, DAI scores peaked at week 2, but in Ninj1 KO mice, they remained high from weeks 2 to 3 in males and peaked at week 3 in females. No significant sex‐based differences were seen in WT mice (Figure 1B). The Ninj1 KO group had significantly lower DAI scores than the WT group in both sexes (p = .003 and p < .001 in males and females, respectively), with no sex‐based differences in Ninj1 KO (Figure 1C). Colon length shortening induced by AOM/DSS in males was alleviated in the Ninj1 KO group compared to WT (6.5 cm vs. 6 cm; p = .026), with no sex‐based differences in Ninj1 KO or WT (Figure 1D). Representative histopathological images of colonic epithelial damage are shown in Figure 1E. The score of colonic epithelial damage due to infiltration of inflammatory cells and loss of crypts was more severe in males, even in the Ninj1 KO group (p = .016; Figure 1F), compared to females, but damage scores were generally lower in Ninj1 KO, with significant reduction only in females (p = .007; Figure 1F). Collectively, in terms of sex, colonic epithelial damage scores were lower in females than in males in both the WT and Ninj1 KO groups. In terms of Ninj1 KO, DAI score, colon length shortening, and colonic epithelial damage scores, were alleviated in the Ninj1 KO group compared to the WT group in both sexes.
3.2. Opposite effects of Ninj1 KO in AOM/DSS CRC model depending on cancer location in male mice
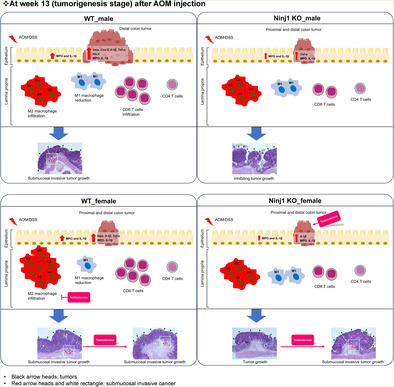
We then assessed Ninj1's role in sex‐related colitis‐associated tumorigenesis 13 weeks after AOM injection (tumorigenesis stage) (Figure 1A). A flow chart illustrating the number of mice, including tumor‐bearing mice, at 13 weeks post AOM/DSS treatment in WT and Ninj1 KO mice was shown in Figure S1. When tumor numbers per mouse were determined by macroscopic examination based on size (>2 mm) and location, well‐developed tumors were primarily in the distal colon in the WT AOM/DSS group, with more proximal tumors in females compared to males (p = .046; Figure 2A). However, only Ninj1 KO males showed increased proximal tumors, thus lessening sex‐based differences in the Ninj1 KO group compared to WT (p = .010; Figure 2A). In the distal colon, more tumors developed in males than in females in both WT (p = .002) and Ninj1 KO (p = .012) groups (Figure 2A). Interestingly, Ninj1 KO significantly reduced distal colon tumors only in males, lessening sex‐based differences in the Ninj1 KO group compared to WT (Figure 2A). These findings suggest that Ninj1 is involved in maintaining sex‐based differences in colon tumor development. The incidence of microscopic neoplasms and tumor multiplicity is presented in Table S4. Representative histopathological H&E images illustrating the morphology and size of tumors in each group are shown in Figure 2B. In the analysis of adenoma and cancer incidence based on histopathological H&E images, there were no sex differences in both WT and Ninj1 KO groups, and they were unaffected by Ninj1 KO (Figure 2C). Notably, submucosal invasive cancer didn't develop in Ninj1 KO males or females compared to WT (Figure 2C). Furthermore, submucosal invasive cancer, which was observed in the WT group, did not occur in the Ninj1 KO group regardless of sex. These findings suggest that Ninj1 is associated with the development of aggressive tumors such as large‐size tumors and submucosal invasion.
FIGURE 2.
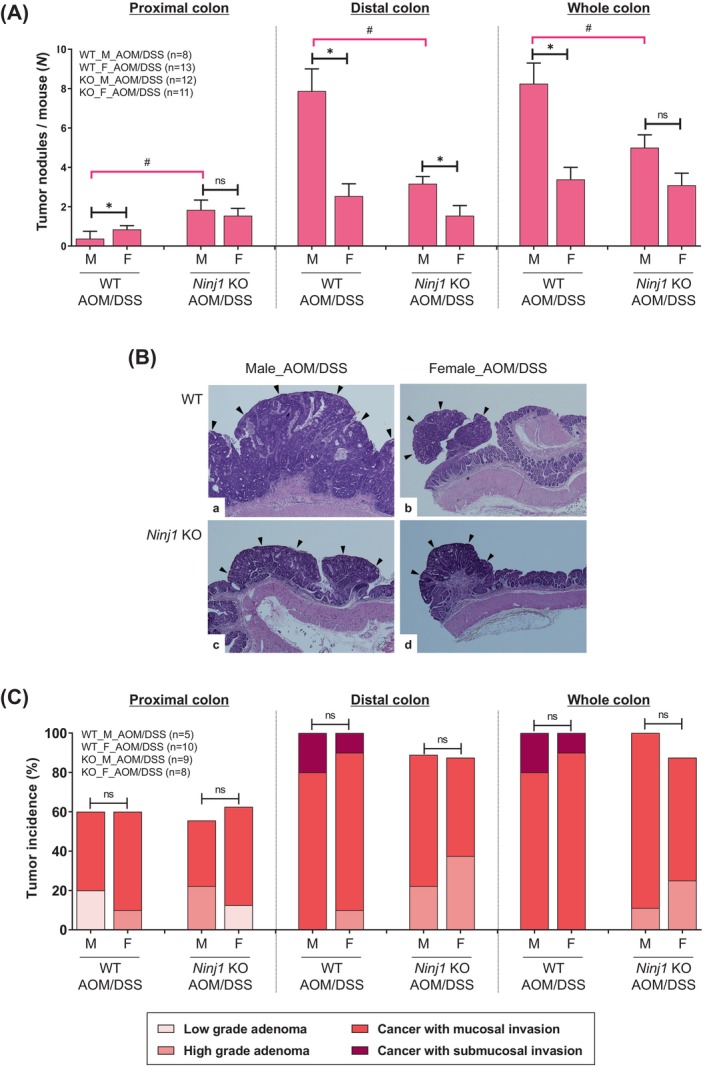
Reduction of colon tumorigenesis by Ninj1 KO, especially in male mice. (A) Average number of large tumors (>2 mm) in the proximal, distal, and whole colon in each group sacrificed at week 13 following the AOM injection. (B) Representative H&E staining images. Magnification, ×400. Black arrowheads indicate tumors. (C) Quantification of adenoma/carcinoma incidence and invasion in each group by microscopic evaluation of the colonic tissues. Data are expressed as the mean ± SEM. Mann–Whitney U test for comparison difference between independent two groups was performed. *p < .05 for male versus female in WT and Ninj1 KO mice; # p < .05 for WT versus Ninj1 KO in male and female mice. AOM, azoxymethane; DSS, dextran sodium sulfate; F, female; H&E, hematoxylin and eosin; KO, knockout; M, male; Ninj1, Ninjurin1; n.s., not significant; SEM, standard error of the mean, WT, wild‐type.
3.3. Attenuation of pro‐inflammatory mediators and changes in cell populations by Ninj1 KO
Ninj1 KO's molecular‐level effects were evaluated in colitis and CRC samples through qRT‐PCR, ELISA, and flow cytometry. At week 2, MPO levels were significantly higher in males than females, regardless of Ninj1 status (Figure 3A). Although IL‐1β levels showed no sex‐based differences in WT or Ninj1 KO groups, male Ninj1 KO mice had significantly lower IL‐1β levels than male WT mice (p = .016; Figure 3A). In the next, immune cell populations were assessed in the cLP, including macrophages (CD11b+ F4/80+), M1 macrophages (CD11b+ F4/80+ CD86+), M2 macrophages (CD11b+ F4/80+ CD206+), T cells (CD3e+), CD4 T cells (CD3e+ CD4+), and CD8 T cells (CD3e+ CD8a+), using flow cytometry. In the AOM/DSS group, the WT group showed no significant sex‐based differences in macrophage populations except in female mice, where Ninj1 KO reduced macrophage populations (p = .023; Figure 3B). Consequently, the Ninj1 KO group had significantly higher macrophage populations in males than females (p = .023; Figure 3B). M1 macrophage populations were unaffected by sex or Ninj1 KO (Figure 3C). In contrast, female Ninj1 KO mice had significantly higher M2 macrophage populations than female WT mice (p = .042) without sex differences (Figure 3D). In the WT group, female mice had significantly higher T cell populations (p = .004, Figure 3E), including CD4 (p = .008, Figure 3F) and CD8 T cells (p = .018, Figure 3G), compared to males. However, these sex‐based differences disappeared in the Ninj1 KO group (Figure 3E–G). Collectively, in the WT AOM/DSS group, a higher population of T cells, including CD4 and CD8 T cells, was observed in females compared to males. However, this sex difference disappeared in the Ninj1 KO group, and instead, a sex difference in macrophage population emerged, with higher levels in the Ninj1 KO group compared to WT. Regarding Ninj1 KO, there was a decrease in IL‐1β levels in Ninj1 KO males compared to WT, while Ninj1 KO females showed a decrease in macrophage and CD8 T cell populations along with an increase in M2 macrophages compared to WT.
FIGURE 3.
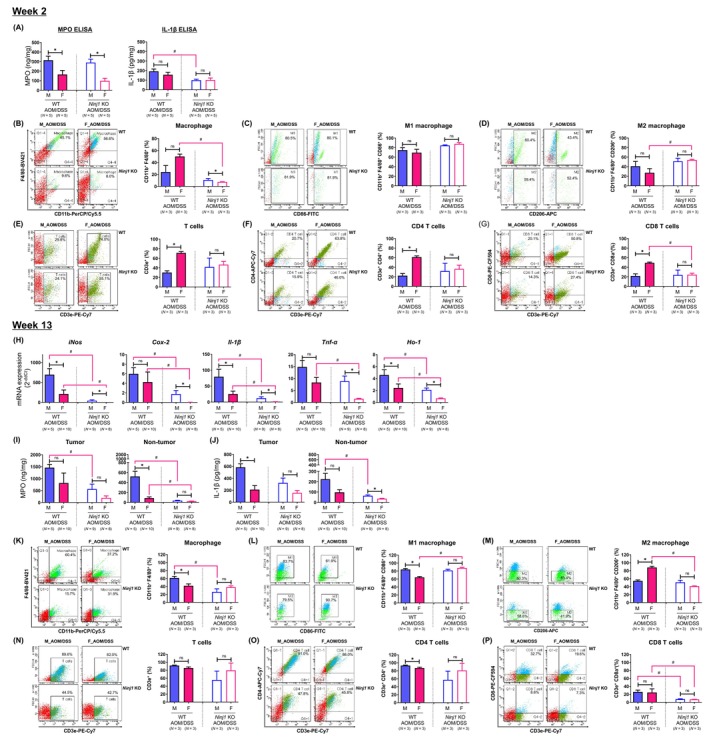
The effect of Ninj1 KO on sex‐based differences in the levels of pro‐inflammatory mediators and cell population in colonic tissues. (A) Determination of levels of pro‐inflammatory mediators such as MPO and IL‐1β by enzyme‐linked immunosorbent assay at week 2. (B–G) Cell population analysis through flow cytometry analysis in the colonic lamina propria of male and female WT and Ninj1 KO mice at week 2. (B–D) Frequencies of macrophages (CD11b+ F4/80+) (B), M1 macrophages (CD11b+ F4/80+ CD86+) (C) and M2 macrophage populations (CD11b+ F4/80+ CD206+) (D). (E–G) Frequencies of T cells (CD3e+) (E), CD4 T cells (CD3e+ CD4+) (F) and CD8 T cell populations (CD3e+ CD8a+) (G). (H) mRNA expression of pro‐inflammatory mediators such as iNos, Cox‐2, Il‐1β, and Tnf‐α and Ho‐1 by quantitative real‐time polymerase chain reaction analysis at week 13. (I, J) Concentrations of MPO (I) and IL‐1β (J) in the tumor and non‐tumor tissues of the colon. (K–P) Cell population analysis through flow cytometry analysis in the colonic lamina propria of male and female WT and Ninj1 KO mice at week 13. (K–M) Frequencies of macrophages (CD11b+ F4/80+) (K), M1 macrophage (CD11b+ F4/80+ CD86+) (L) and M2 macrophage populations (CD11b+ F4/80+ CD206+) (M). (N–P) Frequencies of T cells (CD3e+) (N), CD4 T cells (CD3e+ CD4+) (O) and CD8 T cell populations (CD3e+ CD8a+) (P). Data are expressed as the mean ± SEM. Mann–Whitney U test for comparison difference between independent two groups was performed. *p < .05 for male versus female in WT and Ninj1 KO mice; # p < .05 for WT versus Ninj1 KO in male and female mice. AOM, azoxymethane; Cox‐2, cyclooxygenase 2; DSS, dextran sodium sulfate; F, female; H&E, hematoxylin and eosin; Ho‐1, heme oxygenase‐1; IL‐1β, interleukin‐1β; iNos, inducible nitric oxide synthase; KO, knockout; M, male; MPO, myeloperoxidase; Ninj1, Ninjurin1; n.s., not significant; SEM, standard error of the mean, TNF‐α, tumor necrosis factor‐α; WT, wild‐type.
At week 13, we examined colon polyps from the AOM/DSS‐treated group to analyze pro‐inflammatory mediator and antioxidant enzyme Ho‐1 gene expression. In the WT AOM/DSS group, male mice showed significantly higher mRNA expressions of iNos (p = .028), Il‐1β (p = .028), and Ho‐1 (p = .028) compared to female mice (Figure 3H). In the Ninj1 KO AOM/DSS group, the mRNA expressions of iNos (p = .001), Cox‐2 (p = .001), Il‐1β (p = .001), Tnf‐α (p = .001), and Ho‐1 (p = .002) were significantly higher in males than females compared to the WT group (Figure 3H). This suggests that these genes were downregulated in both male and female mice in the Ninj1 KO AOM/DSS group, but male prominent persistence. We conducted ELISA to assess MPO and IL‐1β levels in colon tumors at week 13. MPO levels were significantly higher in tumor tissue than non‐tumor tissues (Figure 3I). Although MPO levels were lower in the Ninj1 KO group than in the WT group, they were higher in male AOM/DSS mice than in females, regardless of Ninj1 status, in both tumor and non‐tumor tissues (Figure 3I). Significant sex differences were observed only in the WT group in non‐tumor tissues (Figure 3I). IL‐1β levels showed similar patterns as MPO, with sex and Ninj1 KO affecting both tumor and non‐tumor tissues (Figure 3J). Interestingly, in males, these levels were significantly suppressed in the Ninj1 KO group compared to WT, consistent across non‐tumor tissues (Figure 3I,J).
In terms of immune cell populations in the tumor microenvironment using flow cytometry, in the WT AOM/DSS group, the macrophage population was higher in males than females (p = .049); however, Ninj1 KO reduced this population in males (Figure 3K), eliminating sex‐based differences. M1 macrophage populations were larger in male WT mice than females (p = .049), but M1 macrophages increased in Ninj1 KO females (p = .049) (Figure 3L). In contrast, M2 macrophage populations were influenced by factors such as sex (p = .049) and Ninj1 KO (p = .049) (Figure 3M). The T cell population showed no sex differences in both the WT and Ninj1 KO groups (Figure 3N). The CD4+ T cell population showed a significant decrease in female mice compared to male mice only in the WT group (p = .049, Figure 3O). There were no significant sex differences within the Ninj1 KO group and between WT and Ninj1 KO in male and female mice (Figure 3O). Interestingly, CD8+ T cell populations reduced by Ninj1 KO in both sexes (p = .049 and p = .046 in males and females, respectively), without sex differences in either group (Figure 3P). These results suggest that, in both males and females, Ninj1 stimulates pro‐inflammatory mediators and CD8+ T cells in the tumor microenvironment, potentially promoting aggressive tumor formation. Furthermore, the sex differences in the expression of pro‐inflammatory mediators and in the population of macrophages in the WT group disappeared in the Ninj1 KO group. This suggests that Ninj1 acts as an important factor in maintaining sex differences in various factors.
3.4. Effect of Ninj1 KO on colitis symptoms following testosterone supplementation in female mice
To explore the relationship between testosterone and Ninj1 in colitis and colon tumorigenesis, we treated female WT and Ninj1 KO mice with TP after AOM/DSS administration (Figure 4A). The DAI score increased with AOM/DSS treatment, peaking at week 2 in the WT group and week 3 in the Ninj1 KO group (Figure 4B,C). Compared to the AOM/DSS treatment group, TP had no additional effect on DAI scores at week 2 but significantly increased them at week 3 (p < .001; Figure 4C). In contrast, the Ninj1 KO group did not show any DAI score increase by TP at week 2 or 3 (Figure 4C). In the control group, colon length was significantly longer in the WT group compared to the Ninj1 KO group (p = .009; Figure 4D). Colon length shortened by AOM/DSS treatment was further shortened by TP treatment in both the WT and Ninj1 KO groups, with a significance only in the Ninj1 KO group (p = .001; Figure 4D). Representative histopathological images of colonic epithelial damage are shown in Figure 4E. TP treatment exacerbated AOM/DSS‐induced crypt loss and inflammatory cell infiltration without significant difference (Figure 4F). However, damage scores were significantly lower in the Ninj1 KO group compared to the WT group, regardless of TP treatment (Figure 4F).
3.5. Enhancement of pro‐tumor effect of testosterone by Ninj1 KO in female mice
In the next the characteristics of colon tumors were evaluated at 13 weeks (Figure 4A, Figure S1). Tumors that developed in the proximal and distal parts of the colon following AOM/DSS treatment were further amplified by TP administration in female WT and Ninj1 KO mice (Figure 5A). However, a significant increase in tumor development associated with TP administration was observed only in the Ninj1 KO group (Figure 5A). The incidence of microscopic neoplasms and tumor multiplicity in the colon is presented in Table S4. The analysis of the H&E images (Figure 5B) revealed that the incidence of adenoma and carcinoma slightly increased by TP administration in female WT and Ninj1 KO mice without significance (Figure 5C). However, invasive submucosal carcinoma in the distal part of the colon did not develop in the Ninj1 KO AOM/DSS group with TP supplementation (Figure 5C).
FIGURE 5.
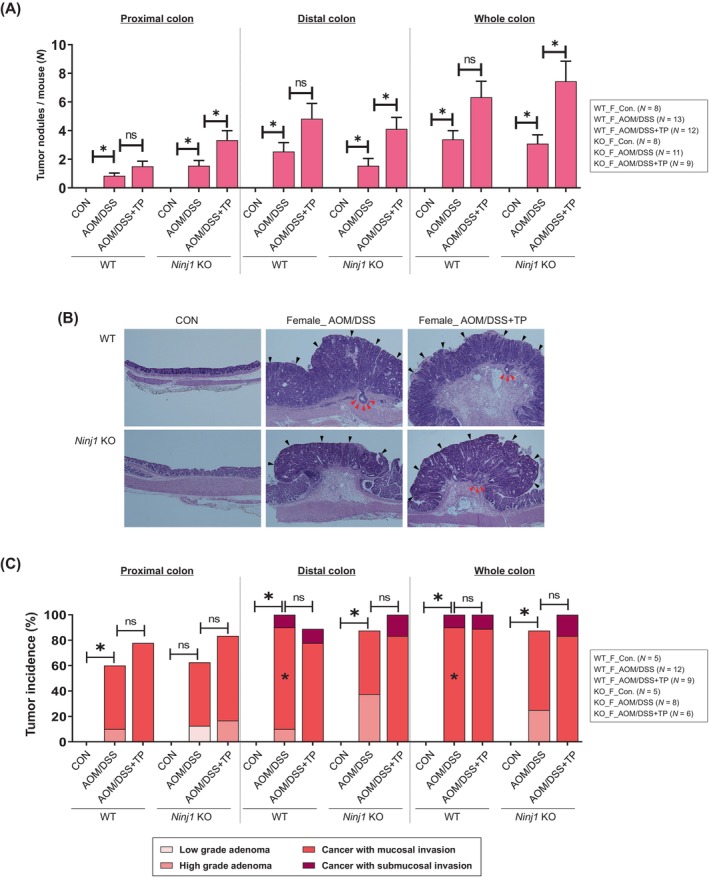
The administration of TP exacerbates colon tumorigenesis induced by AOM/DSS treatment in female Ninj1 KO compared to WT mice. (A) Average number of large tumors (>2 mm) in the proximal, distal, and whole colon in each group sacrificed at week 13 after the AOM injection. (B) Representative H&E staining images. Magnification, ×400. Black and red arrowheads indicate tumors and submucosal invasive cancer, respectively. (C) Quantification of adenoma/carcinoma incidence and invasion in each group by microscopic evaluation of the colonic tissues. Data are expressed as the mean ± SEM. Mann–Whitney U test for comparison difference between independent two groups was performed. *p < .05 for intergroup comparison for AOM/DSS versus CON or AOM/DSS + TP group. There was no significance in the comparison between WT and Ninj1 KO groups. AOM, azoxymethane; CON, control; DSS, dextran sodium sulfate; H&E, hematoxylin–eosin; KO, knockout; Ninj1, Ninjurin1; n.s., not significant; SEM, standard error of the mean, TP, testosterone propionate; WT, wild‐type.
3.6. Testosterone promoted pro‐inflammatory mediators in Ninj1 KO group
At week 2, TP supplementation did not further increase MPO levels or IL‐1β level in female WT or Ninj1 KO groups (Figure 6A). Macrophage and T cell populations were not also affected by AOM/DSS treatment, TP supplementation, or Ninj1 KO in female mice (data not shown).
FIGURE 6.
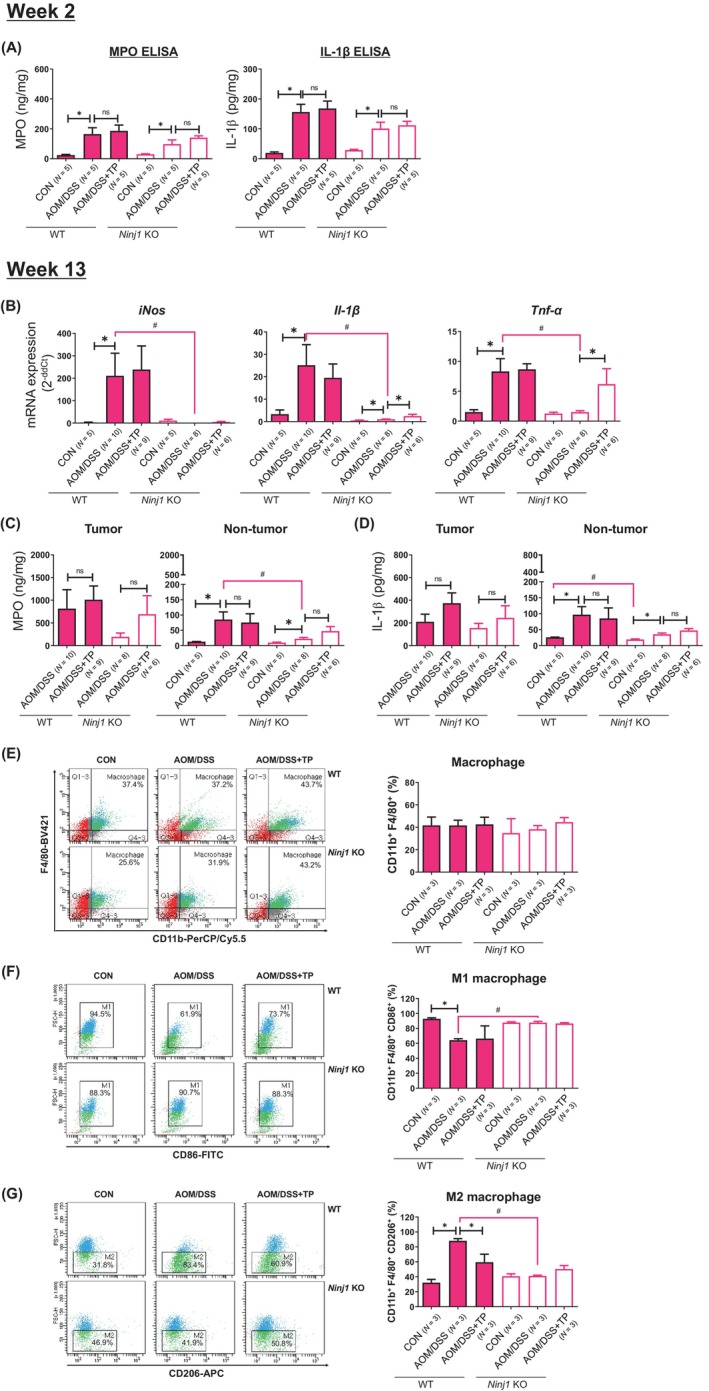
Effect of TP administration in female WT and Ninj1 KO mice in the levels of pro‐inflammatory mediators and cell population in colonic tissues. (A) Determination of levels of pro‐inflammatory mediators such as MPO and IL‐1β by enzyme‐linked immunosorbent assay at week 2. No additional effect of TP on MPO and IL‐1β levels increased by AOM/DSS in colon tissues of female WT and Ninj1 KO mice. (B) AOM/DSS‐treated group samples are prepared from colon tumor tissue, and control samples are prepared from normal colon tissue. mRNA expression of pro‐inflammatory mediators such as iNos, Il‐1β, and Tnf‐α by quantitative real‐time polymerase chain reaction analysis at week 13. (C, D) Concentrations of MPO (C) and IL‐1β (D) in the tumor and non‐tumor tissues of the colon. (E‐G) Cell population analysis through flow cytometry analysis in the colonic lamina propria of female WT and Ninj1 KO mice. Frequencies of macrophages (CD11b+ F4/80+) (E), M1 macrophages (CD11b+ F4/80+ CD86+) (F) and M2 macrophage populations (CD11b+ F4/80+ CD206+) (G). Data are expressed as the mean ± SEM. Mann–Whitney U test for comparison difference between independent two groups was performed. *p < .05 for intergroup comparison for AOM/DSS versus CON or AOM/DSS + TP group. # p < .05 for WT versus Ninj1 KO mice in CON, AOM/DSS, and AOM/DSS + TP group. AOM, azoxymethane; CON, control; DSS, dextran sodium sulfate; IL‐1β, interleukin‐1β; iNos, inducible nitric oxide synthase; KO, knockout; MPO, myeloperoxidase; Ninj1, Ninjurin1; n.s., not significant; SEM, standard error of the mean, TNF‐α, tumor necrosis factor‐α; TP, testosterone propionate; WT, wild‐type.
At week 13, the mRNA expression of inflammatory genes was significantly decreased in the Ninj1 KO AOM/DSS group than in the WT group (p = .001 for iNos, p = .001 for Il‐1β, and p = .003 for Tnf‐α; Figure 6B), and those of Il‐1β and Tnf‐α significantly increased by TP supplementation in the Ninj1 KO group (p = .039 for Il‐1β and p = .005 for Tnf‐α; Figure 6B). The MPO and IL‐1β levels induced by AOM/DSS treatment were much higher in tumor tissues than in non‐tumor tissues (Figure 6C,D), and TP supplementation in the Ninj1 KO group increased MPO levels than those of the AOM/DSS group (Figure 6C). ELISA levels of IL‐1β were similar to MPO by factors, such as TP and Ninj1 KO (Figure 6D).
We further assessed the composition of the immune cell populations, such as macrophages and T cells, present in the tumor microenvironment using flow cytometry. The macrophage population was not affected by AOM/DSS treatment, TP supplementation, or Ninj1 KO in female mice (Figure 6E). A macrophage subpopulation analysis in the WT group showed that AOM/DSS treatment resulted in a decrease in M1 macrophages (p < .001; Figure 6F) and an increase in M2 macrophages (p < .001; Figure 6G) compared with the control group. Compared to the AOM/DSS group, the WT group demonstrated a significant reduction in the M2 macrophage population with TP supplementation (p = .049; Figure 6G), but it had no effect on the distribution of M1 macrophages (Figure 6F). However, these differences were not observed in the Ninj1 KO group (Figure 6F,G). T cell populations, including CD4+ and CD8+ T cells, were not altered by AOM/DSS treatment, TP supplementation, or Ninj1 KO in female mice (data not shown). Interestingly, there was no significant difference between WT control group and Ninj1 KO control group in terms of mRNA expression or cell population, except that IL‐1β ELISA levels in non‐tumor tissue in the control group were significantly lower in the KO group than in the WT group (p = .016; Figure 6D). Taken together, while significant increases in MPO and IL‐1β ELISA levels were not observed in both WT and Ninj1 KO groups at 2 weeks and 13 weeks, robust inhibition of AOM/DSS‐induced Il‐1β and Tnf‐α mRNA expression was evident in the 13‐week WT group, mediated by Ninj1 KO. Moreover, the increase in the mRNA expression due to TP supplementation was observed only in the Ninj1 KO group. However, the decrease in M2 macrophage population induced by TP supplementation in the WT group was not observed in the Ninj1 KO group.
4. DISCUSSION
Ninjurin1 is expressed in various cell types, linked to urothelial bladder cancer 34 and hepatocellular carcinoma. 18 Furthermore, NINJ1 mRNA expression was reported to be higher in colonic tissue from patients with Crohn's disease (CD) and ulcerative colitis (UC) compared to normal controls. 35 This study investigated Ninj1's role in colon tumorigenesis regarding sex hormones. Results showed Ninj1 deficiency reduced inflammation and tumor development in both sexes, with a more significant effect in males. Interestingly, female mice with Ninj1 deficiency and TP treatment had increased tumor development compared to the WT group.
CRC varies by anatomical location, with differences in molecular, pathological, and clinical features. 36 Sex also affects CRC location, with females more often having proximal colon tumors, while males tend to have distal colon tumors. 2 Proximal cancers are typically mucinous, MSI‐high, and associated with mutations like BRAFV600E. 36 They have lower mortality rates than distal cancers at the same stage. 37 Distal cancers are characterized by chromosome instability, HER2 amplification, and epiregulin overexpression. 36 In our study, WT female mice had more proximal colon tumors than males, but Ninj1 KO males showed a significant increase in proximal tumors, eliminating sex‐based differences. Ninj1 deficiency had a substantial impact in males, increasing proximal tumors and reducing distal ones. Submucosal invasive carcinoma seen in WT AOM/DSS group was absent in Ninj1 KO group, irrespective of sex, suggesting Ninj1's role in sex‐based CRC differences in tumor location and severity.
Emerging evidence suggests estrogen has a protective role against colitis and CRC, 38 while androgens are associated with CRC development. 39 In a previous study using AOM/DSS‐induced CRC model, ovariectomy increased proximal colon tumors, but E2 supplementation reduced this effect. 31 Testosterone administration in orchiectomized male mice led to large tumors and invasive cancer, particularly in the distal colon. 27 In the present study, TP worsened pro‐inflammatory and pro‐tumor effects in AOM/DSS‐treated WT mice, but this effect was more pronounced in Ninj1 KO mice. TP also increased submucosal invasive carcinoma in Ninj1 KO mice but not in WT mice. These findings suggest that testosterone and Ninj1 may independently contribute to carcinogenesis. Future research will delve into the mechanisms behind colitis severity and CRC progression in WT and Ninj1 KO mice, as well as exploring the role of Ninj1 in estrogen's anti‐inflammatory and anticancer effects using E2 treatment.
Several reports highlight Ninj1's pro‐inflammatory effects on inflammation and tumorigenesis. 35 , 40 The mRNA expression of NINJ1 is higher in inflamed sigmoid colon mucosa samples from patients with CD and UC than in normal sigmoid colon mucosa samples from normal controls. 35 Furthermore, NINJ1 protein expression is elevated in the colon of DSS‐treated mice compared to untreated mice, and Ninj1‐deficient mice experience less weight loss, shorter colons, reduced inflammation, and fewer pathological lesions than WT mice. 35 Ninj1 activates macrophages, which secrete higher levels of pro‐inflammatory cytokines and chemokines like IL‐1β, IL‐6, and CCL2 compared to Ninj1‐deficient macrophages. 35 It also regulates the LPS‐induced inflammatory response by binding to LPS, with Ninj1 knockdown reducing NO and TNF‐α secretion in Raw264.7 cells. 22 Ninj1 inhibition in septic mice reduces organ damage, systemic, and pulmonary inflammation and improves survival. 40 According to previous reports, p53 upregulates Ninj1 transcriptionally by binding to its promoter region, and silencing Ninj1 enhances p53 expression. 23 In line with previous reports, our study shows that both male and female mice in the Ninj1 KO and WT groups exhibit suppressed expression of pro‐inflammatory markers like iNos, Cox‐2, Il‐1β, Tnf‐α, and MPO. Nrf2 has a dual effect, preventing normal cell transformation while promoting cancer cell survival in adverse conditions. 41 Nrf2 is overexpressed in gastric cancer, 42 and its target gene HO‐1 is also overexpressed in prostate cancer. 43 Ho‐1 expression was reduced in both male and female mice in the Ninj1 KO AOM/DSS group in the 13‐week sample, indicating Ninj1's role in colitis and colon tumorigenesis by increasing pro‐inflammatory mediator expression.
The colonic lamina propria, beneath the mucosal epithelium, is a vital immunological hub in the colonic mucosa, regulating immune responses. 44 Chronic inflammation is linked to gastrointestinal disorders like inflammatory bowel disease and CRC. 45 This microenvironment houses various immune cells: T cells, B cells, NK cells, macrophages, dendritic cells, and plasma cells. 44 Macrophages, critical immune regulators, shift between M1 (pro‐inflammatory) and M2 (immunosuppressive) phenotypes based on signals. 46 , 47 In our study, we assessed M1/M2 and T cell populations in the lamina propria. At week 2, the increase in total macrophages in WT compared to Ninj1 KO mice could be due to a non‐specific inflammatory response induced by AOM/DSS‐mediated colitis. However, the lack of a clear trend in M1 or M2 macrophages suggests that the increase in total macrophages may not be driven by a specific polarization towards either M1 or M2 phenotypes. This could indicate a dysregulated immune response in WT colitis mice, potentially contributing to the severity or progression of the colitis phenotype. Especially, in WT female mice treated with AOM/DSS, we observed a significant decrease in M1 and an increase in M2 in the control group. These changes were reversed by Ninj1 KO in AOM/DSS group, highlighting Ninj1's role in CRC development. Furthermore, an inconsistency in immune cell population was observed between the WT's AOM/DSS‐treated groups at 2 and 13 weeks. Research findings by Ha et al., which observed recovery of inflammation and colitis phenotypes 1 week after normalization to baseline following DSS treatment, 48 indicate potential disparities in these immune cell populations. Moreover, these changes in immune cell populations following recovery suggest disparate effects based on sex.
This study has some limitations. First, we had to sacrifice the animals at week 13 instead of the usual week 16 after AOM injection. Additionally, we typically used 10 mg/kg AOM and 2.5% DSS for our colitis‐associated CRC mouse model, but in this study, some mice died when we added TP under the same conditions. Consequently, we couldn't wait until 16 weeks after AOM injection. We also reduced the DSS concentration from 2.5% to 1.5% and changed the tissue collection time from 16 to 13 weeks post‐AOM injection. Despite our efforts to control experimental conditions, colitis and CRC were highly induced, making it challenging to observe clear sex‐based differences in the WT group as we had in previous studies. Since flow cytometric analysis in this study was conducted on the entire colon, it was not possible to perform immune cell analysis based on the location within the colon, such as proximal and distal colon. Furthermore, the mechanism underlying M2 macrophage inhibition by testosterone was not clearly elucidated in this study. In female mice, where estrogen is present, supplementation of testosterone at endogenous levels rather than high doses may not be sufficient to induce changes in MPO and IL‐1b ELISA levels and cell population within the 2‐week and tumor incidence at 13‐week period. In this study, both male and female mice were used to confirm the effects of testosterone alongside sex differences. However, to clearly elucidate the effects of testosterone, an orchiectomized mice model would have been appropriate. Further mechanistic studies in the macrophage cell line RAW264.7 and bone marrow‐derived macrophages (BMDMs) from both WT and Ninj1 KO mice are needed to determine the role of testosterone and Ninj1 in M1/M2 macrophage polarization. Ninj1 is expressed in various tissues, particularly in macrophages. In this study, we sought guidance from Prof. K.‐W. Kim's Lab. and relevant literature 20 to determine FACS targets. Consequently, we decided to examine M1 and M2 macrophages. However, analyzing M1 and M2 macrophages using a single marker instead of various markers that define them is considered a limitation of this study. Based solely on the current results, it is unclear whether Ninj1 is influenced by testosterone or affects the mechanism of testosterone action. Additionally, as there are no reports on the role of Ninj1 in relation to sex hormones in other diseases, including CRC, further research is currently underway to clarify the relationship between Ninj1 and sex hormones.
In summary, our study on colitis‐associated CRC found that Ninj1 deficiency had a marked impact, particularly in males, increasing proximal colon tumors and reducing distal ones. Submucosal invasive carcinoma was absent in Ninj1 KO AOM/DSS groups regardless of sex, and CD8+ T cell population significantly decreased in Ninj1 KO compared to WT. In the female AOM/DSS group, TP treatment significantly boosted tumor development in Ninj1 KO mice compared to WT. In conclusion, our study showed Ninj1 promotes colorectal cancer in male mice and contributes to sex‐based CRC differences. Ninj1 may represent a key factor in sex‐related colitis‐associated CRC development, primarily in a testosterone‐associated manner that differs between males and females.
AUTHOR CONTRIBUTIONS
Chin‐Hee Song: Data curation; formal analysis; investigation; methodology; writing – original draft; writing – review and editing. Nayoung Kim: Conceptualization; funding acquisition; project administration; supervision; writing – review and editing. Ryoung Hee Nam: Investigation; methodology. Soo In Choi: Investigation; methodology. Jae Young Jang: Investigation; methodology. Eun Hye Kim: Investigation; methodology. Sungchan Ha: Investigation; methodology. Eun Shin: Methodology; visualization. Hoon Choi: Resources. Kyu‐Won Kim: Resources. Sejin Jeon: Resources. Goo Taeg Oh: Resources. Yeong‐Jae Seok: Writing – review and editing.
FUNDING INFORMATION
This work was supported by a grant from the National Research Foundation of Korea (NRF) funded by the government of the Republic of Korea (2019R1A2C2085149). In addition, this work was supported by grant nos. 02‐2020‐041 and 06‐2021‐0018 from the SNUBH Research fund.
CONFLICT OF INTEREST STATEMENT
All other authors declare no conflict of interest.
ETHICS STATEMENT
All animal procedures were approved by the Institutional Animal Care and Use Committee of Seoul National University Bundang Hospital (BA‐1980‐277‐066‐01) and were performed in accordance with the ARRIVE (Animals Research: Reporting In Vivo Experiments) statement.
Supporting information
Appendix S1.
ACKNOWLEDGEMENTS
We thank all members of our team for their critical input and suggestions.
Song C‐H, Kim N, Nam RH, et al. Ninjurin1 deficiency differentially mitigates colorectal cancer induced by azoxymethane and dextran sulfate sodium in male and female mice. Int J Cancer. 2025;156(4):826‐839. doi: 10.1002/ijc.35225
DATA AVAILABILITY STATEMENT
The data that support the findings of this study are available from the corresponding author upon reasonable request.
REFERENCES
- 1. Siegel RL, Miller KD, Wagle NS, Jemal A. Cancer statistics, 2023. CA Cancer J Clin. 2023;73:17‐48. [DOI] [PubMed] [Google Scholar]
- 2. Kim SE, Paik HY, Yoon H, Lee JE, Kim N, Sung MK. Sex‐ and gender‐specific disparities in colorectal cancer risk. World J Gastroenterol. 2015;21:5167‐5175. [DOI] [PMC free article] [PubMed] [Google Scholar]
- 3. Favoriti P, Carbone G, Greco M, Pirozzi F, Pirozzi RE, Corcione F. Worldwide burden of colorectal cancer: a review. Updat Surg. 2016;68:7‐11. [DOI] [PubMed] [Google Scholar]
- 4. Lee MS, Menter DG, Kopetz S. Right versus left colon cancer biology: integrating the consensus molecular subtypes. J Natl Compr Cancer Netw. 2017;15:411‐419. [DOI] [PubMed] [Google Scholar]
- 5. Ward R, Meagher A, Tomlinson I, et al. Microsatellite instability and the clinicopathological features of sporadic colorectal cancer. Gut. 2001;48:821‐829. [DOI] [PMC free article] [PubMed] [Google Scholar]
- 6. Gierisch JM, Coeytaux RR, Urrutia RP, et al. Oral contraceptive use and risk of breast, cervical, colorectal, and endometrial cancers: a systematic review. Cancer Epidemiol Biomarkers Prev. 2013;22:1931‐1943. [DOI] [PubMed] [Google Scholar]
- 7. Behl C. Oestrogen as a neuroprotective hormone. Nat Rev Neurosci. 2002;3:433‐442. [DOI] [PubMed] [Google Scholar]
- 8. Menazza S, Murphy E. The expanding complexity of estrogen receptor signaling in the cardiovascular system. Circ Res. 2016;118:994‐1007. [DOI] [PMC free article] [PubMed] [Google Scholar]
- 9. Fernandez E, La Vecchia C, Balducci A, Chatenoud L, Franceschi S, Negri E. Oral contraceptives and colorectal cancer risk: a meta‐analysis. Br J Cancer. 2001;84:722‐727. [DOI] [PMC free article] [PubMed] [Google Scholar]
- 10. Slattery ML, Anderson K, Samowitz W, et al. Hormone replacement therapy and improved survival among postmenopausal women diagnosed with colon cancer (USA). Cancer Causes Control. 1999;10:467‐473. [DOI] [PubMed] [Google Scholar]
- 11. Luo G, Zhang Y, Wang L, et al. Risk of colorectal cancer with hysterectomy and oophorectomy: a systematic review and meta‐analysis. Int J Surg. 2016;34:88‐95. [DOI] [PubMed] [Google Scholar]
- 12. Mori N, Sawada N, Iwasaki M, et al. Circulating sex hormone levels and colorectal cancer risk in Japanese postmenopausal women: the JPHC nested case‐control study. Int J Cancer. 2019;145:1238‐1244. [DOI] [PubMed] [Google Scholar]
- 13. Amos‐Landgraf JM, Heijmans J, Wielenga MC, et al. Sex disparity in colonic adenomagenesis involves promotion by male hormones, not protection by female hormones. Proc Natl Acad Sci USA. 2014;111:16514‐16519. [DOI] [PMC free article] [PubMed] [Google Scholar]
- 14. Araki T, Milbrandt J. Ninjurin, a novel adhesion molecule, is induced by nerve injury and promotes axonal growth. Neuron. 1996;17:353‐361. [DOI] [PubMed] [Google Scholar]
- 15. Araki T, Zimonjic DB, Popescu NC, Milbrandt J. Mechanism of homophilic binding mediated by ninjurin, a novel widely expressed adhesion molecule. J Biol Chem. 1997;272:21373‐21380. [DOI] [PubMed] [Google Scholar]
- 16. Lee HJ, Ahn BJ, Shin MW, Jeong JW, Kim JH, Kim KW. Ninjurin1 mediates macrophage‐induced programmed cell death during early ocular development. Cell Death Differ. 2009;16:1395‐1407. [DOI] [PubMed] [Google Scholar]
- 17. Ahn BJ, Le H, Shin MW, et al. Ninjurin1 deficiency attenuates susceptibility of experimental autoimmune encephalomyelitis in mice. J Biol Chem. 2014;289:3328‐3338. [DOI] [PMC free article] [PubMed] [Google Scholar]
- 18. Kim JW, Moon AR, Kim JH, et al. Up‐regulation of ninjurin expression in human hepatocellular carcinoma associated with cirrhosis and chronic viral hepatitis. Mol Cells. 2001;11:151‐157. [PubMed] [Google Scholar]
- 19. Chen JS, Coustan‐Smith E, Suzuki T, et al. Identification of novel markers for monitoring minimal residual disease in acute lymphoblastic leukemia. Blood. 2001;97:2115‐2120. [DOI] [PubMed] [Google Scholar]
- 20. Choi H, Bae SJ, Choi G, et al. Ninjurin1 deficiency aggravates colitis development by promoting M1 macrophage polarization and inducing microbial imbalance. FASEB J. 2020;34:8702‐8720. [DOI] [PubMed] [Google Scholar]
- 21. Woo JK, Jang YS, Kang JH, et al. Ninjurin1 inhibits colitis‐mediated colon cancer development and growth by suppression of macrophage infiltration through repression of FAK signaling. Oncotarget. 2016;7:29592‐29604. [DOI] [PMC free article] [PubMed] [Google Scholar]
- 22. Shin MW, Bae SJ, Wee HJ, et al. Ninjurin1 regulates lipopolysaccharide‐induced inflammation through direct binding. Int J Oncol. 2016;48:821‐828. [DOI] [PubMed] [Google Scholar]
- 23. Cho SJ, Rossi A, Jung YS, et al. Ninjurin1, a target of p53, regulates p53 expression and p53‐dependent cell survival, senescence, and radiation‐induced mortality. Proc Natl Acad Sci USA. 2013;110:9362‐9367. [DOI] [PMC free article] [PubMed] [Google Scholar]
- 24. De Robertis M, Massi E, Poeta ML, et al. The AOM/DSS murine model for the study of colon carcinogenesis: from pathways to diagnosis and therapy studies. J Carcinog. 2011;10:9. [DOI] [PMC free article] [PubMed] [Google Scholar]
- 25. Lee SM, Kim N, Son HJ, et al. The effect of sex on the azoxymethane/dextran sulfate sodium‐treated mice model of colon cancer. J Cancer Prev. 2016;21:271‐278. [DOI] [PMC free article] [PubMed] [Google Scholar]
- 26. Son HJ, Sohn SH, Kim N, et al. Effect of estradiol in an azoxymethane/dextran sulfate sodium‐treated mouse model of colorectal cancer: implication for sex difference in colorectal cancer development. Cancer Res Treat. 2018;51:632‐648. [DOI] [PMC free article] [PubMed] [Google Scholar]
- 27. Song CH, Kim N, Nam RH, et al. Testosterone strongly enhances azoxymethane/dextran sulfate sodium‐induced colorectal cancer development in C57BL/6 mice. Am J Cancer Res. 2021;11:3145‐3162. [PMC free article] [PubMed] [Google Scholar]
- 28. Yum HW, Zhong X, Park J, et al. Oligonol inhibits dextran sulfate sodium‐induced colitis and colonic adenoma formation in mice. Antioxid Redox Signal. 2013;19:102‐114. [DOI] [PMC free article] [PubMed] [Google Scholar]
- 29. Cooper HS, Murthy SN, Shah RS, Sedergran DJ. Clinicopathologic study of dextran sulfate sodium experimental murine colitis. Lab Investig. 1993;69:238‐249. [PubMed] [Google Scholar]
- 30. Park YH, Kim N, Shim YK, et al. Adequate dextran sodium sulfate‐induced colitis model in mice and effective outcome measurement method. J Cancer Prev. 2015;20:260‐267. [DOI] [PMC free article] [PubMed] [Google Scholar]
- 31. Song CH, Kim N, Lee SM, et al. Effects of 17beta‐estradiol on colorectal cancer development after azoxymethane/dextran sulfate sodium treatment of ovariectomized mice. Biochem Pharmacol. 2019;164:139‐151. [DOI] [PubMed] [Google Scholar]
- 32. Choi YJ, Kim N, Nam RH, et al. Acai berries inhibit colon tumorigenesis in azoxymethane/dextran sulfate sodium‐treated mice. Gut Liver. 2017;11:243‐252. [DOI] [PMC free article] [PubMed] [Google Scholar]
- 33. Katakura K, Lee J, Rachmilewitz D, Li G, Eckmann L, Raz E. Toll‐like receptor 9‐induced type I IFN protects mice from experimental colitis. J Clin Invest. 2005;115:695‐702. [DOI] [PMC free article] [PubMed] [Google Scholar]
- 34. Mhawech‐Fauceglia P, Ali L, Cheney RT, Groth J, Herrmann FR. Prognostic significance of neuron‐associated protein expression in non‐muscle‐invasive urothelial bladder cancer. J Clin Pathol. 2009;62:710‐714. [DOI] [PubMed] [Google Scholar]
- 35. Jung HJ, Kang JH, Pak S, Lee K, Seong JK, Oh SH. Detrimental role of nerve injury‐induced protein 1 in myeloid cells under intestinal inflammatory conditions. Int J Mol Sci. 2020;21:614. [DOI] [PMC free article] [PubMed] [Google Scholar]
- 36. Missiaglia E, Jacobs B, D'Ario G, et al. Distal and proximal colon cancers differ in terms of molecular, pathological, and clinical features. Ann Oncol. 2014;25:1995‐2001. [DOI] [PubMed] [Google Scholar]
- 37. Wang B, Yang J, Li S, et al. Tumor location as a novel high risk parameter for stage II colorectal cancers. PLoS One. 2017;12:e0179910. [DOI] [PMC free article] [PubMed] [Google Scholar]
- 38. Naugler WE, Sakurai T, Kim S, et al. Gender disparity in liver cancer due to sex differences in MyD88‐dependent IL‐6 production. Science. 2007;317:121‐124. [DOI] [PubMed] [Google Scholar]
- 39. Roshan MH, Tambo A, Pace NP. The role of testosterone in colorectal carcinoma: pathomechanisms and open questions. EPMA J. 2016;7:22. [DOI] [PMC free article] [PubMed] [Google Scholar]
- 40. Jennewein C, Sowa R, Faber AC, et al. Contribution of ninjurin1 to toll‐like receptor 4 signaling and systemic inflammation. Am J Respir Cell Mol Biol. 2015;53:656‐663. [DOI] [PubMed] [Google Scholar]
- 41. Menegon S, Columbano A, Giordano S. The dual roles of NRF2 in cancer. Trends Mol Med. 2016;22:578‐593. [DOI] [PubMed] [Google Scholar]
- 42. Yang H, Wang W, Zhang Y, et al. The role of NF‐E2‐related factor 2 in predicting chemoresistance and prognosis in advanced non‐small‐cell lung cancer. Clin Lung Cancer. 2011;12:166‐171. [DOI] [PubMed] [Google Scholar]
- 43. Maines MD, Abrahamsson PA. Expression of heme oxygenase‐1 (HSP32) in human prostate: normal, hyperplastic, and tumor tissue distribution. Urology. 1996;47:727‐733. [DOI] [PubMed] [Google Scholar]
- 44. Xu XR, Liu CQ, Feng BS, Liu ZJ. Dysregulation of mucosal immune response in pathogenesis of inflammatory bowel disease. World J Gastroenterol. 2014;20:3255‐3264. [DOI] [PMC free article] [PubMed] [Google Scholar]
- 45. Shah SC, Itzkowitz SH. Colorectal cancer in inflammatory bowel disease: mechanisms and management. Gastroenterology. 2022;162:715‐730. e3. [DOI] [PMC free article] [PubMed] [Google Scholar]
- 46. Liu J, Geng X, Hou J, Wu G. New insights into M1/M2 macrophages: key modulators in cancer progression. Cancer Cell Int. 2021;21:389. [DOI] [PMC free article] [PubMed] [Google Scholar]
- 47. Lin Y, Xu J, Lan H. Tumor‐associated macrophages in tumor metastasis: biological roles and clinical therapeutic applications. J Hematol Oncol. 2019;12:76. [DOI] [PMC free article] [PubMed] [Google Scholar]
- 48. Ha SE, Jorgensen BG, Wei L, et al. Metalloendopeptidase ADAM‐like decysin 1 (ADAMDEC1) in colonic subepithelial PDGFRα+ cells is a new marker for inflammatory bowel disease. Int J Mol Sci. 2022;23:5007. [DOI] [PMC free article] [PubMed] [Google Scholar]
Associated Data
This section collects any data citations, data availability statements, or supplementary materials included in this article.
Supplementary Materials
Appendix S1.
Data Availability Statement
The data that support the findings of this study are available from the corresponding author upon reasonable request.