Abstract
The University of Kentucky's Drug Quality Task Force (DQTF) conducted a study to perform consumer-level quality assurance screening of vasopressin injections used in their healthcare pharmacies. The primary objective was to identify potential quality defects by examining intralot and interlot variability using Raman spectrometry and statistical analyses.
Raman spectra were collected noninvasively and nondestructively from vasopressin vials (n=51) using a Thermo Scientific Smartraman DXR3 Analyzer. Data processing techniques, including smoothing with cubic splines and Multiplicative Scatter Correction (MSC), were applied to prepare the spectra for analysis. Statistical analyses employed included the Bootstrap Error-Adjusted Single-sample Technique (BEST), Principal Component Analysis (PCA), and subcluster detection to assess variability and detect unusual samples.
The study revealed significant intralot and interlot variability in the vasopressin samples. Analysis of Raman spectral graphs from vials in lot 22040L1C0 showed multiple subgroups within a single lot, indicating variability in chemical composition. Examination of the entire spectral library, which included vials from two different lot numbers, revealed four distinct groups that did not correspond to lot numbers. A subcluster detection test confirmed the presence of at least two distinct chemical compositions in samples from both lots, rejecting the null hypothesis that the groups have the same scale and location.
While these spectrometric results do not conclusively prove an excess level of impurities or adulteration, they suggest that the manufacturing process may have been operating outside of a state of process control. These findings highlight the need for further investigation into potential process control issues to ensure consistent manufacturing processes and maintain drug quality and efficacy.
Introduction
The University of Kentucky’s (UK) Drug Quality Task Force (DQTF) was established in August of 2019 to engage in consumer-level quality assurance screening for drugs used within UK HealthCare’s pharmacies (Isaacs, 2024a). The DQTF currently screens medications using Fourier transform near-infrared spectrometry (FTNIR) and Raman spectrometry for potential quality defects indicated by variability in absorbance peak intensities and locations. Through years of continuous monitoring, DQTF has assembled a spectral library containing medications typically used in a health system setting. Statistical analyses using the DQTF spectral library are performed to identify potential intra-lot and inter-lot variability in medications under review. Using Medwatch and publications in the scientific literature, the DQTF reports its findings in an effort to hold manufacturers accountable for GMP requirements and to improve patient outcomes by providing information on quality to augment the information on price that is already available. The increasing transparency is designed to improve the pharmaceutical supply chain.
Drug Product
Vasopressin is a polypeptide hormone. Vasopressin injection is indicated to increase blood pressure in adults with vasodilatory shock who remain hypotensive despite fluids and catecholamines. The vasopressin injection is a sterile, aqueous solution containing synthetic arginine vasopressin intended for intravenous administration. Each 1 mL solution includes 20 units of vasopressin, 5 mg of chlorobutanol, 9 mg of sodium chloride, water for injection, and acetic acid to adjust the pH to 3.5 (American Regent, 2020). Vasopressin injection, USP is a clear, practically colorless solution for intravenous administration available in single-dose vials.
The lot numbers making up the spectral library were 22040L1C0 and 22082L1C0 (see Figure 1).
Figure 1.
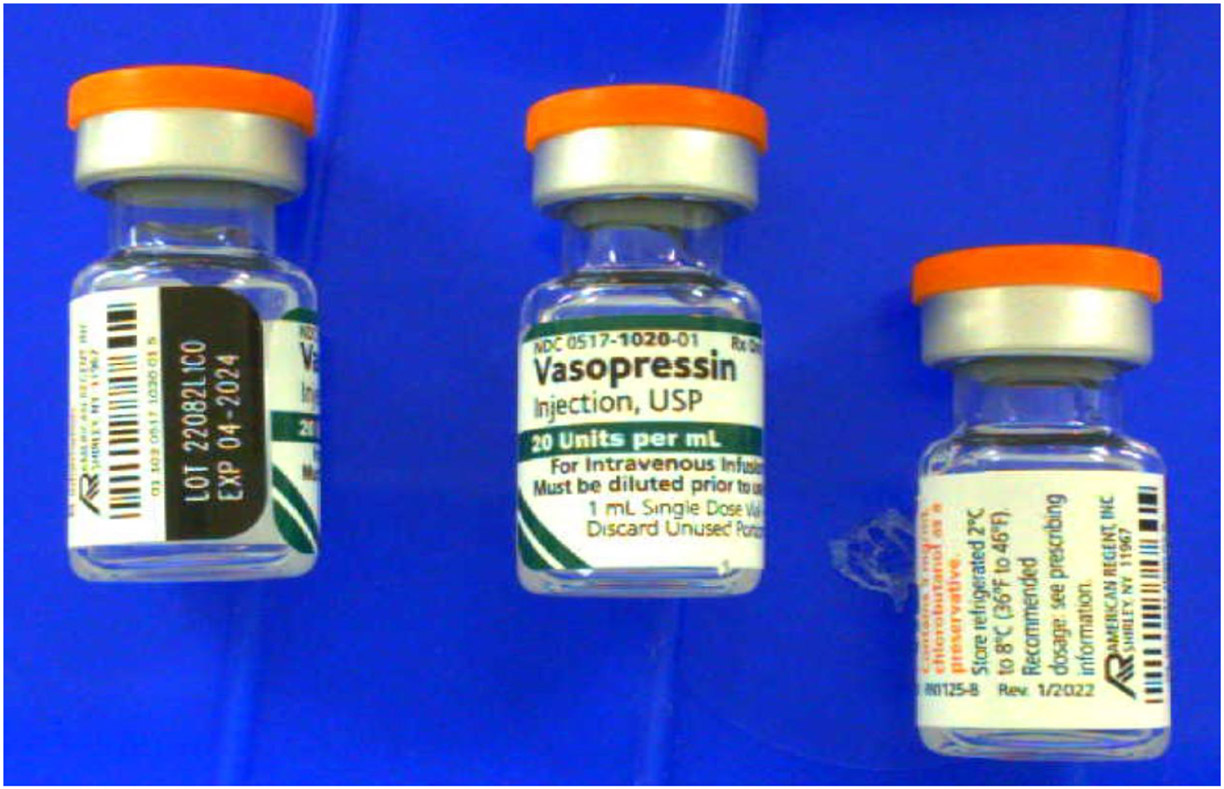
Photo of vasopressin drug product from lot 22082L1C0
Background
Recent Studies
A publication titled "The possible role of the vasopressin system in hematopoiesis" by Fredrika Schill and colleagues, explored the association between vasopressin, measured through its marker copeptin, and hematopoietic markers (Schill, 2024). The study utilized data from 5312 participants in the Swedish CArdioPulmonary biolmage Study (SCAPIS) to examine the associations between copeptin levels and markers of erythropoiesis (like erythrocyte count and hemoglobin), leukocyte count, and thrombocyte count.
Key findings included:
Associations with Hematopoietic Markers: Increasing copeptin levels were positively associated with increases in erythrocyte count, red blood cell distribution width (RDW), erythrocyte volume fraction (EVF), hemoglobin (Hb), leukocyte count, and neutrophil count, after adjusting for various covariates like age, sex, smoking status, and diabetes. However, no significant associations were found with mean corpuscular volume (MCV), lymphocyte count, or thrombocyte count.
Vasopressin's Role in Hematopoiesis: The results suggest that vasopressin might be involved in stimulating erythropoiesis and leukopoiesis. This is in line with some previous research indicating vasopressin's role in anemia and red blood cell precursor differentiation, although there are conflicting studies in the field.
Inflammation and Leukocytes: Copeptin was found to be associated with increased leukocyte and neutrophil counts, supporting the idea that vasopressin is involved in inflammation. However, the study did not find a significant association with lymphocyte count. This suggests a complex role of vasopressin in immune response modulation.
Study Limitations: The study is cross-sectional, meaning it can demonstrate associations but not causality. Also, serum osmolality was not measured, which could have provided insights into hydration status affecting copeptin levels.
Implications and Future Research: The findings warrant further investigation into the mechanistic role of vasopressin in hematopoiesis and inflammation. Understanding whether different vasopressin receptors mediate distinct effects on these processes could lead to new therapeutic strategies.
Overall, the publication highlights significant associations between vasopressin levels and various hematopoietic markers, emphasizing the hormone's potential involvement in these physiological processes and suggesting further research to explore these links.
Vasopressin remains the subject of active research. Monika Perisic et al. (Persic, 2024) reviews the signaling mechanisms and therapeutic potential of oxytocin (OT) and vasopressin (VP) in health and disease. OT and VP, ancient and highly conserved neuropeptides, play critical roles in various physiological functions such as reproduction, social behaviors, and water homeostasis through their interaction with four G protein-coupled receptors (GPCRs): the oxytocin receptor (OTR) and the three vasopressin receptors (V1aR, V1bR, and V2R).
The review highlights the complexity and therapeutic potential of the OT/VP signaling system, which has become an attractive drug target for treating a range of conditions, including neurological disorders, cancer, and cardiovascular diseases. Despite its promise, drug development is challenged by signaling complexity, selectivity issues, interspecies differences, and drug delivery difficulties.
Recent advances in medicinal chemistry, ligand-receptor structure elucidation, and the discovery of natural ligands have renewed interest in this field. The publication discusses the roles of OT and VP in various systems, including reproductive, cardiovascular, renal, and central nervous systems, and their implications in diseases like autism spectrum disorder, depression, and anxiety.
The review also emphasizes the challenges in developing selective ligands due to receptor homology and the need for further research to fully understand the physiological and pathological roles of these receptors. It suggests that peptide-based drugs hold potential advantages in selectivity and efficacy over small molecules, which have often failed in clinical trials.
In conclusion, the authors claim the OT/VP signaling system is poised for significant advances in drug development, with wide-ranging implications across multiple medical fields. However, further research is needed to address the challenges in receptor selectivity, drug delivery, and understanding the system's roles in less-studied physiological processes and diseases.
Drug Recalls of American Regent Vasopressin
Voluntary Recalls Due to Potency Issues
American Regent has issued multiple voluntary recalls of its vasopressin injection products. The primary reason for these recalls was that some vials might not maintain their potency throughout their shelf-life, rendering the product less effective. This issue of sub-potency could potentially lead to reduced effectiveness when administered to patients, which is a significant concern in clinical settings. (FDANews, 2011)
Specific Recall Details
In 2011, American Regent conducted a nationwide voluntary recall of several lots of Vasopressin Injection, USP. This recall included 5 lots of 20 units/mL (200 units/10 mL) 10 mL Multiple Dose Vials, 11 lots of 20 units/mL 1 mL Multiple Dose Vials, and 1 lot of 10 units/0.5 mL 0.5 mL Multiple Dose Vials. The products were distributed to wholesalers and distributors nationwide, and healthcare facilities were advised to quarantine and return the affected products.
No Reported Adverse Events
Despite the recall, American Regent reported that there were no adverse events related to the reduced effectiveness of the recalled vasopressin injection lots during the period from January 1, 2009, to July 27, 2011.
Recent Developments
As of 2024, there have been no new recalls reported for American Regent vasopressin. The company continues to market and distribute FDA-approved vasopressin injection products.
Shortages
On August 12, 2024, Vasopressin injection, (American Regent, 20 units/mL, 10 mL vial, 1 count, NDC 00517-1030-01) went on the ASHP Drug Shortage List (ASHP, 2024). American Regent did not provide a reason for the shortage. American Regent has vasopressin 20 units/mL 10 mL vials on back order and the company cannot estimate a release date.
FDA Medwatch
An FDA Form 3500 Medwatch describing the findings of this Rapid Communication was filed.
Methods
Raman Spectrometry
Using nondestructive analytical techniques, Raman spectra were collected from inventory as part of routine medication quality screening. A representative sample of individual vials were selected for screening and noted to be stored under the conditions required by the manufacturer in their original packaging. Raman spectra were collected noninvasively and nondestructively through the vials using a Thermo Scientific Smartraman DXR3 Analyzer (Waltham, MA, USA)(Isaacs, 2024b).
Smoothing
Data smoothing is a technique used to remove noise from data. This can be done by fitting a smooth curve to the data, such as a cubic spline. Cubic splines are piecewise cubic polynomials that are continuous and have continuous first and second derivatives. This makes them very smooth and resistant to noise. Cubic splines can be easily fitted to data using least squares (Matlab, 2023)(Pollock, 1998).
Multiplicative Scatter Correction (MSC)
Multiplicative scatter correction (MSC) is a widely used spectrometric normalization technique. Its purpose is to correct spectra in such a way that they are as close as possible to a reference spectrum, generally the mean of the data set, by changing the scale and the offset of the spectra (Isaksson, 1988).
BEST (Bootstrap Error-Adjusted Single-sample Technique)
The BEST calculates distances in multidimensional, asymmetric, nonparametric central 68% confidence intervals in spectral hyperspace (roughly equivalent to standard deviations(Dempsey, 1996). The BEST metric can be thought of as a "rubber yardstick" with a nail at the center (the mean). The stretch of the yardstick in one direction is therefore independent of the stretch in the other direction. This independence enables the BEST metric to describe odd shapes in spectral hyperspace (spectral point clusters that are not multivariate normal, such as the calibration spectra of many biological systems). BEST distances can be correlated to sample composition to produce a quantitative calibration, or simply used to identify similar regions in a spectral image. The BEST automatically detects samples and situations unlike any encountered in the original calibration, making it more accurate in chemical investigation than typical regression approaches to near-IR analysis. The BEST produces accurate distances even when the number of calibration samples is less than the number of wavelengths used in calibration, in contrast to other metrics that require matrix factorization. The BEST is much faster to calculate as well (O(n) instead of the O(n3) required by matrix factorization.)
Principal Components (PCs)
Principal component analysis is the process of computing the principal components of a dataset and using them to execute a change of basis (change of coordinate system) on the data, usually employing only the first few principal components and disregarding the rest (Joliffe, 2016). PCA is used in exploratory data analysis and in constructing predictive models. PCA is commonly utilized for dimensionality reduction by projecting each data point onto only the first few principal components to obtain lower-dimensional data while preserving as much of the original variation in the data as possible. The first principal component is the direction that maximizes the variance of the projected data. The second principal component is the direction of the largest variance orthogonal to the first principal component. Decomposition of the variance typically continues orthogonally in this manner until some residual variance criterion is met. Plots of PC scores help reveal underlying structure in data.
Subcluster Detection
In typical near-infrared multivariate statistical analyses, samples with similar spectra produce points that cluster in a certain region of spectral hyperspace. These clusters can vary significantly in shape and size due to variation in sample packings, particle-size distributions, component concentrations, and drift with time. These factors, when combined with discriminant analysis using simple distance metrics, produce a test in which a result that places a particular point inside a particular cluster does not necessarily mean that the point is actually a member of the cluster. Instead, the point may be a member of a new, slightly different cluster that overlaps the first. A new cluster can be created by factors like low-level contamination, moisture uptake, or instrumental drift. An extension added to part of the BEST, called FSOB (Fast Son of BEST) can be used to set nonparametric probability-density contours inside spectral clusters as well as outside (Isaacs, 2023)(Lodder, 1988) and when multiple points begin to appear in a certain region of cluster-hyperspace the perturbation of these density contours can be detected at an assigned significance level using r values, and visualized using quantile-quantile (QQ) plots. The detection of unusual samples both within and beyond 3 SDs of the center of the training set is possible with this method. Within the ordinary 3 SD limit, however, multiple instances are needed to detect unusual samples with statistical significance.
Artificial Intelligence Tools
Artificial intelligence (AI) tools, principally used for background information, include Gemini (Google LLC) and GPT-4 (OpenAI). AI can be used in a variety of ways, including to brainstorm, organize thoughts, develop arguments, and edit.
Results and Discussion
Intralot analysis
Raman spectral graphs
Smoothed spectral graphs of the vials in lot 22040L1C0 appear in Figure 2. Some grouping of the spectra is visible to the eye in the regions around 700 and 1100 cm−1.
Figure 2.
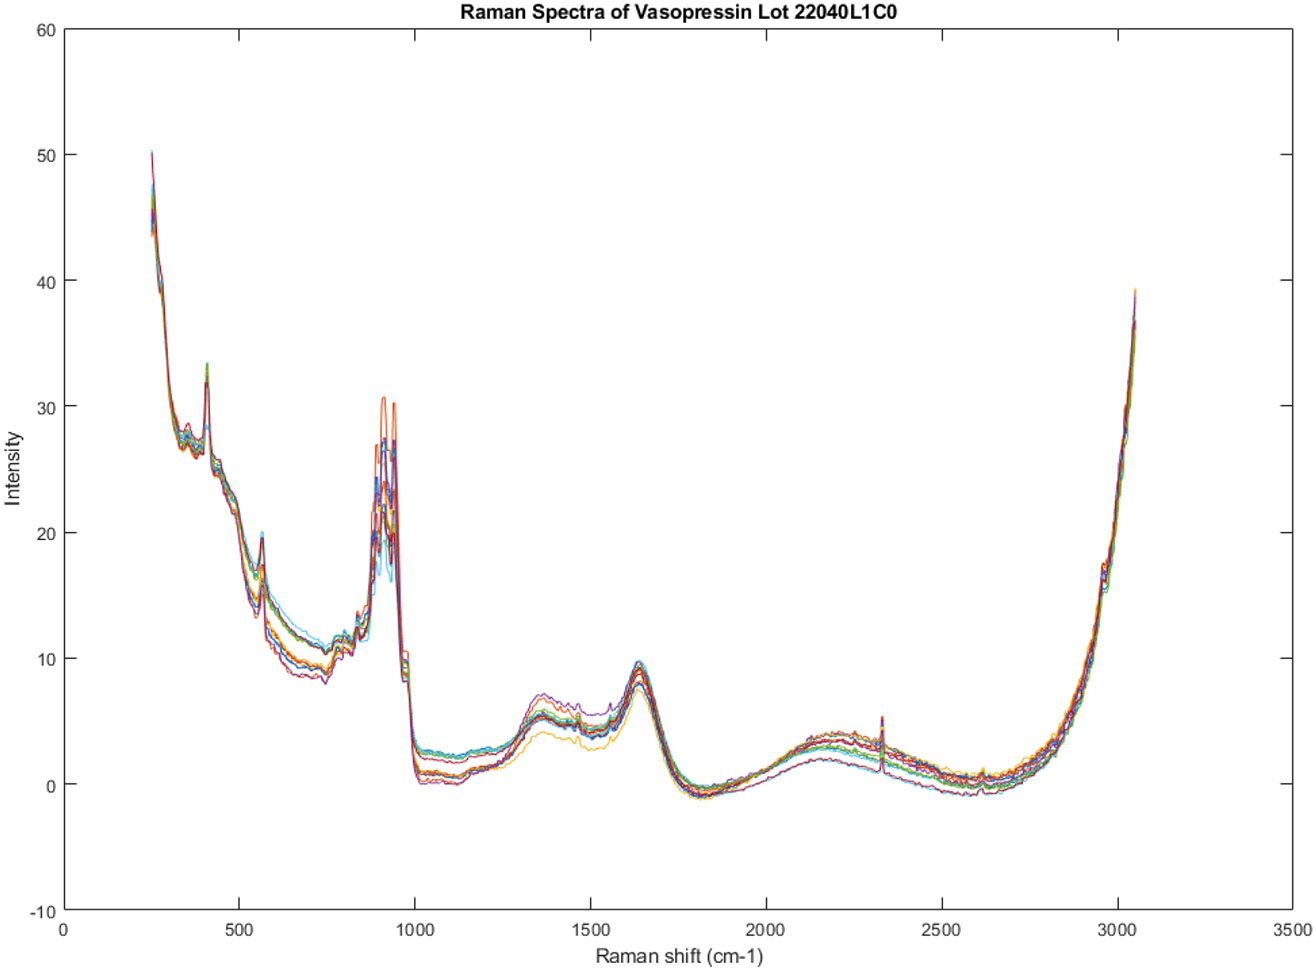
Smoothed Raman spectral graphs of the vials in lot 22040L1C0 (vials 1-14 in the spectral library of 51 vials).
Figure 3 is a principal component score plot that shows the analysis of 14 spectra obtained from vials in lot 20040L1C0. The figure shows three small groups within the single lot of vials, which indicates variability in the chemical composition of the vials.
Figure 3.
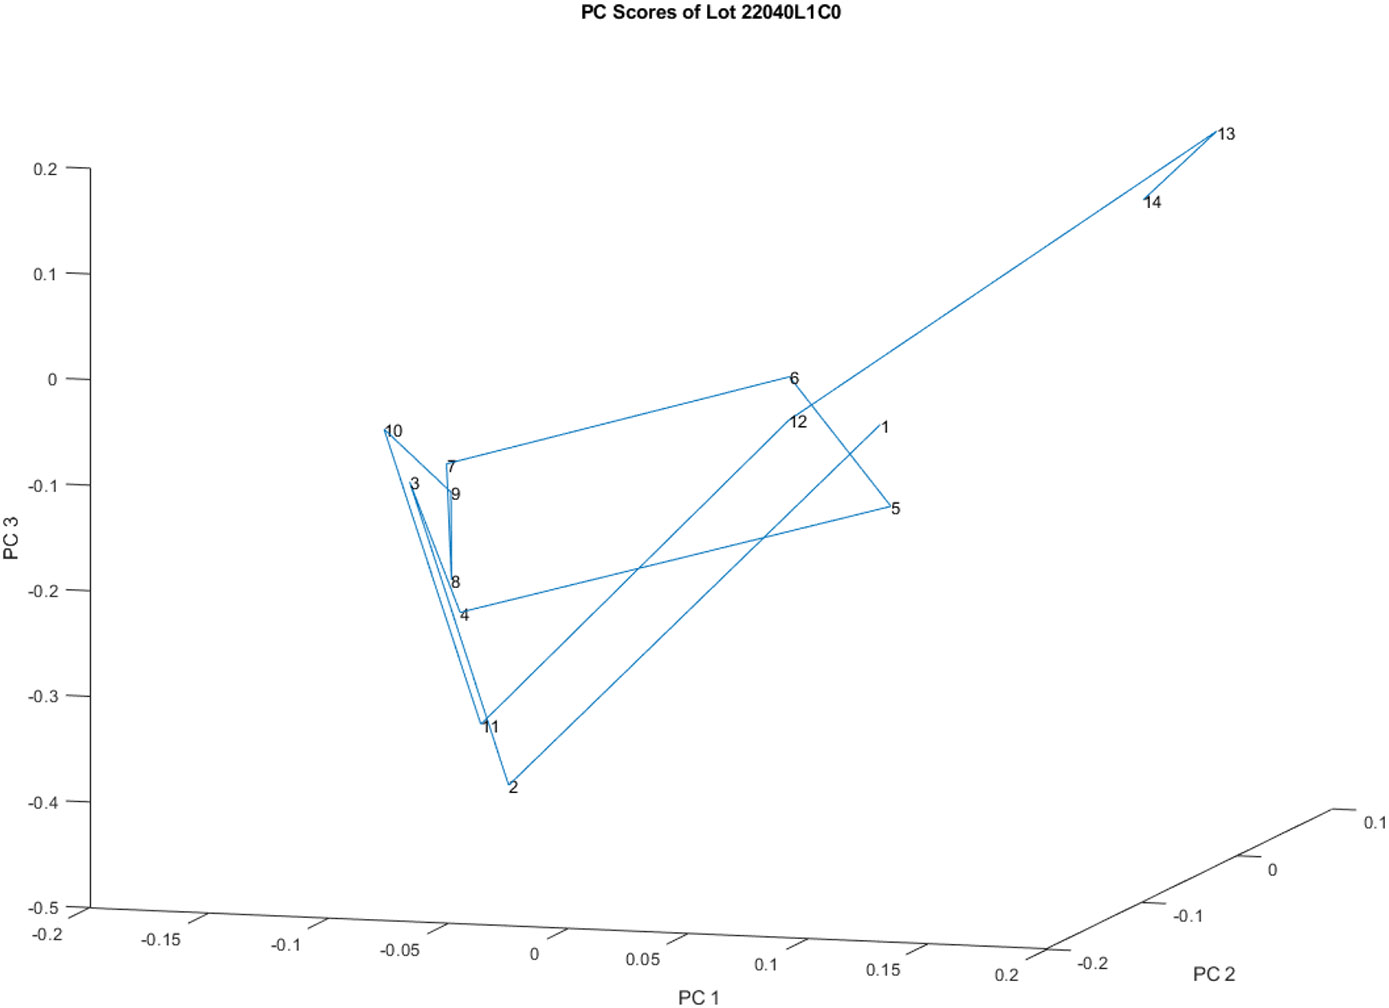
Principal component score plot of the 14 spectra obtained from vials in lot 20040l1C0. It appears that there are three small groups ([13,14], [1,5,6,12] and [2,3,4,7,8,9,10] )in one lot of vials.
Figure 4 provides a different perspective on the principal component score plot of the 14 spectra from vials in lot 20040l1C0, which was initially shown in Figure 3. This view is obtained by rotating the plot, allowing for a different visual interpretation of the data.
Figure 4.
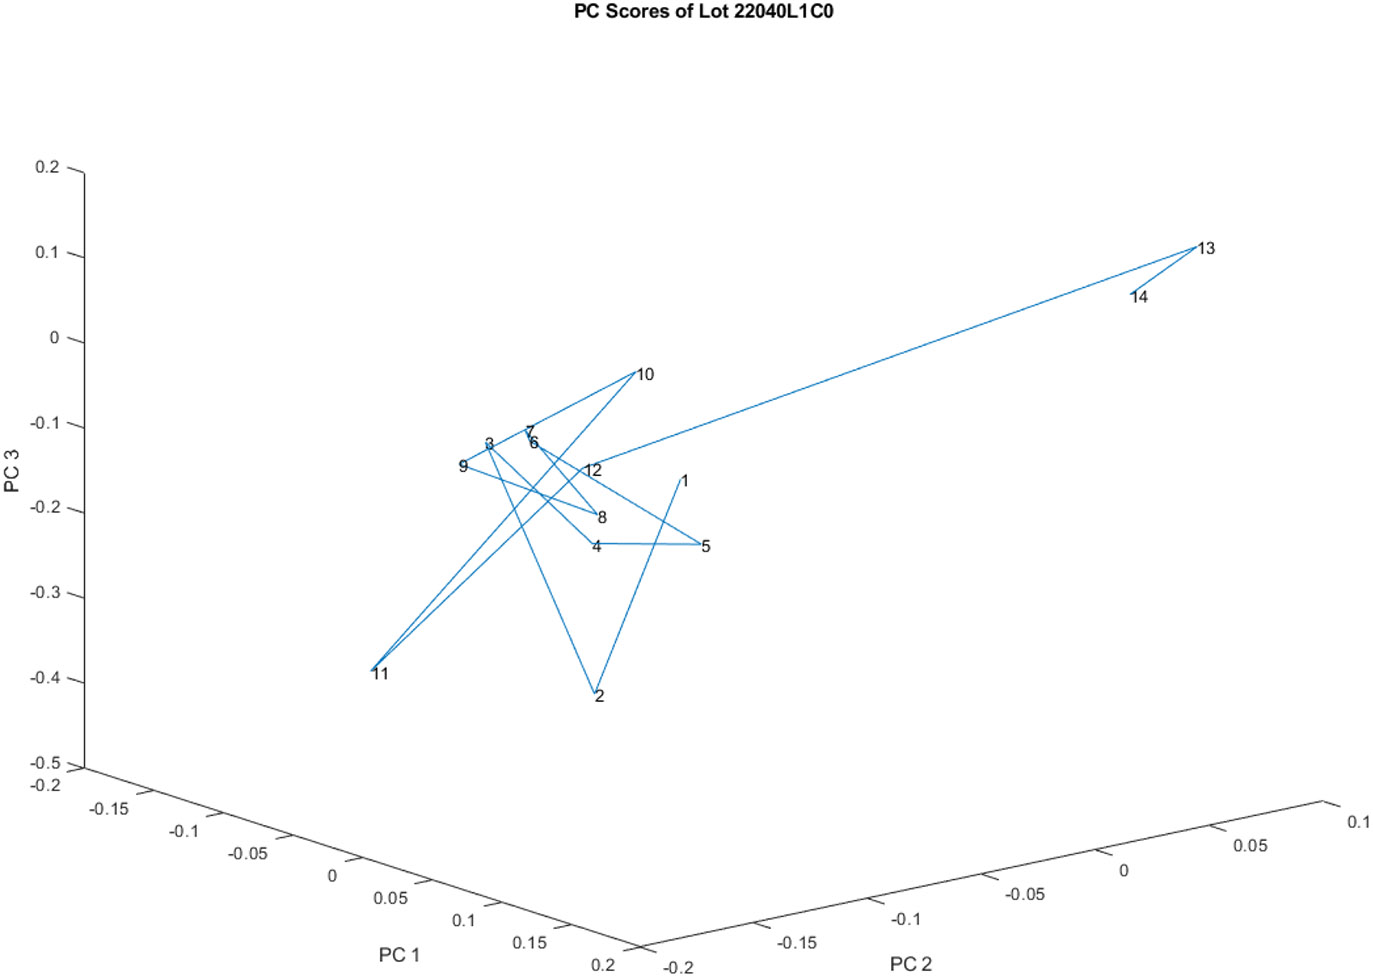
Another view of the principal component score plot of the 14 spectra obtained from vials in lot 20040L1C0 obtained through rotation. From this view it appears that there are only two groups of spectra in one lot of vials.
PC Plots
While Figure 3 seemingly presented three small groups within the lot, Figure 4 suggests that there might only be two distinct groups of spectra. This observation highlights the importance of considering multiple perspectives when analyzing complex datasets.
It is important to note that both figures, along with Table 1, point towards significant variability in the chemical composition of the vials in this lot. This variability is further corroborated by the analysis of the entire spectral library, which includes vials from two different lots.
Table 1:
Variation accounted for by each of the principal components of the spectra
| PC Number | Variation in this PC | Cumulative PC Variation |
|---|---|---|
| 1 | 0.5862 | 0.5862 |
| 2 | 0.1917 | 0.1917 |
| 3 | 0.1143 | 0.1143 |
| 4 | 0.0863 | 0.0863 |
| 5 | 0.0056 | 0.0056 |
| 6 | 0.0038 | 0.0038 |
| 7 | 0.0026 | 0.0026 |
| 8 | 0.0021 | 0.0021 |
| 9 | 0.0020 | 0.0020 |
| 10 | 0.0015 | 0.0015 |
Variation accounted for by each of the PCs of Lot 20040L1C0
Table 1 shows the variation accounted for by each of the principal components of the 14 spectra obtained from vials in lot 20040L1C0. The first principal component (PC1) accounts for 58.62% of the variation in the data. The second principal component (PC2) accounts for 19.17% of the variation. The third principal component (PC3) accounts for 11.43% of the variation. The remaining principal components account for less than 10% of the variation.
Table 1, along with Figure 3, demonstrates that there is significant variation in the chemical composition of the vials in lot 20040L1C0. This is further supported by Figure 4, which is another view of the principal component score plot, obtained through rotation. From this view, it appears that there are only two groups of spectra in the lot.
Interlot analysis
Smoothed spectra graphs of library
Figure 5 presents the Raman spectra of all 51 vials included in the spectral library, encompassing vials from two different lot numbers. This visualization allows for a direct comparison of the spectral profiles of all the samples, enabling the identification of potential variations in chemical composition across lots.
Figure 5.
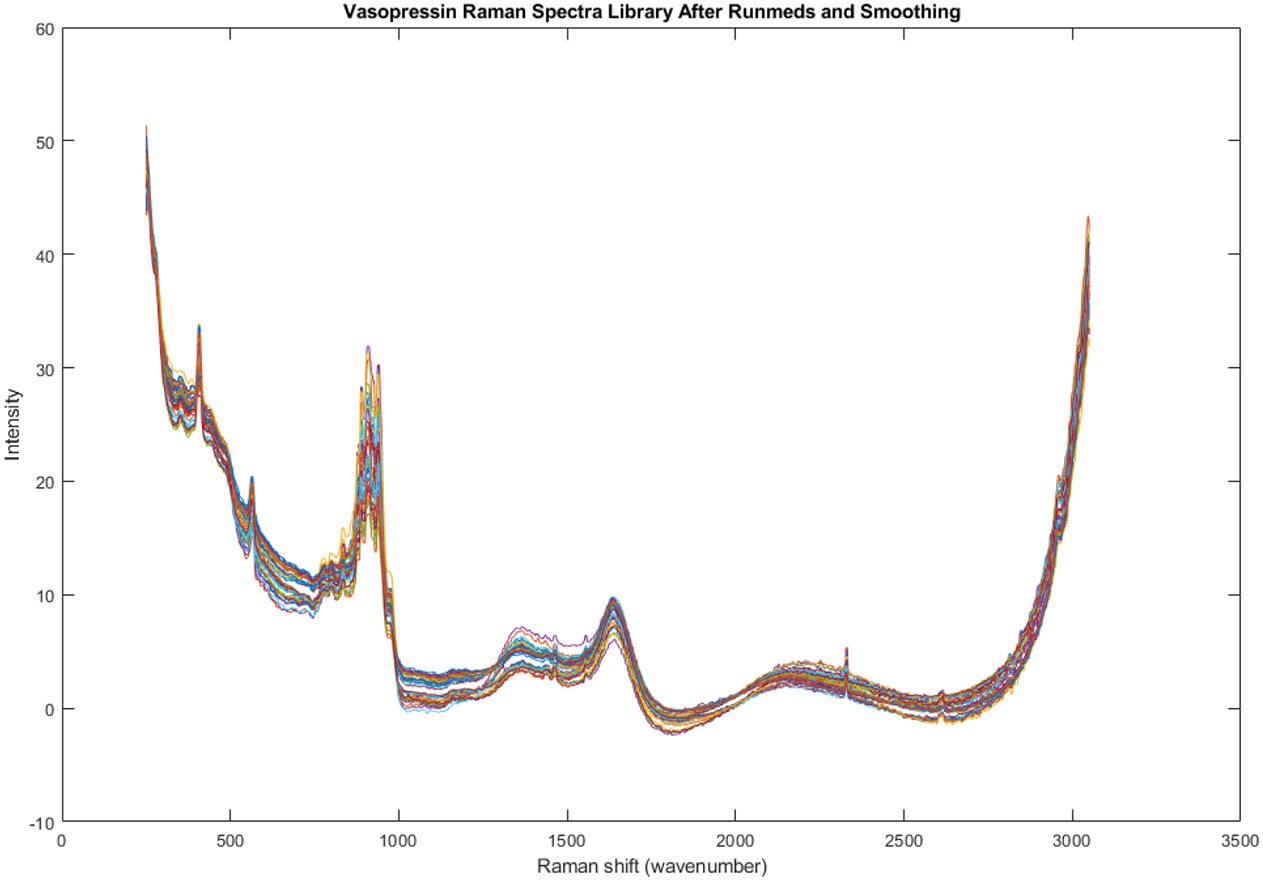
Raman spectra of every vial in the library (n = 51). These vials come from two lot numbers.
The figure is part of the interlot analysis, expanding upon the initial intralot analysis, which focused on lot 22040L1C0, as depicted in Figures 3 and 4 and Table 1. The interlot analysis aims to assess whether the observed variability extends beyond a single lot and if there are any patterns or trends associated with the different lot numbers.
This figure will be further explored and analyzed through principal component analysis (PCA) in subsequent figures and tables. PCA is a statistical technique that can be used to identify the main sources of variation in a dataset. This analysis will help determine if there are distinct groups within the spectral library and if these groups correspond to the lot numbers.
PC Plots
Figure 6 is a 3-D plot of the principal component scores of the spectral library, utilizing principal components (PCs) 1, 2, and 3. Despite the library containing vials from only two lot numbers, the spectra in this figure appear to cluster into four distinct groups. Furthermore, the observed groupings do not align with the lot numbers. This means that vials from the same lot don't necessarily share the same spectral characteristics, and vials from different lots might exhibit similar spectral features.
Figure 6.
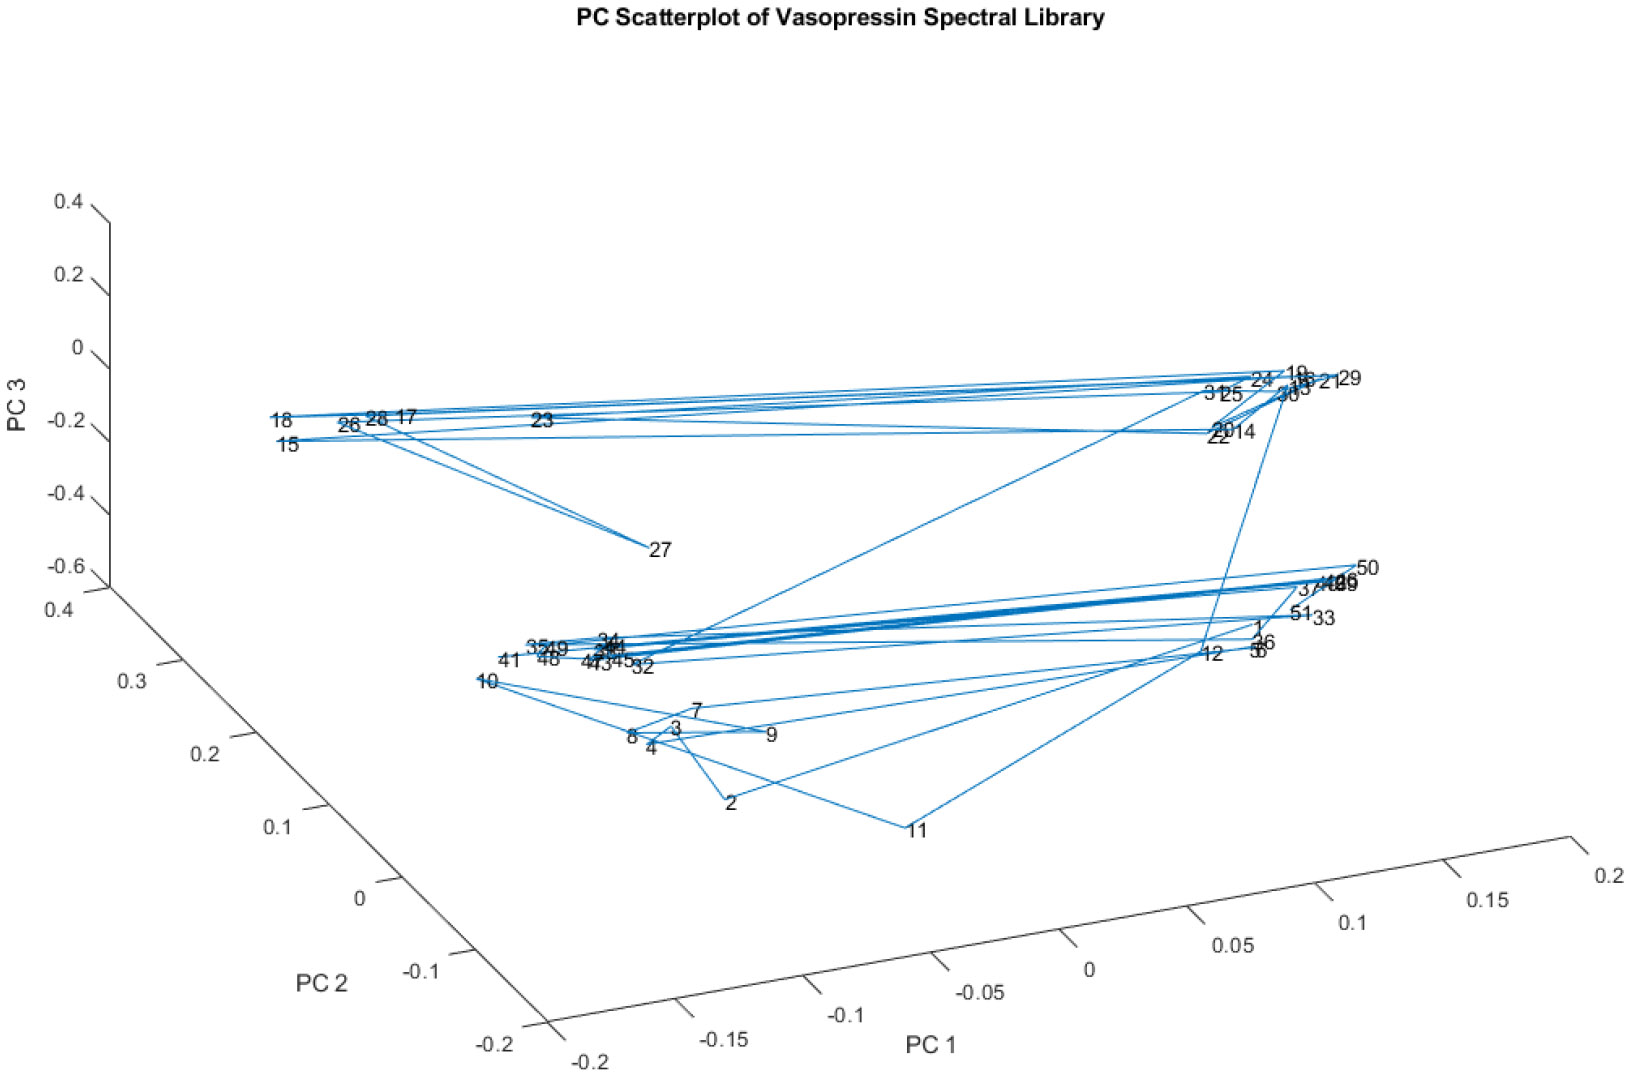
A plot of the principal component scores of the spectral library on PCs 1, 2, and 3. The spectra appear to fall in four groups in spite of the fact that there are only two lots of material in the library. Moreover, the two lots do not appear to correspond to the groupings of spectra observed.
This finding is significant because it suggests that the observed variability in chemical composition, initially identified within a single lot in Figure 3 and Figure 4, extends beyond a single batch of production. The presence of four groups instead of two (representing the two lots) indicates more complex factors are at play than just lot-to-lot variation.
Figure 6's insights contribute to the overall understanding of the potential process control issues during the manufacturing of vasopressin. The lack of correlation between spectral groupings and lot numbers suggests inconsistencies in the production process that might lead to variations in the final drug product's chemical composition. This observation is crucial for further investigation into the manufacturing process.
Figure 7 offers another perspective on the principal component scores of the spectral library, similar to Figure 6. However, this view is rotated, providing a different angle for visualizing the data and potentially revealing additional insights.
Figure 7.
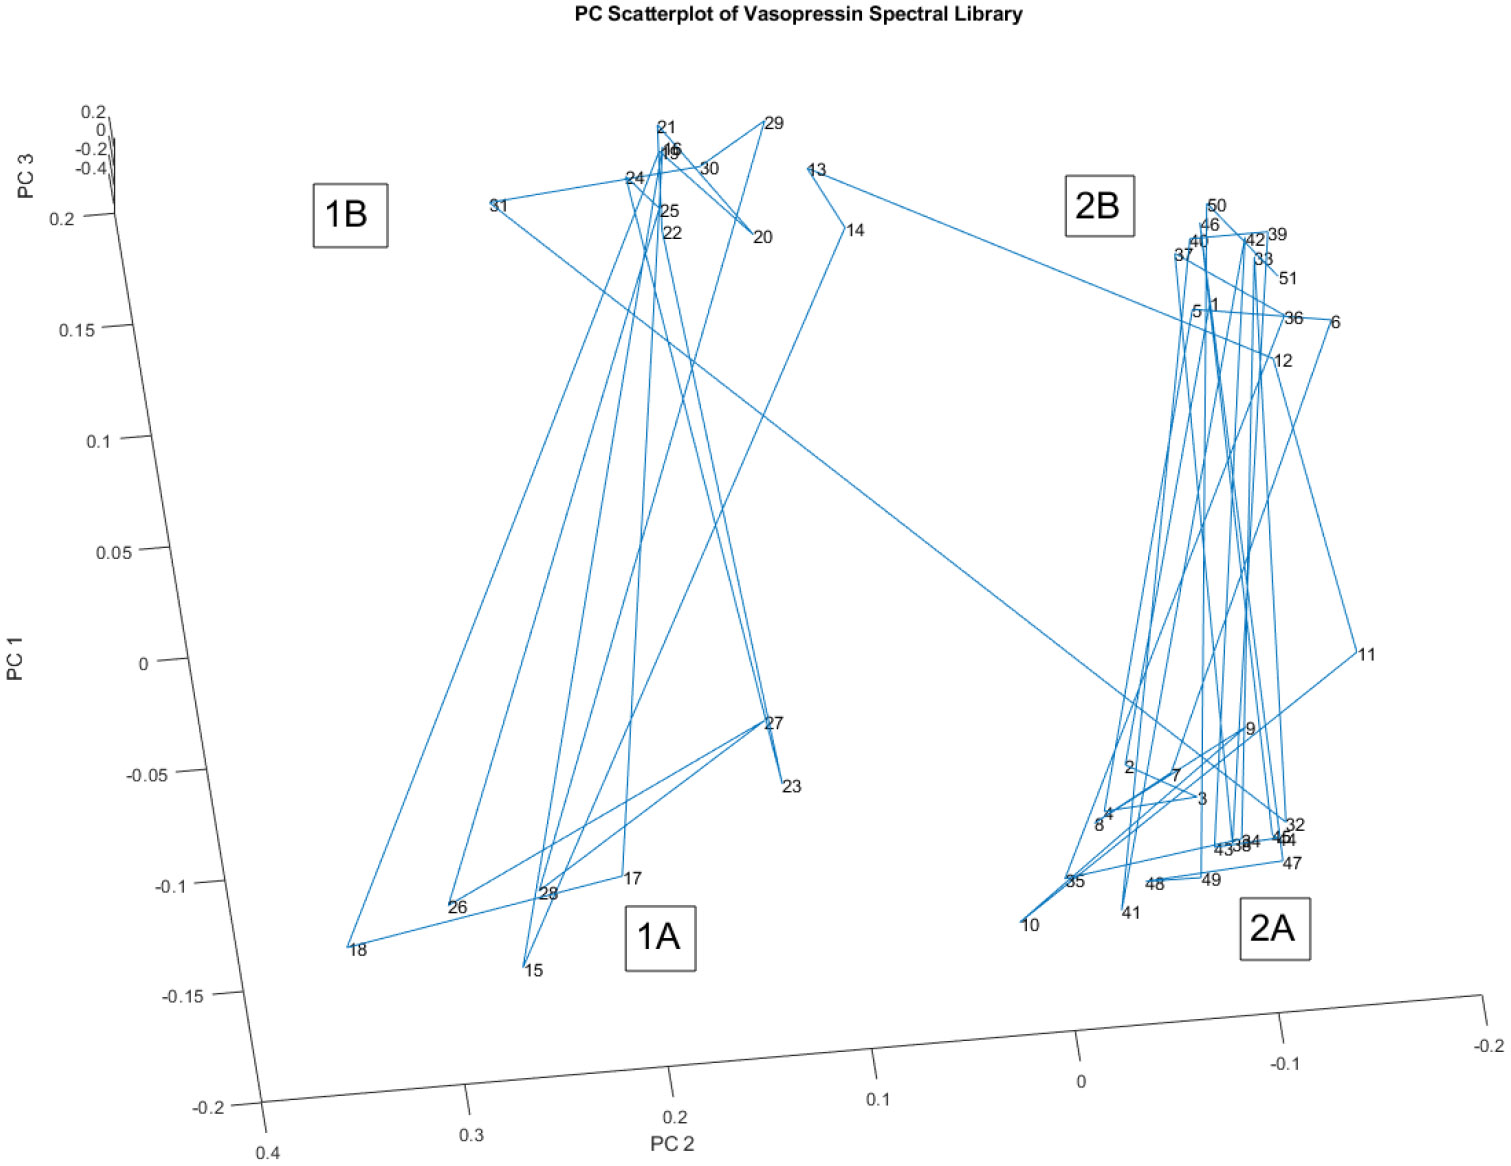
Another rotated view of the spectra in Figure 6, For purposes of discussion, four group labels have been added (1A, 1B, 2A, and 2B). The group labels do not align with the 2 lot numbers.
Just like in Figure 6, the spectra in Figure 7 form four distinct groups, labeled 1A, 1B, 2A, and 2B. Importantly, these group labels do not align with the two lot numbers present in the spectral library. This reinforces the observation that lot number does not determine group membership. The breakdown of the vials in each group and their corresponding lot numbers is:
- Vials 1-14 belong to Lot #22040L1C0, and vials 15-51 belong to Lot#22082L1C0.
- Group 1A consists of vials 15, 17, 18, 23, 26, 27, and 28.
- Group 1B comprises vials 13, 14, 16, 19, 20, 21, 22, 24, 25, 29, 30, and 31.
- Group 2A includes vials 2, 3, 4, 7, 8, 9, 10, 11, 32, 34, 35, 38, 41, 43, 44, 45, 47, 48, and 49.
- Group 2B consists of vials 1, 5, 6, 12, 33, 36, 37, 39, 40, 42, 46, 50, and 51.
The 'A' groups (1A and 2A) exhibit significant variation in the peak at 1300 to 1600 cm−1. This detail further highlights the heterogeneity within the 'A' groups, suggesting potential inconsistencies in the chemical composition of those specific vials.
Figure 7, coupled with the breakdown of group memberships, strengthens the argument for potential process control issues during the manufacturing of vasopressin. The fact that vials from different lots are clustered together, while vials from the same lot are scattered across groups, indicates that the manufacturing process might not consistently produce a uniform product. This variability, as evidenced by the spectral analysis, could potentially impact the drug's efficacy and safety.
Figure 8 presents a principal component (PC) scatterplot focusing on PCs 4, 5, and 6 of the spectral library. In contrast to Figure 6 and Figure 7, which highlighted four distinct groups when considering PCs 1, 2, and 3, Figure 8 demonstrates that these four groups are no longer discernible when examining PCs 4, 5, and 6.
Figure 8.
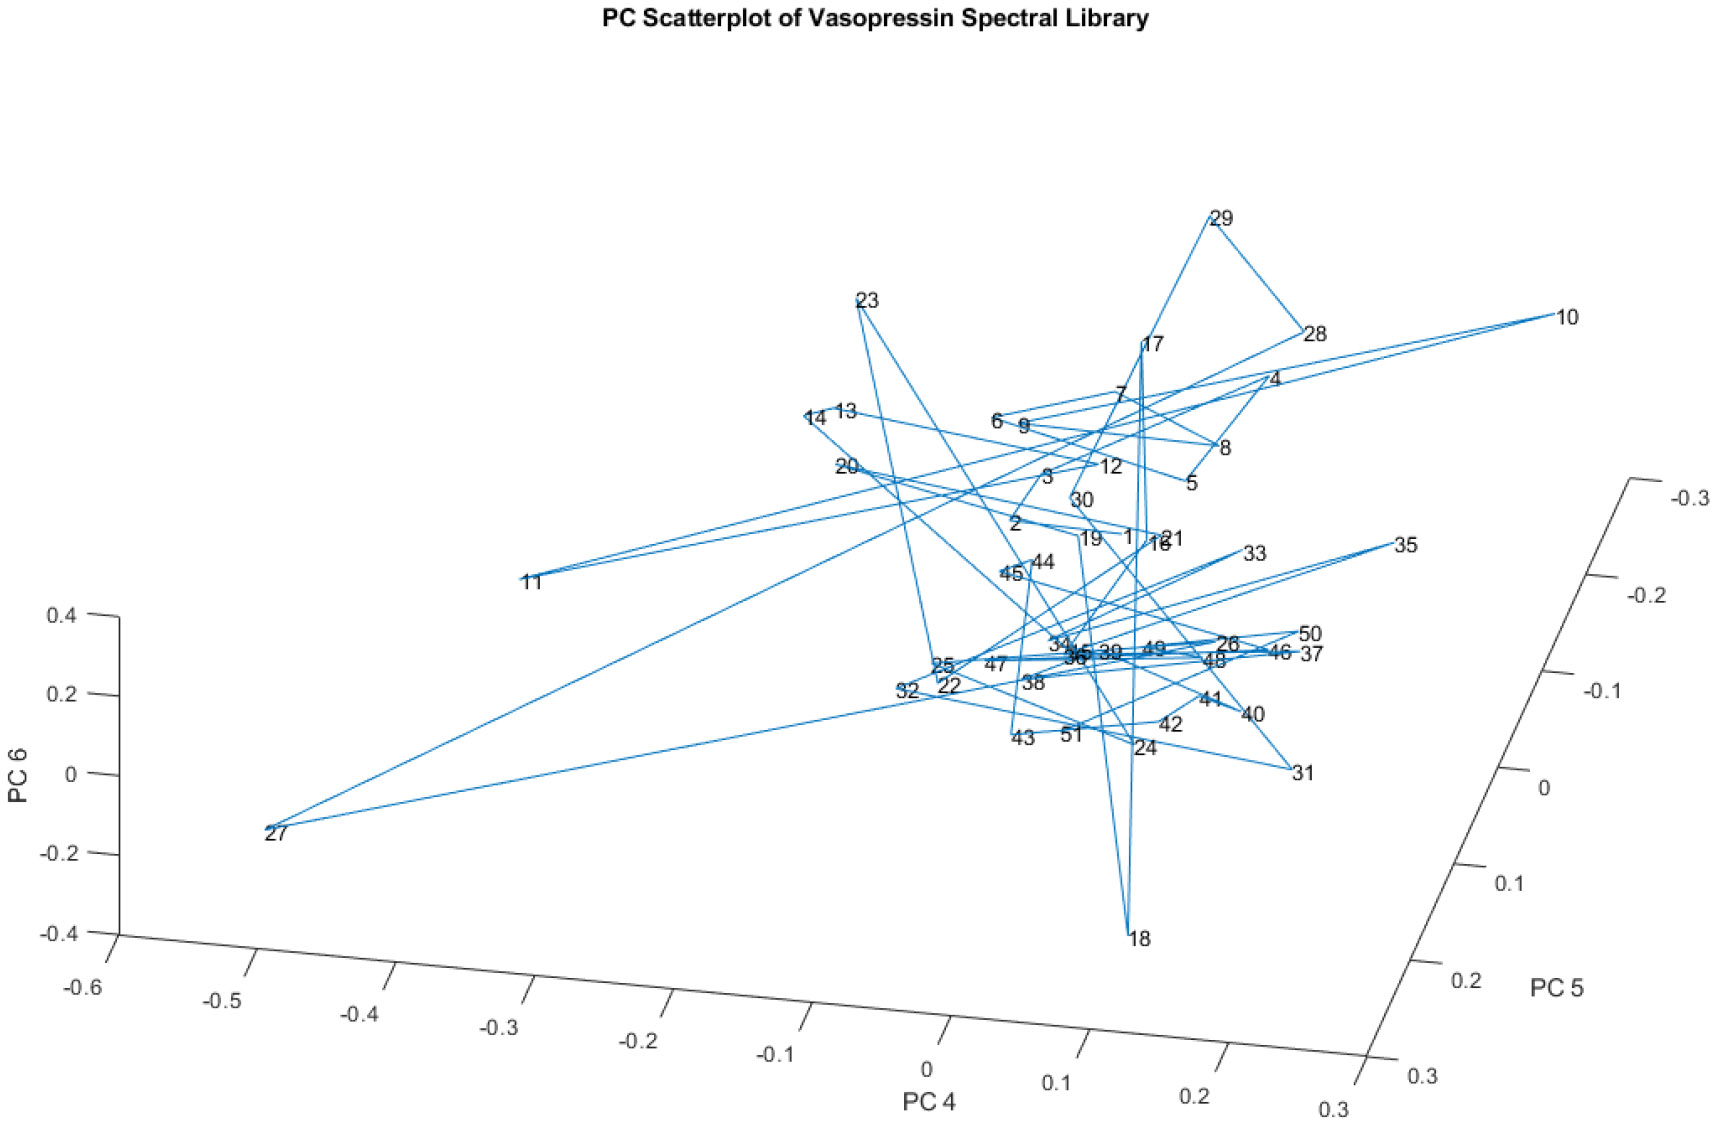
A PC scatterplot of PCs 4, 5, and 6 of the spectral library. The four nominal groups are no longer visible
This observation suggests that the variation captured by these higher-order principal components is not sufficient to differentiate the groups that were evident in the earlier PCs. This could imply that the chemical differences responsible for the four groups are primarily reflected in the variation captured by PCs 1, 2, and 3. The higher-order PCs might represent more subtle variations within the data that are not directly related to the factors separating the four main groups.
The diminishing separation of groups with higher-order PCs is a common phenomenon in principal component analysis. The first few principal components typically capture the most significant sources of variation in the data, while subsequent components represent progressively smaller and more nuanced differences.
Figure 9, similar to Figure 8, showcases a principal component (PC) scatterplot, but this time focusing on PCs 7, 8, and 9 of the spectral library. The key takeaway from Figure 9 is that, like in Figure 8, the four apparent groups identified in Figure 6 and Figure 7, are no longer visible when considering these higher-order principal components.
Figure 9.
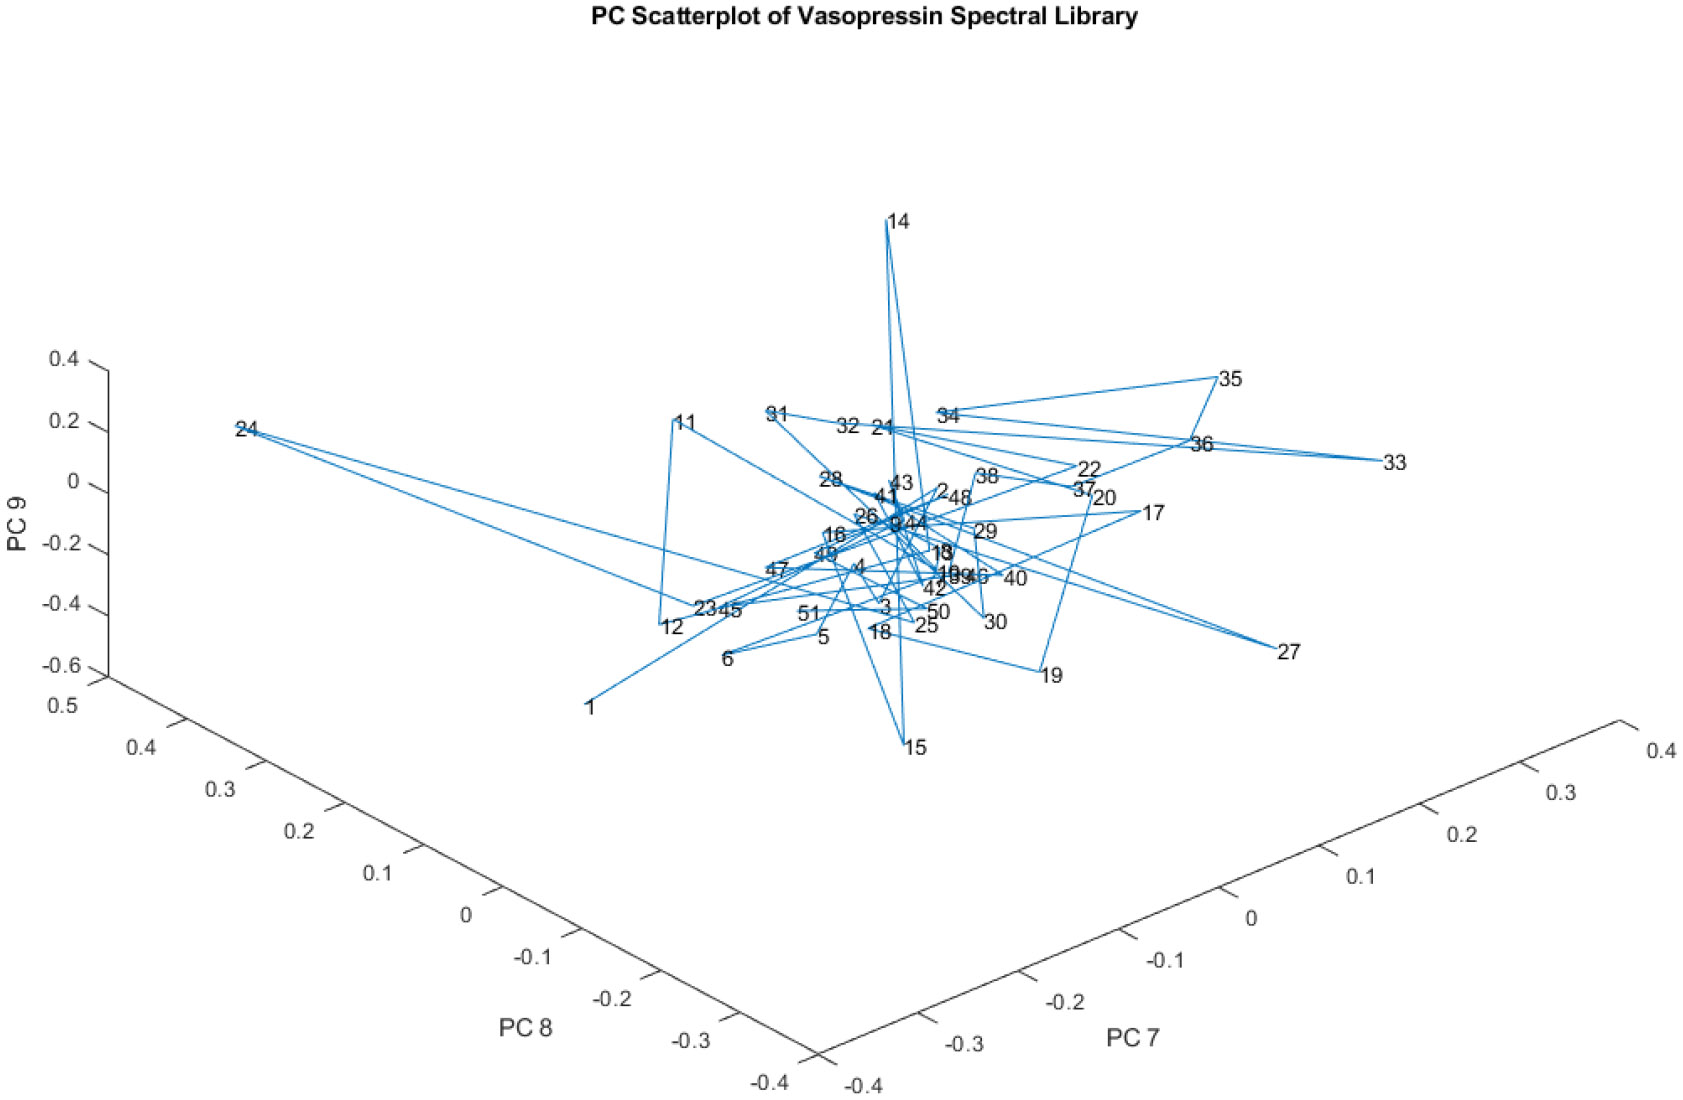
A PC scatterplot of PCs 7, 8, and 9 of the spectral library. The four apparent groups are not visible.
This observation reinforces the idea that the variations captured by these higher-order PCs are not the primary drivers of the separation between the four groups. The chemical differences that define those groups are mainly reflected in the variation captured by PCs 1, 2, and 3.
This progressive decrease in group separation with higher-order PCs aligns with the typical behavior observed in principal component analysis. The initial PCs capture the most dominant variations in the data, while subsequent PCs represent increasingly subtle and less influential differences. These higher-order PCs might be associated with minor variations within the samples that do not contribute significantly to the differentiation of the main groups.
Figure 10 displays the Raman spectrum of Group 1A, which was initially identified in Figure 7 as one of the four distinct groups within the spectral library. The most notable distinction among the spectra within this group is the variation in the size of a broad peak located around 1400 cm−1. Recall that Figure 7 showed a rotated view of the principal component scores of the entire spectral library, revealing four groups (1A, 1B, 2A, and 2B) that did not align with the two lot numbers present. This indicated that the chemical composition of the vials was not solely determined by the lot number.
Figure 10.
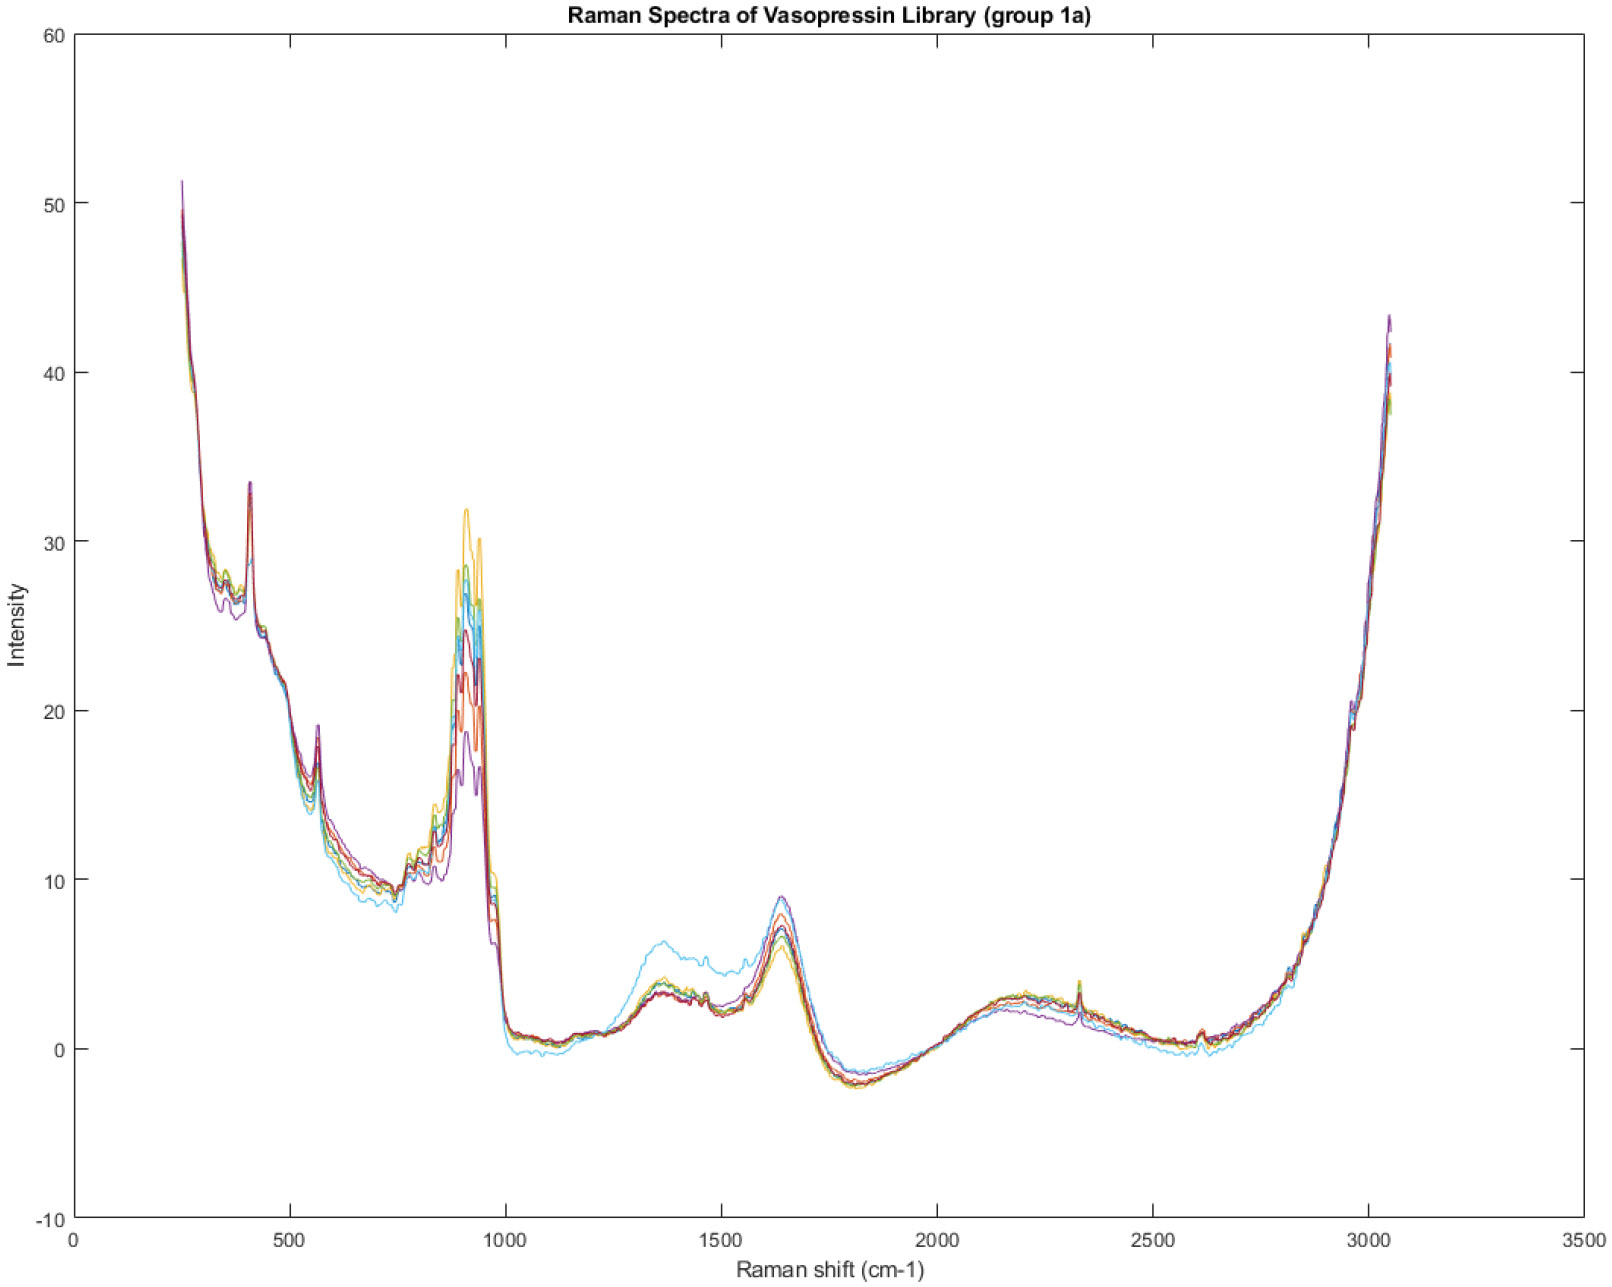
The Raman spectrum of group 1A identified in Figure 7. The most obvious difference between the spectra is in the size of a broad peak at about 1400 cm−1.
Figure 10 focuses specifically on the spectral characteristics of Group 1A, highlighting a key area of variability within this group: the peak at 1400 cm−1. The differing sizes of this peak suggest variations in the concentration or chemical environment of the molecule responsible for this specific Raman signal. This observation further supports the notion that the manufacturing process may not be consistently producing a homogeneous product.
Figure 11, Figure 12, and Figure 13 provide similar spectral visualizations for Groups 1B, 2A, and 2B, respectively. These figures, along with Figure 10, allow for a detailed examination of the spectral features of each group, potentially aiding in identifying the specific chemical components responsible for the observed variations.
Figure. 11.
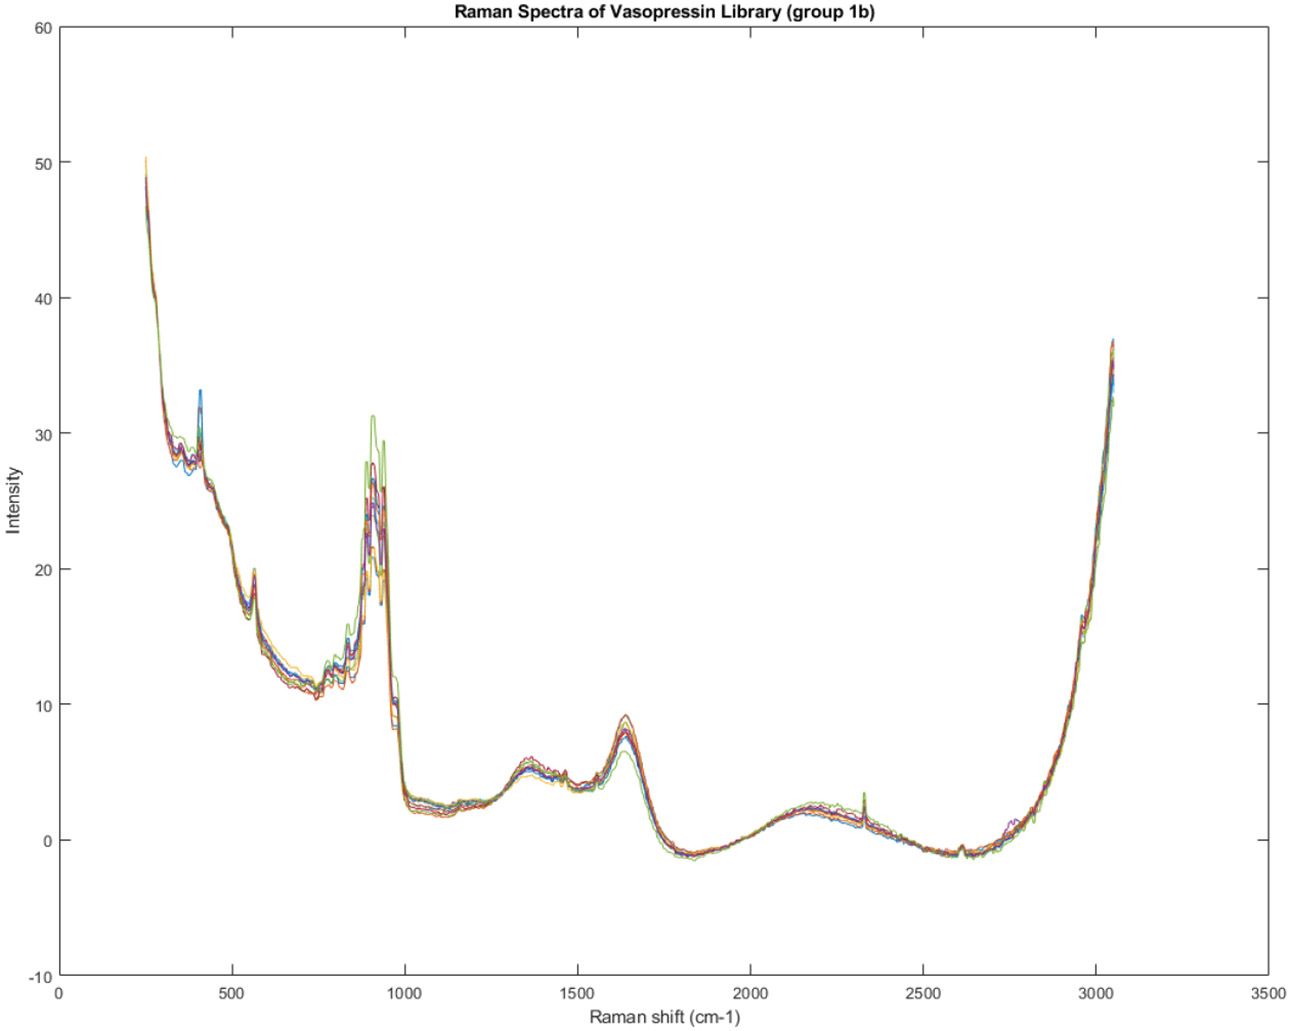
Spectra of Group 1B of the Raman spectra identified in Figure 7.
Figure 12.
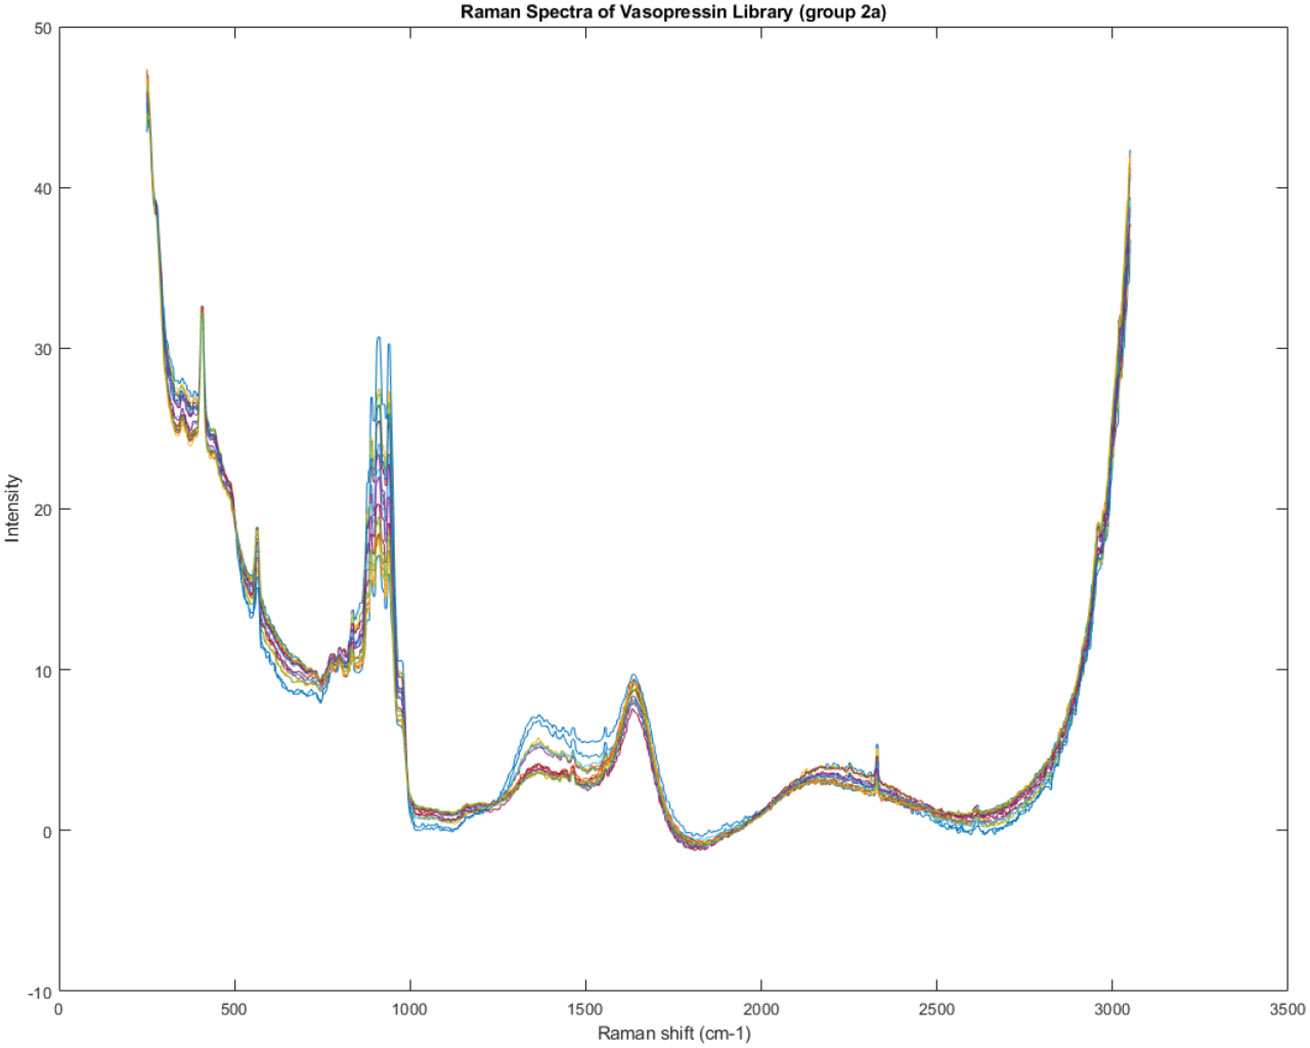
Spectra of Group 2A of the Raman spectra identified in Figure 7.
Figure 13.
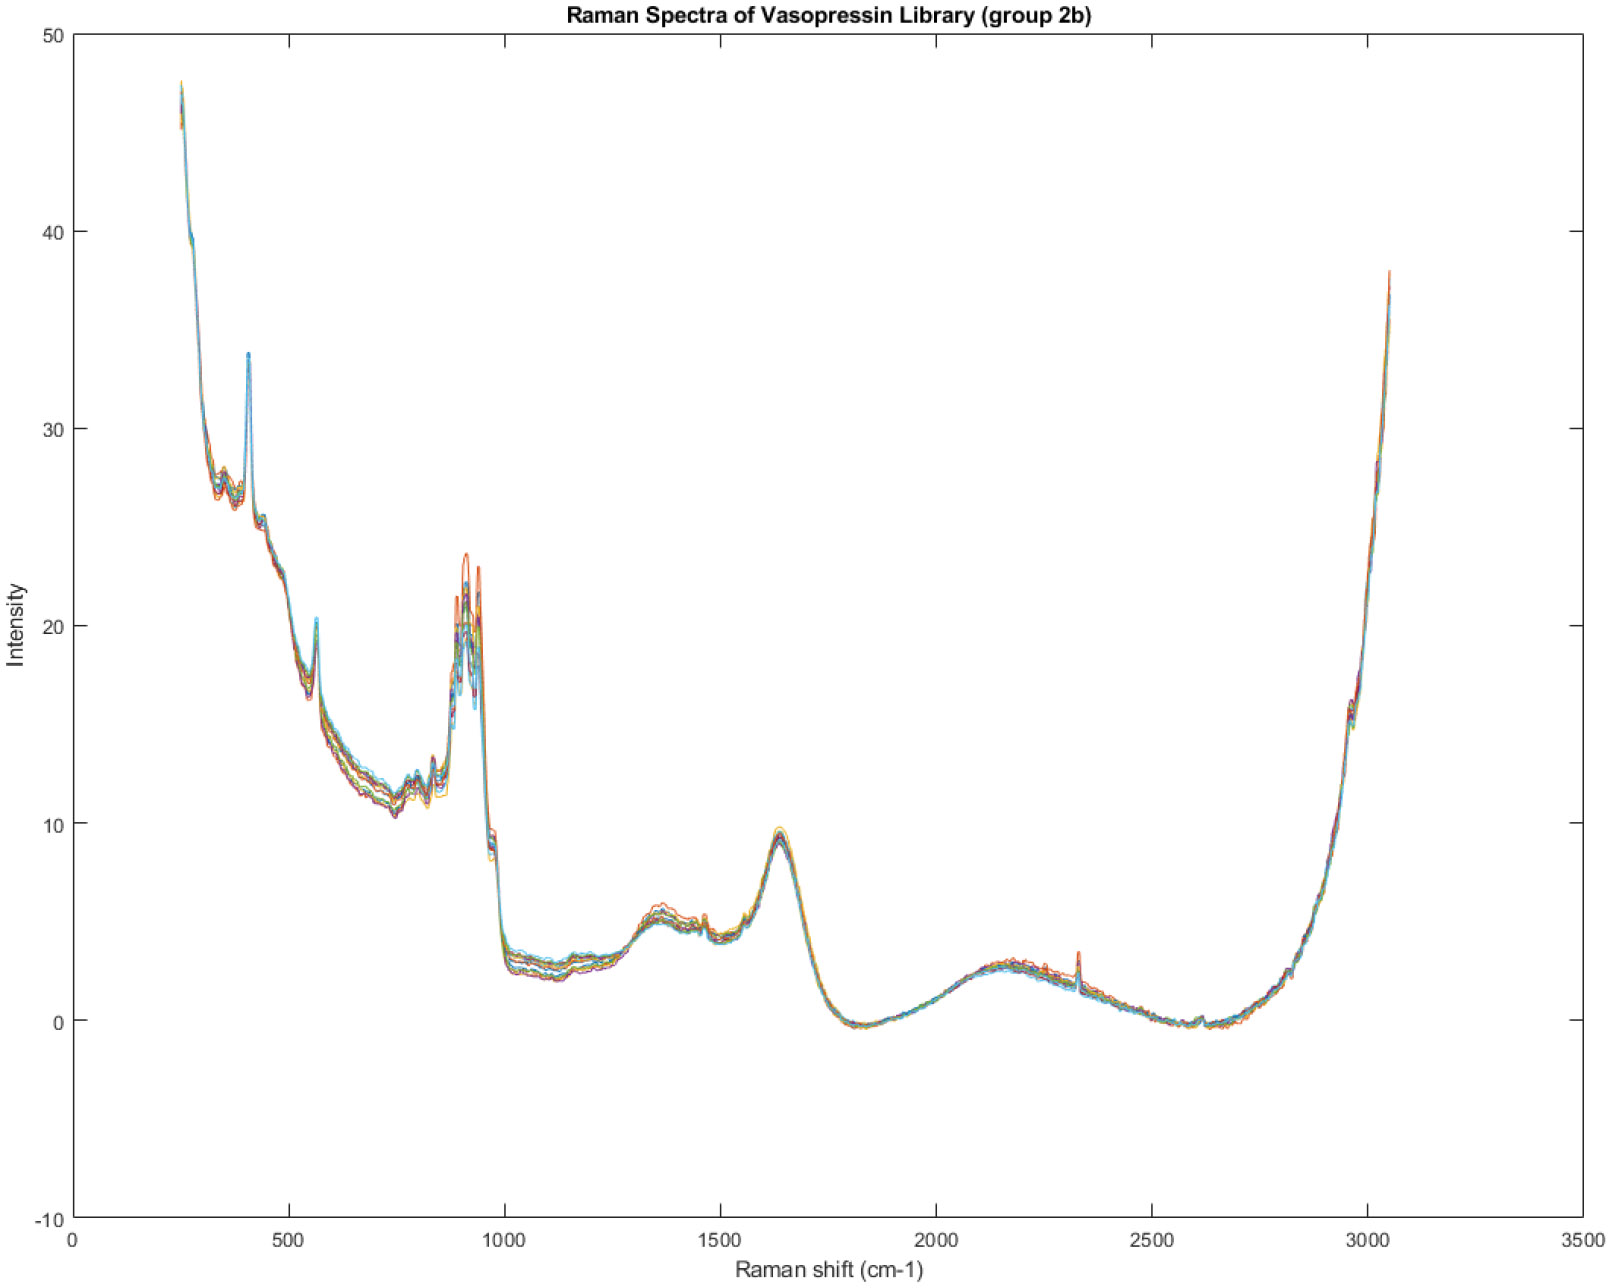
Spectra of Group 2B of the Raman spectra identified in Figure 7.
Raman Spectra of Each Group
Figure 14 displays the principal component (PC) loadings for PC 1 of the Raman spectra within the spectral library. PC loadings represent the contribution of each variable (in this case, the Raman intensity at each wavenumber) to the corresponding principal component. In essence, the PC loadings plot shows which spectral features are most influential in defining PC 1.
Figure 14.
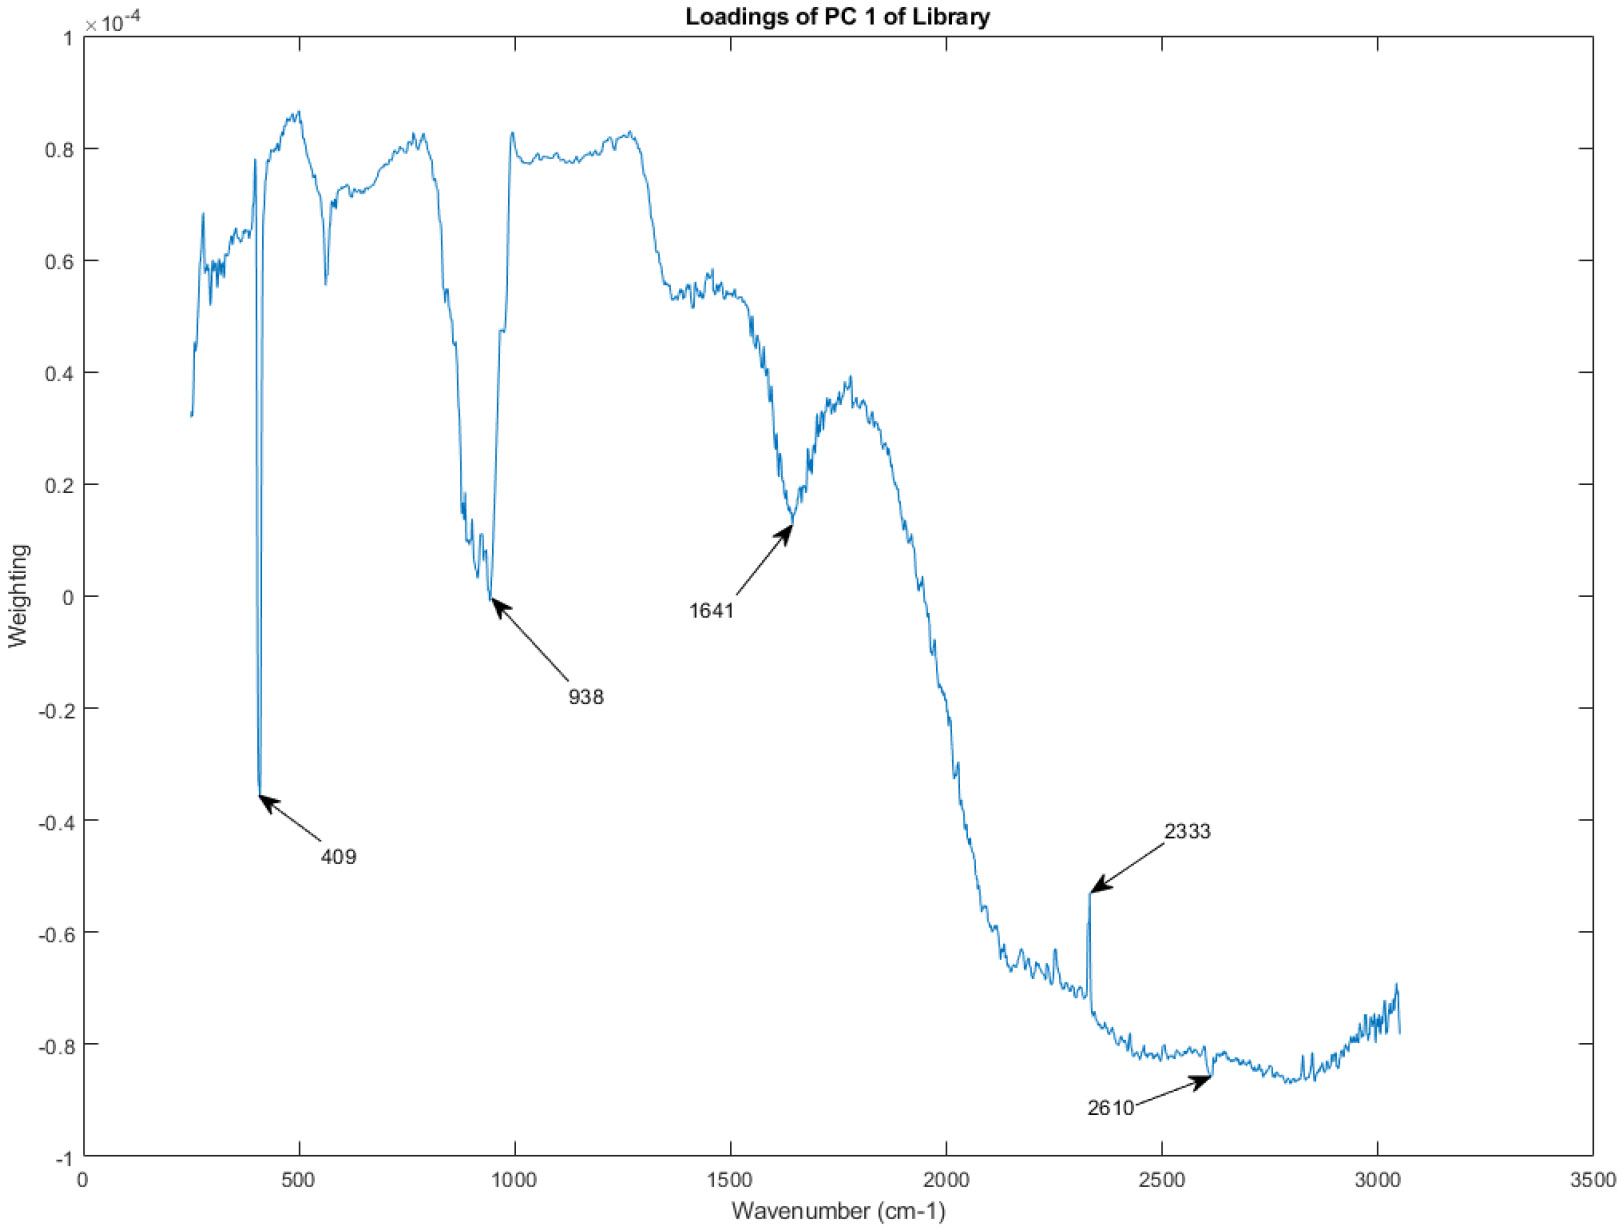
The principal component loadings of PC 1 of the Raman spectra in the library.
Recall that PC 1, as seen in Figure 6 and Figure 7, is the principal component that captures the largest amount of variation in the data. Therefore, the PC loadings for PC 1 highlight the spectral regions that are most responsible for the primary source of variability among the analyzed vasopressin vials.
Examining the shape of the PC loadings in Figure 14 can provide insights into the chemical differences contributing to the variability observed in the spectral library. Peaks and troughs in the PC loadings plot correspond to spectral regions where variations in Raman intensity are strongly associated with PC 1. By comparing these peaks and troughs to known Raman spectra of potential components in the vasopressin vials, researchers could potentially identify the specific chemical groups or molecules driving the observed variability.
PC Loadings of the Library
Figure 15, Figure 16, Figure 17, Figure 18, Figure 19, Figure 20, Figure 21, and Figure 22 showcase the PC loadings for the remaining principal components, PC 2 through PC 9. These figures provide a comprehensive picture of the spectral features contributing to each principal component, enabling a deeper understanding of the sources of variation within the spectral library.
Figure 15.
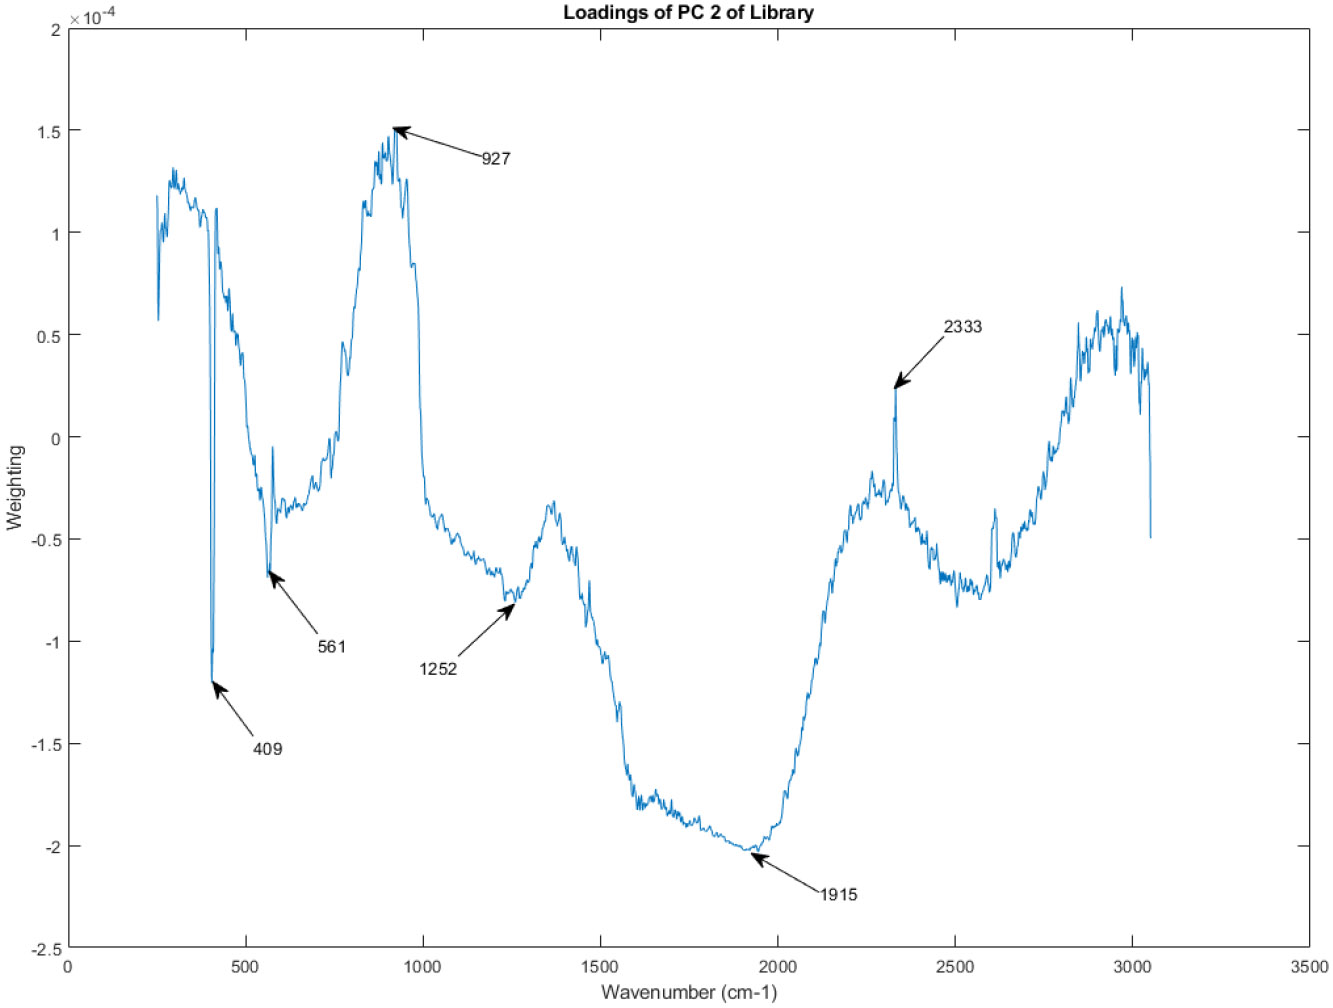
The principal component loadings of PC 2 of the Raman spectra in the library.
Figure 16.
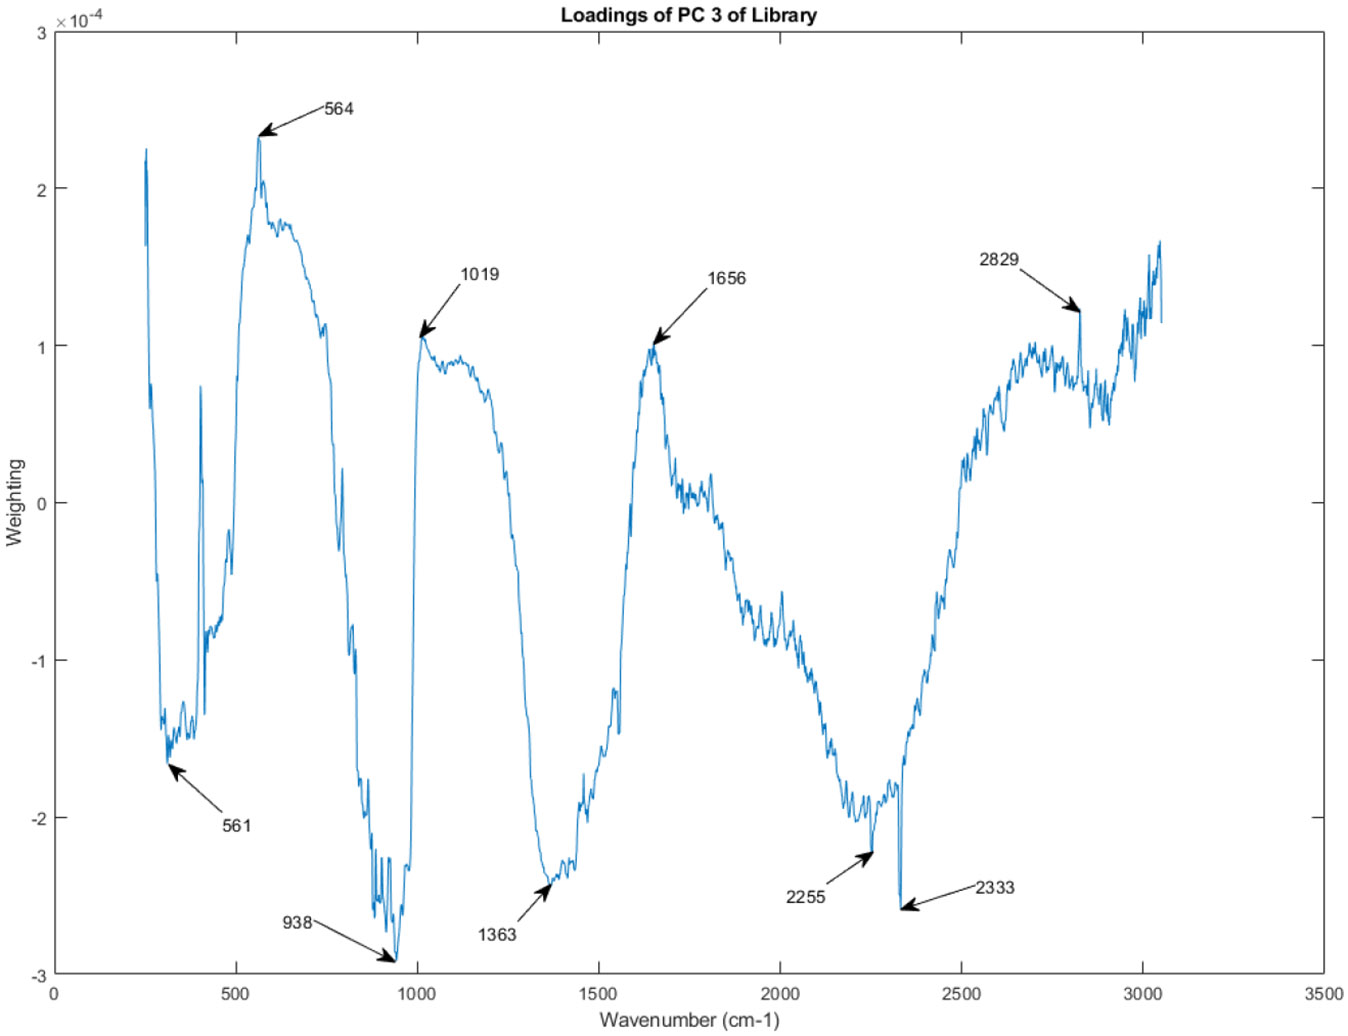
The principal component loadings of PC 3 of the Raman spectra in the library.
Figure 17.
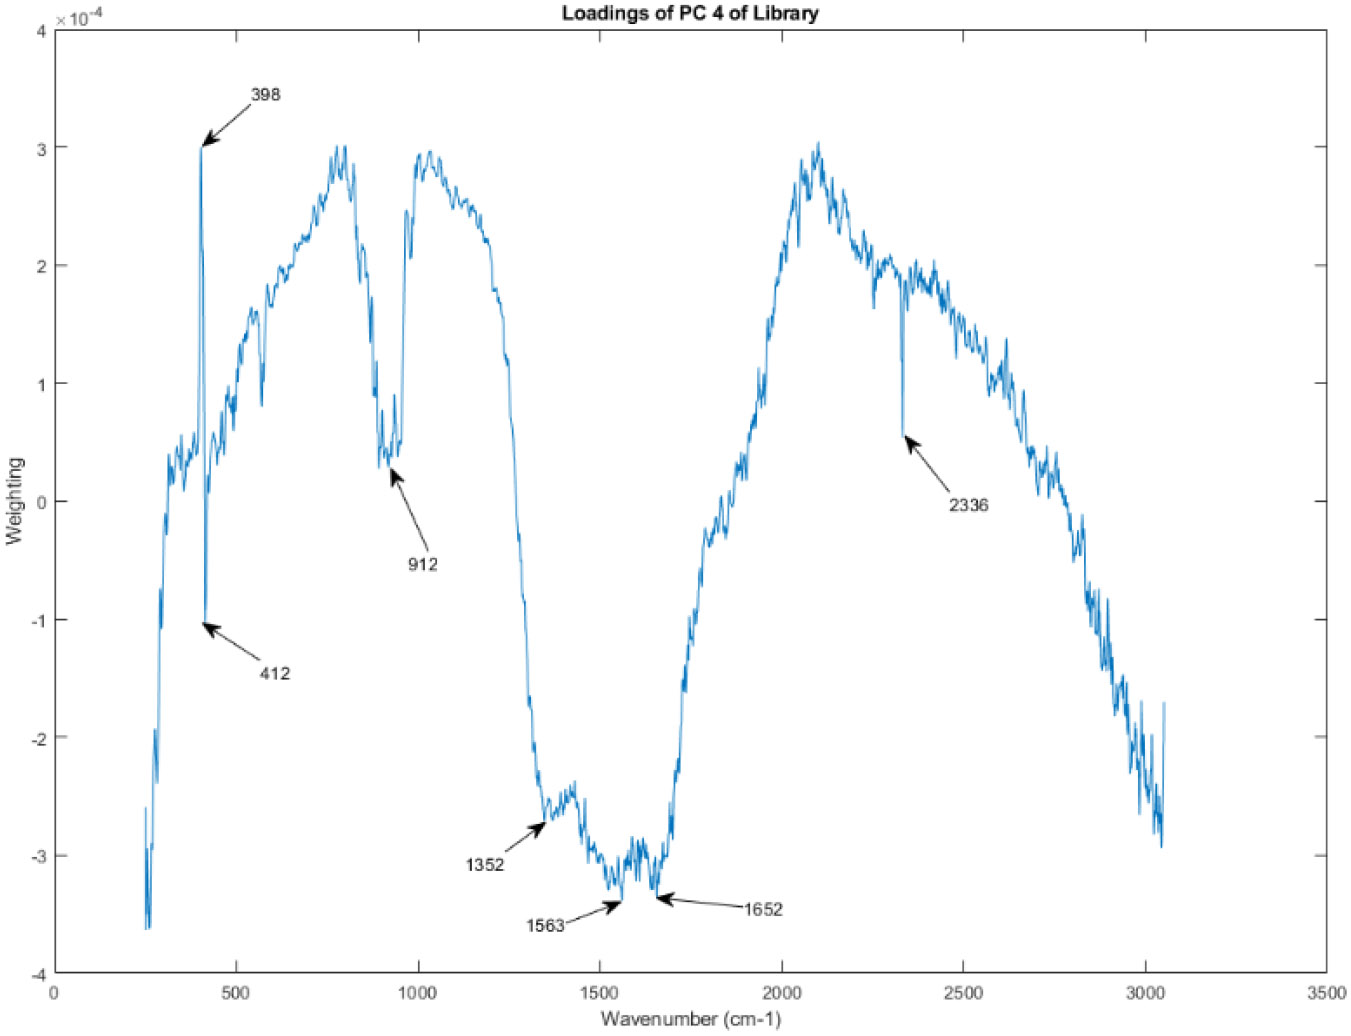
The principal component loadings of PC 4 of the Raman spectra in the library.
Figure 18.
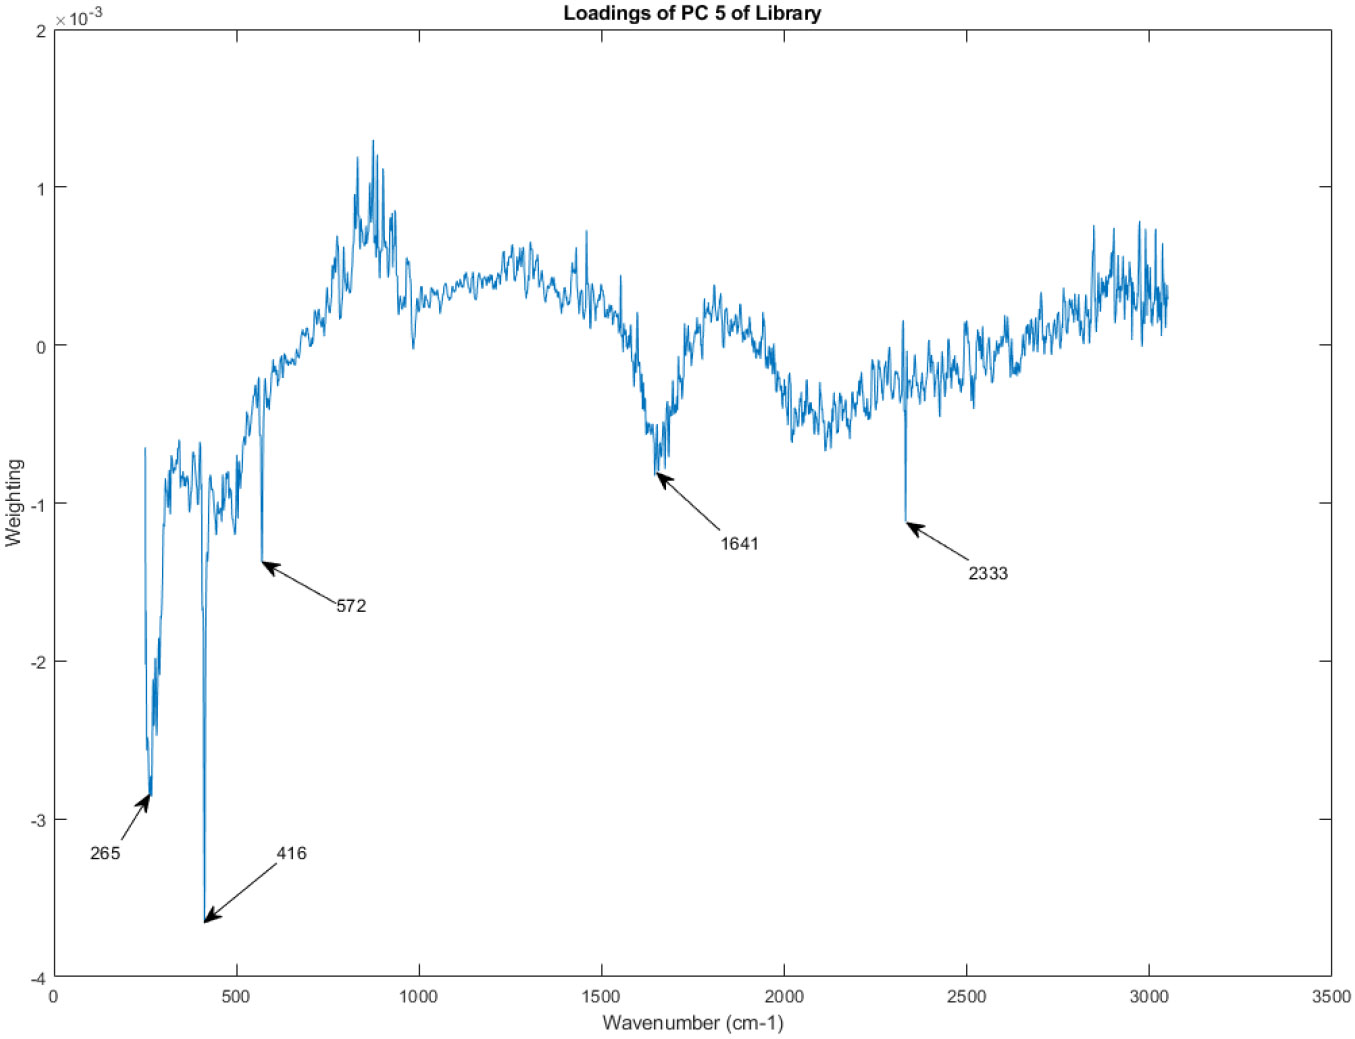
The principal component loadings of PC 5 of the Raman spectra in the library.
Figure 19.
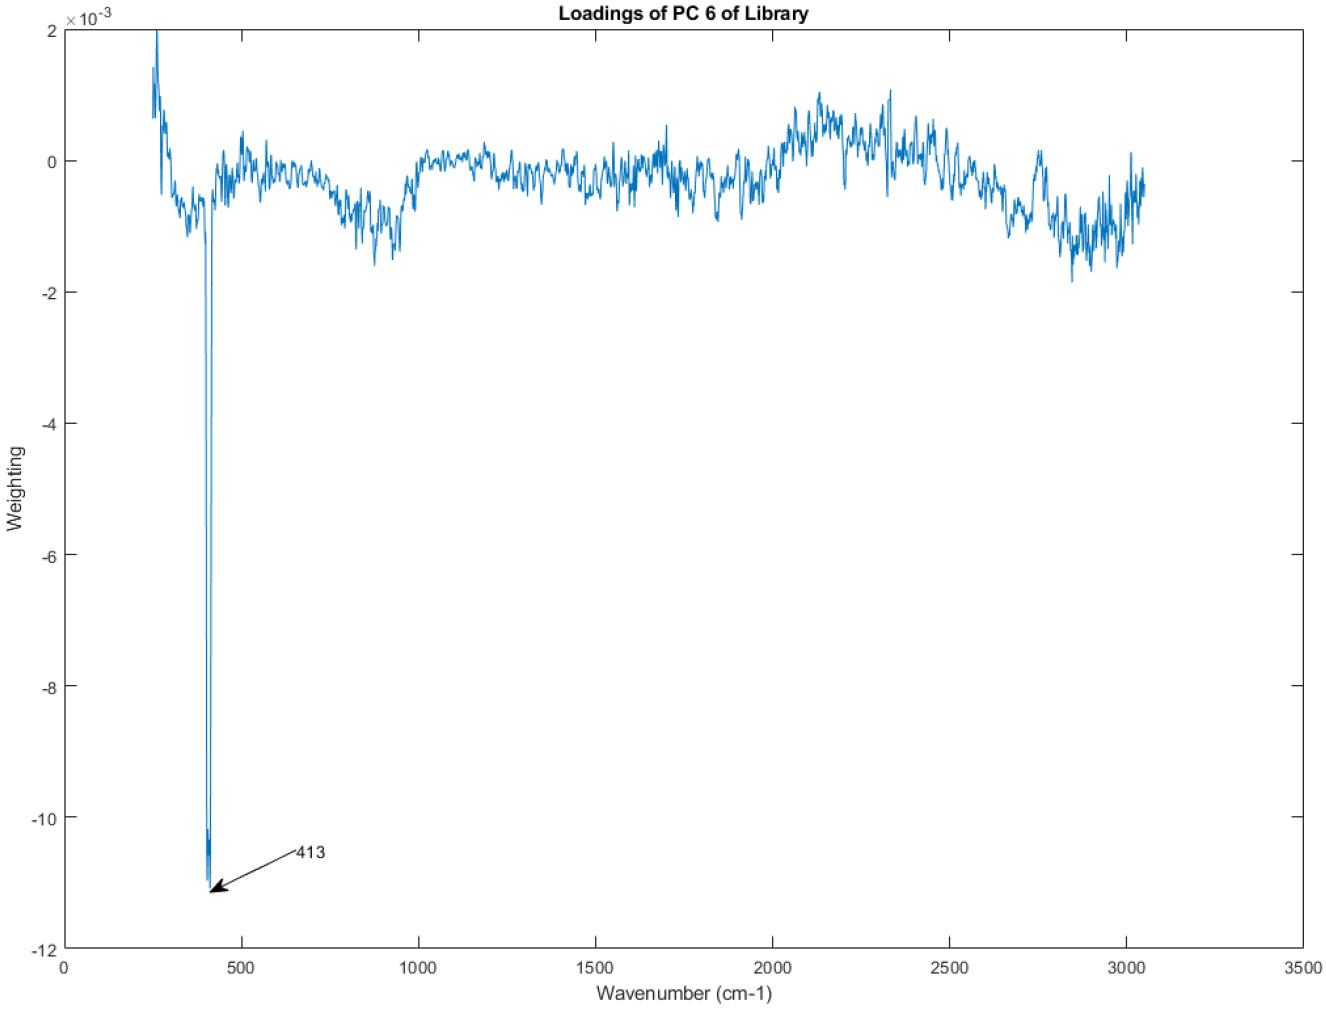
The principal component loadings of PC 6 of the Raman spectra in the library.
Figure 20.
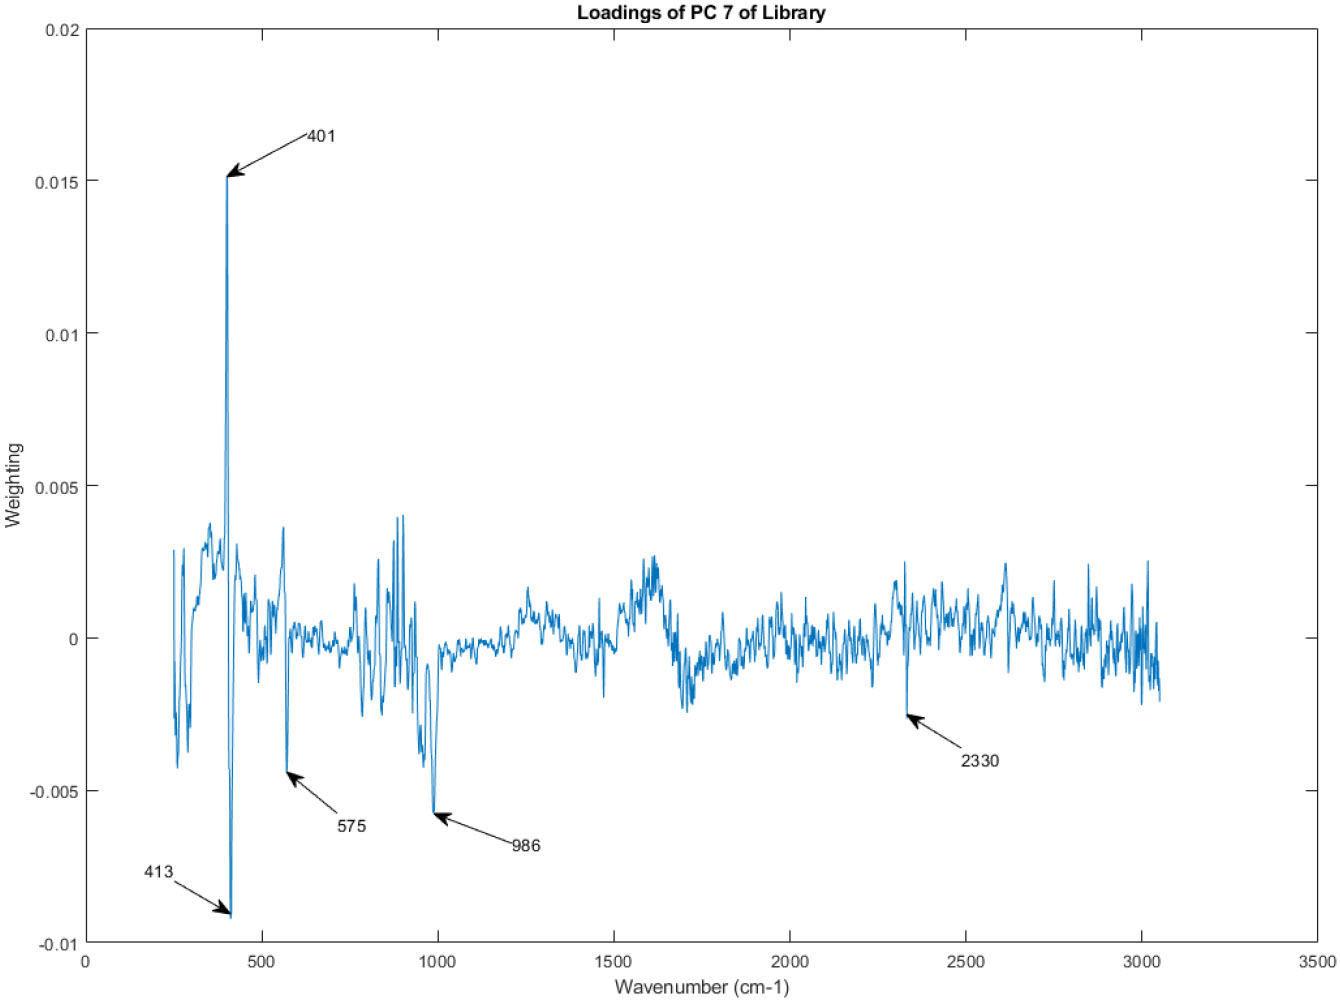
The principal component loadings of PC 7 of the Raman spectra in the library.
Figure 21.
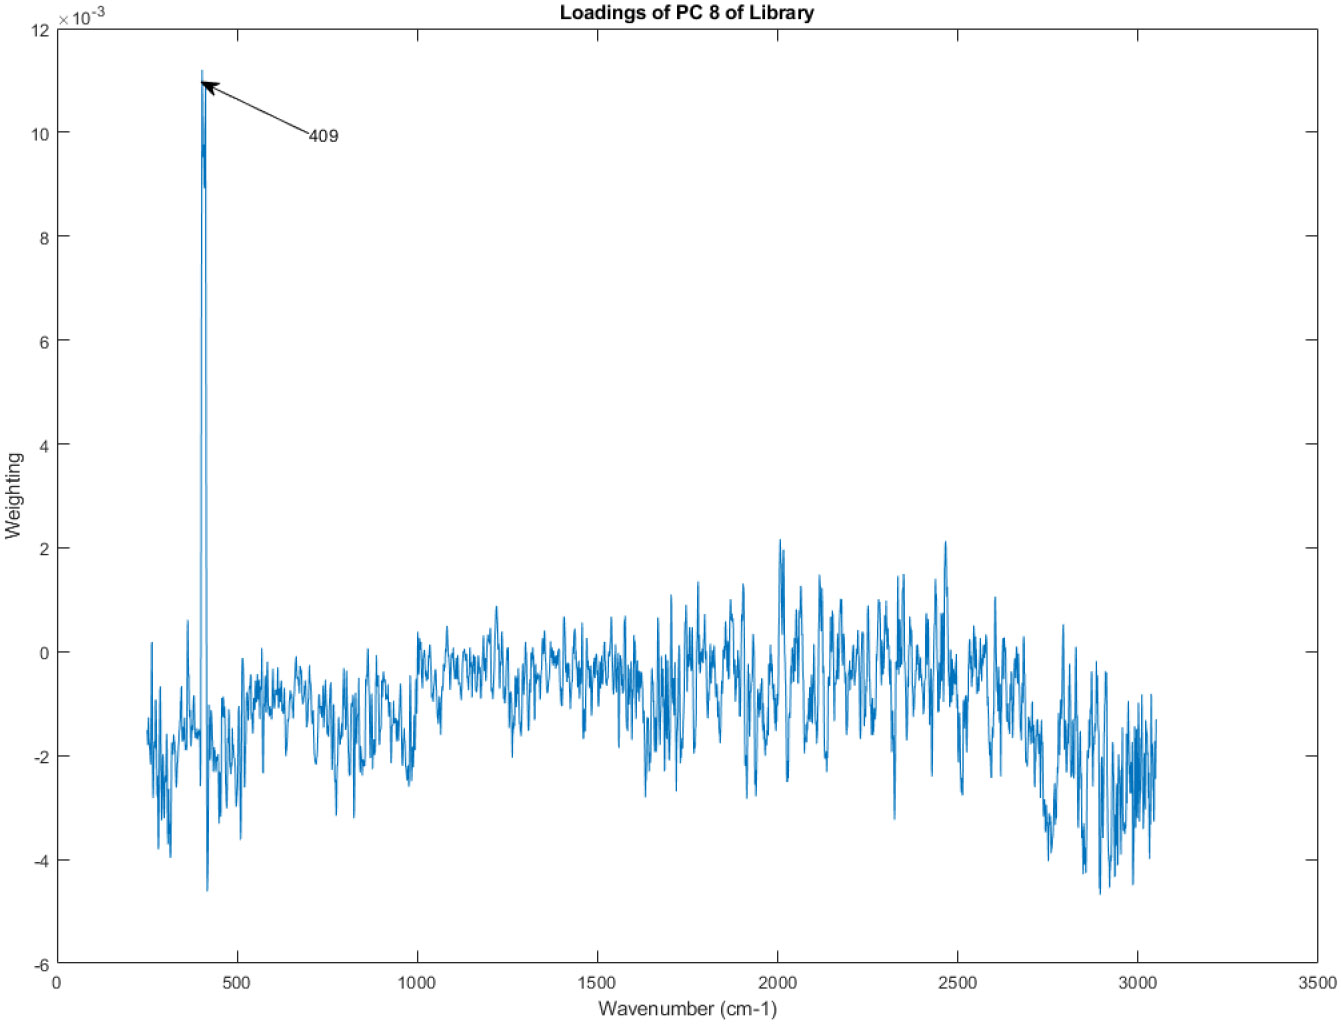
The principal component loadings of PC 8 of the Raman spectra in the library.
Figure 22.
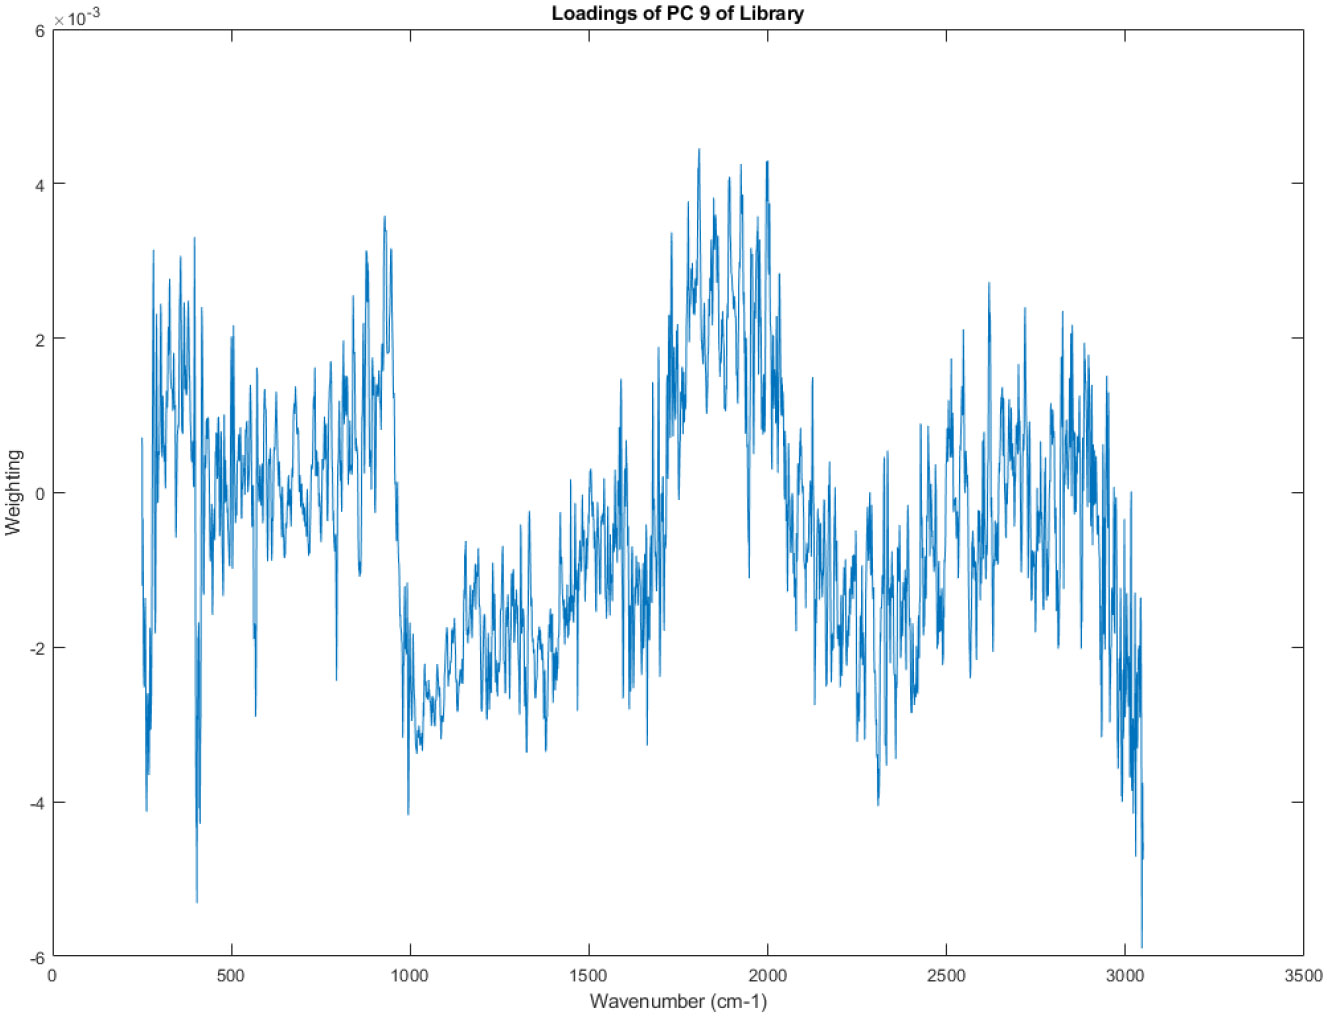
The principal component loadings of PC 9 of the Raman spectra in the library.
Variation accounted for by each of the PCs in the Library
Table 2 displays the variation accounted for by each of the principal components of the spectra in the library of 51 vials of vasopressin. The first three principal components (PC1, PC2, and PC3) account for the majority of the variation in the data, at 54.25%, 23.25%, and 14.19% respectively. This means that these three components capture most of the differences between the spectra of the different vials. The remaining principal components account for a much smaller proportion of the variation.
Table 2:
Variation accounted for by each of the principal components of the spectra in the library
| PC Number | Variation in this PC | Cumulative PC Variation |
|---|---|---|
| 1 | 0.5425 | 0.5425 |
| 2 | 0.2325 | 0.7750 |
| 3 | 0.1419 | 0.9169 |
| 4 | 0.0614 | 0.9783 |
| 5 | 0.0081 | 0.9864 |
| 6 | 0.0029 | 0.9893 |
| 7 | 0.0013 | 0.9905 |
| 8 | 0.0010 | 0.9915 |
| 9 | 0.0008 | 0.9923 |
| 10 | 0.0005 | 0.9928 |
The fact that the first few principal components account for most of the variation suggests that there are a few underlying factors that are driving the differences between the spectra. This is consistent with the findings of the subcluster detection test, which showed that there are at least two distinct chemical compositions in the samples.
The information from Table 2 is similar to Table 1, which we discussed earlier. Table 1 focused on one lot of vasopressin, 20040L1C0, while Table 2 focuses on both lots. This demonstrates that the significant variation in the chemical composition of the vials occurs across lots.
Subcluster detection results
The subcluster detection test was run on the spectral library, training first on Group 1 and measuring to Group 2, and then training on Group 2, and measuring to Group 1. Training on Group 1 yielded a confidence limit on r of 0.9337 (p=0.02). The measured r= 0.9125, so the null hypothesis that Group 2 has the same scale and location as Group 1 was rejected. Testing in the other direction gave a confidence limit on r=0.9466 (p=0.02), and r=0.9295, so the null hypothesis that Group 1 has the same scale and location as Group 2 was rejected. There appear to be at least 2 distinct chemical compositions in the samples and these two distinct compositions are in both different lots of the drug.
Conclusion
Vasopressin is a polypeptide hormone used via injection to raise blood pressure in adults with vasodilatory shock who remain hypotensive after fluids and catecholamines. This sterile, aqueous solution contains synthetic arginine vasopressin for intravenous use. Each 1 mL includes 20 units of vasopressin, 5 mg of chlorobutanol, 9 mg of sodium chloride, water for injection, and acetic acid to adjust the pH to 3.5. It is a clear, nearly colorless solution available in single-dose vials.
Intralot variability and Interlot variability was detected in two different lots of vasopressin using Raman spectrometry noninvasively and nondestructively to examine the contents of the vials. Each lot contained at least two different chemical compositions using a subcluster detection test at p=0.02.
These spectrometric results do not prove an excess level of impurities or adulteration. However, they suggest that the manufacturing process may have been operating outside of a state of process control. Additional investigation is needed.
Acknowledgements
The project described was supported in part by the National Center for Research Resources and the National Center for Advancing Translational Sciences, National Institutes of Health, through Grant UL1TR001998. The content is solely the responsibility of the authors and does not necessarily represent the official views of the NIH.
References
- American Regent (2020), Highlights of Prescribing Information, https://americanregent.com/media/3210/ref-1528_vasopressin-injection_full-prescribing-information_14oct2020.pdf retrieved Oct. 4, 2024
- ASHP (2024), Vasopressin Injection, https://www.ashp.org/drug-shortages/current-shortages/drug-shortage-detail.aspx?id=1043. retrieved Sep 5, 2024.
- Dempsey RJ, Davis DG, Buice RG Jr, & Lodder RA (1996). Biological and medical applications of near-infrared spectrometry. Applied Spectroscopy, 50(2), 18A–34A. [Google Scholar]
- FDANews, (2011). American Regent Vasopressin Recall Is Company’s 11th This Year. https://www.fdanews.com/articles/139188-american-regent-vasopressin-recall-is-company-8217-s-11th-this-year. Aug. 11, 2011, retrieved Aug. 27, 2024
- Isaacs JT, Almeter PJ, Henderson BS, Hunter AN, Lyman TA Zapata SP, Henderson BS, Larkin SA, Long LM, Bossle MN, Bhaktawara SA, Warren MF, Lozier AM, Melson JD, Fraley SR, Relucio EHL, Felix MA, Reynolds JW, Naseman RW, Platt TL, & Lodder RA (2024). Lack of Content Uniformity in Azacitidine Vials. Contact in context, 2024a. [Google Scholar]
- Isaacs JT, Almeter PJ, Henderson BS, Hunter AN, Platt TL, & Lodder RA (2023b). Application of Near-Infrared Spectroscopy for Screening of Chlorothiazide Sodium Vials. Contact in context, 2024b. [DOI] [PMC free article] [PubMed] [Google Scholar]
- Isaacs JT, Almeter PJ, Henderson BS, Hunter AN, Platt TL, & Lodder RA Nonparametric Subcluster Detection in Large Hyperspaces, CIC Computational Sciences, 2023, 1–24. DOI: 10.6084/m9.figshare.23877213 [DOI] [PMC free article] [PubMed] [Google Scholar]
- Isaksson T, & Næs T (1988). The effect of multiplicative scatter correction (MSC) and linearity improvement in NIR spectroscopy. Applied Spectroscopy, 42(7), 1273–1284. 10.1366/0003702884429869 [DOI] [Google Scholar]
- Jolliffe IT, & Cadima J (2016). Principal component analysis: a review and recent developments. Philosophical Transactions of the Royal Society A: Mathematical, Physical and Engineering Sciences, 374(2065), 20150202. [DOI] [PMC free article] [PubMed] [Google Scholar]
- Lodder RA, & Hieftje GM (1988). Detection of subpopulations in near-infrared reflectance analysis. Applied spectroscopy, 42(8), 1500–1512. [Google Scholar]
- Matlab. Smoothing Splines. https://www.mathworks.com/help/curvefit/smoothing-splines.html. Retrieved May 28, 2023.
- Perisic M, Woolcock K, Hering A, Mendel H, & Muttenthaler M (2024). Oxytocin and vasopressin signaling in health and disease. Trends in Biochemical Sciences, 49(4), 361–377. [DOI] [PubMed] [Google Scholar]
- Pollock DSG (1993). Smoothing with cubic splines. https://www.physics.muni.cz/~jancely/NM/Texty/Numerika/CubicSmoothingSpline.pdf. Retrieved May 28, 2023. [Google Scholar]
- Schill F, Engström G, Melander O, Timpka S, & Enhörning S (2024). The possible role of the vasopressin system in hematopoiesis. Scientific Reports, 14(1), 5085. [DOI] [PMC free article] [PubMed] [Google Scholar]


