ABSTRACT
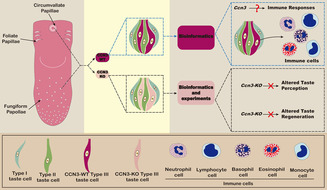
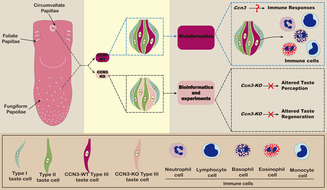
Different taste cells express unique cell‐type markers, enabling researchers to distinguish them and study their functional differentiation. Using single‐cell RNA‐Seq of taste cells in mouse fungiform papillae, we found that Cellular Communication Network Factor 3 (Ccn3) was highly expressed in Type III taste cells but not in Type II taste cells. Ccn3 is a protein‐coding gene involved in various biological processes, such as cell proliferation, angiogenesis, tumorigenesis, and wound healing. Therefore, in this study, we aimed to explore the expression and function of Ccn3 in mouse taste bud cells. Using reverse transcription polymerase chain reaction (RT‐PCR), in situ hybridization, and immunohistochemistry (IHC), we confirmed that Ccn3 was predominantly expressed in Type III taste cells. Through IHC, quantitative real‐time RT‐PCR, gustatory nerve recordings, and short‐term lick tests, we observed that Ccn3 knockout (Ccn3‐KO) mice did not exhibit any significant differences in the expression of taste cell markers and taste responses compared to wild‐type controls. To explore the function of Ccn3 in taste cells, bioinformatics analyses were conducted and predicted possible roles of Ccn3 in tissue regeneration, perception of pain, protein secretion, and immune response. Among them, an immune function is the most plausible based on our experimental results. In summary, our study indicates that although Ccn3 is strongly expressed in Type III taste cells, its knockout did not influence the basic taste response, but bioinformatics provided valuable insights into the possible role of Ccn3 in taste buds and shed light on future research directions.
Keywords: bioinformatics, Ccn3, Type III taste cell
Cellular Communication Network Factor 3 (Ccn3) plays a role in various biological processes. Our single‐cell RNA sequencing analysis revealed high expression of Ccn3 in mouse Type III taste cells within the fungiform papillae (FuP). Additional biological experiments confirmed the presence of Ccn3 mRNA in taste buds and showed CCN3 co‐expression with Type III taste cell markers in both FuP and circumvallate papillae (CvP). Interestingly, Ccn3 knockout did not affect taste responses and taste cell regeneration. Further data mining indicated that Ccn3 may have immune‐related functions in taste tissue.
Abbreviations
- (+)
positive
- (−)
negative
- 5‐HT
serotonin
- ANOVA
analysis of variance
- AON
anterior olfactory nuclei
- B6
C57BL/6J mice
- Ca4
Carbonic Anhydrase 4
- CCN
cellular communication network
- Ccn3‐KO
Ccn3 knockout
- Ccn3/Trpv1‐KO
Ccn3 and Trpv1 double knockout
- CNS
central nervous system
- COVID‐19
Coronavirus disease
- CPM
count per million
- CT
chorda tympani
- CvP
circumvallate papillae
- DEGs
differentially expressed genes
- DIG
digoxigenin
- DW
distilled water
- ENTPD2
ectonucleoside triphosphate diphosphohydrolase 2
- ET
epithelial tissue without taste buds
- FC
fold change
- FoP
foliate papillae
- FuP
fungiform papillae
- GEO
gene expression omnibus
- Gnat3
Gustducin Alpha 3
- GO
Gene Ontology
- GRCm39
Genome Reference Consortium Mouse Build 39
- GSEA
Gene Set Enrichment Analysis
- HCl
hydrochloric acid
- IHC
immunohistochemistry
- ISH
in situ hybridization
- KEGG
Kyoto Encyclopedia of Genes and Genomes
- MMP‐2
matrix metalloproteinase‐2
- MMP‐9
matrix metalloproteinase‐9
- MPG
monopotassium glutamate
- MSG
monosodium glutamate
- NaCl
sodium chloride
- NH₄Cl
ammonium chloride
- Otop1
Otopetrin 1
- PBS
phosphate‐buffered saline
- Pkd2l1
Polycystic Kidney Disease 2‐Like 1
- qRT‐PCR
quantitative real‐time polymerase chain reaction
- RRID
research resource identifier (see scicrunch.org)
- RT‐PCR
reverse transcription polymerase chain reaction
- SARS‐CoV‐2
Severe Acute Respiratory Syndrome Coronavirus 2
- scRNA‐seq
single‐cell RNA sequencing
- Shh
Sonic Hedgehog
- Slc1a3
solute carrier family 1 member 3
- Snap25
synaptosomal‐associated protein 25
- SNARE
soluble N‐ethylmaleimide‐sensitive factor attachment protein receptor
- SSC
saline‐sodium citrate
- Tas1r3
taste 1 receptor member 3
- Trpv1
transient receptor potential vanilloid 1
- vs.
versus
- WT
wild‐type
1. Introduction
Taste buds, the sensory organs responsible for taste, are located in three types of taste papillae on the tongue: fungiform papillae (FuP), circumvallate papillae (CvP), and foliate papillae (FoP). Taste cells have been classified into four morphologically defined subtypes (Types I–IV). Type I cells express ectonucleoside triphosphate diphosphohydrolase 2 (Entpd2) and solute carrier family 1 member 3 (Slc1a3, also known as Glast) (Bartel et al. 2006; Lawton et al. 2000), which are mainly expressed in glial cells in the nervous system, suggesting that Type I cells possess functions similar to those of glial cells. Type II cells contain the receptors and downstream signaling components necessary for detecting sweet, bitter, and umami tastes, functioning as sweet, bitter, or umami taste cells (Kinnamon and Finger 2019; Yoshida et al. 2009). Type II cells may also contribute to amiloride‐sensitive salt taste since mice lacking CALHM1 or 3, which are selectively expressed in Type II cells, showed a reduction of amiloride‐sensitive salt responses (Taruno et al. 2013; Nomura et al. 2020). Type III taste cells, which are involved in sour and high‐salt taste detection (Yoshida et al. 2009), can exhibit neuron‐like properties, including the presence of synaptic structures and the ability to synthesize neurotransmitters serotonin (DeFazio et al. 2006; Murray and Murray 1971). Type IV cells are postmitotic precursors of other cell types in taste buds (Finger and Barlow 2021). These distinct functions depend on the genes expressed in each type of taste cell. However, the genes expressed in particular types of taste cells, which remain unspecified, likely play potentially important roles in their functioning as taste cells.
Cells are the fundamental units of organisms, with each cell possessing its own unique characteristics. Traditional bulk RNA sequencing often obscures these individual traits and fails to detect subtle variations. Single‐cell RNA sequencing (scRNA‐seq) has revolutionized our ability to explore the distinctiveness of each cell, enabling molecular profiling at a microscopic level and addressing previously unanswered questions (Hedlund and Deng 2018). In recent years, scRNA‐seq has been employed to reveal some new genes within taste buds (Ohmoto, Kitamoto, and Hirota 2021; Qin et al. 2018; Qin, Sukumaran, and Margolskee 2021; Sukumaran et al. 2017). To identify novel cell markers in the FuP, we performed scRNA‐seq on taste cells isolated from the FuP of mice and discovered that Ccn3 is highly expressed in Type III taste cells, but not in Type II taste cells. CCN3 belongs to the CCN family, which includes six members ranging from CCN1 to CCN6 (Kubota et al. 2022). CCN proteins are crucial signaling and regulatory molecules that play significant roles in various biological processes, such as cell proliferation, angiogenesis, tumorigenesis, and wound healing (Holbourn, Acharya, and Perbal 2008; Monsen and Attramadal 2023).
Ccn3 is expressed by neurons in specific anatomical regions of the murine central nervous system (CNS) (de la Vega Gallardo et al. 2020). Notably, Ccn3 is found extracellularly in the suprachiasmatic nuclei (SCN), indicating a possible involvement in circadian biology (de la Vega Gallardo et al. 2020). Additionally, Ccn3 expression was observed in the anterior olfactory nuclei (AON) and the piriform cortex, suggesting a potential role in olfaction (de la Vega Gallardo et al. 2020). Furthermore, Ccn3 was detected in Bruch's membrane of the eye, which may imply a function in regulating the exchange of oxygen, nutrients, or waste between the circulation and the retina (de la Vega Gallardo et al. 2020). The function of CCN3 in the CNS is related to neuroinflammation (Le Dréau, Kular, et al. 2010), growth suppression (Fu et al. 2004), and promotion of neuron precursor maturation (Le Dréau, Nicot, et al. 2010). Additionally, as a post‐translational modification, palmitoylation not only regulates the secretion of CCN3 (Kim et al. 2018) but also regulates the fusion of synaptic vesicles (Prescott et al. 2009). Whether CCN3 is also involved in neurotransmitter release remains to be studied. However, the expression and functions of CCN3 in the nervous system imply potential roles in Type III taste cells, which contribute to sour taste sensation.
Consequently, we hypothesized that the expression of Ccn3 in taste cells might be involved in taste responses. Using multiple techniques, including reverse transcription polymerase chain reaction (RT‐PCR), in situ hybridization (ISH), immunohistochemistry (IHC), quantitative real‐time RT‐PCR (qRT‐PCR), gustatory nerve recordings, short‐term lick tests, and bioinformatics, we demonstrate that Ccn3 is expressed exclusively in Type III cells on the tongue but it does not have an obvious function in taste responses. We have also discussed its potential function in taste cells using bioinformatic analysis with scRNAseq data (Vercauteren Drubbel and Beck 2023).
2. Materials and Methods
2.1. Animals
All experimental procedures were performed in accordance with the National Institutes of Health Guide for the Care and Use of Laboratory Animals and approved by the committee for Laboratory Animal Care and Use at Okayama University, Japan (Ethics approval reference numbers: OKU‐2018840, OKU‐2022339, OKU‐2023324, OKU‐2023325, and OKU‐2023342). The study subjects included adult male and female C57BL/6J mice (B6) older than 8 weeks, used as wild‐type (WT) controls, Ccn3‐knockout (Ccn3‐KO) mice, and Ccn3/ Transient receptor potential vanilloid 1 (Trpv1)‐double knockout mice (Ccn3/Trpv1‐KO) also older than 8 weeks. The Ccn3‐KO mice were generated by replacing exons 1, 2, and the distal portion of exon 3 with the neomycin resistance gene cassette (derived from Tokyo Medical and Dental University, Dr. Kei Sakamoto. RRID:IMSR_RBRC05638) (Matsushita et al. 2013). Trpv1‐KO mice were generated by deleting an exon encoding part of the fifth and all of the sixth putative transmembrane domains of the channel, together with the intervening pore‐loop region (derived from National Institute for Physiological Sciences, Japan, Dr. Makoto Tominaga. RRID:IMSR_JAX: 003770) (Caterina et al. 2000). To generate Ccn3/Trpv1‐KO mice, Ccn3‐KO mice were bred with Trpv1‐KO mice. All mouse strains had a B6 genetic background, achieved through at least five generations of backcrossing. In this study, we used a total of 88 mice, consisting of 42 WT mice, 39 Ccn3‐KO mice, and 7 Ccn3/Trpv1‐KO mice. The mice were kept in ventilated cages that provided 480 cm2 of floor space with bedding material, and each cage contained 1–5 mice, weighing between 22 and 35 g. They were maintained on a 12:12‐h light–dark cycle (lights on from 08:00 to 20:00) with unrestricted access to tap water and standard food pellets (MF, Oriental Yeast Co., Tokyo, Japan). The mice were killed by exposure to 100% CO2 at a displacement rate of 20%/L/min. They were kept in the chamber until all visible movement ceased, and death was further confirmed by the absence of both respiration and cardiac activity.
2.2. ScRNA‐seq in FuP
WT mice (n = 4) were sacrificed. The anterior tongue was removed and administrated with 100 μL of Tyrode solution containing 0.2–0.5 mg/mL elastase (Elastin Products, Owensville, MO, USA, Cat# LE425) to peel the tongue epithelium. Then, fungiform taste buds were isolated and transferred to the bottom of the culture dish containing Ca2+, Mg2+‐free solution by aspiration with a transfer pipette (inner φ approximately 100 μm). Single taste cells were identified by conventional microscopy (BX51, Olympus, Tokyo, Japan), harvested by a thin glass pipette (inner φ 1–3 μm), and transferred to a PCR tube containing 0.5 μL ultrapure distilled water (Thermo Fisher Scientific, Waltham, MA, USA) and 0.5 μL RNase inhibitor (Thermo Fisher Scientific, Waltham, MA, USA). cDNA libraries of each taste cell were prepared using SMART‐Seq v4 Ultra Low Input RNA Kit for Sequencing (Takara Bio, Kusatsu, Shiga, Japan) and Agencout AMPure XP kit (Beckman Coulter, Brea, CA, USA) following the manufacture's protocol. The quality of each library was assessed by Agilent 2100 Bioanalyzer with High Sensitivity DNA reagents (Agilent Technologies, Santa Clara, CA, USA). Then, Illumina Nextera XT DNA library preparation protocol (Illumina, San Diego, CA, USA) was used to prepare cDNA library for the next generation sequencing by Illumina NovaSeq 6000 (Illumina).
Quality control for raw RNA sequencing reads was performed using the FASTQC tool (RRID:SCR_014583). The reads were aligned to the Genome Reference Consortium Mouse Build 39 (GRCm39) with Hisat2 (RRID:SCR_015530), and gene quantification was conducted using featureCounts (RRID:SCR_012919). The following operations were conducted using R software. Initially, we performed data quality control by filtering out genes that were not expressed in at least 75% of the samples. Subsequently, we used Counts Per Million (CPM) normalization to eliminate the effects of sequencing depth between samples. CPM values for each gene were calculated using the edgeR package (RRID:SCR_012802), and the results were log‐transformed. Thereafter, we applied the normalizeBetweenArrays function from the limma package (RRID:SCR_010943) to further adjust and correct for systematic variation between samples. Subsequently, we selected five Type II taste cells and five Type III taste cells for the next stage of analysis, based on expression of classic taste cell markers (Type II cell markers: Gnat3/Plcb2 and Type III cell markers: Ca4/Snap25). Differentially expressed genes (DEGs) were identified using the edgeR package, considering genes with an absolute fold change ≥ 1.5 and p‐value < 0.05 as significant. Data visualization, including heatmaps, volcano plots, and expression distributions of taste marker genes, was carried out with R packages. Our scRNA‐seq data have been deposited in the Gene Expression Omnibus (GEO database) with the accession number PRJNA1118679.
2.3. RT‐PCR
WT mice (n = 3) were sacrificed. The anterior and posterior tongue were removed and administrated with 100 μL of Tyrode solution containing 0.2–0.5 mg/mL elastase (Elastin Products) to peel the tongue epithelium. Taste buds in the peeled epithelium were collected from FuP and CvP by aspiration with a transfer pipette. The epithelial tissue without taste buds (ET) was collected from the regions adjacent to the FuP. RNAs from these samples were extracted using an RNeasy Micro Kit (Qiagen, Venlo, Netherlands). cDNA fragments were obtained by reverse transcription using SuperScript IV Reverse Transcriptase (Thermo Fisher Scientific) and oligo (dt)‐primers. A portion of the cDNA was used for standard PCR (TaKaRa Ex TaqHS, Takara Bio) to detect Ccn3, Gnat3, and Actb. PCR primers were designed to span one or more introns to avoid amplification of genomic DNA and summarized in Table S1. The amplification products were visualized in a 2% agarose gel with Midori Green Advance (Nippon Genetics, Tokyo, Japan).
2.4. ISH
RNA probes for ISH were prepared by in vitro transcription. The preparation of cDNA from CvP taste buds was described previously. The cDNA fragments for each gene were amplified using PrimeSTAR HS DNA Polymerase (Takara) and specific primers (Table S2). The fragments were purified by gel extraction (QIAquick Gel Extraction Kit, QIAGEN), then re‐amplified using PrimeSTAR HS DNA Polymerase and specific primers with T7 promoter sequence (Table S2) to make template cDNA. Digoxigenin (DIG)‐UTP‐labeled antisense and sense RNA probes were generated by in vitro transcription using a T7 transcription Kit (Roche, Basel, Switzerland) and specific template cDNA.
Frozen blocks of the dissected tongue from WT (n = 3) and Ccn3‐KO mice (n = 3) embedded in OCT compound (Sakura Finetechnical, Tokyo, Japan) were sectioned into 10 μm thickness, which were mounted on silane‐coated glass slides. These sections were fixed in 4% paraformaldehyde, treated with Proteinase K (Life Technologies, Grand Island, NY), and then prehybridized in 5× SSC/50% formamide for 2 h at room temperature. Hybridization was performed in a hybridization buffer containing 50% formamide, 5× SSC, 5× Denhardt solution, 500 mg/mL denatured salmon testis DNA, 250 mg/mL denatured baker yeast tRNA, 1 mmol/L dithiothreitol, and 20–200 ng/mL anti‐sense or sense RNA probe for 18 h at 65°C. After hybridization, preparations were washed with 5× SSC and 0.2× SSC at 70°C. Subsequently, preparations were treated with 1.5% blocking reagent (Roche), antibodies for DIG (1:500, anti‐DIG Fab fragments conjugated with alkaline phosphatase; Roche), AP buffer, and NBT/BCIP solution (Nakarai Tesque, Kyoto, Japan). Images were obtained using a conventional microscope (IX81, DP74, and cellSens, Olympus).
2.5. qRT‐PCR
WT mice (n = 6) and Ccn3‐KO mice (n = 6) were used for qRT‐PCR. Purification of RNA from FuP and CvP is described previously. RNA samples were quantified using DS11+ (DeNovix, Wilmington, DE, USA) and cDNA fragments were obtained by reverse transcription using ReverTra Ace qPCR RT Kit (Toyobo, Osaka, Japan). Then qPCR was conducted using StepOnePlus (Applied Biosystems, Foster City, CA, USA) and THUNDERBIRD Next SYBR qPCR Mix (Toyobo). Relative quantification of gene expression was conducted using the 2−ΔΔCt method, and the mRNA expression level was normalized to that of Gapdh. Primers used for RT‐qPCR are summarized in Table S3. In one sample from the FuP of WT mice, RNA was not detected during quantification; therefore, we excluded this sample from the analysis.
2.6. IHC
The IHC procedures were adapted from the methods described previously (Yoshida et al. 2015). WT mice (n = 7) and Ccn3‐KO mice (n = 8) were sacrificed. For FuP taste buds, the anterior tongue was excised and treated with 100 μL of Tyrode solution containing 0.25 mg/mL elastase (Elastin Products) to facilitate the peeling of the tongue epithelium. The epithelium was then pinned in a Sylgard‐coated dish and fixed in 4% paraformaldehyde in phosphate‐buffered saline (PFA/PBS) for 20 min at 4°C. For CvP taste buds, the posterior tongue was dissected and fixed in 4% PFA/PBS for 45 min at 4°C. After cryoprotection in 15% sucrose for 1 h and 30% sucrose for 2 h at 4°C, the tissues were embedded in OCT compound (Sakura Finetechnical), frozen, and sectioned into 10 μm‐thick slices. These sections were mounted on silane‐coated glass slides. Both FuP and CvP samples were washed with tris‐buffered saline (TBS), treated with Blocking One‐P (Nacalai Tesque) for 1 h at room temperature, and incubated overnight at room temperature with primary antibodies against CCN3 (rabbit IgG, 1:200, Gift from Dr. Sasaki at Oita University, no RRID) (Hirose et al. 2022; Kuwahara et al. 2020), Entpd2 (sheep IgG, 1:400, AF5797, R&D Systems, Minneapolis, MN, USA, RRID:AB_10572702), Gnat3 (goat IgG, 1:200, Aviva Systems Biology, San Diego, CA, USA, RRID:AB_10882823), or Ca4 (goat IgG, 1:400, AF2414, R&D Systems, RRID:AB_2070332). Following TBS washes, samples were incubated with secondary antibody against rabbit IgG (Alexa Fluor 568 donkey anti‐rabbit IgG H+L, 1:200, Thermo Fisher Scientific, RRID:AB_2534017) and goat IgG (Alexa Fluor 488 donkey anti‐goat IgG H+L, 1:200, Thermo Fisher Scientific, RRID:AB_2534102) or samples were incubated with secondary antibody against rabbit IgG (Alexa Fluor 568 donkey anti‐rabbit IgG H+L, 1:200, Thermo Fisher Scientific, RRID:AB_2534017) and Sheep IgG (donkey anti‐sheep IgG H&L Alexa Fluor 488, 1:200, Abcam, Cambridge, UK, RRID:AB_2801320). The double fluorescently labeled taste cells were examined using the Laser Scanning Confocal Microscopy (FV‐300, Olympus/LSM‐780, Carl Zeiss, Oberkochen, Baden‐Württemberg, Germany) and analyzed with FLUOVIEW software (Olympus) or Blue Zeiss software (Carl Zeiss). We counted the cells with positive staining in the sections of CvP and the peeled FuP. To prevent duplicate cell counts in CvP, each slice was spaced at least 40 μm apart. Only cells with a well‐defined cell outline after staining for the marker were considered positive. Single‐channel images were used to count CCN3‐labeled cells and taste marker‐positive cells, while merged images were employed to identify double‐positive cells.
2.7. Solutions
Tyrode solution contained (in mM): NaCl, 140; KCl, 5; CaCl2, 1; MgCl2, 1; NaHCO3, 5; HEPES, 10; glucose, 10; sodium pyruvate, 10; and pH adjusted to 7.4 with NaOH. The taste solutions used in the experiments included: 100 mM ammonium chloride (NH₄Cl), 10–1000 mM sucrose, 10–1000 mM sodium chloride (NaCl), 1–100 mM citric acid, 0.3–100 mM hydrochloric acid (HCl), 10–300 mM monopotassium glutamate (MPG), 10–300 mM monosodium glutamate (MSG), 0.01–20 mM quinine, and 10 μM capsaicin. These chemicals were purchased from FUJIFILM Wako Chemicals (Osaka, Japan), Nakarai Tesque (Kyoto, Japan), or Sigma–Aldrich (St. Louis, MO, USA).
2.8. Gustatory Nerve Recordings
Whole nerve responses to the lingual application of tastants were recorded from the chorda tympani (CT) nerve as previously described (Yoshida et al. 2017; Mikami et al. 2024). WT mice (n = 12) and Ccn3‐KO mice (n = 15) were used as experimental subjects. Mice were anesthetized by an intraperitoneal injection of a combination anesthetic (0.3 mg/kg of medetomidine, 4.0 mg/kg of midazolam, and 5.0 mg/kg of butorphanol) and maintained at a surgical level of anesthesia with supplemental intraperitoneal injection of half of the anesthetic approximately every 2 h. The anesthetic depth was assessed via the paw pinch withdrawal reflex. Under anesthesia, the trachea of each mouse was cannulated and then the mouse was fixed in the supine position with a head holder to allow dissection of the CT nerve. The right CT nerve was dissected free from surrounding tissues after removal of the pterygoid muscle and cut at the point of its entry into the bulla. The entire nerve was placed on an Ag/AgCl electrode. An indifferent electrode was placed in nearby tissue. Neural activities were amplified (DAM80; World Precision Instruments, Sarasota, FL, USA) and monitored on an oscilloscope. Whole nerve responses were integrated with a time constant of 1.0 s and recorded on a computer using a PowerLab system (PowerLab/sp4; AD Instrument, Bella Vista, Australia). The anterior one‐half of the tongue was enclosed in a flow chamber of silicone rubber. Taste solutions were delivered to the tongue by gravity flow for 30 s. The tongue was washed with distilled water (DW) for an interval of 1 min between successive stimulations. Only stable recordings were included in the data analysis. The recording time ranged from 1 to 2.5 h, depending on the number of test solutions.
2.9. Short Term Lick Tests
Behavioral lick responses to various tastants were measured according to the method described previously (Yamase et al. 2023). The subjects included WT mice (n = 7), Ccn3‐KO mice (n = 7), and Ccn3/Trpv1‐KO mice (n = 7), each housed individually. On the first day of training, mice were water‐deprived for 12 h and then placed in a test cage with free access to deionized water for 1 h. Training sessions from Days 2 to 5: animals were trained to drink deionized water on an interval schedule, consisting of 5 s periods of deionized water presentation alternating with 10 s intertrial intervals. Starting from Day 6, the number of licks for each tastant and deionized water was recorded during the first 5 s after the initial lick, using a lick meter (Yutaka Electronics Co., Gifu, Japan). Test solutions included 30–1000 mM NaCl, 30–1000 mM sucrose, 0.01–1 mM quinine, 10–300 mM MSG, 1–100 mM citric acid, 1–100 mM HCl, and 10 μM capsaicin. Each day, one tastant was tested at various concentrations. For preferred solutions (sucrose and MSG), mice were deprived of both food and water for 12 h prior to testing. On the test day, mice were first presented with the test solutions in descending concentration order (from highest concentration to deionized water) and then in random order for subsequent trials. For aversive solutions (NaCl, quinine, citric acid, HCl, and capsaicin), mice were water‐deprived for 12 h before testing. On these test days, solutions were first presented in ascending concentration order (from deionized water to the highest concentration), followed by randomized order for subsequent trials. Each solution was tested in at least three lick trials, and the average number of licks was used for data analysis.
2.10. ScRNA‐seq in CvP and FoP
Dataset GSE220065 was retrieved from the GEO database (https://www.ncbi.nlm.nih.gov/). The dataset contains sequencing data from 5 samples, we download the standard matrix file of Epithelial cells from the CvP and the FoP of the tongue (Vercauteren Drubbel and Beck 2023). Initially, we conducted data quality control, selecting cells with less than 10% mitochondrial genes and a gene count ranging from 200 to 6000. We utilized the NormalizeData and ScaleData functions from the Seurat package (RRID:SCR_007322) for data normalization and scaling. The number of highly variable genes was set at 2000 for principal component analysis (PCA). Visualization of each cluster was accomplished using the UMAP technique (RRID:SCR_018217) based on the first 30 principal components (McInnes et al. 2018). Cell subpopulation annotation was performed manually by the markers from the Cell Marker database and published articles (Figure S1A). Differential expression analysis was conducted using Seurat's FindAllMarkers function to identify marker genes in each cluster. We set the cutoff criteria for identifying marker genes as an adjusted p‐value < 0.05, an expression percentage > 0.25, and |log2[fold change (FC)]| > 0.25. Then, we extracted the taste cell cluster, normalized the data with the same method as described before, and used the top 2000 variable genes for PCA. UMAP was again used for dimensionality reduction. These clusters were manually annotated with classic taste cell markers (Figure S1B) and differential expression analysis was conducted. For data that included temporal sequences or developmental processes, the Slingshot method (RRID:SCR_017012) was utilized for cell trajectory reconstruction, and results were visualized with UMAP. GeneSwitches (RRID:SCR_022826) were employed to predict the timing of marker gene occurrence. Additionally, we divided the Type III taste cells into Ccn3+ and Ccn3−Type III cell subgroups based on whether they express the Ccn3 gene, and differential expression genes were identified using the previously described method. Cell Communication Analysis was carried out using the CellChat tool (RRID:SCR_021946), which examined communication between different cell clusters. This analysis included identifying ligand–receptor pairs, projecting onto protein interaction networks, and calculating communication probabilities. To further elucidate the functions of Ccn3, we performed Gene Ontology (GO) annotation and Gene Set Enrichment Analysis (GSEA) of the Kyoto Encyclopedia of Genes and Genomes (KEGG) pathways using the ClusterProfiler package (RRID:SCR_016884).
2.11. Data Analysis
Sample sizes were not predetermined by statistical methods, but they were determined based on previous research (Hirose et al. 2020; Iwata et al. 2023; Mikami et al. 2024; Takai et al. 2019). The experiments lacked randomization, and the experimenters were not blinded during both the experiments and data analysis. No outlier tests were conducted. Normality was tested using the Shapiro–Wilk test.
In scRNA‐seq, the difference in expression level of some genes was analyzed by the Wilcoxon rank sum test. For nerve recordings, differences among the concentrations of each tastant and among genotypes were evaluated using two‐way ANOVA. Short‐term lick responses to HCl, citric acid, NaCl, quinine, sucrose, and MSG were analyzed for concentration and genotype effects using repeated measures ANOVA. Differences among genotypes for short‐term lick responses to 10 μM capsaicin were assessed using one‐way ANOVA with Tukey's Post Hoc Test. Additionally, qRT‐PCR and taste cell numbers in FuP were analyzed by a two‐sample Student's t‐test for different expression levels of cell marker genes between WT and Ccn3‐KO mice. All statistical analyses were conducted by Jamovi software (version 2.3.21, RRID:SCR_016142) and R software (version 4.1.3, RRID:SCR_001905). Significance was determined at p‐values < 0.05.
3. Results
3.1. Expression of Ccn3 in Taste Buds
To evaluate the differences in gene expression between Type II and Type III cells of the FuP, we selected and analyzed 5 Type II cells and 5 Type III cells in our scRNA‐seq data. A heatmap (Figure 1A) illustrates the differences in gene expression profiles, clearly separating the cells into Type II and Type III groups. The box plot (Figure 1B) further highlights the differential expression levels of cell markers between the two groups. Subsequently, the volcano plot of DEGs and Boxplots of Ccn3 expression level between the two groups were displayed (Figure 1C,D). These plots showed that Ccn3 gene expression patterns in Type II and Type III cells were significantly different. Thus far, no previous investigations have examined Ccn3 in taste bud cells. To validate the results obtained from our scRNA‐seq, FuP, CvP, and ET samples of WT mice were collected and the expression of Ccn3 mRNA was examined by RT‐PCR. This confirmed that Ccn3 is expressed in FuP and CvP taste buds but not in the ET (Figure 2A). To further validate the expression of Ccn3 mRNA in the taste buds, chromogenic ISH was conducted in WT and Ccn3‐KO mice. Ccn3 signal was detected in taste buds of WT mice, but not surrounding epithelial tissue. In contrast, Ccn3 signal was not detected in Ccn3‐KO mice (Figure 2B).
FIGURE 1.
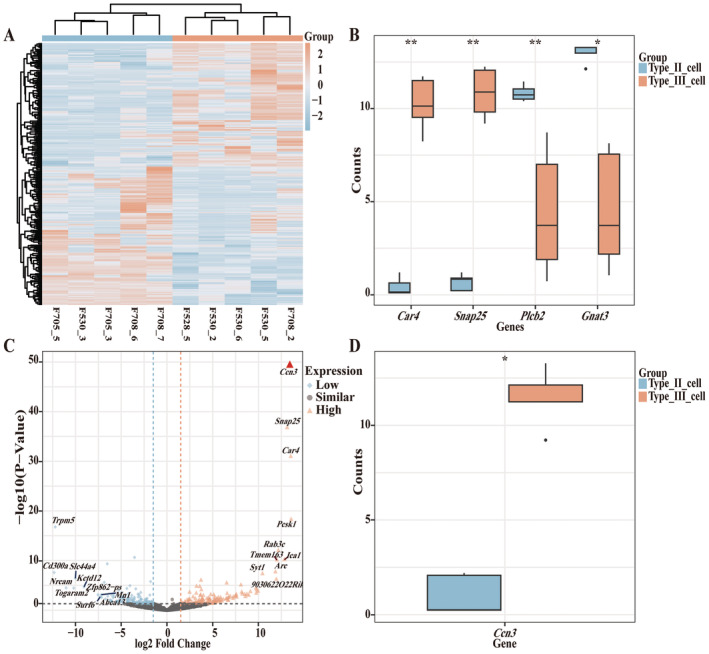
In scRNA‐seq analysis of FuP, Ccn3 is highly expressed in type III taste cells. (A) Heatmap of DEGs. The normalized gene expression values were rescaled from −2 to 2. (B) Box plot showing the expression distribution of taste cell marker genes in type II cells and type III cells, respectively. Statistical differences were analyzed by the Wilcoxon rank sum test in R software. (C) Volcano plot of the genes. Orange triangles represent significantly high‐expressed genes (high), with red triangles indicating the highest one in Type III cells compared to Type II cells. Blue diamonds represent significantly low‐expressed genes (low), and black circles represent genes with no significant change (similar), considering genes with an absolute fold change ≥ 1.5 and a p‐value < 0.05 as significant. (D) Box plot showing the expression level of Ccn3 in type II cells and type III cells, respectively. In the boxplot, the central line indicates the median, while the boxes represent the interquartile range (IQR) from the first quartile (Q1) to the third quartile (Q3). The whiskers extend to the minimum and maximum values within 1.5 times the IQR, and outliers are shown as points beyond the whiskers. Statistical differences were analyzed by the Wilcoxon rank sum test in R software. *p < 0.05; **p < 0.01.
FIGURE 2.
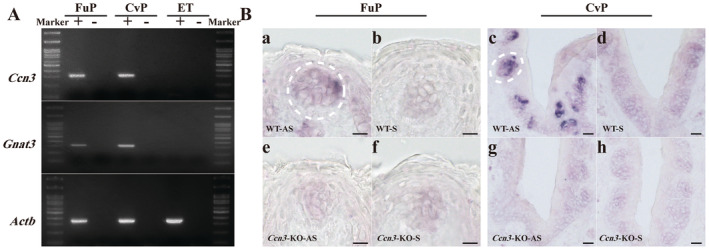
Ccn3 mRNA is expressed in FuP and CvP. (A) PCR amplification of Ccn3, Gnat3, and Actb from cDNA prepared from FuP, CvP, and ET. Ccn3 mRNA is selectively expressed in the FuP and CvP but not in ET. The right and left sides show a 100 bp DNA marker. +: With reverse transcriptase, −: Without reverse transcriptase. WT mice (n = 3). (B) In situ hybridization using Ccn3 RNA probe in FuP (a, b, e, f), and CvP (c, d, g, h) of WT and Ccn3‐KO mice. Hybridization using an antisense (AS) probe indicates expression of Ccn3 in FuP and CvP of WT mice but not in Ccn3‐KO mice (a, e, c, g). Hybridization using sense (S) probe indicative of nonspecific hybridization was low in taste tissue (b, f, d, h). The scale bar represents 10 μm in FuP and 20 μm in CvP. WT (n = 3) and Ccn3‐KO mice (n = 3).
3.2. CCN3 is Specifically Expressed in Type III Cells in FuP and CvP
Next, we investigated CCN3 protein expression in taste bud cells using double‐labeled IHC with other cell type markers. We used ENTPD2 as a Type I cell marker, GNAT3 as a Type II cell marker, and CA4 as a Type III cell marker. Consistent with scRNA‐seq data, CCN3 immunoreactivity was detected in CA4‐immunoreactive taste cells but not in ENTPD2‐ or GNAT3‐immunoreactive taste cells in both FuP and CvP taste buds of WT mice (Figure 3A,C,E). In contrast, CCN3 immunoreactivity was not observed in either FuP or CvP taste buds of Ccn3‐KO mice (Figure 3B,D,F).
FIGURE 3.
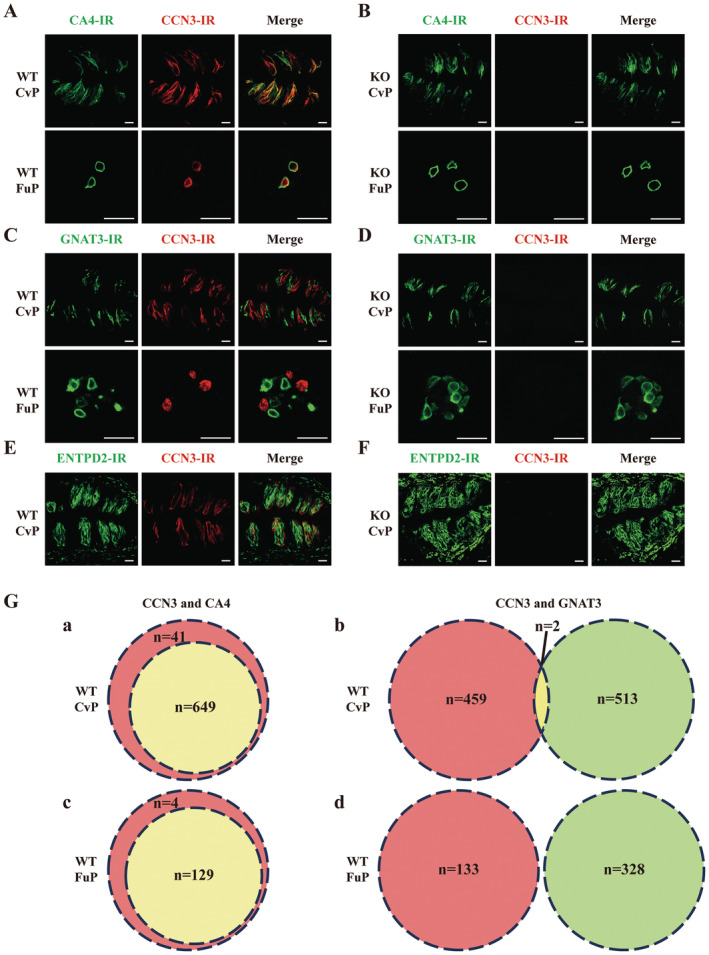
CCN3 co‐localized with CA4 in mouse taste bud cells of CvP and FuP. Double‐labeled immunostaining for CA4 and CCN3 in CvP and FuP of a WT mouse (A) and a Ccn3‐KO mouse (B). Double‐labeled immunostaining for GNAT3 and CCN3 in CvP and FuP of a WT mouse (C) and a Ccn3‐KO mouse (D). Double‐labeled immunostaining for ENTPD2 and CCN3 in CvP of a WT mouse (E) and a Ccn3‐KO mouse (F). Scale bar, 20 μm. (G) Venn diagrams illustrating the overlap of CCN3 (red) and CA4 (green) immunoreactivity in CvP (a) and FuP (c), and the overlap of CCN3 (red) and GNAT3 (green) immunoreactivity in CvP (b) and FuP (d) in WT mice. Double‐labeled cells are shown in yellow. Cell counts are demonstrated in Table 1. WT mice (n = 7) and Ccn3‐KO mice (n = 8).
We quantified the double‐labeled taste cells (Figure 3G and Table 1). In CvP, 94.06% of CCN3 was co‐expressed with CA4, while in FuP, 96.99% of CCN3 was co‐expressed with CA4. Notably, no CA4 (+) taste cells were observed without CCN3 expression. Regarding GNAT3 expression, no taste cell expressed both GNAT3 and CCN3 in FuP, and only 0.39% of GNAT3 (+) taste cells co‐expressed CCN3 in CvP. Because Type I cells wrapped around other taste cells, making their unambiguous identification difficult, we did not quantify the co‐expression of ENTPD2 with CCN3. However, our immunohistochemistry results showed no apparent co‐expression of the Type I cell marker with CCN3 (Figure 3E). These data indicate that CCN3 is expressed exclusively in Type III cells in CvP and FuP.
TABLE 1.
Co‐expression of CCN3 with Type II and (Type III taste cell markers in CvP and FuP of WT and Ccn3‐KO mice.
| Tissue | CCN3(+) | CA4(+) | CCN3(+)CA4(+)/CCN3(+) | CCN3(+)CA4(+)/CA4(+) | N | CA4(+)cells/N |
|---|---|---|---|---|---|---|
| A. Numbers of taste cells expressing CCN3 and CA4 in WT mice | ||||||
| CvP | 690 | 649 | 649/690 (94.06%) | 649/649 (100%) | / | / |
| FuP | 133 | 129 | 129/133 (96.99%) | 129/129 (100%) | 74 | 129/74 (1.74) |
| B. Numbers of taste cells expressing CCN3 and CA4 in Ccn3‐KO mice | ||||||
| CvP | 0 | 588 | 0/0 (0.00%) | 0/588 (0.00%) | / | / |
| FuP | 0 | 133 | 0/0 (0.00%) | 0/133 (0.00%) | 78 | 133/78 (1.71) |
| Tissue | CCN3(+) | GNAT3(+) | CCN3(+)GNAT3(+)/CCN3(+) | CCN3(+)GNAT3(+)/GNAT3(+) | N | GNAT3(+)cells/N |
|---|---|---|---|---|---|---|
| C. Numbers of taste cells expressing CCN3 and GNAT3 in WT mice | ||||||
| CvP | 461 | 515 | 2/461 (0.43%) | 2/515 (0.39%) | / | / |
| FuP | 133 | 328 | 0/133 (0.00%) | 0/328 (0.00%) | 88 | 328/88 (3.73) |
| D. Numbers of taste cells expressing CCN3 and GNAT3 in Ccn3‐KO mice | ||||||
| CvP | 0 | 580 | 0/0 (0.00%) | 0/580 (0.00%) | / | / |
| FuP | 0 | 357 | 0/0 (0.00%) | 0/357 (0.00%) | 90 | 357/90 (3.97) |
Note: Singly and doubly labeled cells were counted, with the percentage of co‐expression indicated in parentheses. The average number of Type III or Type II taste cells in each taste bud indicated in parentheses.
Abbreviations: N, number of taste buds; /, the taste bud number was not counted.
We counted the number of CA4 (+) taste cells and GNAT3 (+) taste cells and calculated the numbers of CA4 (+) or GNAT3 (+) taste cells per taste bud profile in both WT mice and Ccn3‐KO mice. The number of CA4 (+) or GNAT3 (+) taste cells per taste bud in FuP was 1.74 versus 1.71 and 3.73 versus 3.97 between WT and Ccn3‐KO mice (Table 1). No significant difference was observed in the number of CA4 (+) or GNAT3 (+) taste cells in FuP between the WT and Ccn3‐KO mice (Table S4), suggesting that the absence of CCN3 expression in taste bud cells may not affect histology of Type II and Type III taste cells. To confirm this, we performed qRT‐PCR using taste bud samples of WT and Ccn3‐KO mice. Although the expression of Ccn3 was abolished in both the CvP and FuP taste buds of Ccn3‐KO mice, the expression of Entpd2, Gnat3, Ca4, or Otop1 was not significantly different between WT and Ccn3‐KO mice (Figure 4 and Table S5). We were not able to identify taste bud profiles properly in the CvP, but the number of cells per taste bud profile in CvP is likely similar between WT and KO mice based on the results of qRT‐PCR, and IHC of FuP.
FIGURE 4.
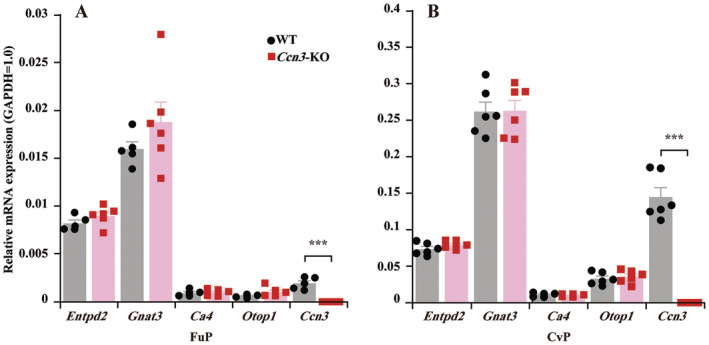
The expression of taste cell marker genes was not affected by the deletion of Ccn3. The expression levels of different taste cell markers in FuP (WT: n = 5, Ccn3‐KO: n = 6) (A) and CvP (WT: n = 6, Ccn3‐KO: n = 6) (B) taste buds of WT and Ccn3‐KO mice. Ccn3 mRNA was not detected in Ccn3‐KO mice. Values are presented as means ± SEM. ***p < 0.001, Student's t‐test (Table S5).
3.3. WT and Ccn3‐KO Mice Showed Similar Responses to Basic Taste Stimuli
Next, we tested if the lack of Ccn3 in mice affects taste responses to various tastants (Figure 5). First, we compared CT nerve responses to sour (HCl), sweet (sucrose), umami (MPG), salty (NaCl), and bitter (quinine) tastants between WT and Ccn3‐KO mice. No significant differences in CT nerve responses to any of the tastants were observed between WT and Ccn3‐KO mice (Figure 5 and Table S6). Although Ccn3 is expressed in sour and salty sensitive Type III taste cells, the concentration‐dependent CT nerve responses to sour and salty tastants were similar between WT and Ccn3‐KO mice. These results indicated that the absence of Ccn3 in mice does not affect CT nerve responses to the five basic tastants.
FIGURE 5.
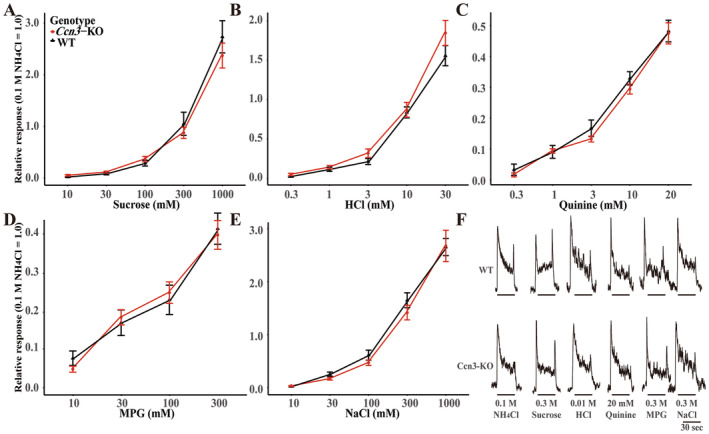
The deletion of Ccn3 had no impact on gustatory nerve responses. The concentration–response relationships of CT nerve responses of WT (black triangles) and Ccn3‐KO mice (red circles) for sucrose (A), HCl (B), quinine (C), MPG (D), and NaCl (E) (WT: n = 7, Ccn3‐KO: n = 7). (F) Sample recordings of integrated whole nerve responses from the CT nerve of a WT (upper trace) and Ccn3‐KO mouse (lower trace). The bars represent the duration of taste stimulus application. Gustatory nerve responses were normalized to the response to 100 mM NH4Cl. Values are presented means ± SEM. Statistical differences were analyzed by two‐way ANOVA tests (Table S6). WT mice (n = 12) and Ccn3‐KO mice (n = 15).
We also conducted short‐term (5‐s) lick tests to determine whether Ccn3‐KO mice exhibit any impairments in taste behavior (Figure 6). In this experiment, WT, Ccn3‐KO, and Ccn3/Trpv1‐KO mice were used, as a previous study demonstrated that aversive responses to sour (oral acid) are mediated by both taste and somatosensory neural pathways (Zhang et al. 2019). Consistent with CT nerve recordings, the short‐term lick responses to all tastants including sour (HCl and citric acid) and salty tastants, did not significantly differ among WT, Ccn3‐KO, and Ccn3/Trpv1‐KO mice (Figure 6A–F and Table S7). On the other hand, Ccn3/Trpv1‐KO mice showed a significant reduction in avoidance of 10 μM capsaicin compared to WT and Ccn3‐KO mice (Figure 6G and Table S8), due to the absence of the Trpv1 gene. In summary, the deletion of Ccn3 in mice did not result in any taste deficiencies in the short‐term lick tests.
FIGURE 6.
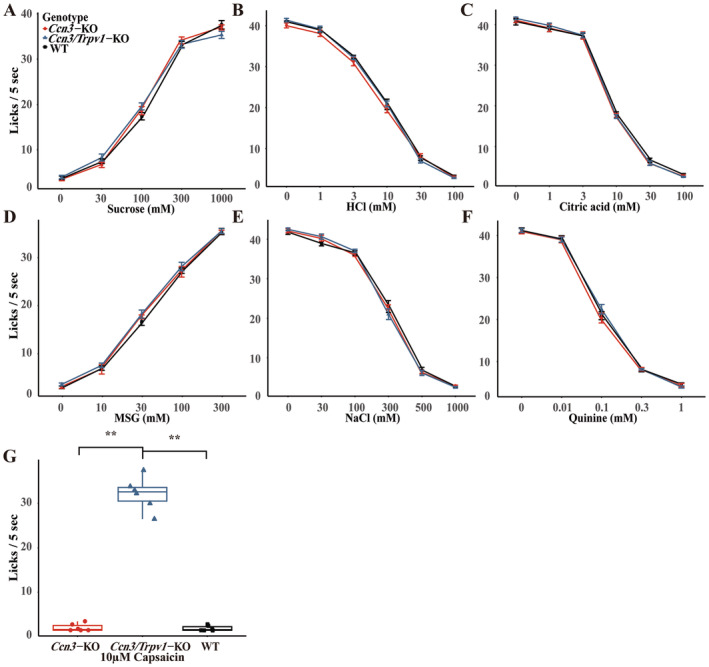
The lack of Ccn3 did not alter short‐term lick responses. Number of licks of 30–1000 mM Sucrose (A), 1–100 mM HCl (B), 1–100 mM citric acid (C), 10–300 mM MSG (D), 30–1000 mM NaCl (E), 0.01–1 mM Quinine (F), and 10 μM Capsaicin (G) in the short‐term (5 s) lick tests. Red circle: Ccn3‐KO mice (n = 7), blue triangle: Ccn3/Trpv1‐KO mice (n = 7), and black rectangle: WT mice (n = 7). Values are presented means ± SEM. Statistical differences were analyzed by repeated ANOVA tests (Table S7) or one‐way ANOVA with post hoc Tukey HSD test. **p < 0.01 (Table S8). WT mice (n = 7), Ccn3‐KO mice (n = 7), and Ccn3/Trpv1‐KO mice (n = 7).
3.4. Bioinformatics Analysis of Single‐Cell Sequencing Data of Ccn3 Expression in CvP and FoP
To assess the potential role of Ccn3 in taste tissue, we conducted a bioinformatic analysis. Because the number of cells in our scRNA‐seq data of FuP was insufficient, we opted to use other scRNA‐seq data of taste cells for further bioinformatics analysis. In this study, we selected the epithelial cell samples from the CvP and the FoP of the mouse tongue for scRNA‐seq analysis (Vercauteren Drubbel and Beck 2023). We confirmed the number of cell subpopulations defined by unsupervised clustering algorithms and annotated them using the RenameIdents function, aligning each cluster with its corresponding cell type. Cell distributions were visualized using the UMAP algorithm and the DimPlot function (Figure 7A). We manually annotated 17 clusters and visualized their cell distributions (Figure 7B and Figure S1A). Subsequently, we extracted the taste cell clusters to determine the number of subpopulations (Figure 7C). After manual annotation, we identified four types of taste cells (Figure 7D and Figure S1B).
FIGURE 7.
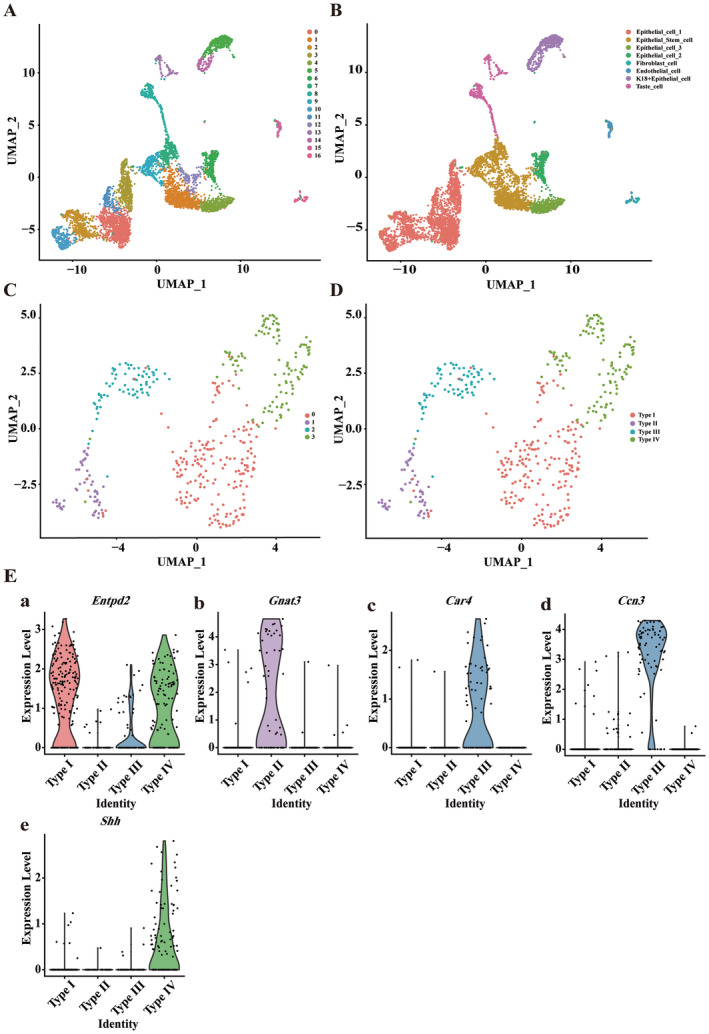
Single‐cell transcriptomics landscape of epithelial cells from the circumvallate and the foliate papillae. (A) Illustration of the single‐cell transcriptomic profiles, showing the diversity and distribution of cell clusters. (B) Following manual annotation, eight distinct cell populations were identified: Epithelial_cell_1, Epithelial_cell_2, Epithelial_cell_3, Epithelial_stem_cell, Fibroblast_cell, Endothelial_cell, K18+Epithelial_cell, and Taste_cell. (C) Single‐cell transcriptomic profiles of taste cells. (D) After manual annotation, four distinct cell clusters were identified: Type I, Type II, Type III, and Type IV. (E) Expression levels of Ccn3 and marker genes for each taste cell type across different clusters. Row data from Vercauteren Drubbel and Beck (2023).
Using the Seurat package's VlnPlot function, we generated violin plots of Ccn3 and marker gene expression levels for all taste cell types, including Type I, Type II, Type III, and Type IV taste cells, demonstrating their distribution across cell subpopulations (Figure 7E). Consistent with our results, Ccn3 is highly expressed in Type III taste cells. Entpd2 was highly expressed in the Type I and IV taste cells, which aligns with findings from the original study (Vercauteren Drubbel and Beck 2023). Using the Slingshot tool, we performed cell trajectory analysis, observing the transition of Type III taste cells from an immature to a mature state along the trajectory (Figure 8A). By tracking changes in the expression of taste marker genes and Ccn3 during Type III taste cell development, we found that Otop1, Pkd2l1, Snap25, and Ccn3 appeared earlier than Gad1 and Ca4 (Figure 8B). Scatter plot analysis depicted the relationship between Ccn3 expression and pseudotime, with statistical analysis showing a moderate positive correlation (Pearson r = 0.68, p < 0.001), suggesting that Ccn3 expression might increase over the pseudotime of Type III taste cell development (Figure 8C). Subsequently, we employed the feature plot function to specifically display the expression of Ccn3, Ca4, Snap25, and Gnat3 within individual taste cells (Figure 8D).
FIGURE 8.
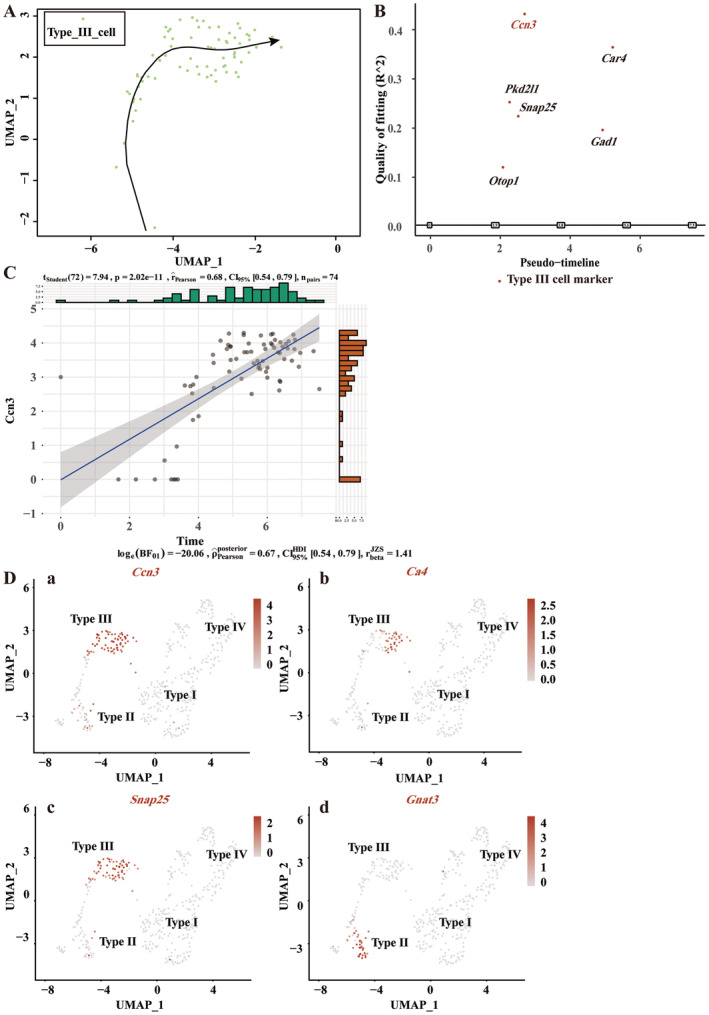
Single‐cell transcriptomic analysis reveals the expression patterns of Ccn3 during the development of Type III cells. (A) Cell trajectory analysis from naive to mature Type III cells by Slingshot. The tail of the arrow represents immature Type III cells, while the tip of the arrow denotes mature Type III cells. (B) Expression of Type III cell markers and Ccn3 in pseudo‐time, reflecting gene expression dynamics during cellular developmental or transcriptional processes. (C) Scatter plot showing the correlation between Ccn3 gene expression and pseudo‐time. (D) UMAP dimensionality reduction visualizes the expression of Type III cell markers Ca4, Snap25, Type II cell marker Gnat3, and Ccn3 across different cell subgroups. Row data from Vercauteren Drubbel and Beck (2023).
Intercellular communication analysis, conducted with the CellChat tool, showed differences between the Ccn3 positive Type III cell (Ccn3+Type III cell) and Ccn3 negative Type III cell (Ccn3−Type III cell) subgroups (Figure 9A). The Ccn3+Type III cell subgroup exhibited many ligand–receptor interactions with other cells, whereas the Ccn3−Type III cell showed no intercellular communication with other cells (Figure 9B). We then visualized the top five upregulated and downregulated genes in the Ccn3+Type III cell subgroup and Ccn3−Type III cell subgroup (Figure 10A). After GO analysis, the up‐regulated genes in the Ccn3+Type III cell subgroup were enriched in various pathways, and we specifically highlighted pathways related to the Ccn3 gene. These pathways included four categories: tissue regeneration, perception of pain, protein secretion, and immune response (Figure 10B). GSEA analysis of total differentially expressed genes demonstrated that the Ccn3+Type III cell subgroup's genes were enriched in pathways related to the response to addictive substances, regulation of synaptic transmission, taste transduction, immune responses, and others (Figure S2A), while the Ccn3−Type III cell subgroup's genes were linked to the pathways involving cell development, differentiation, Coronavirus disease, and more (Figure S2B).
FIGURE 9.
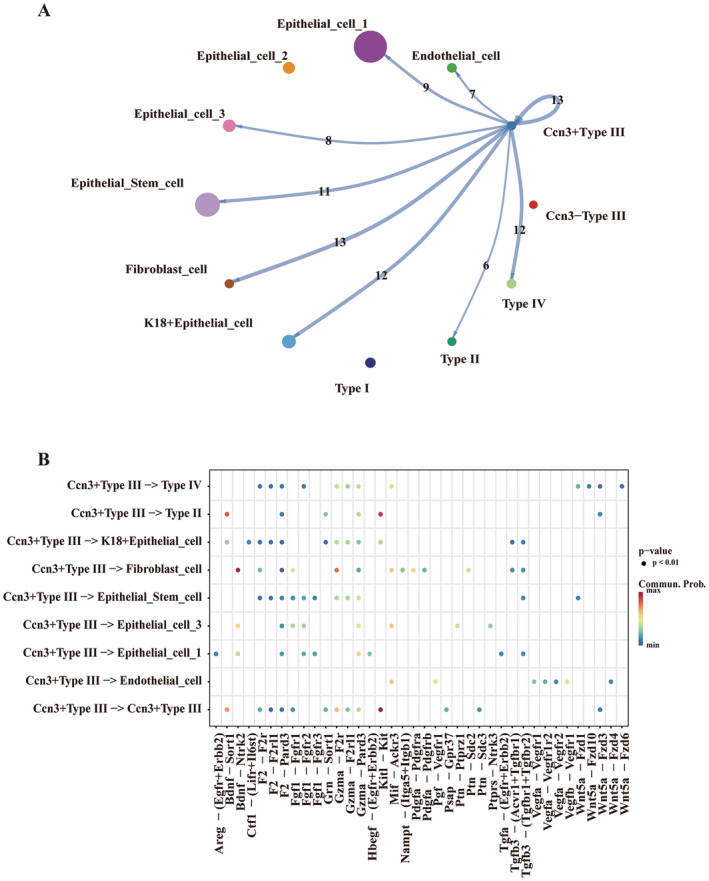
Cellular communication analysis in Ccn3+Type III and Ccn3−Type III cell subgroups. (A) Cellular communication networks constructed for Ccn3+Type III and Ccn3−Type III cell subgroups with other cells in lingual epithelium samples. Ccn3−Type III cells do not communicate with other cells. (B) The important receptors and ligands that play a crucial role when Ccn3+Type III cells interact with other cells. Row data from Vercauteren Drubbel and Beck (2023).
FIGURE 10.
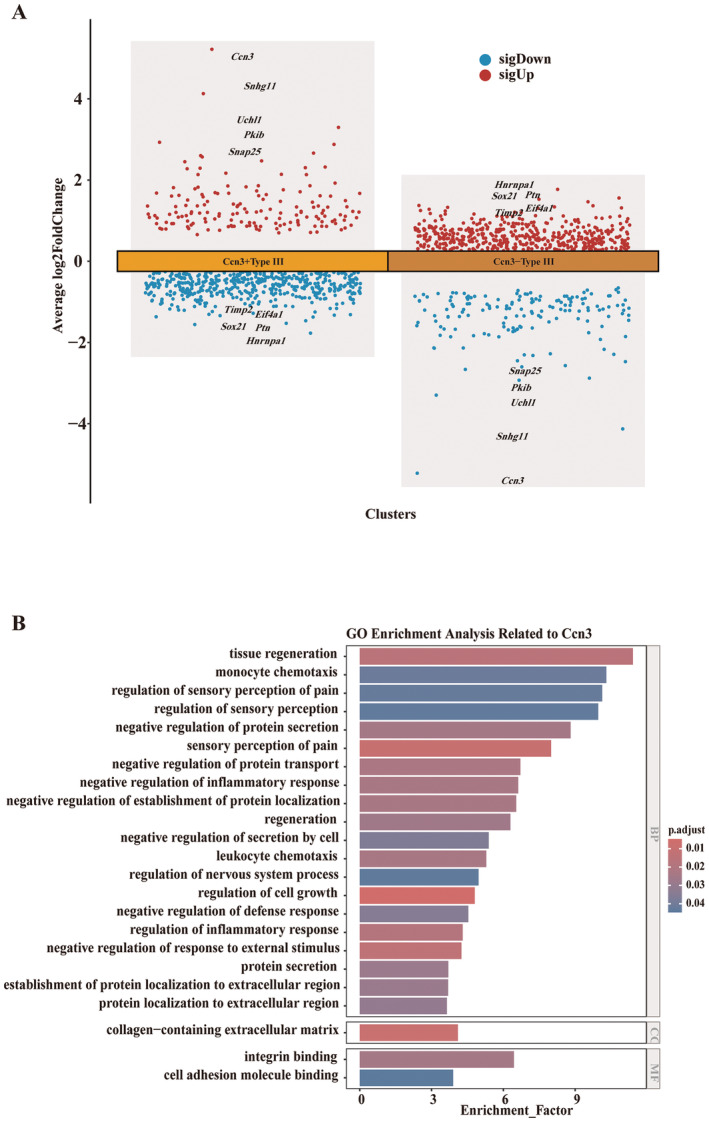
Predicting the potential functions of Ccn3 in Type III cells. (A) Differentially expressed genes between Ccn3+Type III and Ccn3−Type III cell subgroups. (B) GO enrichment analysis displaying the pathways involving the Ccn3 gene in Type III taste cells. Row data from Vercauteren Drubbel and Beck (2023).
4. Discussion
In the present study, we report for the first time that Ccn3 is expressed in FuP and CvP taste buds in WT mice. To clarify the expression of Ccn3 in taste bud cells, we performed RT‐PCR, ISH, and IHC experiments, and found that Ccn3 mRNAs and proteins were highly expressed in the taste papillae and selectively expressed in Type III taste cells of FuP and CvP taste buds. These results indicate that Ccn3 is a novel marker for Type III taste cells. To investigate the function of Ccn3, we conducted IHC, qRT‐PCR, gustatory nerve recordings, and behavioral lick tests using WT, Ccn3‐KO, and Ccn3/Trpv1‐KO mice. Based on the results of IHC and qRT‐PCR, we suggest that the deletion of Ccn3 does not affect the histological structure of taste buds or the gene expression of other taste cell markers in taste buds. In addition, functional analyses of gustatory nerve recordings and behavioral tests clearly demonstrated that CCN3 in taste cells might not contribute to taste responses to each of the basic tastes in mice, despite its high and specific expression in Type III cells. These findings suggest that CCN3 may not play a role in taste sensation. Although we observed strong expression of CCN3 in Type III cells, its function remains unclear.
4.1. Ccn3 is a Novel Marker of Type III Taste Cells but is Not Involved in Taste Response
In our study, the Type III taste cell marker CA4 was co‐localized with CCN3 in the CvP and FuP. In addition, the population of CCN3 (+) taste cells included more cells compared to CA4 (+) cells. Notably, the Type II taste cell marker GNAT3 was generally not expressed in CCN3 (+) taste cells, with the exception of a rare co‐expression observed in CvP (Figure 3). Our bioinformatics results suggest that the Ccn3 gene is likely to be expressed earlier than the Ca4 gene in Type III taste cells (Figure 8B,D a,b), and it may explain why there are more CCN3‐expressing cells than CA4‐expressing cells in taste tissue. In our analysis, Ccn3+type III cells were shown to express numerous ligands to interact with other cell types whereas Ccn3‐type III cells showed no such interaction (Figure 9). This may be due to their status as immature Type III taste cells that cannot produce ligands for communication with surrounding cells. Thus, Ccn3 could be used as a novel Type III taste cell marker allowing for the identification of more Type III cells at earlier developmental stages than Ca4, which appears at a more mature stage in Type III cells.
Type III taste cells possess synapses, express synapse‐related proteins, and release serotonin (5‐HT) in a calcium‐dependent manner when stimulated with tastants (DeFazio et al. 2006; Huang et al. 2005). As shown in Figure 8D a,c, Snap25, a key component of the neuronal SNARE complex (Karmakar et al. 2019), exhibited an expression pattern similar to that of Ccn3 in Type III taste cells. Thus, Ccn3+Type III cells possess neural characteristics. Actually, Ccn3 is reported to be extensively expressed in the mouse CNS, including neurons in the cerebral cortex, hippocampus, amygdala, SCN, AON, and spinal cord gray matter (Cahoy et al. 2008; Le Dréau, Nicot, et al. 2010; Su et al. 2001). Despite the robust and dynamic expression of Ccn3 in the CNS, it is not required for efficient myelination or remyelination in vivo (de la Vega Gallardo et al. 2020). In the avian retina, overexpressed CCN3 may not be critical for normal retina development (Laurent et al. 2012). Similar to these studies, we were not able to identify the apparent function of CCN3 in taste organs. In future research, it will be essential to focus on the function of CCN3 in the CNS, as Type III taste cells are presynaptic cells that belong to the nervous system. Conversely, studying CCN3 in taste cells will provide valuable insights into its role in the CNS. Although the function of Ccn3 in taste cells is still unclear, our bioinformatics analyses suggest several potential functions of Ccn3 in taste cells: tissue regeneration, pain sensation, protein secretion, and immune response (Figure 10).
4.2. Ccn3 and Regeneration of Taste Cells
Ccn3 may not be involved in the regeneration of taste cells although it plays crucial roles in regulating the proliferation, migration, differentiation, and survival of stem cells in various tissues (Gupta et al. 2007; Luan et al. 2023; Su et al. 2018; Tan et al. 2012). The common molecular mechanisms by which CCN3 regulates stem cells remain unclear due to its varied roles across tissues. One possible pathway regulated by CCN3 is the Notch pathway since previous studies have shown that Ccn3 contributes to the proliferation and differentiation of stem cells via the Notch pathway (Katsube et al. 2009; Luan et al. 2023). The Shh pathway is also a target of CCN3 (Le Dréau, Nicot, et al. 2010). Both Notch and Shh pathway are reported to be involved in cell development in taste tissues (Barlow 2022; Hsu et al. 2021; Kapsimali et al. 2011; Miura et al. 2005; Miura, Kusakabe, and Harada 2006; Takagi et al. 2018). However, in this study, we found no significant histological, gene expression, and functional differences between WT and Ccn3‐KO mice indicated by IHC, qRT‐PCR, CT nerve recordings, and behavioral lick tests. Therefore, CCN3 in taste cells may not be involved in the regeneration of taste cells.
4.3. Ccn3 and Pain Sensation
Ccn3 may be unrelated to pain sensation. TRPV1, a non‐selective cation channel, is localized on nociceptive primary afferent sensory neurons. It is activated by noxious heat, pH changes, a variety of inflammatory mediators and chemicals, and capsaicin (the pungent component in chili peppers) (Ross 2003). Mice lacking sour taste cells still exhibit a strong aversion to acids despite the complete abolition of physiological responses from these cells (Huang et al. 2006). When trigeminal Trpv1‐expressing neurons were ablated in animals lacking OTOP1, a proton channel in sour taste cells, they exhibited a significant reduction in behavioral aversion to acids (Zhang et al. 2019). Our study showed no significant differences in sour taste among WT, Ccn3‐KO, and Ccn3/Trpv1‐KO mice, further demonstrating that Ccn3 may not contribute to sour taste responses. Previous study revealed that Ccn3 exerts an anti‐allodynic effect through modulation of MMP‐2 and MMP‐9 (Kular et al. 2012). Capsaicin binding to the TRPV1 receptor is also a form of pain sensation (Giordano et al. 2012). In our study, WT and Ccn3‐KO mice exhibited the same aversion to 10 μM capsaicin. This suggests that Ccn3 might not contribute to TRPV1‐associated pain sensation on the tongue.
4.4. Ccn3 and Immune Response
Immune response is the most plausible function among predicted roles suggested by bioinformatics analyses. The residual predicted functions of Ccn3, protein secretion, and immune response, may be interconnected, as protein secretion commonly occurs during immune responses. Taste receptors not only transmit taste signals but also play a role in the immune system. For example, bitter receptors are involved in the innate immune response to molecules produced by bacteria and parasites (Xi, Zheng, and Tizzano 2022). Type II taste cells, which express taste 1 receptor member 3 (Tas1r3), have a gene expression profile similar to Microfold cells, key players in immune surveillance within mucosa‐associated lymphoid tissues (Qin et al. 2023). Type I taste cells share many characteristics with macrophages and may play a role in oral inflammation (Hichami et al. 2023). On the other hand, the innate immune response can also alter the taste signal transmissions (Huang and Wu 2016). To date, the involvement of Type III taste cells in immunity has not been reported. Our GO enrichment analysis indicates that Ccn3 in Type III taste cells is associated with immune‐related pathways including monocyte chemotaxis, leukocyte chemotaxis, regulation of inflammatory response, negative regulation of inflammatory response, and negative regulation of defense response (Figure 10). Additionally, GSEA enrichment analysis shows that Ccn3+Type III taste cells are associated with the IL‐17 signaling pathway (Figure S2). In fact, Ccn3 is involved not only in the regulation of immune cell functions, including the regulation of Treg and hematopoietic stem cell function (Dombrowski et al. 2017; Gupta et al. 2007) but also mediates astrocyte activation, potentially contributing to neuroinflammation (Le Dréau, Kular, et al. 2010). Furthermore, Ccn3 plays a role in immune‐related diseases such as rheumatoid arthritis, osteoarthritis, glomerulonephritis, multiple sclerosis, and systemic sclerosis (Peng et al. 2021). GSEA enrichment analysis shows that Ccn3−Type III taste cells are associated with the Coronavirus disease (COVID‐19) pathway. The COVID‐19 pandemic has highlighted the significance of smell and taste disturbances due to their profound impact on daily functioning and the considerable distress caused by the loss of these senses (Boscolo‐Rizzo, Polesel, and Vaira 2022). Thus far, the exact mechanisms by which Severe Acute Respiratory Syndrome Coronavirus 2 (SARS‐CoV‐2) causes taste loss are not well understood. However, current hypotheses and limited evidence indicate that the virus may impact the lingual epithelium (Mastrangelo, Bonato, and Cinque 2021). Investigating whether Ccn3 could be a key gene involved in the infection of taste cells by the coronavirus is a meaningful direction for future research.
Although our study indicates that Ccn3, as a novel marker for Type III taste cells, may not be involved in taste responses, it highlights other potential functions of Ccn3 related to immunity that have been relatively unstudied in the taste system. Our research offers valuable insights that could guide future studies in this area.
Author Contributions
Kuanyu Wang: methodology, software, data curation, investigation, validation, formal analysis, visualization, writing – original draft, writing – review and editing. Yoshihiro Mitoh: investigation, formal analysis, writing – review and editing, supervision. Kengo Horie: investigation, formal analysis, writing – review and editing, supervision. Ryusuke Yoshida: conceptualization, methodology, investigation, writing – original draft, writing – review and editing, formal analysis, supervision, funding acquisition, resources, project administration, software, data curation, validation, visualization.
Conflicts of Interest
The authors declare no conflicts of interest.
Peer Review
The peer review history for this article is available at https://www.webofscience.com/api/gateway/wos/peer‐review/10.1111/jnc.16291.
Supporting information
Figure S1. Dot Plot of marker genes. (A) Dot Plot illustrating the expression of marker genes across various cell subsets in epithelial cells from the CvP and the FoP of the mouse tongue. Clusters 8 and 13 are taste cell clusters. The markers corresponding to the cell annotation are presented in Table S9. (B) Dot Plot illustrating the expression of marker genes across various cell subsets in taste cells from the CvP and the FoP of the mouse tongue. Cluster 0 is a Type I taste cell, cluster 1 is a Type IV taste cell, cluster 2 is a Type III taste cell, and cluster 4 is a Type II taste cell. The markers corresponding to the cell annotation are presented in Table S10. Row data from Vercauteren Drubbel and Beck (2023).
Figure S2. Predicting the potential functions of Ccn3+Type III and Ccn3−Type III cell subgroups. (A) GSEA enrichment analysis showing the top ten genes sets enriched in Ccn3+Type III cell subgroups. (B) GSEA enrichment analysis showing the top ten genes sets enriched in Ccn3−Type III cell subgroups. Row data from Vercauteren Drubbel and Beck (2023).
Tables S1–S10.
Acknowledgments
The authors thank Dr. Kei Sakamoto (Tokyo Medical and Dental University, Japan) for providing the original stock of Ccn3‐KO mice, Dr. Makoto Tominaga (National Institute for Physiological Sciences, Japan) for providing the original stock of Trpv1‐KO mice, Dr. Takako Sasaki (Oita Univ, Japan) for providing the antibody against mouse CCN3. The authors also thank Drs. Masaharu Takigawa, Satoshi Kubota, and Takako Hattori (Okayama University, Japan) for providing helpful comments and advice.
Funding: This work was supported by Japan Society for the Promotion of Science KAKENHI grants 21H03106, 23K21484, and 24K22186 (R.Y.) and Umami Manufacturers Association (R.Y.). The funding source had no role in the design of the study, in the collection, analysis, and interpretation of data, or in writing the manuscript.
Data Availability Statement
All data supporting the findings of this study are available from the corresponding author upon request.
References
- Barlow, L. A. 2022. “The Sense of Taste: Development, Regeneration, and Dysfunction.” WIREs Mechanisms of Disease 14, no. 3: e1547. 10.1002/wsbm.1547. [DOI] [PMC free article] [PubMed] [Google Scholar]
- Bartel, D. L. , Sullivan S. L., Lavoie É. G., Sévigny J., and Finger T. E.. 2006. “Nucleoside Triphosphate Diphosphohydrolase‐2 Is the Ecto‐ATPase of Type I Cells in Taste Buds.” Journal of Comparative Neurology 497, no. 1: 1–12. 10.1002/cne.20954. [DOI] [PMC free article] [PubMed] [Google Scholar]
- Boscolo‐Rizzo, P. , Polesel J., and Vaira L. A.. 2022. “Smell and Taste Dysfunction After Covid‐19.” BMJ (Clinical Research Ed.) 378: o1653. 10.1136/bmj.o1653. [DOI] [PubMed] [Google Scholar]
- Cahoy, J. D. , Emery B., Kaushal A., et al. 2008. “A Transcriptome Database for Astrocytes, Neurons, and Oligodendrocytes: A New Resource for Understanding Brain Development and Function.” Journal of Neuroscience 28, no. 1: 264–278. 10.1523/JNEUROSCI.4178-07.2008. [DOI] [PMC free article] [PubMed] [Google Scholar]
- Caterina, M. J. , Leffler A., Malmberg A. B., et al. 2000. “Impaired Nociception and Pain Sensation in Mice Lacking the Capsaicin Receptor.” Science 288, no. 5464: 306–313. 10.1126/science.288.5464.306. [DOI] [PubMed] [Google Scholar]
- de la Vega Gallardo, N. , Penalva R., Dittmer M., et al. 2020. “Dynamic CCN3 Expression in the Murine CNS Does Not Confer Essential Roles in Myelination or Remyelination.” Proceedings of the National Academy of Sciences of the United States of America 117, no. 30: 18018–18028. 10.1073/pnas.1922089117. [DOI] [PMC free article] [PubMed] [Google Scholar]
- DeFazio, R. A. , Dvoryanchikov G., Maruyama Y., et al. 2006. “Separate Populations of Receptor Cells and Presynaptic Cells in Mouse Taste Buds.” Journal of Neuroscience 26, no. 15: 3971–3980. 10.1523/JNEUROSCI.0515-06.2006. [DOI] [PMC free article] [PubMed] [Google Scholar]
- Dombrowski, Y. , O'Hagan T., Dittmer M., et al. 2017. “Regulatory T Cells Promote Myelin Regeneration in the Central Nervous System.” Nature Neuroscience 20, no. 5: 674–680. 10.1038/nn.4528. [DOI] [PMC free article] [PubMed] [Google Scholar]
- Finger, T. E. , and Barlow L. A.. 2021. “Cellular Diversity and Regeneration in Taste Buds.” Current Opinion in Physiology 20: 146–153. 10.1016/j.cophys.2021.01.003. [DOI] [PMC free article] [PubMed] [Google Scholar]
- Fu, C. T. , Bechberger J. F., Ozog M. A., Perbal B., and Naus C. C.. 2004. “CCN3 (NOV) Interacts With connexin43 in C6 Glioma Cells: Possible Mechanism of Connexin‐Mediated Growth Suppression.” Journal of Biological Chemistry 279, no. 35: 36943–36950. 10.1074/jbc.M403952200. [DOI] [PubMed] [Google Scholar]
- Giordano, C. , Cristino L., Luongo L., et al. 2012. “TRPV1‐Dependent and ‐Independent Alterations in the Limbic Cortex of Neuropathic Mice: Impact on Glial Caspases and Pain Perception.” Cerebral Cortex 22, no. 11: 2495–2518. 10.1093/cercor/bhr328. [DOI] [PMC free article] [PubMed] [Google Scholar]
- Gupta, R. , Hong D., Iborra F., Sarno S., and Enver T.. 2007. “NOV (CCN3) Functions as a Regulator of Human Hematopoietic Stem or Progenitor Cells.” Science (New York, N.Y.) 316, no. 5824: 590–593. 10.1126/science.1136031. [DOI] [PubMed] [Google Scholar]
- Hedlund, E. , and Deng Q.. 2018. “Single‐Cell RNA Sequencing: Technical Advancements and Biological Applications.” Molecular Aspects of Medicine 59: 36–46. 10.1016/j.mam.2017.07.003. [DOI] [PubMed] [Google Scholar]
- Hichami, A. , Saidi H., Khan A. S., Degbeni P., and Khan N. A.. 2023. “In Vitro Functional Characterization of Type‐I Taste Bud Cells as Monocytes/Macrophages‐Like Which Secrete Proinflammatory Cytokines.” International Journal of Molecular Sciences 24, no. 12: 10325. 10.3390/ijms241210325. [DOI] [PMC free article] [PubMed] [Google Scholar]
- Hirose, F. , Takai S., Takahashi I., and Shigemura N.. 2020. “Expression of Protocadherin‐20 in Mouse Taste Buds.” Scientific Reports 10, no. 1: 2051. 10.1038/s41598-020-58991-8. [DOI] [PMC free article] [PubMed] [Google Scholar]
- Hirose, K. , Kuwahara M., Nakata E., et al. 2022. “Elevated Expression of CCN3 in Articular Cartilage Induces Osteoarthritis in Hip Joints Irrespective of Age and Weight Bearing.” International Journal of Molecular Sciences 23, no. 23: 15311. 10.3390/ijms232315311. [DOI] [PMC free article] [PubMed] [Google Scholar]
- Holbourn, K. P. , Acharya K. R., and Perbal B.. 2008. “The CCN Family of Proteins: Structure–Function Relationships.” Trends in Biochemical Sciences 33, no. 10: 461–473. 10.1016/j.tibs.2008.07.006. [DOI] [PMC free article] [PubMed] [Google Scholar]
- Hsu, C.‐C. , Seta Y., Matsuyama K., et al. 2021. “Mash1‐Expressing Cells May Be Relevant to Type III Cells and a Subset of PLCβ2‐Positive Cell Differentiation in Adult Mouse Taste Buds.” Cell and Tissue Research 383, no. 2: 667–675. 10.1007/s00441-020-03283-w. [DOI] [PubMed] [Google Scholar]
- Huang, A. L. , Chen X., Hoon M. A., et al. 2006. “The Cells and Logic for Mammalian Sour Taste Detection.” Nature 442, no. 7105: 934–938. 10.1038/nature05084. [DOI] [PMC free article] [PubMed] [Google Scholar]
- Huang, A. Y. , and Wu S. Y.. 2016. “The Effect of Imiquimod on Taste Bud Calcium Transients and Transmitter Secretion.” British Journal of Pharmacology 173, no. 21: 3121–3133. 10.1111/bph.13567. [DOI] [PMC free article] [PubMed] [Google Scholar]
- Huang, Y.‐J. , Maruyama Y., Lu K.‐S., et al. 2005. “Mouse Taste Buds Use Serotonin as a Neurotransmitter.” Journal of Neuroscience 25, no. 4: 843–847. 10.1523/JNEUROSCI.4446-04.2005. [DOI] [PMC free article] [PubMed] [Google Scholar]
- Iwata, S. , Yoshida R., Takai S., Sanematsu K., Shigemura N., and Ninomiya Y.. 2023. “Adrenomedullin Enhances Mouse Gustatory Nerve Responses to Sugars via T1R‐Independent Sweet Taste Pathway.” Nutrients 15, no. 13: 2941. 10.3390/nu15132941. [DOI] [PMC free article] [PubMed] [Google Scholar]
- Kapsimali, M. , Kaushik A.‐L., Gibon G., Dirian L., Ernest S., and Rosa F. M.. 2011. “Fgf Signaling Controls Pharyngeal Taste Bud Formation Through miR‐200 and Delta‐Notch Activity.” Development 138, no. 16: 3473–3484. 10.1242/dev.058669. [DOI] [PubMed] [Google Scholar]
- Karmakar, S. , Sharma L. G., Roy A., Patel A., and Pandey L. M.. 2019. “Neuronal SNARE Complex: A Protein Folding System With Intricate Protein–Protein Interactions, and Its Common Neuropathological Hallmark, SNAP25.” Neurochemistry International 122: 196–207. 10.1016/j.neuint.2018.12.001. [DOI] [PubMed] [Google Scholar]
- Katsube, K.‐I. , Ichikawa S., Katsuki Y., et al. 2009. “CCN3 and Bone Marrow Cells.” Journal of Cell Communication and Signaling 3, no. 2: 135–145. 10.1007/s12079-009-0059-1. [DOI] [PMC free article] [PubMed] [Google Scholar]
- Kim, Y. , Yang H., Min J.‐K., et al. 2018. “CCN3 Secretion Is Regulated by Palmitoylation via ZDHHC22.” Biochemical and Biophysical Research Communications 495, no. 4: 2573–2578. 10.1016/j.bbrc.2017.12.128. [DOI] [PubMed] [Google Scholar]
- Kinnamon, S. C. , and Finger T. E.. 2019. “Recent Advances in Taste Transduction and Signaling.” F1000Research 8: 2117. 10.12688/f1000research.21099.1. [DOI] [PMC free article] [PubMed] [Google Scholar]
- Kubota, S. , Kawata K., Hattori T., and Nishida T.. 2022. “Molecular and Genetic Interactions Between CCN2 and CCN3 Behind Their Yin–Yang Collaboration.” International Journal of Molecular Sciences 23, no. 11: 5887. 10.3390/ijms23115887. [DOI] [PMC free article] [PubMed] [Google Scholar]
- Kular, L. , Rivat C., Lelongt B., et al. 2012. “NOV/CCN3 Attenuates Inflammatory Pain Through Regulation of Matrix Metalloproteinases‐2 and ‐9.” Journal of Neuroinflammation 9, no. 1: 36. 10.1186/1742-2094-9-36. [DOI] [PMC free article] [PubMed] [Google Scholar]
- Kuwahara, M. , Kadoya K., Kondo S., et al. 2020. “CCN3 (NOV) Drives Degradative Changes in Aging Articular Cartilage.” International Journal of Molecular Sciences 21, no. 20: 7556. 10.3390/ijms21207556. [DOI] [PMC free article] [PubMed] [Google Scholar]
- Laurent, M. , Le Dréau G., Guillonneau X., et al. 2012. “Temporal and Spatial Expression of CCN3 During Retina Development.” Developmental Neurobiology 72, no. 11: 1363–1375. 10.1002/dneu.20994. [DOI] [PubMed] [Google Scholar]
- Lawton, D. M. , Furness D. N., Lindemann B., and Hackney C. M.. 2000. “Localization of the Glutamate‐Aspartate Transporter, GLAST, in Rat Taste Buds.” European Journal of Neuroscience 12, no. 9: 3163–3171. 10.1046/j.1460-9568.2000.00207.x. [DOI] [PubMed] [Google Scholar]
- Le Dréau, G. , Kular L., Nicot A. B., et al. 2010. “NOV/CCN3 Upregulates CCL2 and CXCL1 Expression in Astrocytes Through beta1 and beta5 Integrins.” Glia 58, no. 12: 1510–1521. 10.1002/glia.21025. [DOI] [PubMed] [Google Scholar]
- Le Dréau, G. , Nicot A., Bénard M., et al. 2010. “NOV/CCN3 Promotes Maturation of Cerebellar Granule Neuron Precursors.” Molecular and Cellular Neurosciences 43, no. 1: 60–71. 10.1016/j.mcn.2009.02.011. [DOI] [PubMed] [Google Scholar]
- Luan, Y. , Zhang H., Ma K., et al. 2023. “CCN3/NOV Regulates Proliferation and Neuronal Differentiation in Mouse Hippocampal Neural Stem Cells via the Activation of the Notch/PTEN/AKT Pathway.” International Journal of Molecular Sciences 24, no. 12: 10324. 10.3390/ijms241210324. [DOI] [PMC free article] [PubMed] [Google Scholar]
- Mastrangelo, A. , Bonato M., and Cinque P.. 2021. “Smell and Taste Disorders in COVID‐19: From Pathogenesis to Clinical Features and Outcomes.” Neuroscience Letters 748: 135694. 10.1016/j.neulet.2021.135694. [DOI] [PMC free article] [PubMed] [Google Scholar]
- Matsushita, Y. , Sakamoto K., Tamamura Y., et al. 2013. “CCN3 Protein Participates in Bone Regeneration as an Inhibitory Factor.” Journal of Biological Chemistry 288, no. 27: 19973–19985. 10.1074/jbc.M113.454652. [DOI] [PMC free article] [PubMed] [Google Scholar]
- McInnes, L. , Healy J., Saul N., and Großberger L.. 2018. “UMAP: Uniform Manifold Approximation and Projection.” Journal of Open Source Software 3, no. 29: 861. 10.21105/joss.00861. [DOI] [Google Scholar]
- Mikami, A. , Huang H., Hyodo A., et al. 2024. “The Role of GABA in Modulation of Taste Signaling Within the Taste Bud.” Pflügers Archiv—European Journal of Physiology 476, no. 11: 1761–1775. 10.1007/s00424-024-03007-x. [DOI] [PMC free article] [PubMed] [Google Scholar]
- Miura, H. , Kato H., Kusakabe Y., Ninomiya Y., and Hino A.. 2005. “Temporal Changes in NCAM Immunoreactivity During Taste Cell Differentiation and Cell Lineage Relationships in Taste Buds.” Chemical Senses 30, no. 4: 367–375. 10.1093/chemse/bji031. [DOI] [PubMed] [Google Scholar]
- Miura, H. , Kusakabe Y., and Harada S.. 2006. “Cell Lineage and Differentiation in Taste Buds.” Archives of Histology and Cytology 69, no. 4: 209–225. 10.1679/aohc.69.209. [DOI] [PubMed] [Google Scholar]
- Monsen, V. T. , and Attramadal H.. 2023. “Structural Insights Into Regulation of CCN Protein Activities and Functions.” Journal of Cell Communication and Signaling 17, no. 2: 371–390. 10.1007/s12079-023-00768-5. [DOI] [PMC free article] [PubMed] [Google Scholar]
- Murray, R. G. , and Murray A.. 1971. “Relations and Possible Significance of Taste Bud Cells.” Contributions to Sensory Physiology 5: 47–95. 10.1016/b978-0-12-151805-9.50008-0. [DOI] [PubMed] [Google Scholar]
- Nomura, K. , Nakanishi M., Ishidate F., Iwata K., and Taruno A.. 2020. “All‐Electrical Ca2+‐Independent Signal Transduction Mediates Attractive Sodium Taste in Taste Buds.” Neuron 106, no. 5: 816–829.e6. 10.1016/j.neuron.2020.03.006. [DOI] [PubMed] [Google Scholar]
- Ohmoto, M. , Kitamoto S., and Hirota J.. 2021. “Expression of Eya1 in Mouse Taste Buds.” Cell and Tissue Research 383, no. 3: 979–986. 10.1007/s00441-020-03311-9. [DOI] [PubMed] [Google Scholar]
- Peng, L. , Wei Y., Shao Y., Li Y., Liu N., and Duan L.. 2021. “The Emerging Roles of CCN3 Protein in Immune‐Related Diseases.” Mediators of Inflammation 2021: 5576059. 10.1155/2021/5576059. [DOI] [PMC free article] [PubMed] [Google Scholar]
- Prescott, G. R. , Gorleku O. A., Greaves J., and Chamberlain L. H.. 2009. “Palmitoylation of the Synaptic Vesicle Fusion Machinery.” Journal of Neurochemistry 110, no. 4: 1135–1149. 10.1111/j.1471-4159.2009.06205.x. [DOI] [PubMed] [Google Scholar]
- Qin, Y. , Palayyan S. R., Zheng X., Tian S., Margolskee R. F., and Sukumaran S. K.. 2023. “Type II Taste Cells Participate in Mucosal Immune Surveillance.” PLoS Biology 21, no. 1: e3001647. 10.1371/journal.pbio.3001647. [DOI] [PMC free article] [PubMed] [Google Scholar]
- Qin, Y. , Sukumaran S. K., Jyotaki M., Redding K., Jiang P., and Margolskee R. F.. 2018. “Gli3 Is a Negative Regulator of Tas1r3‐Expressing Taste Cells.” PLoS Genetics 14, no. 2: e1007058. 10.1371/journal.pgen.1007058. [DOI] [PMC free article] [PubMed] [Google Scholar]
- Qin, Y. , Sukumaran S. K., and Margolskee R. F.. 2021. “Nkx2‐2 Expressing Taste Cells in Endoderm‐Derived Taste Papillae Are Committed to the Type III Lineage.” Developmental Biology 477: 232–240. 10.1016/j.ydbio.2021.05.020. [DOI] [PubMed] [Google Scholar]
- Ross, R. A. 2003. “Anandamide and Vanilloid TRPV1 Receptors.” British Journal of Pharmacology 140, no. 5: 790–801. 10.1038/sj.bjp.0705467. [DOI] [PMC free article] [PubMed] [Google Scholar]
- Su, B. Y. , Cai W. Q., Zhang C. G., Martinez V., Lombet A., and Perbal B.. 2001. “The Expression of ccn3 (Nov) RNA and Protein in the Rat Central Nervous System Is Developmentally Regulated.” Molecular Pathology: MP 54, no. 3: 184–191. 10.1136/mp.54.3.184. [DOI] [PMC free article] [PubMed] [Google Scholar]
- Su, X. , Wei Y., Cao J., et al. 2018. “CCN3 and DLL1 Co‐Regulate Osteogenic Differentiation of Mouse Embryonic Fibroblasts in a Hey1‐Dependent Manner.” Cell Death & Disease 9, no. 12: 1188. 10.1038/s41419-018-1234-1. [DOI] [PMC free article] [PubMed] [Google Scholar]
- Sukumaran, S. K. , Lewandowski B. C., Qin Y., Kotha R., Bachmanov A. A., and Margolskee R. F.. 2017. “Whole Transcriptome Profiling of Taste Bud Cells.” Scientific Reports 7, no. 1: 7595. 10.1038/s41598-017-07746-z. [DOI] [PMC free article] [PubMed] [Google Scholar]
- Takagi, H. , Seta Y., Kataoka S., Nakatomi M., Toyono T., and Kawamoto T.. 2018. “Mash1‐Expressing Cells Could Differentiate to Type III Cells in Adult Mouse Taste Buds.” Anatomical Science International 93, no. 4: 422–429. 10.1007/s12565-018-0431-4. [DOI] [PubMed] [Google Scholar]
- Takai, S. , Watanabe Y., Sanematsu K., et al. 2019. “Effects of Insulin Signaling on Mouse Taste Cell Proliferation.” PLoS One 14, no. 11: e0225190. 10.1371/journal.pone.0225190. [DOI] [PMC free article] [PubMed] [Google Scholar]
- Tan, T.‐W. , Huang Y.‐L., Chang J.‐T., et al. 2012. “CCN3 Increases BMP‐4 Expression and Bone Mineralization in Osteoblasts.” Journal of Cellular Physiology 227, no. 6: 2531–2541. 10.1002/jcp.22991. [DOI] [PubMed] [Google Scholar]
- Taruno, A. , Vingtdeux V., Ohmoto M., et al. 2013. “CALHM1 Ion Channel Mediates Purinergic Neurotransmission of Sweet, Bitter and Umami Tastes.” Nature 495, no. 7440: 223–226. 10.1038/nature11906. [DOI] [PMC free article] [PubMed] [Google Scholar]
- Vercauteren Drubbel, A. , and Beck B.. 2023. “Single‐Cell Transcriptomics Uncovers the Differentiation of a Subset of Murine Esophageal Progenitors Into Taste Buds In Vivo.” Science Advances 9, no. 10: eadd9135. 10.1126/sciadv.add9135. [DOI] [PMC free article] [PubMed] [Google Scholar]
- Xi, R. , Zheng X., and Tizzano M.. 2022. “Role of Taste Receptors in Innate Immunity and Oral Health.” Journal of Dental Research 101, no. 7: 759–768. 10.1177/00220345221077989. [DOI] [PMC free article] [PubMed] [Google Scholar]
- Yamase, Y. , Huang H., Mitoh Y., Egusa M., Miyawaki T., and Yoshida R.. 2023. “Taste Responses and Ingestive Behaviors to Ingredients of Fermented Milk in Mice.” Food 12, no. 6: 1150. 10.3390/foods12061150. [DOI] [PMC free article] [PubMed] [Google Scholar]
- Yoshida, R. , Noguchi K., Shigemura N., et al. 2015. “Leptin Suppresses Mouse Taste Cell Responses to Sweet Compounds.” Diabetes 64, no. 11: 3751–3762. 10.2337/db14-1462. [DOI] [PMC free article] [PubMed] [Google Scholar]
- Yoshida, R. , Shin M., Yasumatsu K., et al. 2017. “The Role of Cholecystokinin in Peripheral Taste Signaling in Mice.” Frontiers in Physiology 8: 866. 10.3389/fphys.2017.00866. [DOI] [PMC free article] [PubMed] [Google Scholar]
- Yoshida, R. , Yasumatsu K., Shirosaki S., et al. 2009. “Multiple Receptor Systems for Umami Taste in Mice.” Annals of the New York Academy of Sciences 1170, no. 1: 51–54. 10.1111/j.1749-6632.2009.03902.x. [DOI] [PubMed] [Google Scholar]
- Zhang, J. , Jin H., Zhang W., et al. 2019. “Sour Sensing From the Tongue to the Brain.” Cell 179, no. 2: 392–402.e15. 10.1016/j.cell.2019.08.031. [DOI] [PubMed] [Google Scholar]
Associated Data
This section collects any data citations, data availability statements, or supplementary materials included in this article.
Supplementary Materials
Figure S1. Dot Plot of marker genes. (A) Dot Plot illustrating the expression of marker genes across various cell subsets in epithelial cells from the CvP and the FoP of the mouse tongue. Clusters 8 and 13 are taste cell clusters. The markers corresponding to the cell annotation are presented in Table S9. (B) Dot Plot illustrating the expression of marker genes across various cell subsets in taste cells from the CvP and the FoP of the mouse tongue. Cluster 0 is a Type I taste cell, cluster 1 is a Type IV taste cell, cluster 2 is a Type III taste cell, and cluster 4 is a Type II taste cell. The markers corresponding to the cell annotation are presented in Table S10. Row data from Vercauteren Drubbel and Beck (2023).
Figure S2. Predicting the potential functions of Ccn3+Type III and Ccn3−Type III cell subgroups. (A) GSEA enrichment analysis showing the top ten genes sets enriched in Ccn3+Type III cell subgroups. (B) GSEA enrichment analysis showing the top ten genes sets enriched in Ccn3−Type III cell subgroups. Row data from Vercauteren Drubbel and Beck (2023).
Tables S1–S10.
Data Availability Statement
All data supporting the findings of this study are available from the corresponding author upon request.


