Abstract
Metal–organic frameworks (MOFs) have been identified as promising electrocatalysts for the oxygen evolution reaction (OER). However, most of the reported MOFs have low electrical conductivity and poor stability, and therefore addressing these problems is crucial for achieving higher electrocatalytic performance. Meanwhile, direct observations of the electrocatalytic behavior, which is of great significance to the understanding of the electrocatalytic mechanism, remain highly challenging. Here, we report on a significant electrocatalytic performance enhancement of Co-MOF-74 for the OER after decoration by copper phthalocyanine (CuPc) molecules. Co-MOF-74@CuPc, synthesized by solvothermal reactions, displays a low overpotential of 293 mV and a robust long-term stability (70 h) at 10 mA cm−2. The enhancement has been attributed to strong electronic interaction between the π-conjugated CuPc molecule and Co-MOF-74, which promotes the electron transfer, increases the electrocatalytic active surface area and regulates the electronic structure during the OER process.
The synergistic effect of Co-MOF-74 and CuPc enhances the electrocatalytic oxygen evolution reaction.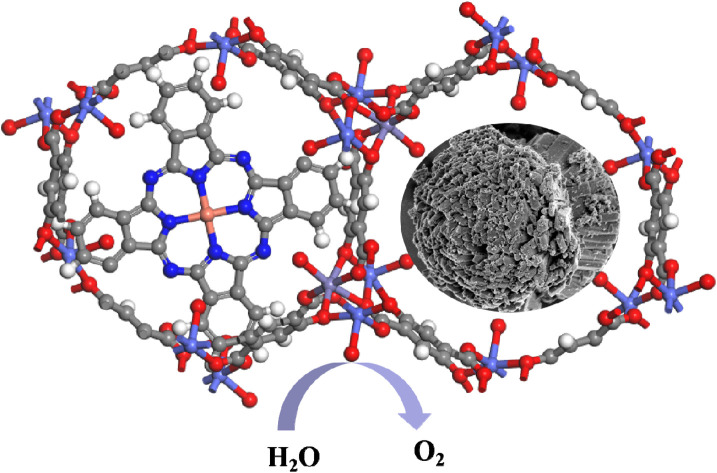
Introduction
With the continuous progress of human society, the contradiction between energy and environment has gradually become the main contradiction of sustainable development. Therefore, the development of clean and renewable energy becomes particularly important.1–3 The electrocatalytic water decomposition system can convert renewable energy such as solar energy and wind energy into clean chemical fuels, thus realizing efficient and sustainable energy conversion and storage. As an important semi-reaction of electrocatalytic water decomposition, the kinetics of the OER at the anode is extremely slow, involving four-electron transfer and multiple reaction intermediates, which becomes the bottleneck restricting the efficiency of electrocatalytic water decomposition. In order to reduce OER overpotential, a good electrocatalyst is essential. Noble metal-based oxides (such as IrO2 and RuO2) are the best OER catalysts known at present, but their small reserves and high price limit their large-scale application.4–6
In recent years, researchers have explored the application of non-noble metal-based catalysts in OER. These catalysts show excellent OER activity. Among them, transition metal organic framework materials are a kind of organic–inorganic hybrid materials formed by self-assembly of organic ligands and transition metal ions or clusters, which have large specific surface area, a large number of monodisperse active centers and adjustable pore structure, and have a good application prospect in the field of electrocatalytic decomposition of water.7–9 However, the oxidation–reduction activity of organic ligands in MOFs is poor, and there is no conjugation channel between metal ions and ligands, which leads to the low conductivity and catalytic activity of most MOFs.10,11 Omar K. Farha's research group embedded NiCB molecules into NU-1000 channel. Because NiCB has strong ability to accept electrons, while MOFs ligand has strong ability to donate electrons, they combine to form a good electron transport path, thus improving the conductivity of the catalyst. Different from NiCB molecule, metal phthalocyanine is a highly delocalized 18 π electron macrocyclic conjugated compound with strong π–π electron interaction.12 It consists of a central cavity surrounded by four indole units. There are nine nitrogen–carbon conjugated double bonds in the cavity. The length of each carbon–carbon bond and carbon–nitrogen bond is almost equal, and the charge density distribution is uniform. Metal phthalocyanines have stable chemical properties, good photoelectric properties and acid and alkali corrosion resistance. However, the π–π structure of metal phthalocyanines makes them easy to reunite, which affects their physical and chemical properties.13 Researchers try to combine metal phthalocyanines with suitable carriers by electrostatic force, physical adsorption, covalent bond or π–π interaction, thus avoiding the agglomeration of metal phthalocyanines and improving the catalytic ability. Tang's group modified CoTAPc on the surface of ZIF-90 by solvothermal reaction to form CoTAPc-ZIF-90 hybrid catalyst. CoTAPc and ZIF-90 are connected in the form of covalent bonds. Experiments have confirmed that CoTAPc-ZIF-90 has high catalytic activity and stability.14
In this work, we developed a facile solvothermal approach for synthesizing copper phthalocyanines decorated Co-MOF-74 (Co-MOF-74/CuPc) as a highly efficient OER electrocatalyst. It was found that CuPc can make Co-MOF-74 produce more active sites and increase the electrochemical active area without changing the structure of Co-MOF-74. At the same time, the synergistic effect between uniformly dispersed CuPc and Co-MOF-74 enhances the electron transport ability and accelerates the reaction kinetics, thus promoting the efficient and rapid oxygen evolution reaction. This work shows promising potentials of MOF-supported π-conjugate molecular electrocatalysis for practical applications in energy conversion technologies and offers profound insights into understanding the fundamental processes of the structural transformation during the OER process.
Experimental
Preparation of Co-MOF-74/CuPc
400 mg Co(NO3)2·6H2O, 4 mg CuPc and 80 mg H4DOBDC were dissolved in a 30.6 mL solution containing 2 mL water, 26.6 mL DMF and 2 mL ethanol to form a homogeneous aqueous solution. Subsequently, the resulting homogeneous solution was transferred to a stainless steel autoclave lined with Teflon and heated at 120 °C for 24 hours. After cooling to room temperature, the precipitate was collected by multiple washing and centrifugation with ethanol and DMF to remove organic residues and dried overnight at 60 °C.
Preparation of Co-MOF-74
100 mg of Co(NO3)2·6H2O and 20 mg of H4DOBDC were dissolved in a 7.65 mL solution containing 0.5 mL water, 0.5 mL ethanol and 6.65 ml DMF. Stir the mixture with a magnetic stirrer until it's evenly distributed. Remove the magnet and seal the lid tightly, then place the glass bottle in a 50 mL water bath, heating it at a rate of 10 °C min−1 until the temperature reaches 120 °C. Keep it there for 24 hours, then let it cool back down to room temperature. Wash the resulting precipitate several times with a solution of DMF, water, and anhydrous ethanol, and finally dry it in a vacuum oven at room temperature for 12 hours.
Preparation of CuPc
Synthesis by two-step method
The first is the synthesis of copper tetranitrophthalocyanine: mix 8070 mg of CuCl2·2H2O, 1080 mg of H2O, 3800 mg of nitrobenzene-2-carboxylic acid, 4800 mg of ammonium chloride, 90 mg of ammonium molybdate, and 5890 mg of urea in a mortar, and grind them into a fine powder. Transfer the powder to a crucible and heat it to 140 °C, maintaining it for 0.5 hours, and then continue to increase the temperature to 220 °C for 4 hours. After cooling to room temperature, dissolve the mixture in 500 ml of 1.0 M hydrochloric acid containing saturated sodium chloride, and boil it. Then, after cooling to room temperature, wash the resulting precipitate with 1.0 M potassium hydroxide containing saturated sodium chloride, until the supernatant is colorless and transparent, and its pH is neutral. Finally, dry the product and store it for later use. Next is the synthesis of copper tetraaminophthalocyanine (that is phthalocyanines, CuPc): 1000 mg coppe tetraaminophthalocyanine was dissolved into DMF, and 4800 mg Na2S·9H2O was added, and stirred continuously at 120 °C for 5 h; then a large amount of water was added to it, and the precipitated product was washed with 750 mL 1.0 mol per L HCl saturated NaCl solution, centrifuged, and the obtained solid product was washed with 500 mL 1.0 mol per L NaOH saturated NaCl solution until pH was neutral. After centrifugation, the obtained black green solid product was washed with deionized water and dried in vacuum.
Results and discussions
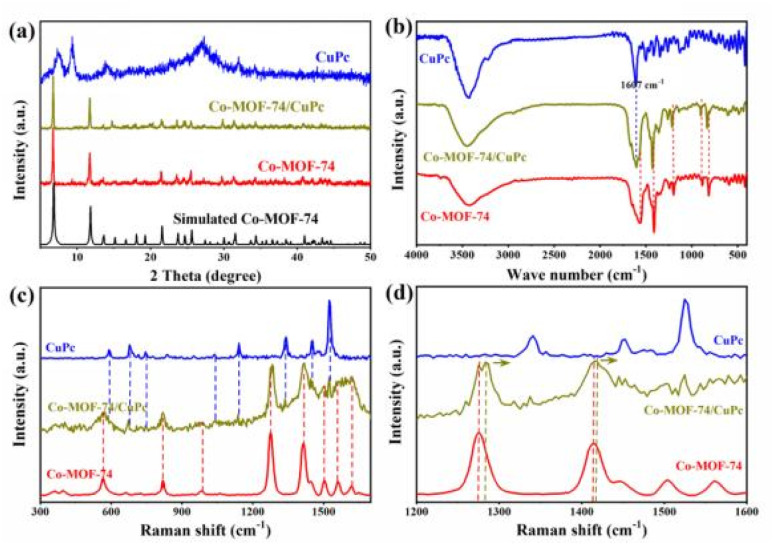
Fig. 1(a) shows the XRD patterns of Co-MOF-74/CuPc, CuPc, Co-MOF-74 and simulated Co-MOF-74. The XRD patterns of Co-MOF-74/CuPc match well with simulated Co-MOF-74, which shows the successful synthesis of MOF-74 structure.15 The XRD spectra of Co-MOF-74/CuPc were consistent with that of Co-MOF-74 after adding CuPc, and there were no other miscellaneous peaks, which indicated that the crystal structure of MOF-74 was not changed by CuPc. The presence of CuPc in the composite can be determined by Fourier transform infrared spectroscopy. As shown in Fig. 1(b), the peak at 1570 cm−1 wave number can be attributed to the stretching vibration of C O, which is mainly due to the carbonyl functional groups contained in the ligand. The peak at 1433 cm−1 wave number can be attributed to the stretching vibration peak of benzene ring C C.16 Pure CuPc has a large π-skeleton characteristic vibration absorption peak at 1607 cm−1 wave number, and also has a large π-skeleton characteristic vibration absorption peak in Fourier transform infrared spectrum of Co-MOF-74/CuPc, which indicates the existence of CuPc in the formed material.17–19Fig. 1(c) shows the Raman spectra of CuPc, Co-MOF-74 and Co-MOF-74/CuPc. For Co-MOF-74, the Raman peaks at 821 cm−1 is assigned to the benzene ring C–H bending modes. The peaks at 561 cm−1 is assigned to the Co–O bond vibration. The ν(COO−) vibration at 1412 cm−1 and the ν(C–O) vibration peak appearing at 1275 cm−1 are derived from the organic linker. The peaks at 1616 and 1562 cm−1 are attributed to the stretching vibrations of the benzene ring within the organic linker of Co-MOF-74.20 For CuPc, the Raman peaks appear at 591, 678, 749, 1040, 1143, 1340, 1455 and 1526 cm−1. The Raman spectrum of Co-MOF-74/CuPc shows characteristic vibrational peaks of both Co-MOF-74 and CoPc.21 However, compared to the Co-MOF-74, the ν(C–O) and ν(COO−) signals of Co-MOF-74/CuPc exhibit a slight blue shift (Fig. 1(d)), indicating a change in the electronic density around the cobalt atom.22,23
Fig. 1. (a) Powder XRD patterns of the simulated Co-MOF-74, Co-MOF-74/CuPc, CuPc and Co-MOF-74. (b) FT-IR patterns of Co-MOF-74/CuPc, CuPc and Co-MOF-74. (c) Raman spectra of CuPc, Co-MOF-74 and Co-MOF-74/CuPc. (d) Enlarged view of the Raman spectra.
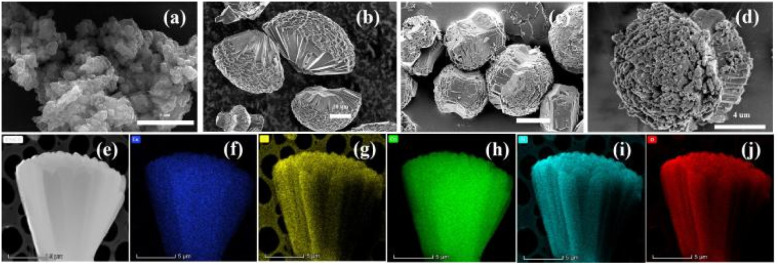
As shown in Fig. 2(a), the copper phthalocyanine is granular, with the particles stacked upon each other. Co-MOF-74 forms fan-shaped clusters composed of micron-sized rods. As shown in Fig. 2(b), the size of these fan-like clusters ranges from 20 to 40 μm, with the rods measuring 10 to 25 μm in length and about 2.5 μm in width. After the addition of copper phthalocyanine, the Co-MOF-74/CuPc exhibits a rod-like cluster morphology (Fig. 2(c and d)). It can be observed from the end of the cluster that the stacking between the bands and rods becomes relatively loose, which can enhanced charge transfer process. TEM-EDS scan and corresponding mapping show that Co, Cu, O, C and N elements are uniformly distributed in Co-MOF-74/CuPc, indicating that CuPc in the four composites is uniformly distributed (as shown in Fig. 2e–j), and there is no uneven aggregation phenomenon. Combined with XRD and Fourier transform infrared data, it can be inferred that CuPc are compacted with MOF in an amorphous manner.
Fig. 2. (a and b) SEM images of CuPc and Co-MOF-74. (c and d) SEM images of Co-MOF-74/CuPc. (e)–(j) HAADF-STEM and mapping images of Co-MOF-74/CuPc. (Cu: blue, Co: green, C: yellow, N: azure, O: red).
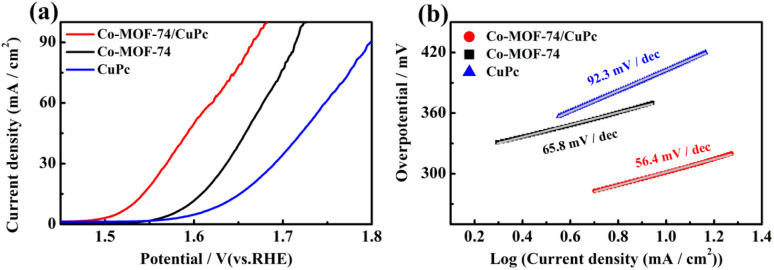
Fig. 3(a) shows the LSV polarization curve and the Tafel slope measured in 1 M KOH electrolyte aqueous solution when the sample is coated on glassy carbon electrode, which is used to evaluate the OER performance of the sample. All tests have reached the standard under reversible hydrogen electrode (RHE) through conversion. Compared with Co-MOF-74 and CuPc, the composite Co-MOF-74/CuPc exhibited the best electrocatalytic activity. The overpotential of Co-MOF-74, CuPc and composite Co-MOF-74/CuPc at the current density of 10 mA cm−2 was 355 mV, 402 mV and 293 mV, respectively. It shows that the addition of CuPc can effectively promote the oxygen evolution performance of Co-MOF-74. At the same time, the Tafel slope of Co-MOF-74, CuPc and composite Co-MOF-74/CuPc was calculated. It can be seen from Fig. 3(b) that Co-MOF-74/CuPc has the smallest Tafel slope of 56.4 mV dec−1, indicating that composite Co-MOF-74/CuPc has higher catalytic reaction kinetics.
Fig. 3. (a) Steady-state polarization curves and (b) Tafel plots of Co-MOF-74/CuPc, Co-MOF-74 and CuPc.
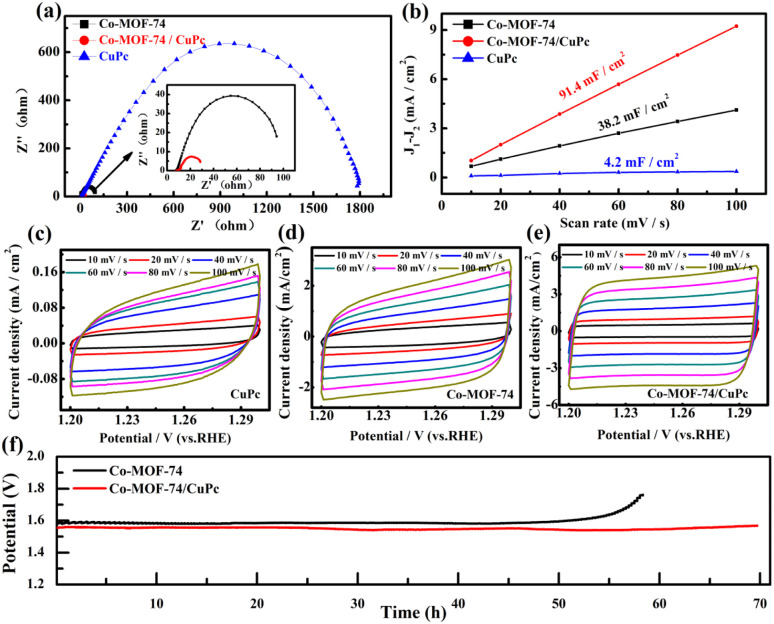
The electrochemical impedance of Co-MOF-74/CuPc, CuPc and Co-MOF-74 were measured experimentally. It can be seen from Fig. 4(a) that the impedance semicircle of the original CuPc is the largest, which shows that the aggregated CuPc is not conducive to electron transport. When the CuPc is modified on Co-MOF-74 to obtain Co-MOF-74/CuPc composite, compared with the original Co-MOF-74 and CuPc, the composite Co-MOF-74/CuPc shows the smallest loop, and the size of loop represents the speed of reaction kinetics. The smaller the loop, the faster the reaction kinetics,24 so the charge transfer of Co-MOF-74/CuPc material is the fastest when oxygen evolution reaction occurs. To some extent, the electrochemical active area can represent the active area of the catalyst in electrochemical reaction, so the OER activity can also be determined by the electrochemical active area of the catalyst. By scanning the cyclic voltammetry curves of Co-MOF-74/CuPc, CuPc and Co-MOF-74 (Fig. 4(c)–(e)), the linear curve of the difference of current density and scanning rate is obtained, and the electric double layer capacitance is obtained. As shown in Fig. 4(b), because the electrochemical active area is proportional to the electric double layer capacitance, the effective electrochemical active area of the catalyst can be evaluated by the electric double layer capacitance (Cdl).25 The electric double layer capacitance of Co-MOF-74/CuPc, CuPc and Co-MOF-74 are 91.4 mF cm−2, 4.2 mF cm−2 and 38.2 mF cm−2, respectively, which indicates that the composite Co-MOF-74/CuPc has larger electrochemical active area. In order to evaluate the catalytic stability of the catalyst, we did a comparative test. As shown in Fig. 4(f), the potential–time curves of Co-MOF-74/CuPc did not change obviously under the electrocatalytic state of 70 hours, which was much better than the original Co-MOF-74. It shows that Co-MOF-74/CuPc composites have excellent stability.
Fig. 4. (a) Nyquist plots of Co-MOF-74, Co-MOF-74/CuPc and CuPc. (b) Difference of current density (Δj = j1 − j2) at 1.25 V vs. RHE as a function of scan rate for Co-MOF-74, Co-MOF-74/CuPc and CuPc. (c)–(e) CV curves for Co-MOF-74, Co-MOF-74/CuPc and CuPc. (f) Chronoamperometric testing of Co-MOF-74 and Co-MOF-74/CuPc.
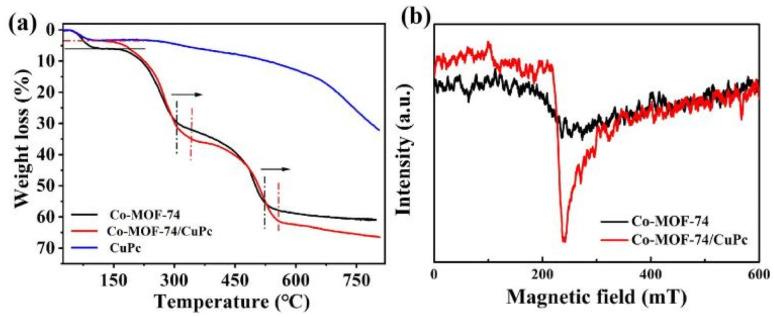
The thermogravimetric analysis of Co-MOF-74, CuPc and Co-MOF-74/CuPc shows that the thermogravimetric curves of Co-MOF-74 and Co-MOF-74/CuPc can be divided into three stages from Fig. 5(a). The thermogravimetric temperature of the first stage is about 100 °C, which is about 6% compared with Co-MOF-74. The thermogravimetric ratio of Co-MOF-74/CuPc is smaller, about 3.5%. This phenomenon shows that Co-MOF-74/CuPc has more unsaturated metal centers than Co-MOF-74. Because the thermogravimetric mass of the first stage can be attributed to the removal of coordination solvent molecules and guest solvent molecules. Therefore, there are fewer coordinating and guest solvent molecules in the three-dimensional pores of Co-MOF-74/CuPc. This further shows that CuPc can promote Co-MOF-74 to produce more unsaturated metal coordination centers, which is beneficial to the electrocatalytic oxygen evolution reaction. The TG temperature of Co-MOF-74/CuPc and Co-MOF-74 in the second stage is 340 °C and 305 °C, respectively. The TG temperature of Co-MOF-74/CuPc and Co-MOF-74 in the third stage is 555 °C and 520 °C, respectively. In the second and third stages, the TG temperature of Co-MOF-74/CuPc is higher than that of Co-MOF-74, which is caused by the strong electronic interaction between Co-MOF-74 and CuPc.26 In Fig. 5(b), Co-MOF-7/CuPc has stronger EPR signal than Co-MOF-74, which further proves that Co-MOF-7/CuPc has more unsaturated coordination centers than the original Co-MOF-74, indicating that CuPc can promote Co-MOF-74 to produce more open metal sites, and these unsaturated metal sites can promote OER performance as catalytic active centers.27
Fig. 5. (a) TG plots of Co-MOF-74, Co-MOF-74/CuPc and CuPc. (b) EPR plots of Co-MOF-74, Co-MOF-74/CuPc and CuPc.
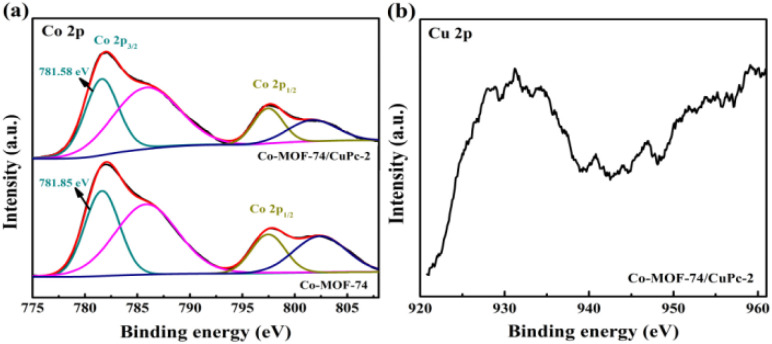
The electronic interaction between CuPc and Co-MOF-74 can also be verified by XPS test. As shown in Fig. 6(a), the fine spectra of Co-MOF-74 and Co-MOF-74/CuPc are Co 2p. For the fine spectra of Co 2p in Co-MOF-74, two groups of peaks, Co 2p3/2 and Co 2p1/2, are fitted. The peaks at 781.85 and 797.44 eV can be attributed to the existence of Co2+, and the sub-peaks at 785.86 and 802.58 eV are corresponding satellite peaks. For the fine spectra of Co 2p in Co-MOF-7/CuPc, two groups of peaks, Co 2p3/2 and Co 2p1/2, are also obtained by fitting. The peaks at 781.58 and 797.57 eV can be attributed to the existence of Co2+,28,29 and the sub-peaks at 785.78 and 801.86 eV are corresponding satellite peaks. After modification of CuPc, the fitting peak at Co 2p3/2 of Co-MOF-7/CuPc shifts slightly to the lower binding energy, which indicates that charge transfer occurs between MOF and CuPc, which is in good agreement with the results of thermogravimetry. Fig. 6(b) is a Cu 2p fine spectrum with weak signal tested to Co-MOF-7/CuPc, which also shows that the amount of CuPc recombined with MOF by electronic interaction is limited regardless of the amount of CuPc added, which echoes the results of LSV test.
Fig. 6. (a) High-resolution spectra of Co 2p for Co-MOF-74 and Co-MOF-74/CuPc. (b) High-resolution spectra of Cu 2p for Co-MOF-74/CuPc.
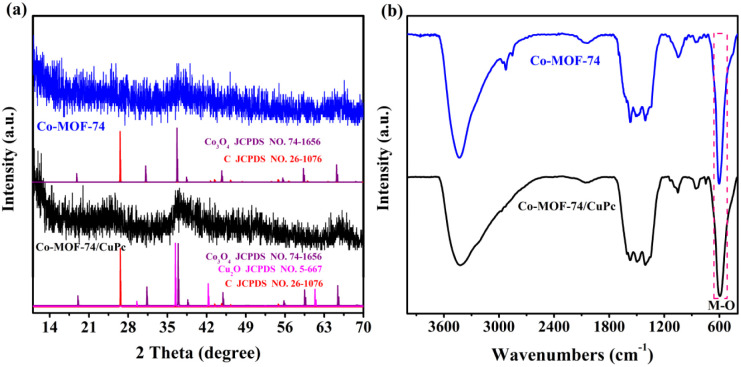
The crystal structures of Co-MOF-74 and Co-MOF-74/CuPc samples after electrochemical reaction were analyzed by XRD. It can be seen from Fig. 7(a) that the crystal phase stability of Co-MOF-74 changed obviously after testing. The diffraction peaks at 2θ of 30.9°, 36.9°, 45.6°, 59.1° and 65.4° can be attributed to Co3O4 (JCPDS No. 74-1656). The diffraction peak of C appears at 2θ of 28.8°, which is caused by the shedding of carbon cloth during the ultrasonic process. Compared with pure Co-MOF-74, the XRD spectra of Co-MOF-74/CuPc after electrochemical reaction show not only the diffraction peaks of Co3O4, but also the diffraction peaks of Cu2O at 2θ of 36.4°, 59.1° and 61.5°, which proves that Co-MOF-74/CuPc is transformed into a complex of Co3O4 and Cu2O in situ after stability test. Fig. 7(b) shows Fourier transform infrared spectra of Co-MOF-74/CuPc and Co-MOF-74 after stability test. It can be seen from the figure that the characteristic vibration peak of functional groups in MOFs disappears in infrared spectrum, and the intensity of vibration peak attributed to M–O at the wavenumber of 591 cm−1 increases, which proves that MOFs transform into oxides after stability test, which is consistent with XRD test results.
Fig. 7. (a) XRD patterns of Co-MOF-74 and Co-MOF-74/CuPc chronoamperometric test. (b) FT-IR spectra of Co-MOF-74 and Co-MOF-74/CuPc chronoamperometric test.
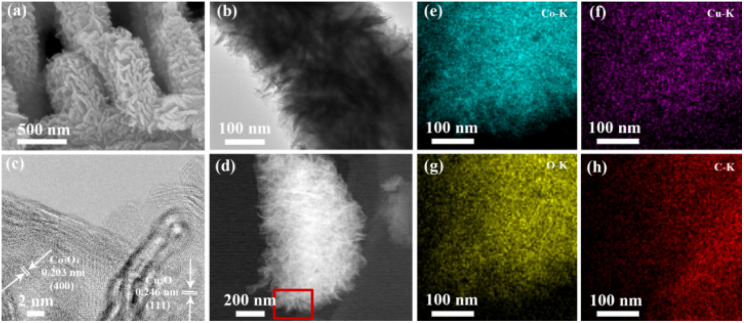
SEM and TEM were used to characterize the morphology of Co-MOF-74/CuPc after stability test, as shown in Fig. 8(a) and (b). After electrochemical test, Co-MOF-74/CuPc changed into nano-sheet morphology, which can increase the specific surface area of the catalyst and facilitate the charge transfer and mass transfer of the catalyst in electrocatalytic water oxidation reaction. High resolution TEM (HRTEM) images show lattice stripes with interlayer distances of 0.203 nm and 0.246 nm, corresponding to the (400) plane of Co3O4 and the (111) plane of Cu2O, respectively (as shown in Fig. 8(c)).30Fig. 8(d)–(h) shows the high-angle annular dark field image and the corresponding element distribution diagram of Co-MOF-74/CuPc composite catalyst after stability test. From the diagram, it can be seen that Co, Cu, O, C and N elements are uniformly distributed, which proves that Co3O4 and Cu2O are uniformly distributed (Fig. 7).
Fig. 8. (a) SEM images of Co-MOF-74/CuPc after chronoamperometric test. (b) TEM images of Co-MOF-74/CuPc after chronoamperometric test. (c) HRTEM images of Co-MOF-74/CuPc after chronoamperometric test. (d)–(h) HAADF and mapping images of Co-MOF-74/CuPc after chronoamperometric test.
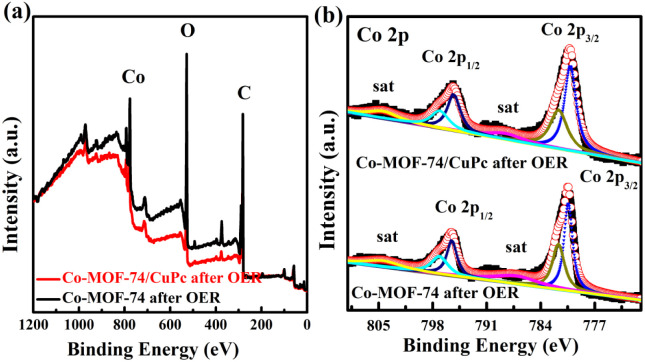
The changes of surface structure and chemical state of Co-MOF-74/CuPc and Co-MOF-74 after electrochemical test were further analyzed by XPS. Fig. 9(a) shows the XPS full spectrum data of Co-MOF-74 and Co-MOF-74/CuPc after stability test. It can be seen from the figure that Co, O and C elements coexist on the surface of the catalyst after stability test. As shown in Fig. 9(b), after stability test, the XPS spectrum of Co-MOF-74/CuPc is fitted to two pairs of related spin orbit peaks, which correspond to Co 2p3/2 (780.20 eV) and Co 2p1/2 (795.47 eV) of Co2+ and Co 2p3/2 (781.46 eV) and Co 2p1/2 (796.94 eV) of Co3+ respectively, while the peaks at 788.46 eV and 804.27 eV belong to satellite peaks. The XPS spectra of Co-MOF-74 are also fitted to two pairs of related spin orbital peaks, which correspond to Co 2p3/2 (780.31 eV) and Co 2p1/2 (795.47 eV) of Co2+, and Co 2p3/2 (781.95 eV) and Co 2p1/2 (797.10 eV) of Co3+, respectively, while the satellite peaks are located at 787.00 eV and 803.95 eV. The Co2+ 2p3/2 XPS peaks of Co-MOF-74/CuPc and Co-MOF-74 both shift to lower binding energies compared with the original MOFs. The reason is that the bond between the organic ligand O atom and the metal atom breaks, which increases the electron cloud density around the metal atom.31 The XPS peak of Co 2p of Co-MOF-74/CuPc after stability test also shifts compared with that of Co-MOF-74, which indicates that there is charge transfer between Co3O4 and Cu2O formed in situ during the water oxidation process of the composite catalyst Co-MOF-74/CuPc.32,33
Fig. 9. (a) The XPS survey spectra of Co-MOF-74 and Co-MOF-74/CuPc after 12 h chronoamperometric test. (b) High-resolution spectra of Co 2p for Co-MOF-74 and Co-MOF-74/CuPc after 12 h chronoamperometric test.
Conclusions
In conclusion, Co-MOF-74/CuPc composite catalyst was prepared by hydrothermal method. XRD and FT-TR characterization showed that the addition of metal phthalocyanine did not affect the crystal structure of Co-MOF-74. ICP-AES characterization shows that the content of metal phthalocyanine in the composite catalyst is very low. XPS and TGA characterization revealed that there was electron interaction between Co-MOF-74 and CuPc. EPR characterization showed that CuPc could induce more active sites in Co-MOF-74. The study of electrochemical performance showed that trace CuPc could promote the electrocatalytic oxygen evolution of Co-MOF-74. The electrochemical measurements showed that compared with Co-MOF-74 and CuPc, the electrochemical impedance of Co-MOF-74/CuPc composite catalysts was the smallest, and the electrochemical active area of Co-MOF-74/CuPc composite catalysts was the largest. Co-MOF-74/CuPc composite catalyst has good stability, and can stabilize oxygen evolution for 70 h. The stabilized samples were characterized by XRD, FT-IR and TEM. It was found that Co-MOF-74/CuPc in situ changed into a nano-sheet Co3O4/Cu2O composite catalyst, and there was charge transfer between Co3O4 and Cu2O, which promoted the oxygen evolution reaction to occur efficiently and stably.
Data availability
The authors confirm that the data supporting the findings of this study are available within the article.
Author contributions
Xiaohua Zhao: data curation, formal analysis, writing – original draft. Jinzhi Jia: investigation, methodology. Haixiong Shi: supervision, validation. Shanshan Li: writing – review & editing. Cailing Xu: conceptualization, funding acquisition, resources, writing – review & editing.
Conflicts of interest
There are no conflicts to declare.
Acknowledgments
Financial support from Lanzhou University of Arts and Science Start-up Foundation for doctoral research (Grant No. 202007), the fund project for Young PhD in Higher Education Institutions of the Gansu Province (Grant No. 2022QB-193), and the authors sincerely thank the Electron Microscopy Centre of Lanzhou University for TEM/SEM measurement.
Notes and references
- Chu S. Majumdar A. Nature. 2012;488:294–303. doi: 10.1038/nature11475. [DOI] [PubMed] [Google Scholar]
- Zhang N. Hu Y. An L. Yan C. H. et al. . Angew. Chem., Int. Ed. 2022;61:e202207217. doi: 10.1002/anie.202207217. [DOI] [PubMed] [Google Scholar]
- Li C. Zhang W. Cao Y. et al. . Adv. Sci. 2024:2401780. doi: 10.1002/advs.202401780. [DOI] [PMC free article] [PubMed] [Google Scholar]
- Yu M. Budiyanto E. Tüysüz H. Angew. Chem., Int. Ed. 2022;61:e202103824. doi: 10.1002/anie.202103824. [DOI] [PMC free article] [PubMed] [Google Scholar]
- Yang H. Driess M. Menezes P. W. Adv. Energy Mater. 2021;11:2102074. [Google Scholar]
- Jia J. Zhang J. Guo K. et al. . J. Energy Chem. 2025;100:77–86. [Google Scholar]
- Miner E. M. Fukushima T. Sheberla D. Sun L. Surendranath Y. Dinca M. Nat. Commun. 2016;7:10942. doi: 10.1038/ncomms10942. [DOI] [PMC free article] [PubMed] [Google Scholar]
- Zhang B. Zheng Y. Ma T. Yang C. Peng Y. Zhou Z. Zhou M. Li S. Wang Y. Cheng C. Adv. Mater. 2021;33:2006042. doi: 10.1002/adma.202006042. [DOI] [PMC free article] [PubMed] [Google Scholar]
- Wang H. Chen B. H. Liu D. J. Adv. Mater. 2021;33:2008023. doi: 10.1002/adma.202008023. [DOI] [PubMed] [Google Scholar]
- Talin A. A. Centrone A. Ford A. C. Foster M. E. Stavila V. Haney P. Allendorf M. D. Science. 2013;343:66–69. doi: 10.1126/science.1246738. [DOI] [PubMed] [Google Scholar]
- Jiang W. Wang J. Jiang Y. et al. . J. Mater. Chem. A. 2023;11:2769–2779. [Google Scholar]
- Goswami S. Ray D. Otake K. Kung C. W. Garibay S. J. Islamoglu T. Atilgan A. Cui Y. Cramer C. J. Farhha O. K. Hupp J. T. Chem. Sci. 2018;9:4477–4482. doi: 10.1039/c8sc00961a. [DOI] [PMC free article] [PubMed] [Google Scholar]
- Li B. Y. Zhang Y. M. Ma D. X. Ma T. L. Shi Z. Ma S. Q. J. Am. Chem. Soc. 2014;136:1202–1205. doi: 10.1021/ja410868r. [DOI] [PubMed] [Google Scholar]
- Tang Z. Yang Z. Zhang X. Long C. Yan S. H. Shi Y. Chang L. CrystEngComm. 2019;22:1619–1624. [Google Scholar]
- Song G. Wang Z. Q. Wang L. Li G. R. Huang M. J. Yin F. X. Chin. J. Catal. 2014;35:185–195. [Google Scholar]
- Lin X. Li X. Li F. J. Mater. Chem. A. 2016;4:6505–6512. [Google Scholar]
- Wang H. Yin F. X. Li G. R. Chen B. H. Wang Z. Q. Int. J. Hydrogen Energy. 2014;39:16179–16186. [Google Scholar]
- Song G. Wang Z. Q. Wang L. Li G. R. Huang M. J. Yin F. X. Chin. J. Catal. 2014;35:185–195. [Google Scholar]
- Odobel F. Zabri H. Inorg. Chem. 2005;44:5600–5611. doi: 10.1021/ic050078m. [DOI] [PubMed] [Google Scholar]
- He C. Zhang Y. Zhang Y. Zhao L. Yuan L.-P. Zhang J. Ma J. Hu J.-S. Angew. Chem., Int. Ed. 2020;59:4914–4919. doi: 10.1002/anie.201916520. [DOI] [PubMed] [Google Scholar]
- Zha Q. Li M. Liu Z. Ni Y. ACS Sustainable Chem. Eng. 2020;8:12025–12035. [Google Scholar]
- Jiang Y. Lu Y. Lv X. Han D. Zhang Q. Niu L. Chen W. ACS Catal. 2013;3:1263–1271. [Google Scholar]
- Lin Q. Guo D. Zhou L. Yang L. Jin H. Li J. Fang G. Chen X. a. Wang S. ACS Nano. 2022;16:15460–15470. doi: 10.1021/acsnano.2c07588. [DOI] [PubMed] [Google Scholar]
- Cui C. Wang J. Luo Z. Wang J. Li C. Li Z. Electrochim. Acta. 2018;273:327–334. [Google Scholar]
- Yin J. Li Y. Lv F. Fan Q. Zhao Y. Q. Zhang Q. Wang W. Cheng F. Xi P. Guo S. ACS Nano. 2017;11:2275–2283. doi: 10.1021/acsnano.7b00417. [DOI] [PubMed] [Google Scholar]
- Ju L. J. Mei J. F. Li Z. Y. Xu S. Fullerenes, Nanotubes Carbon Nanostruct. 2017;25:423–428. [Google Scholar]
- Yan D. F. Dong C. L. Huang Y. C. Zou Y. Q. Xie C. Wang Y. Y. Zhang Y. Q. Liu D. D. Shen S. H. Wang S. Y. J. Mater. Chem. A. 2018;6:805–810. [Google Scholar]
- Zhao X. Pattengale B. Fan D. Zou Z. Zhao Y. Du J. Huang J. Xu C. ACS Energy Lett. 2018;3:2520–2526. [Google Scholar]
- Wang X. Xiao H. Li A. Li Z. Liu S. Zhang Q. Gong Y. Zheng L. Zhu Y. Chen C. Wang D. Peng Q. Gu L. Han X. Li J. Li Y. J. Am. Chem. Soc. 2018;140:15336–15341. doi: 10.1021/jacs.8b08744. [DOI] [PubMed] [Google Scholar]
- Liu X. Xi W. L C. Li X. Shi J. Shen Y. Ding Y. Nano Energy. 2018;44:371–377. [Google Scholar]
- Qian Q. Z. Li Y. P. Liu Y. Yu L. Zhang G. Q. Adv. Mater. 2019;31:1091139–1091147. doi: 10.1002/adma.201901139. [DOI] [PubMed] [Google Scholar]
- Jia J. Huang J. Guo K. Xu C. et al. . Chem. Eng. J. 2024:153195. [Google Scholar]
- Zhang L. Wang J. Jiang K. et al. . Angew. Chem., Int. Ed. 2022;61(51):e202214794. doi: 10.1002/anie.202214794. [DOI] [PubMed] [Google Scholar]
Associated Data
This section collects any data citations, data availability statements, or supplementary materials included in this article.
Data Availability Statement
The authors confirm that the data supporting the findings of this study are available within the article.


