Abstract
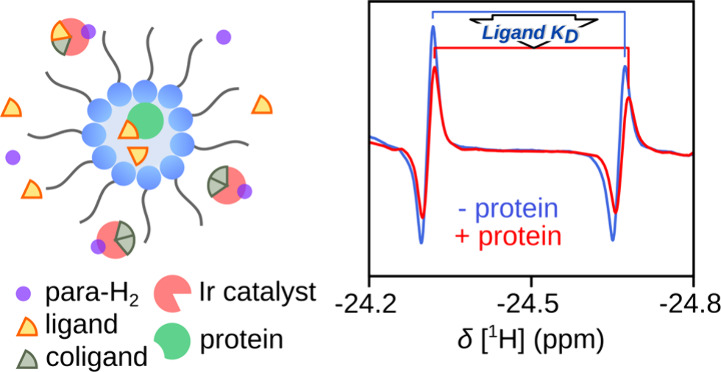
A medium containing reverse micelles supports non-hydrogenative parahydrogen induced polarization (nhPHIP) in the organic phase while solubilizing a protein in the aqueous phase. Strongly enhanced NMR signals from iridium hydride complexes report on a ligand, 4-amino-2-benzylaminopyrimidine, which crosses the phase boundary and interacts with the thiaminase protein TenA. The calculation of binding equilibria reveals a KD of 39.7 ± 8.9 μM for protein binding. The nanoscale separation of the two phases allows the separate optimization of the parahydrogen polarization and solubilization of a biological macromolecule. The reverse micelles may be used to study other biological questions using signal enhancement by parahydrogen polarization, such as enzyme reactions, protein–protein interactions, and protein binding epitopes.
Nuclear spin hyperpolarization is enabling nontraditional applications of NMR spectroscopy: at lower concentration, in lower magnetic fields, at faster time scale, and in less pure samples. Parahydrogen induced polarization (PHIP) through hydrogenative or non-hydrogenative mechanisms has biochemical and biomedical applications including the elucidation of metabolism and magnetic resonance imaging.1−3 The non-hydrogenative signal amplification by reversible exchange (SABRE)4 technique enhances NMR signals without requiring chemical modifications.5−7 SABRE lends itself to the hyperpolarization of ligand molecules for measuring biomacromolecular interactions,8−10 along with a growing toolkit that also includes dynamic nuclear polarization,11−13 hyperpolarized water,14 and chemically induced dynamic nuclear polarization.15 The requirement for water as a solvent for biological molecules has posed challenges for parahydrogen polarization. Although water-soluble polarization transfer complexes exist to support SABRE or non-hydrogenative PHIP (nhPHIP),16 the most widely applied iridium complexes show the highest efficiency in organic solvents.
We demonstrate that a nanometer-scale dispersion of the polarization complex and protein components in a two-phase system allows parahydrogen polarization by incorporating organic solvent conditions for polarization generation simultaneously with an aqueous phase for protein solubilization (Figure 1). The organic solvent encapsulates the water droplets in reverse micelles.
Figure 1.
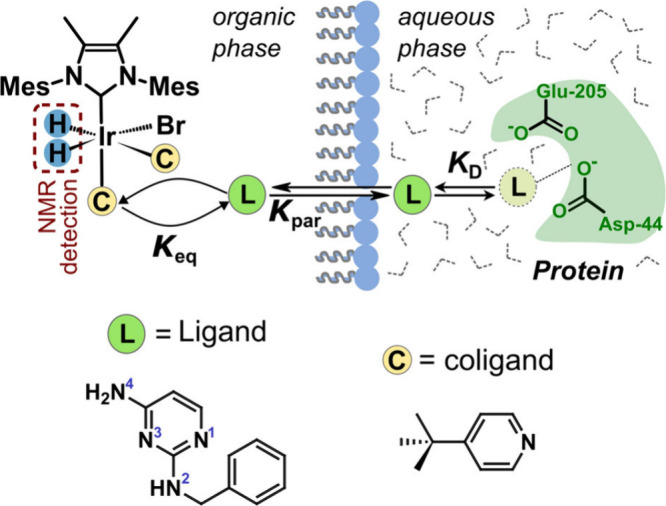
Detection of a protein–ligand interaction in reverse micelles using iridium complexes as nhPHIP sensors. Three solution equilibria are described by Keq, Kpar, and KD. The iridium complexes and hydrogen molecules are dominantly dissolved in the organic phase. Proteins are encapsulated in the aqueous phase. The ligand can traverse the surfactant interface to interact with the protein or iridium.
Reverse micelles have previously been exploited to improve protein structure analysis by NMR.17−20 Here, we measure the strongly enhanced hydride peaks of the iridium-ligand complex, instead of protein signals. The ligand molecule is in equilibrium between the organic and aqueous phases and can bind to the protein or iridium complex. The latter acts as a hyperpolarized chemosensor for detecting the presence of the ligand. In other chemosensing applications of nhPHIP, iridium hydride signals allowed detecting micromolar or submicromolar concentrations of small-molecule analytes.21−24
The 4-amino-2-benzylaminopyrimidine (ABAP; L) serves as the ligand (Figures 1, S1, S2). This molecule possesses a 2,4-diaminopyrimidine moiety that resembles the pyrimidine of thiamine and dihydrofolate reductase inhibitors.25 It binds to the 27 kDa thiaminase II (TenA), a bacterial enzyme that metabolizes thiamine, which plays a critical role in cell development and function.26
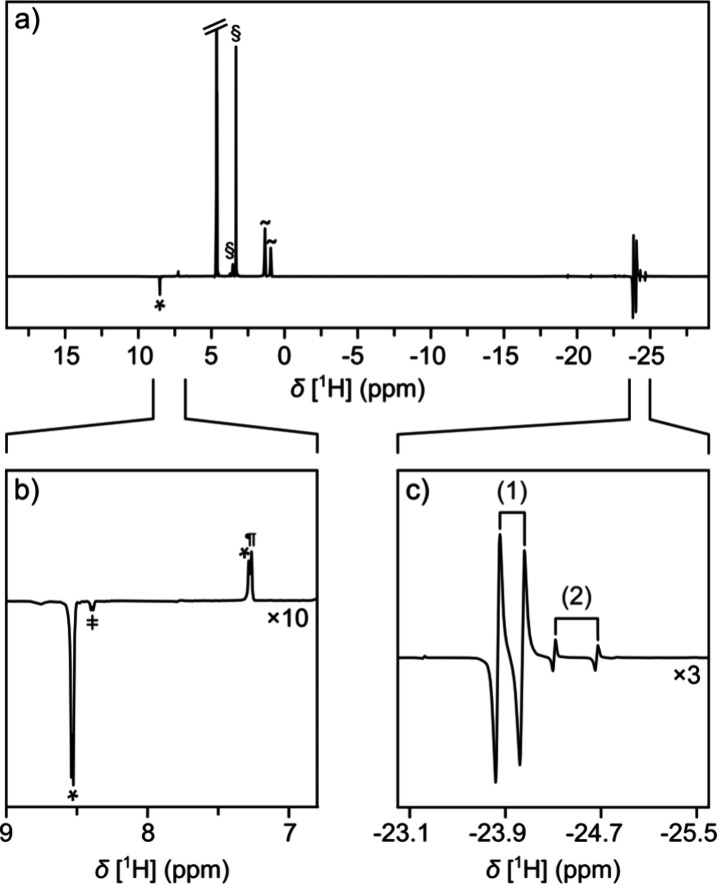
An nhPHIP spectrum of a reverse micelle mixture containing this ligand and a coligand for the polarization complex, 4-tert-butylpyridine, under equilibrium conditions, is shown in Figure 2. The ortho protons of the coligand at 8.55 ppm are enhanced 9-fold (Figures 2b and S3). Hyperpolarized signals from the ligand are not visible. The presence of the catalyst-bound ligand instead is identified through the hydride signals between −23 and −25 ppm (Figure 2c). A signal enhancement of three magnitudes (Supporting Information) is in part facilitated by the increased solubility of hydrogen in the organic solvent.
Figure 2.
(a) Spectrum of a reverse micelle mixture measured with nhPHIP hyperpolarization. The mixture contains 100 mM cetrimonium bromide (CTAB), 100 μM ABAP ligand, 10 mM 4-tert-butylpyridine as coligand, and 500 μM [IrCl(COD)(MeIMes)] (MeIMes = 1,3-bis(2,4,6-trimethylphenyl)-4,5-dimethylimidazole-2-ylidene) in 1:1 (v/v) chloroform:heptane and 3.1% (v/v) of 50 mM Tris buffer, pH 8.0. Signals are of heptane (∼, suppressed), CTAB (§), water (4.65 ppm), and orthohydrogen (4.62 ppm; truncated). (b) Enlarged region showing the unbound coligand (*), metal-bound coligand (‡), and residual CDCl3 (¶) proton signals. (c) Enlarged region showing iridium hydrides of complexes (1) and (2).
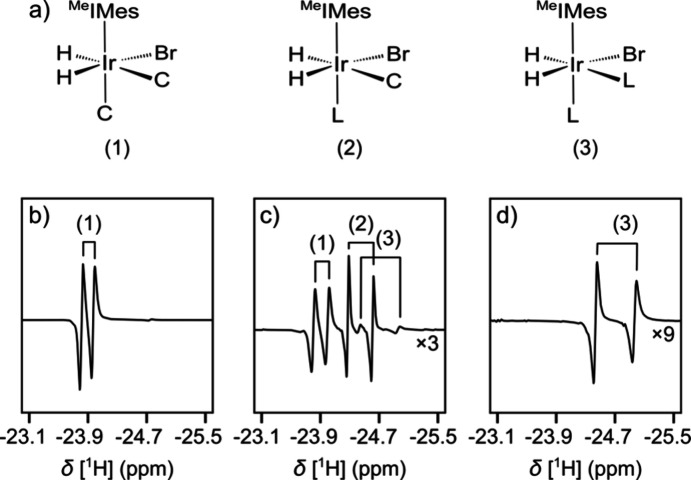
Two major complexes exist in the solution (Figure 2c). The assignments of the signals are deduced from the chemical shifts of reference mixtures and from mass spectrometry (MS) (Figures 3, S4–S8). A mixture containing a coligand without a ligand results in complex (1) (Figure 3b). This complex is one of the main components in the mixture with the ligand (Figure 3c). When only the ligand is present, complex (3) is formed (Figure 3d). These signals are visible as minor components in the mixture of Figure 3c. The remaining signals in Figure 3c are attributed to complex (2), which contains both a ligand and a coligand. The isotope distributions in MS indicate the presence of bromide in all major complexes. Bromide stems from the cetrimonium bromide (CTAB) that is forming the reverse micelles and is known to complex with iridium.27,28 Additionally, iridium dimers were identified in MS, which may have formed during solvent evaporation (Figure S8). The hydride region in the NMR spectra in Figure 2 contains large signals only for complexes (1) and (2), indicating that other species, including dimers, are not significantly populated in the solution. The formation of the complexes can be observed as a function of time after the sample is pressurized with parahydrogen (Figure S9). The time dependence follows a typical activation behavior observed for SABRE catalysts.29
Figure 3.
(a) Structures of iridium complexes (1)–(3), comprising ligand L and coligand C. (b) Hydride region of the NMR spectrum of 500 μM Ir(MeIMes)Cl(COD) and 10 mM coligand in reverse micelles. (c) Spectrum of a mixture as in (b), additionally containing 1 mM ligand. (d) Spectrum as in (c), in the absence of a coligand. Numbers identify the complexes in the spectra.
The fact that no SABRE enhancement was observed for the ABAP ligand, while a 9-fold enhancement was detected for the coligand, suggests that ABAP binds in the axial position of the octahedral complex, where polarization is generally not observed.30 This binding mode is consistent with the higher steric hindrance at the trans sites, which may not accommodate the bulk of the ABAP ligand. Likely, N1 of ABAP is binding to iridium, with N3 being more hindered due to two ortho amino groups.
A spectrum of a reverse micelle solution with protein is shown in Figure S10 for comparison with Figure 2. A difference in the relative intensity of the iridium hydride signals from complexes (1) and (2) is observed with and without TenA protein (Figures 4a–d and S11, S12, Tables S1, S2). This change is due to a shift in the equilibrium of the ABAP ligand partitioning in the aqueous and organic phases when the ligand is binding to the protein. It is quantified by the signal ratios RH in Figures 4e,f. In the data set shown, this ratio reduces from RH = 0.0313 to RH = 0.0215 upon addition of the protein.
Figure 4.
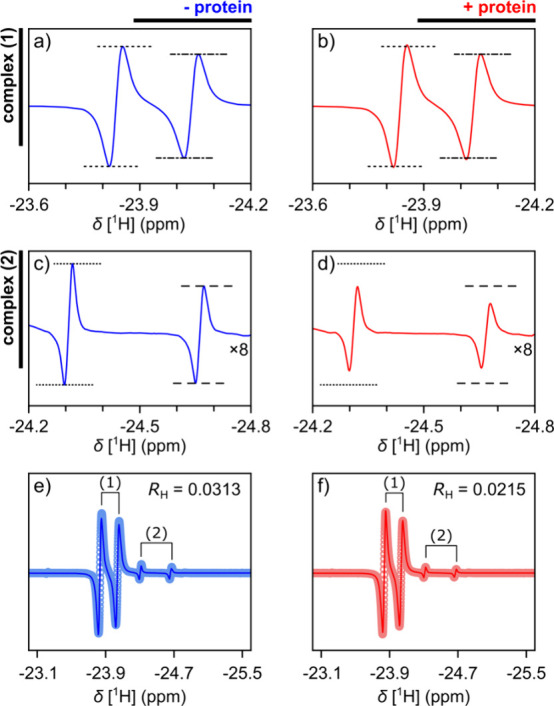
(a–d) nhPHIP signals of complexes (1) and (2) in the absence and presence of an overall 102 μM TenA protein. Horizontal lines are drawn at equal positions to compare the signal intensities. (e, f) Fitted Lorentzian functions (−) and data points of the spectra (○) in the absence and presence of protein. The ratios of the fitted signal integrals from complex (2) divided by complex (1) are indicated as RH. (a), (c), (e) and (b), (d), (f) are from the same spectrum, respectively.
The reverse micelles exhibited a diameter of 10 nm (Figure S13 and Table S3) and constituted 3.1% of the sample volume. The 100 mM CTAB is above the critical micelle concentration of 40 mM reported in a similar solution.31,32
In the following, the calculation of the protein–ligand binding affinity is demonstrated from a quantitative analysis of the change in the concentration ratio of the two complexes in the organic phase,
| 1 |
The resulting equations allow the determination of the dissociation constant KD for the protein and ligand based on the assumption that the concentration ratio is equal to the ratio RH of signal integrals. This assumption would be generally accepted in conventional NMR spectra but is not trivial here because of the possibility of differing hyperpolarization efficiencies and relaxation effects. The validity of the assumption is further substantiated below.
We consider three equilibrium processes based on Figure 1,
| 2 |
| 3 |
| 4 |
which include the ligand L, coligand C, complex (1) as IrC2, complex (2) as IrCL, the protein P, and the protein–ligand complex PL. Subscripts indicate unbound, i.e., free species (f), and location in aqueous (aq) or organic (org) phases.
Using the equilibrium equations, first, Keq can be calculated from RH measured without protein (eq S18). The partition coefficient Kpar = 0.216 ± 0.028 is separately determined (eq S29). Second, with knowledge of Keq, the KD can be found from the corresponding RH measured with protein (eqs S20–S22, S8). Based on the shift of the equilibrium, the calculation of KD requires only two data sets, measured with and without protein. A titration that would be employed with parameters such as R2 relaxation or chemical shift, which have an unknown end point, is not required.
In three sets of the two experiments, mean RH values are 0.0297 ± 0.0005 and 0.0216 ± 0.0002 in the absence and presence of TenA protein, respectively (Tables S1, S2). The significant decrease in the measured values upon the addition of protein forms the basis for the calculation of KD. The standard deviations of RH obtained for each sample are 3% or less, indicating the reproducibility of the NMR measurement and Lorentzian fitting. The results lead to a Keq value of 3.16 ± 0.29 for the binding of a ligand to the iridium catalyst complex. By including the data measured with protein, the KD of the ABAP ligand binding to TenA is found as 39.7 ± 8.9 μM. This result is from Monte Carlo simulations (Figures S14, S15, Table S4). The KD value is in excellent agreement with 39.8 ± 6.9 μM obtained from a titration of TenA with ABAP (Figures S16, S17). Simulations of the binding equilibria indicate that the range of KD values to which the experiment is sensitive depends on Kpar (Figure S18), pointing to a mechanism for optimizing the experiment for different protein–ligand systems.
The dependence of RH on the ligand concentration is seen in a control titration using the same setup (Figures S19, S20, Tables S5, S6). The Keq = 3.15 ± 0.05 fitted from the titration (eq S26) agrees within error ranges with the values from the experiment (Table S4). The self-consistency of the data at multiple concentrations shown in the titration supports the above assumption that the signal ratios can be used for the concentration ratios in the analysis.
The use of the ratio of hydride signals of complexes (2) to (1), rather than signals of complex (2) alone, increases the accuracy. The amplitudes of complexes (1) and (2) fluctuated by 13–16% in the reference titration (Table S5). Contributing factors may include the flow rate and pressure of hydrogen. Conversely, the spread of the corresponding RH values is only ∼5% (Table S6).
The micromolar range concentration of the ligand demonstrates the benefits of nhPHIP in reducing the limit of detection. At a ligand concentration of 1 μM, resulting in 0.12 μM complex (2), the signals of the complex are still observable in a single scan in the 400 MHz NMR spectrometer (Figure S21). These concentrations compare favorably to typical ranges of 25–100 μM in ligand binding studies using conventional NMR, which employs signal averaging.33 The nhPHIP experiments were performed in a single scan but would also be compatible with signal averaging to increase the signal-to-noise ratio.
The determination of the dissociation constant of a protein and ligand is demonstrated as one application of nhPHIP in a two-phase reverse micelle system. The experiment foremost requires a ligand that is soluble in both phases and exhibits an observable change in the experimentally obtained RH when the protein is added. These changes can be tuned by choosing a suitable coligand34 or catalyst.35 A purpose-designed ligand with the required properties could further be used as a reporter for the screening of other putative ligands to the protein in a binding competition.10
The nhPHIP experiment is a new option for the detection of KD using spin hyperpolarization, alongside methods such as D-DNP36 and photo-CIDNP.15 Similar to photo-CIDNP, it makes use of a single-pot reaction mixture, where scans, in principle, can be repeated for signal averaging.
Reverse micelles with nhPHIP could be exploited for other biological applications. Iridium sensors may be used to probe biological products of enzymatic reactions. The expected submicromolar sensitivity approaches that of UV methods, but NMR chemical shifts also differentiate individual products with similar structures. Another range of applications can be based on direct observation of hyperpolarized molecules. A ligand hyperpolarized by SABRE in the organic phase can diffuse to the aqueous phase, where its interaction with a protein can be observed. To hyperpolarize the ligand, the iridium complexes should be optimized for the required complex lifetime.
A hyperpolarized ligand would further transfer its polarization to a protein via cross relaxation, potentially enabling studies of the protein binding epitope structure or protein–protein interactions. The quality of protein spectra would further benefit from the lowered rotational correlation time (τc) of the macromolecules in the reverse micelles.17
In conclusion, we demonstrated that the nanoscale dispersion in a CTAB/chloroform/heptane reverse micelle system can solubilize an iridium catalyst for parahydrogen polarization in its organic phase and encapsulate a protein in the aqueous phase. A ligand for the protein can partition between the phases and interact with both the catalyst and the protein. The comparison of iridium hydride signals between the experiments with and without the protein allows an accurate determination of the binding affinity of the ligand. Other applications may further involve polarization transfer to the aqueous phase of the reverse micelles.
Acknowledgments
Financial support from the National Science Foundation (Grant CHE-1900406) and the Welch Foundation (Grant A-1658) is gratefully acknowledged. We thank Prof. Tadhg Begley for providing the plasmid to express TenA.
Supporting Information Available
The Supporting Information is available free of charge at https://pubs.acs.org/doi/10.1021/jacs.4c13177.
Experimental procedure, synthesis, and characterization of 4-amino-2-benzylaminopyrimidine, identification of iridium complexes, data fitting, activation of precatalysts, effect of protein on the hydride signals, ligand binding experiments, dynamic light scattering measurements, equilibrium calculations, enzymatic assay, simulation of change in RH values, dependence of hydride signal intensity on ligand concentration, detection limit, determination of organic/aqueous partition coefficient Kpar, protein expression and purification (PDF)
Author Contributions
P.P. and O.B. contributed equally to the work.
The authors declare no competing financial interest.
Supplementary Material
References
- Reineri F.; Cavallari E.; Carrera C.; Aime S. Hydrogenative-PHIP Polarized Metabolites for Biological Studies. Magn. Reson. Mater. Phys. Biol. Med. 2021, 34 (1), 25–47. 10.1007/s10334-020-00904-x. [DOI] [PMC free article] [PubMed] [Google Scholar]
- Chekmenev E. Y.; Hövener J.; Norton V. A.; Harris K.; Batchelder L. S.; Bhattacharya P.; Ross B. D.; Weitekamp D. P. PASADENA Hyperpolarization of Succinic Acid for MRI and NMR Spectroscopy. J. Am. Chem. Soc. 2008, 130 (13), 4212–4213. 10.1021/ja7101218. [DOI] [PMC free article] [PubMed] [Google Scholar]
- Schmidt A. B.; Bowers C. R.; Buckenmaier K.; Chekmenev E. Y.; de Maissin H.; Eills J.; Ellermann F.; Glöggler S.; Gordon J. W.; Knecht S.; Koptyug I. V.; Kuhn J.; Pravdivtsev A. N.; Reineri F.; Theis T.; Them K.; Hövener J.-B. Instrumentation for Hydrogenative Parahydrogen-Based Hyperpolarization Techniques. Anal. Chem. 2022, 94 (1), 479–502. 10.1021/acs.analchem.1c04863. [DOI] [PMC free article] [PubMed] [Google Scholar]
- Adams R. W.; Aguilar J. A.; Atkinson K. D.; Cowley M. J.; Elliott P. I. P.; Duckett S. B.; Green G. G. R.; Khazal I. G.; Lopez-Serrano J.; Williamson D. C. Reversible Interactions with Para-Hydrogen Enhance NMR Sensitivity by Polarization Transfer. Science 2009, 323 (5922), 1708–1711. 10.1126/science.1168877. [DOI] [PubMed] [Google Scholar]
- Truong M. L.; Theis T.; Coffey A. M.; Shchepin R. V.; Waddell K. W.; Shi F.; Goodson B. M.; Warren W. S.; Chekmenev E. Y. 15N Hyperpolarization by Reversible Exchange Using SABRE-SHEATH. J. Phys. Chem. C 2015, 119 (16), 8786–8797. 10.1021/acs.jpcc.5b01799. [DOI] [PMC free article] [PubMed] [Google Scholar]
- Shchepin R. V.; Goodson B. M.; Theis T.; Warren W. S.; Chekmenev E. Y. Toward Hyperpolarized 19F Molecular Imaging via Reversible Exchange with Parahydrogen. ChemPhysChem 2017, 18 (15), 1961–1965. 10.1002/cphc.201700594. [DOI] [PubMed] [Google Scholar]
- Iali W.; Rayner P. J.; Alshehri A.; Holmes A. J.; Ruddlesden A. J.; Duckett S. B. Direct and Indirect Hyperpolarisation of Amines Using Parahydrogen. Chem. Sci. 2018, 9 (15), 3677–3684. 10.1039/C8SC00526E. [DOI] [PMC free article] [PubMed] [Google Scholar]
- Mandal R.; Pham P.; Hilty C. Screening of Protein-Ligand Binding Using a SABRE Hyperpolarized Reporter. Anal. Chem. 2022, 94 (32), 11375–11381. 10.1021/acs.analchem.2c02250. [DOI] [PubMed] [Google Scholar]
- Mandal R.; Pham P.; Hilty C. Characterization of Protein-Ligand Interactions by SABRE. Chem. Sci. 2021, 12 (39), 12950–12958. 10.1039/D1SC03404A. [DOI] [PMC free article] [PubMed] [Google Scholar]
- Pham P.; Hilty C. Biomolecular Interactions Studied by Low-Field NMR Using SABRE Hyperpolarization. Chem. Sci. 2023, 14 (37), 10258–10263. 10.1039/D3SC02365F. [DOI] [PMC free article] [PubMed] [Google Scholar]
- Kim Y.; Hilty C. Affinity Screening Using Competitive Binding with Fluorine-19 Hyperpolarized Ligands. Angew. Chem., Int. Ed. 2015, 54 (16), 4941–4944. 10.1002/anie.201411424. [DOI] [PMC free article] [PubMed] [Google Scholar]
- Qi C.; Mankinen O.; Telkki V.-V.; Hilty C. Measuring Protein-Ligand Binding by Hyperpolarized Ultrafast NMR. J. Am. Chem. Soc. 2024, 146 (8), 5063–5066. 10.1021/jacs.3c14359. [DOI] [PMC free article] [PubMed] [Google Scholar]
- Lerche M. H.; Meier S.; Jensen P. R.; Baumann H.; Petersen B. O.; Karlsson M.; Duus J. Ø.; Ardenkjær-Larsen J. H. Study of Molecular Interactions with 13C DNP-NMR. J. Magn. Reson. 2010, 203 (1), 52–56. 10.1016/j.jmr.2009.11.020. [DOI] [PubMed] [Google Scholar]
- Pradhan N.; Hilty C. Cross-Polarization of Insensitive Nuclei from Water Protons for Detection of Protein-Ligand Binding. J. Am. Chem. Soc. 2024, 146 (36), 24754–24758. 10.1021/jacs.4c08241. [DOI] [PMC free article] [PubMed] [Google Scholar]
- Bütikofer M.; Stadler G. R.; Kadavath H.; Cadalbert R.; Torres F.; Riek R. Rapid Protein-Ligand Affinity Determination by Photoinduced Hyperpolarized NMR. J. Am. Chem. Soc. 2024, 146 (26), 17974–17985. 10.1021/jacs.4c04000. [DOI] [PMC free article] [PubMed] [Google Scholar]
- Shi F.; He P.; Best Q. A.; Groome K.; Truong M. L.; Coffey A. M.; Zimay G.; Shchepin R. V.; Waddell K. W.; Chekmenev E. Y.; Goodson B. M. Aqueous NMR Signal Enhancement by Reversible Exchange in a Single Step Using Water-Soluble Catalysts. J. Phys. Chem. C 2016, 120 (22), 12149–12156. 10.1021/acs.jpcc.6b04484. [DOI] [PMC free article] [PubMed] [Google Scholar]
- Nucci N. V.; Valentine K. G.; Wand A. J. High-Resolution NMR Spectroscopy of Encapsulated Proteins Dissolved in Low-Viscosity Fluids. J. Magn. Reson. 2014, 241, 137–147. 10.1016/j.jmr.2013.10.006. [DOI] [PMC free article] [PubMed] [Google Scholar]
- Peterson R. W.; Lefebvre B. G.; Wand A. J. High-Resolution NMR Studies of Encapsulated Proteins in Liquid Ethane. J. Am. Chem. Soc. 2005, 127 (29), 10176–10177. 10.1021/ja0526517. [DOI] [PMC free article] [PubMed] [Google Scholar]
- Gaemers S.; Elsevier C. J.; Bax A. NMR of Biomolecules in Low Viscosity, Liquid CO2. Chem. Phys. Lett. 1999, 301 (1), 138–144. 10.1016/S0009-2614(99)00012-3. [DOI] [Google Scholar]
- Dodevski I.; Nucci N. V.; Valentine K. G.; Sidhu G. K.; O’Brien E. S.; Pardi A.; Wand A. J. Optimized Reverse Micelle Surfactant System for High-Resolution NMR Spectroscopy of Encapsulated Proteins and Nucleic Acids Dissolved in Low Viscosity Fluids. J. Am. Chem. Soc. 2014, 136 (9), 3465–3474. 10.1021/ja410716w. [DOI] [PMC free article] [PubMed] [Google Scholar]
- Eshuis N.; van Weerdenburg B. J. A.; Feiters M. C.; Rutjes F. P. J. T.; Wijmenga S. S.; Tessari M. Quantitative Trace Analysis of Complex Mixtures Using SABRE Hyperpolarization. Angew. Chem., Int. Ed. 2015, 54 (5), 1481–1484. 10.1002/anie.201409795. [DOI] [PubMed] [Google Scholar]
- Eshuis N.; Hermkens N.; van Weerdenburg B. J. A.; Feiters M. C.; Rutjes F. P. J. T.; Wijmenga S. S.; Tessari M. Toward Nanomolar Detection by NMR Through SABRE Hyperpolarization. J. Am. Chem. Soc. 2014, 136 (7), 2695–2698. 10.1021/ja412994k. [DOI] [PubMed] [Google Scholar]
- Sellies L.; Aspers R. L. E. G.; Feiters M. C.; Rutjes F. P. J. T.; Tessari M. Parahydrogen Hyperpolarization Allows Direct NMR Detection of α-Amino Acids in Complex (Bio)Mixtures. Angew. Chem., Int. Ed. 2021, 60 (52), 26954–26959. 10.1002/anie.202109588. [DOI] [PMC free article] [PubMed] [Google Scholar]
- Hermkens N. K. J.; Eshuis N.; van Weerdenburg B. J. A.; Feiters M. C.; Rutjes F. P. J. T.; Wijmenga S. S.; Tessari M. NMR-Based Chemosensing via p -H 2 Hyperpolarization: Application to Natural Extracts. Anal. Chem. 2016, 88 (6), 3406–3412. 10.1021/acs.analchem.6b00184. [DOI] [PubMed] [Google Scholar]
- Raimondi M. V.; Randazzo O.; La Franca M.; Barone G.; Vignoni E.; Rossi D.; Collina S. DHFR Inhibitors: Reading the Past for Discovering Novel Anticancer Agents. Molecules 2019, 24 (6), 1140. 10.3390/molecules24061140. [DOI] [PMC free article] [PubMed] [Google Scholar]
- Toms A. V.; Haas A. L.; Park J.-H.; Begley T. P.; Ealick S. E. Structural Characterization of the Regulatory Proteins TenA and TenI from Bacillus Subtilis and Identification of TenA as a Thiaminase II. Biochemistry 2005, 44 (7), 2319–2329. 10.1021/bi0478648. [DOI] [PubMed] [Google Scholar]
- Wang C.; Jiang Y.-Y. Theoretical Study on Abnormal Trans-Effect of Chloride, Bromide and Iodide Ligands in Iridium Complexes. Comput. Theor. Chem. 2018, 1138, 1–6. 10.1016/j.comptc.2018.05.015. [DOI] [Google Scholar]
- Liu Z.; Zhang S.-W.; Zhang M.; Wu C.; Li W.; Wu Y.; Yang C.; Kang F.; Meng H.; Wei G. Highly Efficient Phosphorescent Blue-Emitting [3 + 2+1] Coordinated Iridium (III) Complex for OLED Application. Front. Chem. 2021, 9, 758357. 10.3389/fchem.2021.758357. [DOI] [PMC free article] [PubMed] [Google Scholar]
- Mandal R.; Pham P.; Hilty C. Nuclear Spin Hyperpolarization of NH2- and CH3-Substituted Pyridine and Pyrimidine Moieties by SABRE. ChemPhysChem 2020, 21 (19), 2166–2172. 10.1002/cphc.202000483. [DOI] [PubMed] [Google Scholar]
- Mewis R. E.; Green R. A.; Cockett M. C. R.; Cowley M. J.; Duckett S. B.; Green G. G. R.; John R. O.; Rayner P. J.; Williamson D. C. Strategies for the Hyperpolarization of Acetonitrile and Related Ligands by SABRE. J. Phys. Chem. B 2015, 119 (4), 1416–1424. 10.1021/jp511492q. [DOI] [PMC free article] [PubMed] [Google Scholar]
- Klíčová L.; Šebej P.; Štacko P.; Filippov S. K.; Bogomolova A.; Padilla M.; Klán P. CTAB/Water/Chloroform Reverse Micelles: A Closed or Open Association Model?. Langmuir 2012, 28 (43), 15185–15192. 10.1021/la303245e. [DOI] [PubMed] [Google Scholar]
- Lang J.; Mascolo G.; Zana R.; Luisi P. L. Structure and Dynamics of Cetyltrimethylammonium Bromide Water-in-Oil Microemulsions. J. Phys. Chem. 1990, 94 (7), 3069–3074. 10.1021/j100370a060. [DOI] [Google Scholar]
- Gossert A. D.; Jahnke W. NMR in Drug Discovery: A Practical Guide to Identification and Validation of Ligands Interacting with Biological Macromolecules. Prog. Nucl. Magn. Reson. Spectrosc. 2016, 97, 82–125. 10.1016/j.pnmrs.2016.09.001. [DOI] [PubMed] [Google Scholar]
- Fekete M.; Rayner P. J.; Green G. G. R.; Duckett S. B. Harnessing Polarisation Transfer to Indazole and Imidazole through Signal Amplification by Reversible Exchange to Improve Their NMR Detectability. Magn. Reson. Chem. 2017, 55 (10), 944–957. 10.1002/mrc.4607. [DOI] [PMC free article] [PubMed] [Google Scholar]
- Pham P.; Hilty C. Tunable Iridium Catalyst Designs with Bidentate N-Heterocyclic Carbene Ligands for SABRE Hyperpolarization of Sterically Hindered Substrates. Chem. Commun. 2020, 56 (98), 15466–15469. 10.1039/D0CC06840C. [DOI] [PubMed] [Google Scholar]
- Kim Y.; Liu M.; Hilty C. Parallelized Ligand Screening Using Dissolution Dynamic Nuclear Polarization. Anal. Chem. 2016, 88 (22), 11178–11183. 10.1021/acs.analchem.6b03382. [DOI] [PMC free article] [PubMed] [Google Scholar]
Associated Data
This section collects any data citations, data availability statements, or supplementary materials included in this article.


