Abstract
Hydroxyacetone (HA) is an atmospheric oxidation product of isoprene and other organic precursors that can form brown carbon (BrC). Measured bulk aqueous-phase reaction rates of HA with ammonium sulfate, methylamine, and glycine suggest that these reactions cannot compete with aqueous-phase hydroxyl radical oxidation. In cloud chamber photooxidation experiments with either gaseous or particulate HA in the presence of the same N-containing species, BrC formation was minor, with similar mass absorption coefficients at 365 nm (<0.05 m2 g–1). However, rapid changes observed in aerosol volume and gas-phase species concentrations suggest that the lack of BrC was not due to slow reactivity. Filter-based UHPLC/(+)ESI-HR-QTOFMS analysis revealed that the SOA became heavily oligomerized, with average molecular masses of ∼400 amu in all cases. Oligomers contained, on average, 3.9 HA, 1.5 ammonia, and 1.6 other small aldehydes, including, in descending order of abundance, acetaldehyde, glycolaldehyde, glyoxal, and methylglyoxal. PTR-ToF-MS confirmed the production of these aldehydes. We identify C17H26O5, C10H22O9, C15H27NO7, C17H23NO5, and C18H32N2O9 as potential tracer ions for HA oligomers. We hypothesize that efficient oligomerization without substantial BrC production is due to negligible N-heterocycle (e.g., imidazoles/pyrazines) formation. While HA photooxidation is unlikely a significant atmospheric BrC source, it may contribute significantly to aqueous SOA formation.
Keywords: secondary organic aerosol, carbonyl compounds, cloud chemistry, air−water interface, oligomer formation
1. Introduction
Hydroxyacetone (HA) is formed by the atmospheric photooxidation of many organic precursors, including isoprene.1−5 Its atmospheric concentrations also correlate with CO due to significant production from regional anthropogenic precursor emissions.1 With a Henry’s law coefficient of 77 mol m–3 Pa–1),6 HA is the sixth most common carbonyl species found in cloudwater,7 where it can react with aqueous phase oxidants. Due to electron density withdrawal by its α-hydroxy functional group, HA’s carbonyl group is more reactive than in monofunctional ketones, resulting in the potential for efficient attack by nucleophiles on the carbonyl carbon. In bulk aqueous-phase experiments involving HA and ammonium salts or primary amines (methylamine or glycine), light-absorbing organic species known as brown carbon (BrC) are slowly formed at levels comparable to aldehydes such as glycolaldehyde (GAld) and acetaldehyde (AAld),8,9 are rapidly bleached by OH radicals,9 and show a time- and wavelength-dependent photobleaching → browning → bleaching behavior when photolyzed over a few hours.10 However, chemical reactions in aqueous aerosol particles or evaporating cloud droplets often behave very differently from that observed in bulk liquid samples,11,12 and several aldehyde-amine reactions are known to generate surface-active products.13,14 Several aqueous aldehyde reactions not only accelerate in the presence of an air–water interface,12,15,16 but also exhibit enhanced photobrowning: instead of the rapid photobleaching observed in bulk solution,17−19 photobrowning has been observed for methylglyoxal- (MG)20 and GAld-amine reactions in suspended aqueous aerosol.21 This change indicates that some radical-driven BrC formation pathways occur mainly at the air–water interface. HA has been shown to have a high degree of surface activity at the air–water interface,22 which means that it too may exhibit distinct reactivity in multiphase (as opposed to bulk-phase) experiments.
Due to the similarity in brown carbon formation in bulk aqueous samples by HA and aldehyde species, and the great differences between bulk and aerosol reaction behavior noted above for aldehydes, here we investigate pH-dependent HA reaction rates in bulk aqueous solution, and BrC and SOA formation in aqueous aerosol particles during chamber cloud processing of HA. While little BrC was formed in multiphase HA reactions, offline aerosol analysis revealed that the SOA formed was heavily oligomerized.
2. Materials and Methods
2.1. Chemicals and pH
All chemicals were sourced from Sigma-Aldrich unless otherwise stated.
Stock solutions were made by diluting 40% w/w methylamine (MeAm) or liquid HA (95%), or dissolving solid glycine (Gly) or ammonium sulfate (AS) in D2O (99.9%-D, Cambridge Isotopes) for NMR experiments or in 18 MΩ water (Millipore Milli-Q Gradient A10) for aerosol chamber experiments. The pH of amine or AS samples in D2O was adjusted downward or upward to reach target levels using acetic acid-d6 (Cambridge Isotopes) or sodium phosphate, respectively. The pH was measured before and after mixing with HA.
2.2. Measuring Rate Constants by NMR
D2O solutions containing 0.5 M HA and 0.5 M of either Gly, AS, or MeAm were pH-adjusted, mixed, placed in NMR tubes, and monitored by 1H NMR. To quantify slow reactant losses at pH < 3.5, the NMR signals indicated in Table 1 were followed for up to 62 h, with the integrated peak areas in the spectrum collected nearest t = 0 assumed to correspond with starting concentrations of 0.5M. At higher pH levels, reactant losses could be quantified with shorter monitoring periods (∼90 min). Based on the behavior of other Maillard reactions at ≤1 M concentrations of carbonyl species and amines,15,23−27 reaction orders in this work were assumed to be first order in HA and first order in reduced nitrogen species. Rate constants are given for the ketone form of HA, rather than total HA (ketone + hydrate forms), but this is a small correction, as shown below. Second-order rate constants were derived from initial reaction rates using the following equation:28
| 1 |
where Ratex represents the measured initial loss rate of reactant x in M s–1, kx is the second-order rate constant calculated from the loss of x in M–1 s–1; [HA]tot and [Am]tot are the total concentrations in M of hydrated and unhydrated HA and protonated and unprotonated forms of the reduced nitrogen species, respectively; and fHA is the equilibrium fraction of HA in ketone (not hydrate) form, determined to be fald = 0.96 using NMR signals.29 (Rate constants calculated using just the total concentrations of both reactant species, without fald, would thus be 4% higher than those reported here.) Rate constants below 2 × 10⁻⁹ M–1 s–1 were too slow to be measured reliably by this method.
Table 1. NMR Signals Used for Quantitation of Reactant Losses.
| molecule | functional group | chemical shift (ppm) |
|---|---|---|
| hydroxyacetone | CH3 | 2.14 |
| CH2 | 4.40 | |
| methylamine | CH3 | 2.58 |
| glycine | CH2 | 3.55 |
2.3. Chamber Experiments
The CESAM chamber30 is a 4.2 m3 indoor, temperature-controlled chamber that was operated as a fixed volume batch reactor in this work. Before each experiment, the chamber was pumped down and refilled with an 80:20 mixture of N2 from a liquid nitrogen tank and UHP oxygen (Linde, ≥ 99.999% O2, < 0.2 ppm hydrocarbons). Experimental conditions are summarized in Table 2. Pressure was maintained just above ambient levels with automated inward flows of the same 80:20 mixture, compensating for outward sampling flows. Compensation flows were logged throughout each experiment and used for dilution corrections. Seed aerosol were generated with 9 mM AS (Experiments B and E), 9 mM AS/2 mM glycine (Experiment C), and 5 mM AS/5 mM HA (Experiment D) using a constant-output atomizer (TSI 3076) and were added to the dry chamber through a diffusion dryer (TSI 3062). Gas-phase HA and methylamine (MeAm) were added to the chamber in Experiments A-C and D, respectively, by injecting small volumes of the pure gases into the N2 flow into the chamber. Water vapor was added to the chamber in Experiments A-D via short steam injections from a stainless-steel boiler, after five steam flushes of the boiler headspace. For cloud events, the chamber was brought to near saturation via steam injection and then pumped at ∼40 L min–1 for 10 min, causing cloud events of 5–10 min duration, before returning to the original chamber pressure. Each cloud event therefore diluted chamber contents by ∼10%. Hydrogen peroxide (HOOH) was added in Experiments A-D by routing the O2 inlet flow through a bubbler containing 35% HOOH.
Table 2. Hydroxyacetone Experiment Conditions in the CESAM Chamber.
|
cloud eventsc |
notes | |||||||
|---|---|---|---|---|---|---|---|---|
| expt. | Figure. | steady-state [HA](g)(ppb)a | seed aerosol typeb | [MeAm](g)(ppb) | [HOOH]max(molec/cm3)a | dark | light | |
| A | S1 | 500 ± 50 | none | 0 | (6 ± 0.04) × 1013 | 0 | 2 | No seeds |
| B | 3 | 30 ± 3d | AS | 0 | 0.8 × 10¹³ | 1 | 2 | HA(g) + AS(p) seeds |
| C | 4 | 60 ± 6d | AS/glycine | 0 | 5 × 10¹³ | 1 | 1 | HA(g) + AS/Gly(p) |
| D | 5 | 40 ± 4e | AS/HA | 500 (2×) | 3 × 10¹³ | 1 | 1 | MeAm(g) + HA/AS(p) |
| E | S2 | 0 | AS | 0 | 0 | 0 | 0 | AS dry blank |
Based on PTR-ToF-MS signals at m/z 75 (for HA) or m/z 33 (for HOOH) in dry chamber, calibrated by in situ long-path FTIR absorption in range 1030–1220 cm–1 (for HA) or 1228–1258 cm–1 (for HOOH) using reference spectra from the AERIS database.31
Atomizer-generated and diffusion-dried before added to chamber.
Runs A-D included 2–3 cloud events each, with “light” indicating cloud event(s) for which solar simulator lights were turned on.
Higher levels were briefly observed upon HA(g) addition under dry conditions, before humidification.
HA released to the gas phase from aerosol particles. Abbreviations: [HOOH]max, maximum hydrogen peroxide concentration; (g), gas; (p), particulate.
Gas-phase species in the chamber were quantified by dedicated CO/CO2 (ap2e ProCeas), SO2 (Horiba APSA-370), and NOx (Horiba APNA-370) monitors, RH and temperature sensors, in situ long-path Fourier transform infrared spectroscopy (FTIR, Bruker Tensor 37, 182.5 ± 0.5 m path length), and proton transfer reaction time-of-flight mass spectrometry (PTR-ToF-MS, KORE II, Preactor = 1.38 mbar, PGlow Discharge = 1.47 mbar, Temp. = 60 °C, E/N = 133 td). The optical properties of chamber aerosol were characterized by cavity attenuated phase shift–single-scattering albedo spectroscopy (CAPS-ssa, Aerodyne, 450 nm) and particle-into-liquid sampling (PILS) with in-line waveguide UV–vis absorbance spectroscopy (Ocean Optics, 1m path length, 200–800 nm spectral range) and total organic carbon (TOC) measurements. Aerosol size distributions were monitored by scanning mobility particle sizing (SMPS, TSI model 3080/3772, 3 min scan frequency). Size distributions of droplets and aerosol particles larger than 0.4 μm were characterized during and after cloud events with an Optical Particle Spectrometer using scattered white light (PALAS welas Digital 2000, 0.4 to 15 μm range). Gas phase species signals were corrected for dilution using recorded gas flows into the chamber, and SMPS measurements were corrected for both dilution and size-dependent wall losses measured in an earlier control experiment.
Time-dependent single-scattering albedo at 450 nm was calculated by dividing CAPS scattering by CAPS extinction signals after correction using a daily calibration with polydisperse AS aerosol diluted to achieve extinction signals between 0 and 1200 Mm–1. Mass absorption coefficients (MAC365) for the water-soluble aerosol fraction were calculated from waveguide absorbance at 365 nm and TOC measurements taken in series on the outflow of the PILS sampler using the equation MAC = 2.303A/bC, where A is the waveguide log10 absorbance at a given wavelength, b is optical path length of the capillary (1000 cm), and C is the TOC level measured simultaneously in the PILS outflow (g organic carbon cm–3). The clean, air-filled chamber was used as a daily waveguide blank reference spectrum, while the TOC instrument was baselined with 18 MΩ water.
Offline chemical analysis of chamber aerosol was performed after the end of three experiments by collecting Teflon filters (1.0-μm pore size, 47 mm diam., Tisch Sci.) overnight at 16 L min–1 and storing them at −20 °C until extraction in methanol (Optima LC/MS grade, Fisher Sci.) by sonication for 45 min. Extracts were dried under high-purity nitrogen gas, dissolved in 150 μL of 50:50 v/v methanol and Milli-Q water, and then analyzed by ultrahigh performance liquid chromatography electrospray ionization high-resolution quadrupole time-of-flight mass spectrometry in positive mode (UHPLC/(+)ESI-HR-QTOFMS), as previously described in detail.32 Aliquots of 5–10 μL were injected onto a Waters ACQUITY UPLC HSS T3 column (2.1 × 100 mm, 1.8-μm particle size) and eluted at 0.3 mL min–1 with methanol and water solvent mixtures containing 0.1% ammonium acetate (LC-MS Chromasolv-grade, Sigma-Aldrich). Data were analyzed using Agilent MassHunter (Version B.06.00 Build 6.0.633.0).
3. Results and Discussion
3.1. Hydroxyacetone Reaction Kinetics
Reaction rate constants measured in bulk D2O by 1H NMR are summarized as a function of pH in Figure 1. Rate constants derived from HA loss rates during reactions with AS, glycine, and MeAm are shown as open symbols and are fit with least-squares lines. All three HA reactions are seen to be pH dependent over the range 2.5 to 7. However, none of the reaction rate constants increase on this log(k) vs pH plot with a slope of 1, which would be expected for a reaction involving a deprotonated nitrogen-containing weak base controlled only by its acid–base equilibrium. Instead, the slope was significantly less than 1 for HA + AS and significantly greater than 1 for HA + MeAm or glycine reactions. In three experiments where loss rates of both HA and amine were quantifiable, rate constants calculated from the loss rates of the two species at a given pH were similar (i.e., the mean kHA/kamine ratio, 2.2 ± 1.3, was not statistically distinguishable from 1). This suggests that 1:1 reactions between HA and reduced nitrogen species were the norm, as expected since HA has only one carbonyl moiety susceptible to nucleophilic attack by a lone pair on a nitrogen atom.
Figure 1.
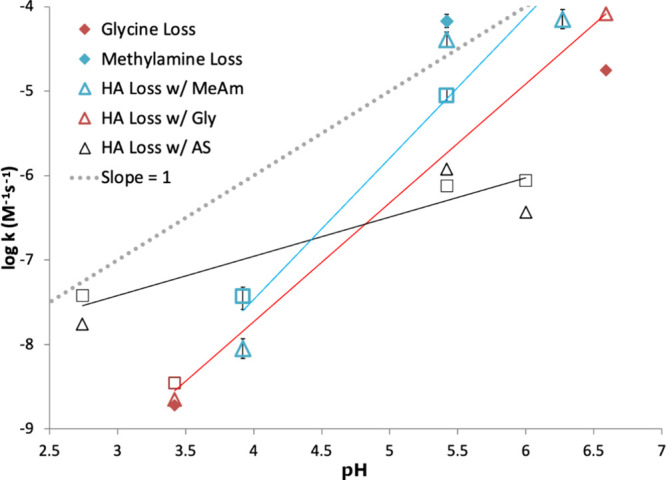
Measured room-temperature 2nd-order rate constants (M–1 s–1) as a function of pH, measured by 1H NMR for hydroxyacetone reactions with glycine (Gly, red), methylamine (MeAm, blue), and ammonium sulfate (AS, black), initial concentrations of all reactants = 0.5 M. Rate constants were calculated from initial loss rates of reactant signals, and the ±1σ error bars derived from uncertainties in fitted slopes shown for the methylamine reaction data set are typical for all three data sets. HA losses were followed at the CH3 signal (2.14 ppm, open triangles) and the CH2 signal (attached to the OH group, 4.4 ppm, open squares). HA losses with each reduced nitrogen species were fit with linear functions. Amine loss rate constants (filled diamonds) are shown for methylamine CH3 (2.58 ppm, blue) and glycine CH2 (3.55 ppm, red signals) when such losses were observable. AS losses could not be quantified by 1H NMR.
Measured rate constants from bulk aqueous measurements were used to estimate HA reaction rates in atmospheric aqueous aerosol as a function of pH (Figure 2), assuming that all amino acids react at the same rate as glycine, and all other primary amines react at the rate of methylamine. If rate constants measured in bulk aqueous mixtures are applicable to atmospheric aerosol, these Maillard reactions are too slow to compete with oxidation by hydroxyl radicals (•OH) in the aqueous phase at any acidic pH. The estimated summed fractional pathway for all Maillard reactions involving HA was only 0.2% at pH 5.5 and rapidly decreased at lower pH. However, several questions must be addressed before accepting this conclusion. First, do these reactions accelerate when taking place in aerosol particles, relative to bulk liquid solutions, as has been observed for analogous reactions with aldehydes?12,15,16 Second, is BrC formation significant, such that this reaction, even if a minor pathway, might influence aerosol optical properties under atmospheric conditions? Third, are there any multiphase, radical-driven mechanisms by which HA and amines can quickly form Maillard-like products (N-containing BrC oligomers), as observed for C2 and C3 bifunctional aldehydes?20,21 In order to address these questions we now turn to chamber studies.
Figure 2.
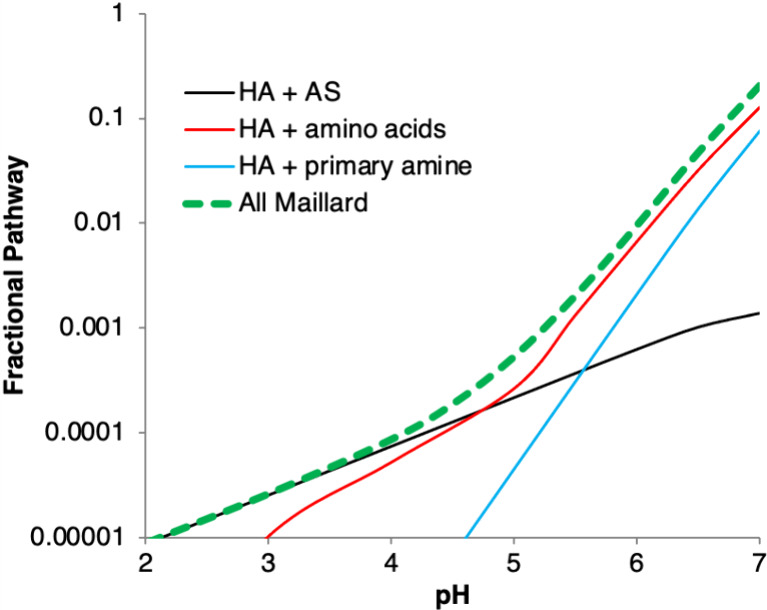
Fractional pathway of HA reactivity via Maillard reactions estimated in global aerosol as a function of pH, based on extrapolation of bulk aqueous rate constants to aqueous aerosol where [AS] = 0.081 M (black), amino acid concentration = 0.068 M (red), primary amine concentration = 0.0034 M (blue), and total Maillard reaction fraction (green dashed line). Reaction of HA with OH radicals in the aqueous phase (with [•OH] = 1 × 10–13 M)33 makes up almost all of the remainder of aerosol-phase reactivity.
3.2. CESAM Chamber Experiments
As summarized in Table 2, gas-phase HA was added in Experiments A-C, while only aerosol-phase HA was added in Experiment D. Experiments A and E (Figures S1 and S2) were controls, performed without seed aerosol and without HA, respectively. High levels (500 ppb) of HA were utilized in Experiment A in order to allow quantitation by long-path FTIR in the dry chamber. HA levels were an order of magnitude lower in the remaining experiments.
SOA and BrC production in each experiment are summarized in Table 3. In control Experiment A where HA was added to an air-filled, seed-free chamber with freshly cleaned walls, rapid loss of HA to the steel walls was observed, with a lifetime of 250 s (Figure S1 panel c). This loss rate was not increased when the chamber’s solar simulator lights were turned on, as expected because HA gas does not absorb light in the actinic region. However, when the chamber was humidified to 55% RH, HA was released from the walls, and achieved a steady-state equilibrium: PTR-ToF-MS signals at m/z 75 rose within a few minutes to reach a constant level that was 80% higher than the initial peak when HA was first added to the dry chamber. This steady state was maintained for over 30 min, until the equilibrium was altered by further RH increases in the chamber. This behavior of uptake to dry walls and then equilibrating from the walls once a chamber is humidified has been observed for some small, oxygenated molecules with carbonyl or hydroxyl groups, such as the dicarbonyl compound glyoxal (GX)34 or phenolic species like guaiacol.35 As the RH increased from 50% to ∼100%, gas-phase HA concentrations decreased by a factor of 2.3 and appeared to be temporarily depressed by each water vapor supersaturation period, which in the absence of seed aerosol is likely due to the effect of reversible changes in the amount of wall-adsorbed water on the HA gas/wall equilibrium. In the absence of seed particles, no cloud droplets formed upon water vapor supersaturation in Experiment A (Figure S1 panel b), unlike in all later experiments, which contained seed particles. At t = 16:20, HA(g) reached a new steady state, which was maintained for an hour even after the addition of HOOH and OH radicals to the gas phase. Thus, although HA and OH radicals are known to react in the gas phase with a rate constant k = (6.0 ± 0.9) × 10–12 cm3 mol–1 s–1,36−38 we can attribute the nearly constant HA(g) concentrations to continued resupply from chamber walls of HA(g) adsorbed earlier in the experiment. In later experiments, where HA(g) concentrations were an order of magnitude lower, this wall source of HA is expected to be smaller. In the atmosphere, HA is produced by the photooxidation of precursor gases, so a continuous daytime source is present.
Table 3. Summary of Experimental Results in the CESAM Chambera.
| expt. | Figure. | Notes | SOA productionb(μg/m3) | ΔMAC365c(cm2/ gOC) | min albedo,d450 nm | ΔTOC(ppb) |
|---|---|---|---|---|---|---|
| A | S1 | No seeds | <1 | 0 ± 200 | n/a | 7 ± 10 |
| B | 3 | HA(g) + AS(p) seeds | 17 after dark cloud | 500 | 0.98 | 60 |
| C | 4 | HA(g) + AS/Gly(p) | 9 after dark cloud | 100 | 0.97 | 40 |
| D | 5 | MeAm(g) + HA/AS(p) | 19 and 12 after MeAm, 7 after dark cloud | 400 | 0.97 | 70 |
| E | S2 | AS dry blank | 0 ± 3 | no data | no data | 2 ± 2 |
Uncertainties listed for Experiment A are typical for all experiments unless otherwise noted.
Measured by SMPS, assuming aerosol density of 1.0. All SOA production was observed only after prior equal or greater losses of aerosol mass.
Calculated from PILS-waveguide absorbance and in-line TOC measurements.
Measured by CAPS-ssa. Abbreviations: ΔMAC365, increase in mass absorption coefficient at 365 nm; min., minimum; ΔTOC, increase in total organic carbon; (g), gas; (p), particulate.
After the addition of HOOH/OH radicals at t = 16:30, a few gas-phase oxidation products were observed by PTR-ToF-MS, notably C4H6O3 at m/z 103. Some water-soluble oxidation products were taken up by chamber background aerosol particles (∼100 cm–3, mostly introduced with water vapor) and increased TOC levels by 10 ppb (Figure S1 panel a). SMPS measurements indicate that these particles had a dry geometric mean diameter of ∼30 nm and totaled less than 1 μg m–3 after an hour of photooxidation from either HA or gas-phase chamber contaminant precursors (Figure S1 panel d). No enhancement in aerosol scattering, extinction, or absorbance was observed for these particles, as expected due to their small size and low numbers.
In Experiment B, HA(g) was added to a chamber containing AS seed particles. Rapid loss of HA from the gas phase was again observed by PTR-ToF-MS (Figure 3 panel c), with a slightly longer lifetime (400 s) than in Experiment A. If uptake to dry AS seeds was significant, we would expect instead a shorter lifetime for HA(g) loss than in Experiment A due to the additional surface sink, along with increases in TOC and SMPS mass, none of which were observed (Figure 3 panels a and d). However, after HA(g) was added to the chamber, the aerosol single-scattering albedo at 450 nm (Figure 3 panel e) began to decline and the MAC365 value calculated from aerosol absorbance rose slightly (Figure 3 panel a), both of which suggest that a small amount of BrC may have formed in dark reactions between HA and AS at the dry aerosol surface.
Figure 3.
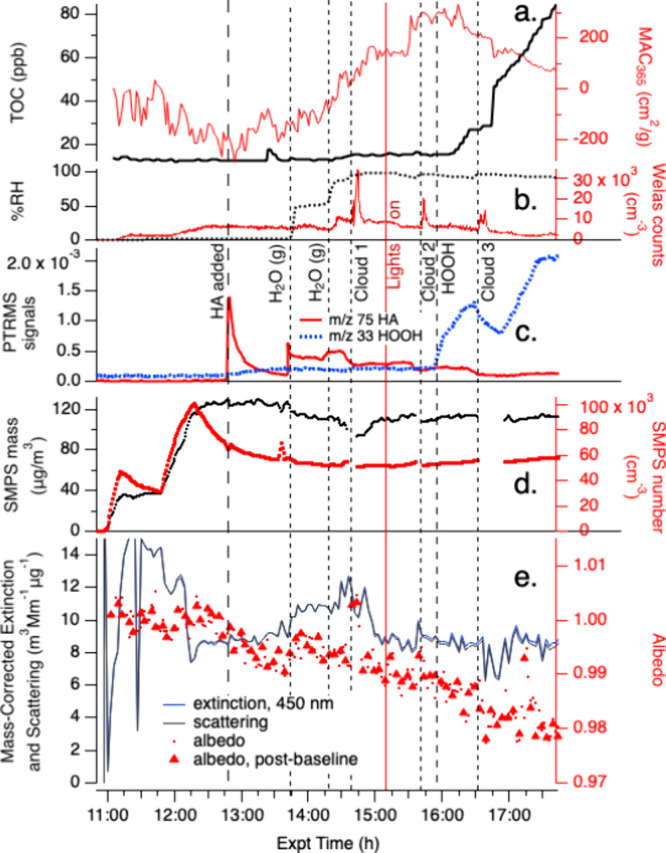
Expt. B with gas-phase hydroxy-acetone, photolysis, cloud processing, and HOOH oxidation with AS seed particles in the CESAM chamber. HA addition, two water vapor additions, start of chamber illumination, start of continuous HOOH addition, and 3 cloud events are labeled. Panel a: total organic carbon readings and mass absorption coefficients at 365 nm from PILS/waveguide UV–vis, color coded to axes. b: chamber RH and droplet spectrometer counts, color coded to axes. c: water-corrected PTR-ToF-MS data (m/z 75 HA, red line; m/z 33 HOOH, blue line). d: Dilution- and wall-loss-corrected SMPS aerosol total mass (assuming density = 1 g cm–3) and counts, color-coded to axes. e: CAPS-ssa data at 450 nm (mass-corrected extinction, blue line; mass-corrected scattering, black line; single-scattering albedo, red dots; albedo measured immediately after instrument autozero to remove contributions from gas-phase absorbers, red triangles.
When the chamber was humidified to 50% RH at t = 13:45 in Experiment B, HA(g) re-equilibrated from chamber surfaces (now potentially both walls and aerosol particles, Figure 3 panel c), but then quickly declined with a lifetime of <1 min to concentrations that were ∼15× lower than in Experiment A. At the same time, aerosol albedo and mass-normalized aerosol scattering (Figure 3 panel e) both increased as SMPS aerodynamic dry aerosol mass dropped slightly (Figure 3 panel d). These observations together suggest that the uptake of some HA (and possibly water) restructured the AS seed aerosol particle surfaces, making the aerosol more spherical and aerodynamic,39 and hydrolyzing a little of the BrC formed at the aerosol surface under dry conditions. Further humidification to 86% RH at t = 14:20 deliquesced the AS seed aerosol, at which point a release of 10 ppb HA to the gas phase, an accelerated upward trend in MAC365, a slight increase in TOC, and further SMPS aerosol dry mass loss of 10.7 μg m–3 were seen in the data. This aerosol dry mass loss, if due entirely to HA evaporation, could account for about a third of the increase in gas phase HA. Furthermore, in the absence of seed particles in Experiment A, HA(g) declined sharply when the RH was increased from 50 to 85%. The HA(g) increase in Experiment B therefore indicates that deliquescing AS seed aerosol particles were an important source of the HA released to the gas phase at high RH, causing their SMPS-measured dry mass to decline. At the same time, very small increases in MAC365 by 110 cm2 g–1 and TOC by 1.5 ppb (Figure 3 panel a) suggest that aqueous reactions between HA and AS were starting to produce minor amounts of BrC, and therefore that not all HA had evaporated from the aqueous phase.
After a dark cloud event in Experiment B at t = 14:40 (“Cloud 1”), MAC365 continued to increase and HA(g) concentrations dropped by a factor of ∼2, suggesting cloud droplet and/or wall uptake of HA(g) occurred without a noticeable increase in aqueous-phase BrC formation rates. Turning on the chamber solar simulator lights and a photolytic cloud event (“Cloud 2”) did not change these trends over the next 45 min, indicating that BrC production by the HA + AS reaction had not produced any effective photosensitizing species. After the addition of HOOH(g) at t = 15:55 to the illuminated chamber, TOC began to increase at a rate of 1 ppm min–1 for the next hour. At the same time, MAC365 levels, which had been increasing for 2 h and approached 400 cm2 g–1, began a decline to 100 cm2 g–1, following an exponential decay with a lifetime of 0.9 ± 0.2 h (Figure 3 panel a). Losses of HOOH(g) detected by PTR-ToF-MS during Cloud 3 (Figure 3 panel c) suggest significant uptake into cloud droplets. From these observations we can infer that OH radicals, generated by aqueous-phase photolysis in aerosol particles and in cloud droplets, generated new water-soluble SOA material via HA photooxidation, while also oxidizing BrC that had previously formed under low-oxidant conditions. We do not see evidence of sunlit BrC formation by a radical-driven process, unlike analogous multiphase reactions of MG or GAld in sunlight.20,21
Experiment C (Figure 4) was similar to B, but seed aerosol particles were generated from a 2 mM glycine/9 mM AS mixture instead of only AS. These dry aerosol particles initially contain an 0.18 mole fraction of glycine, or 11.2% glycine by mass and ∼16% glycine by volume, calculated using densities of 1.16 and 1.77 g cm–3 for glycine and AS, respectively. As the seed particles were added to the chamber, SMPS dry aerosol mass increased from 0 to 110 μg m–3 (assuming an aerosol density of 1 g cm–3, Figure 4 panel d), while the measured TOC increased by 50 ppb due to the presence of glycine (Figure 4 panel a). PTR-ToF-MS signals for HA(g) declined rapidly after its addition to the dry chamber (Figure 4 panel c), with a lifetime of 430 ± 30 s, the same as in Experiment B. No increase in dried aerosol mass was recorded by SMPS, suggesting once again that uptake of gas-phase HA in the dry chamber was mainly to the walls.
Figure 4.
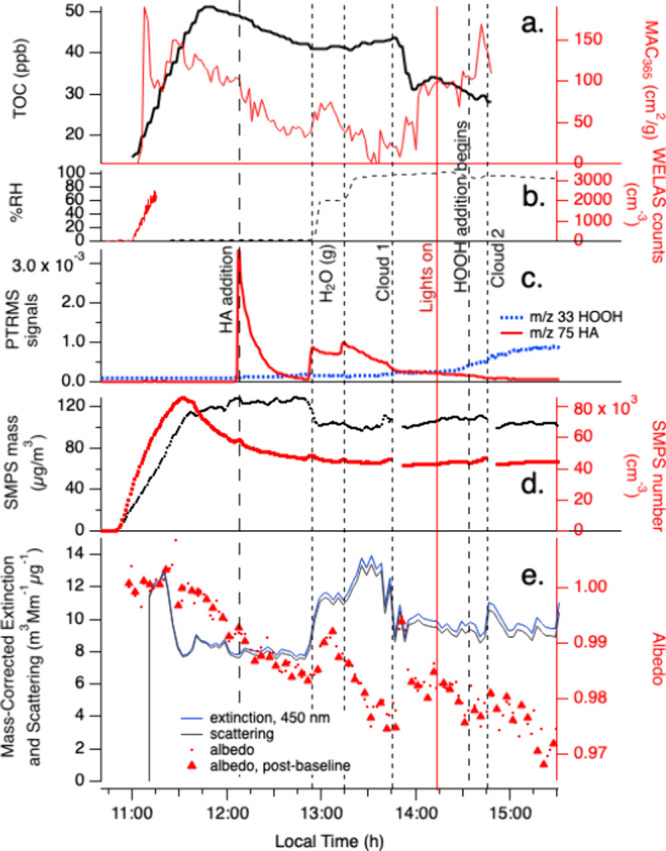
Expt. C with gas-phase hydroxyacetone, photolysis, cloud processing, and HOOH oxidation with AS/glcyine seed particles in the CESAM chamber. HA addition, two water vapor additions, start of chamber illumination, start of continuous HOOH addition, and 2 cloud events are labeled. Panel a: total organic carbon readings and mass absorption coefficients at 365 nm from PILS/waveguide UV–vis, color coded to axes. b: chamber RH and droplet spectrometer counts (data ends at 11:15), color coded to axes. c: water-corrected PTR-ToF-MS data (m/z 75 HA, red line; m/z 33 HOOH frag, blue dotted line). d: Dilution- and wall-loss-corrected SMPS total aerosol mass (assuming density = 1 g cm–3) and counts, color-coded to axes. e: CAPS-ssa data at 450 nm (mass-corrected extinction, blue line; mass-corrected scattering, black line; single-scattering albedo, red dots; albedo measured immediately after instrument autozero, red triangles.
Upon humidification of the chamber to 58% RH in Experiment C, HA re-equilibrated from the walls (Figure 4 panel c), as before. At the same time, SMPS mass declined by 22% within 6 min (Figure 4 panel d), a much larger and more abrupt change compared to experiment B, while TOC signals stayed constant (within 3%). After further water addition to reach 93% RH, SMPS mass declined by an additional 4% in 12 min. A loss of glycine from aerosol would cause declines in both SMPS mass and TOC signals, so a decline in only SMPS mass indicates a loss of mainly noncarbon-containing species, such as ammonium, from the aerosol. The total observed aerosol mass loss would represent a loss of more than a quarter of the AS, or essentially all of the ammonium, from the seed particles. We hypothesize that an aerosol-phase reaction between HA and AS generated a volatile product (rather than forming BrC), which removed a significant quantity of ammonium from the aerosol phase. An SMPS-only aerosol mass loss of smaller magnitude (−13%) and much slower speed took place upon humidification to 50% RH in Experiment B (without glycine). Together, these comparisons suggest that the presence of aerosol-phase glycine accelerated the HA + AS reaction by increasing water uptake, by deprotonating ammonium ions through H+ exchange reactions, or both. In spite of this chemical reactivity, BrC formation remained small throughout the RH increases and a dark cloud event, with an insignificant ΔMAC365 of only 65 cm2 g–1. During high-RH photooxidation in the last hour of Experiment C, SMPS aerosol mass was quite stable, and unlike in Experiments A or B, TOC concentrations declined after HOOH addition. This suggests that aqueous-phase OH photooxidation destroyed aerosol-phase glycine faster than SOA could be formed from precursor HA. MAC365 levels increased only marginally during photooxidation.
In Experiment D (Figure 5), HA was introduced into the chamber in the aerosol phase (along with AS), and gas-phase methylamine was added twice. Some HA escaped to the gas phase during the aerosol fill, likely as aerosol dried on the way into the chamber, resulting in initial gas-phase HA concentrations that were 3–8× lower than in previous experiments. However, once the fill ended, HA(g) PTR-ToF-MS signals declined with a lifetime of 1400 ± 300 s, 4 times slower than in other experiments, possibly because of continued release of HA(g) from the dry seed particles. When 500 ppb methylamine gas was added to the dry chamber, gas-phase HA concentrations increased slightly, MAC365 and TOC levels spiked significantly upward before returning to baseline 30 min later, and SMPS aerosol mass dropped by 17 μg/m3 before recovering over 30 min. These observations suggest that MeAm was taken up by the dry aerosol even as it released ammonia (and possibly small amounts of HA and/or reaction products), but that all C-containing compounds produced at the aerosol surface ultimately evaporated. PTR-ToF-MS signals at m/z 86 (C4H7NO) increased each time MeAm(g) was added. This species could form via HA disproportionation into MG and 1,2-dihydroxypropane,40 followed by imine formation, as shown in Scheme 1. The fact that this species was not detected in the aerosol phase at the end of the experiment (see section 3.3) suggests that its gas-particle partitioning ratio is very high, and/or that it is too reactive to survive photooxidation.
Figure 5.
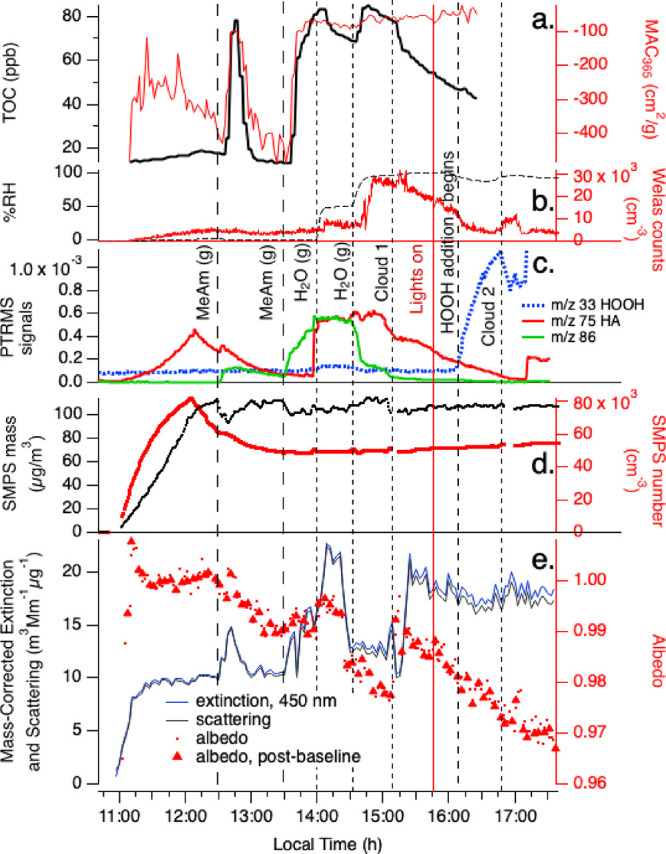
Expt. D with gas-phase methylamine, photolysis, cloud processing, and HOOH oxidation with AS+HA seed particles in the CESAM chamber. MeAm additions, two water vapor additions, start of chamber illumination, start of continuous HOOH addition, and 2 cloud events are labeled. Panel a: total organic carbon readings and mass absorption coefficients at 365 nm from PILS/waveguide UV–vis, color coded to axes. b: chamber RH and droplet spectrometer counts, color coded to axes. c: water-corrected PTR-ToF-MS data (m/z 75 HA, red line; m/z 33 HOOH frag, blue dotted line; m/z 86, green line). d: Dilution- and wall-loss-corrected SMPS total aerosol mass (assuming density = 1 g cm–3) and counts, color-coded to axes. e: CAPS-ssa data at 450 nm (mass-corrected extinction, blue line; mass-corrected scattering, black line; single-scattering albedo, red dots; albedo measured immediately after instrument autozero, red triangles.
Scheme 1. HA Disproportionation and Imine Formation from Methylglyoxal.
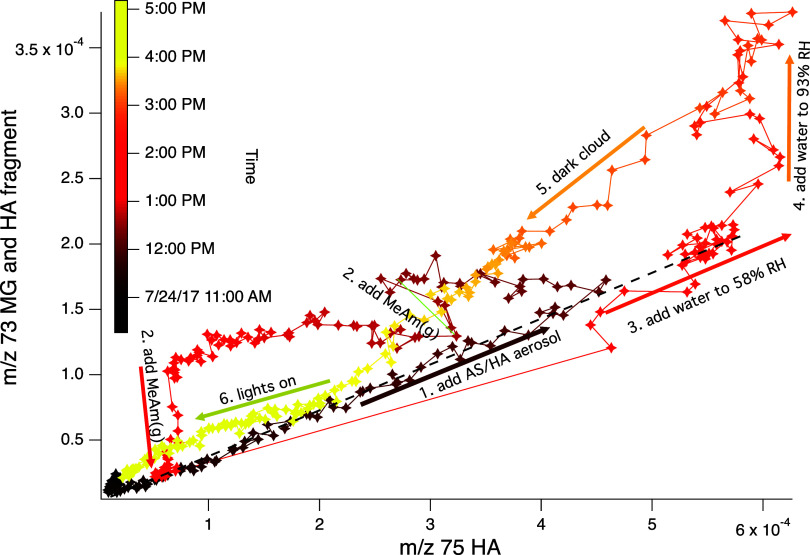
Evidence for HA disproportionation is seen in Figure 6, where PTR-ToF-MS signals at m/z 73 (with a contribution from both MG and a HA fragment) and m/z 75 (HA) are compared. The ratio of m/z 73/75 has a lower limit of 0.36, which is interpreted as the fractional contribution of the HA fragment to the m/z 73 signal. Ratios higher than 0.36 likely indicate a contribution from MG. After the chamber is filled with AS/HA seeds (arrow 1), this ratio rises as HA signals drop and m/z 73 signals increase slightly, reaching as high as 1.67 just before the second MeAm addition (arrow 2). After each MeAm addition, the ratio returns to 0.36, suggesting that MeAm reacts preferentially with MG to form products as shown in Scheme 1. Production of MG is especially prominent after aerosol deliquescence (arrow 4).
Figure 6.
PTR-ToF-MS signal traces for m/z 73 vs m/z 75 recorded during Experiment D, color-coded according to time. Chamber events are noted in numbered order. For aerosol addition (arrow 1) and water addition to 58% RH (arrow 3), the data falls on the same line of an m/z 73/75 ratio of 0.36 (black dashes). This signal ratio likely accounts for the fractional contribution to m/z 73 of HA fragmentation. Data above this ratio likely indicates the presence of MG contributing to the m/z 73 signal.
The second addition of 500 ppb MeAm gas at t = 13:30 in Experiment D caused similar changes as the first addition: TOC increased by 70 ppb, MAC365 increased by 400 cm2 g–1, and SMPS mass dropped by 14 μg/m3, but this time none of them returned to their previous values afterward, indicating that at least a portion of the BrC SOA formed was stable against evaporation. Production and evaporation of the imine product (PTR-ToF-MS signals at m/z 86) was more pronounced after the second MeAm addition, with signals increasing continuously.
Chamber humidification to 58% RH at t = 14:00 in Experiment D caused an increase in gas-phase PTR-ToF-MS HA signals at m/z 75 that was similar in magnitude to Experiments B and C, but the simultaneous 17% decline in TOC levels was unique to Experiment D, as expected since it was the only experiment with HA-containing seed particles. Further humidification to 95% RH allowed TOC to quickly recover to its previous level at the same time as the imine product was rapidly removed from the gas phase. SMPS aerosol mass rose slightly (+7 μg/m3) while single-scattering albedo at 450 nm declined from 0.993 to 0.977, indicating the production of BrC. However, a subsequent dark cloud event at t = 15:10 reversed most of these changes: TOC and aerosol mass declined, and albedo at 450 nm increased back to 0.99. No further SOA production was observed as chamber lights were turned on and HOOH was added, even though gas-phase HA was present.
In summary, these chamber experiments do indicate that Maillard reactions involving HA accelerate in aerosol particles and droplets, as seen by rapid changes in aerosol mass. However, most of the rapid changes are mass loss, rather than SOA production, indicating that the early generation products of these reactions are prone to evaporate from aerosol particles in a multiphase experimental system. Furthermore, Maillard reactions involving HA do not seem to generate products capable of efficient photosensitization, and as a result net SOA and BrC generation was quite minimal during the photooxidation stage of these experiments. As described in the next section, however, the aerosol phase that remained after some products evaporated was itself transformed by oligomerization.
3.3. Aerosol-Phase Reaction Products
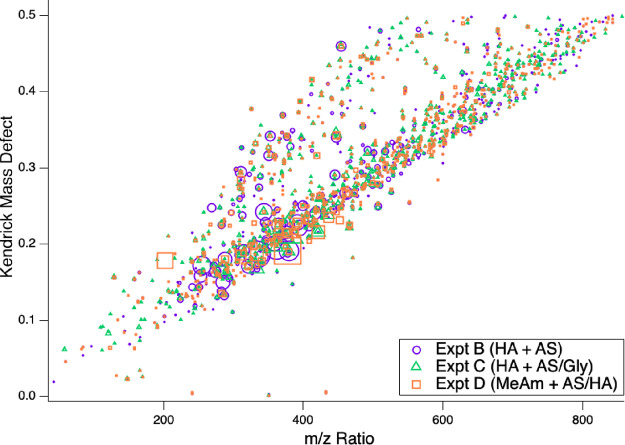
The aerosol-phase molecular composition was probed by offline UHPLC-(+)ESI-HRMS analysis of filters collected from the CESAM chamber after the end of Experiments B – D. Approximately 1550 species in the m/z range 40–1000 were detected across the three experiments, which in each case separated into two main bands in a Kendrick mass defect (KMD) plot (Figure 7): a smaller group of generally less-oxidized compounds with higher KMD values and a larger group of more-oxidized compounds with lower KMD values. Peak-area-weighted average molecular weights were nearly identical (407 ± 6 amu) in all experiments, suggesting efficient oligomerization in the organic aerosol phase, regardless of whether HA was initially added to the chamber in the gas or aerosol phase. Of these 1550 species, exact masses were used to determine formulas and precursor species for a subgroup of 54 major peaks representing 25% of the total peak area, focusing on masses below m/z 425 where formulas could be assigned with greater confidence. SOA products (all in the elemental groups CHO, CHN, and CHON) represented 39 of these major species (Table 4), with inorganic salts (11 peaks, 2% of subgroup peak area), acetonitrile solvent (2 peaks, < 0.2%), and two phthalate contaminants (11%) responsible for the remainder. Chromatographic retention times, detected peak areas in each experiment, and delta values (differences between theoretical and measured exact masses) are listed for the 39 major organic products in Table S1. Kendrick mass defect plots for peaks with assigned chemical formulas are shown for Experiments B-D in Figure S3.
Figure 7.
Kendrick mass defect plot showing differences from unit mass of each peak detected by UHPLC-(+)ESI-HRMS analysis of filter extracts of aerosol collected after Experiments B – D. Colors and symbols indicate whether ions were detected in Experiment B (purple circles), Experiment C (green triangles), and Experiment D (orange squares). Peaks with KMD < 0 are due to inorganic salts.
Table 4. Assigned Formulas, Precursor Species, and Proposed Structures of Detected Aerosol-Phase Species in Experiments B-Da.
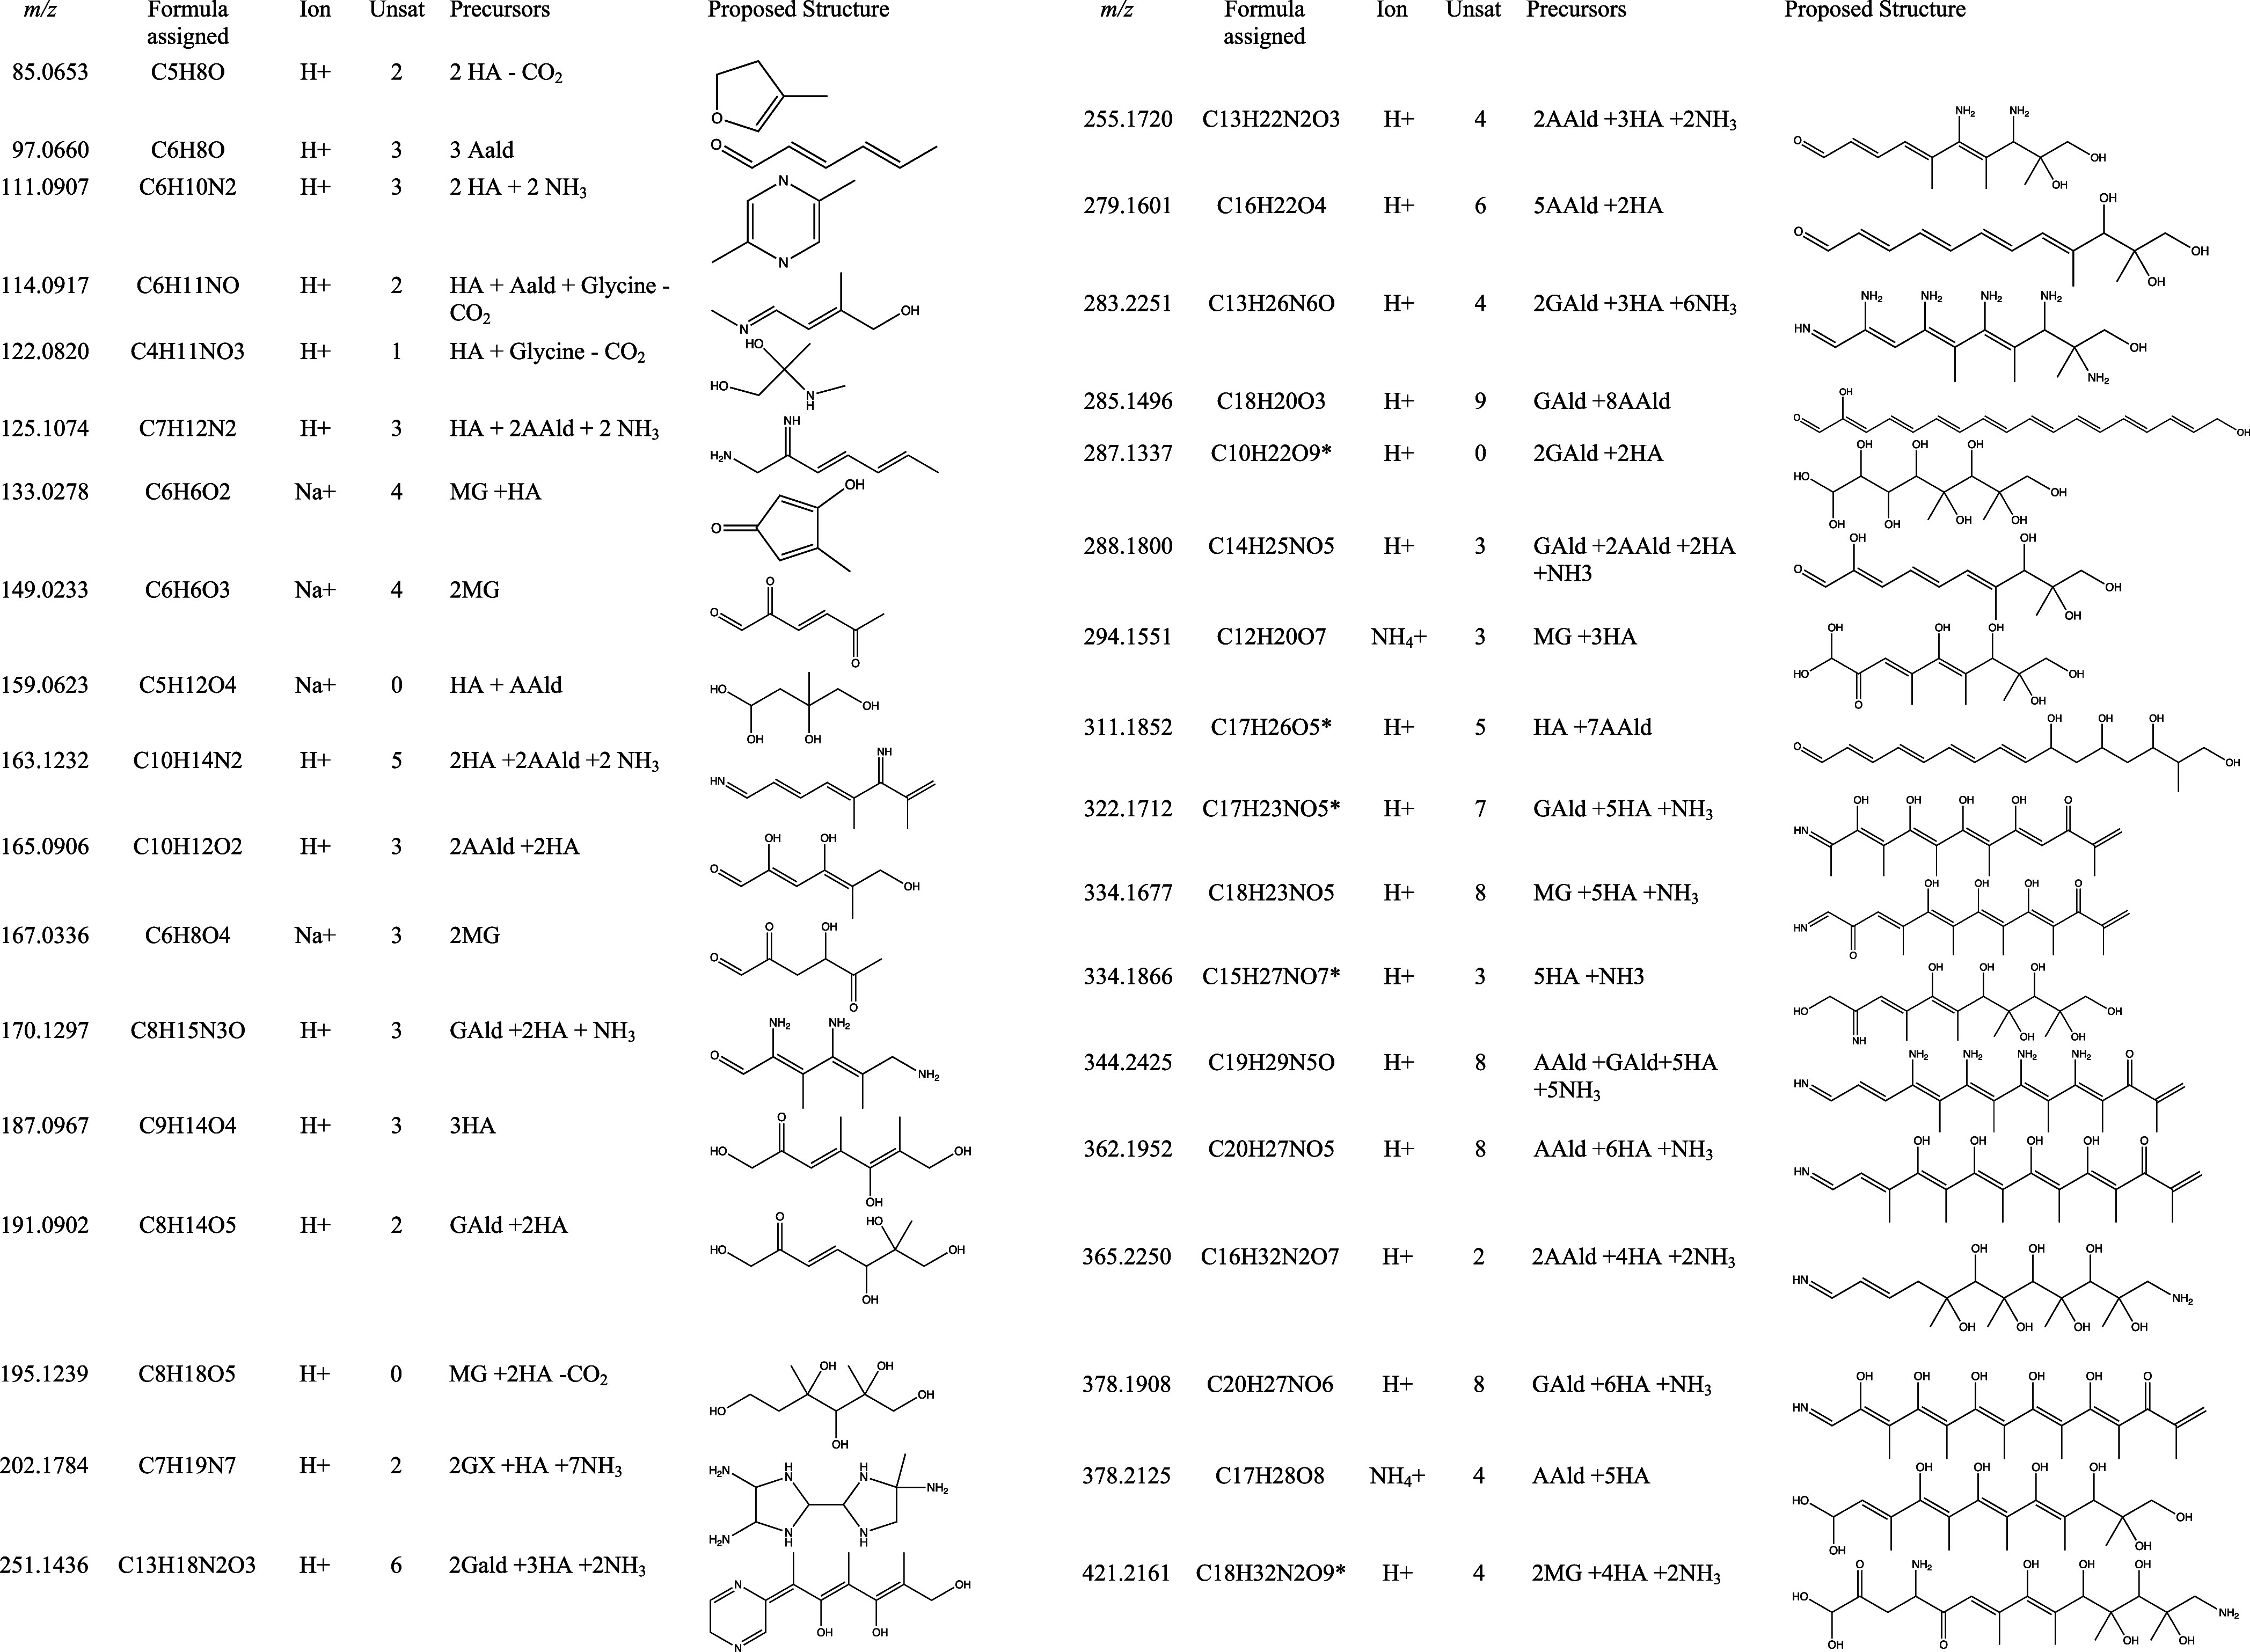
Notes: m/z = detected mass-to-charge ratio is positive ion ESI mode. Ion = ionization. Unsat = degrees of unsaturation. * = recommended tracer ions for HA oligomerization chemistry.
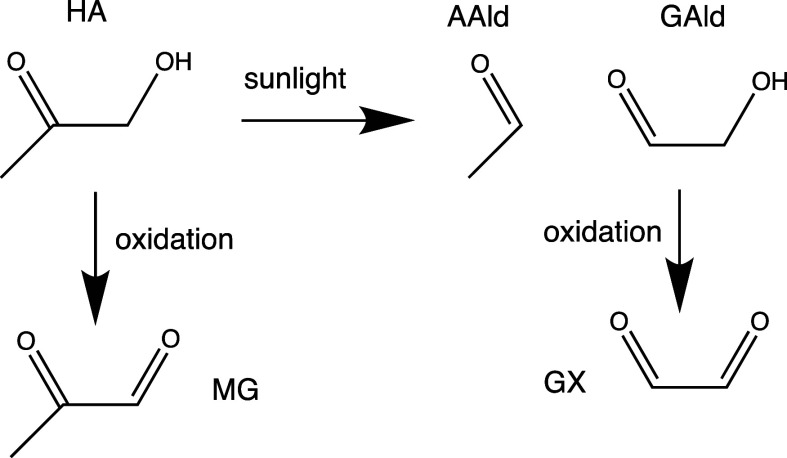
The 39 SOA molecular formulas were then used to determine which combinations of precursor molecules could have formed them through oligomerization. Precursors included the molecules present in a given experiment (NH3 and HA in all experiments, plus glycine in experiment C and methylamine in experiment D). However, in order to explain observed major formulas, photolysis products (AAld and GAld) and oxidation products (GX and MG, produced from GAld and HA, respectively) also needed to be included in the pool of possible precursors (Scheme 2). In support of this scheme, using Experiment B as an example (Figures 8 and Figure S4,), we note that PTR-ToF-MS signals for the proposed photolysis products AAld and GAld increased by 41 and 19%, respectively, in 20 min after the chamber lights were turned on, while HA, GX, and MG signals changed by less than 4%. This strongly supports the idea that AAld and GAld are photolytically produced in this experiment. Furthermore, once HOOH was added as an OH radical source, PTR-ToF-MS signal changes indicated that the gas-phase concentrations of all four of the proposed aldehyde products in Scheme 2 increased by factors of approximately 2 to 4 over the next 100 min, while HA concentrations declined by 40%. Furthermore, PTR-ToF-MS signals decreases observed for all five species during cloud 3 (Figure S4) indicate that HA and the four aldehydes are all transferring to the aqueous phase (either aqueous aerosol or wall-adsorbed water). Collectively, this is strong evidence that photolysis and photooxidation together are producing the four aldehyde species that we identified as precursors of aerosol-phase oligomers, and that these four aldehydes are available along with HA for aqueous-phase reactions.
Scheme 2. Formation of Oligomer Precursors by HA Photolysis and Oxidation.
Figure 8.
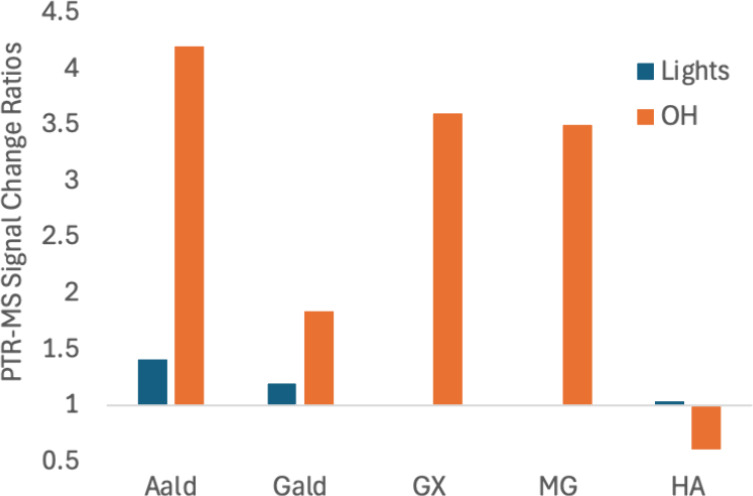
Summary of PTR-ToF-MS signal change ratios in Experiment B as a result of turning chamber lights on (blue) and adding HOOH as an OH radical source (orange), for acetaldehyde (AAld, m/z 45), glycolaldehyde (GAld, m/z 61), glyoxal (GX, m/z 59), methylglyoxal (MG, m/z 73), and hydroxyacetone (HA, m/z 75), respectively. Signal change ratios are expressed for each event as (signal after)/(signal before), such that 1 = no response. GX signals remained at background when the lights were turned on, and MG signals increased by less than 1% (bar not visible). Changes after turning lights on and adding HOOH were measured over 20 and 100 min, respectively.
On average across all experiments (weighted by peak area), detected molecules contained 3.9 HA units, 1.5 NH3 units, 0.83 AAld units, 0.45 GAld units, 0.26 MG units, and 0.10 GX units. Incorporation of glycine followed by decarboxylation was needed to rationalize 2 formulas, all detected only in Experiment C (which contained glycine as a reactant). GX units were needed to rationalize only 1 formula, detected in Experiment D. Although a gas-phase molecule incorporating methylamine was detected in Experiment D by PTR-ToF-MS at m/z 86, no aerosol-phase molecules incorporating methylamine were found in the subgroup of 54 major peaks. Of the 39 identified SOA chemical formulas, more than half could be assigned to structures generated from 1 to 2 total units of AAld, GAld, or MG attached to 1–6 units of HA and 0–2 units of ammonia. Only three formulas could be attributed to dark chemistry, such as products of HA aldol or acetal-forming self-reactions or HA + NH3/amine Maillard reactions.
4. Atmospheric Implications
The abundance of HA oligomers incorporating other species produced by photolysis or oxidation, combined with slow aqueous-phase reaction rates and a lack of “dark reaction” HA oligomers and Maillard products among the identified aerosol-phase species, suggest that daytime oligomerization in the HA system is primarily a radical-initiated process. A similar conclusion was reached for daytime MG oligomerization.32 Direct photolysis of aqueous-phase BrC species, photosensitization, or oxidation by OH radicals can produce organic radical species that initiate oligomerization of closed-shell species (such as HA) that are much more numerous in the aqueous phase. Due to the lack of evidence previously noted for direct photolysis of BrC or for photosensitization in these chamber experiments, OH radicals are the most likely instigators of oligomerization chemistry in HA-containing aqueous aerosol.
We observed only minor browning in our chamber experiments, with a maximum MAC365 increase of only 500 cm2 g–1, and minimum albedo at 450 nm of only 0.97, and the browning observed did not correlate with photooxidation periods. From this, we conclude that there is no significant pathway of radical-driven BrC production involving HA. Offline chemical analysis of the organic aerosol phase, however, shows that particles were largely oligomerized by the end of each experiment, and that this oligomerization appeared to be triggered by radicals produced by photolysis and/or photooxidation. From this we conclude that there is indeed a significant pathway of radical-driven SOA production involving HA, but that the SOA produced is very weakly light-absorbing at wavelengths of 365 nm and above, unlike the brown SOA produced by GX or MG undergoing multiphase photooxidation under comparable conditions (in the presence of AS and amine species). We hypothesize that weak light absorption is due to the relative lack of aromatic heterocycles seen in the HA oligomers identified in this work–only 1 minor peak out of 39 was assigned to an aromatic heterocycle, and this was one of the three identified dark Maillard products, dimethylpyrazine (m/z 111), a product also identified in dark MG + AS reactions.41
Aromatic heterocycles such as imidazoles15,42 and pyrazines41 are formed extensively in GX, MG, and GAld Maillard reaction systems, and this formation is likely key to their greater light absorption. The facile formation of aromatic heterocycles appears to require two difunctional aldehyde molecules to react with each other. In these experiments, the difunctional aldehydes GX, MG, and GAld were all produced by HA photooxidation and all are capable of aromatic heterocycle formation. However, they appear to have reacted with more abundant HA and AAld molecules instead of each other.
Reported gas-phase HA concentrations in the atmosphere range from 0.005 to 2 ppb,43−45 which is roughly 1 to 4 orders of magnitude lower than HA concentrations used in this work. However, the fraction of HA in the aerosol phase averaged 43% in one field study, higher than any other aldehyde,44 and showed a diurnal transfer between gas and aerosol phase. Average aerosol-phase HA concentrations of 97 ng m–3 were measured at Mt. Tai, China.44 It is therefore clear that HA is commonly present in atmospheric aerosol, but at lower concentrations than in the chamber aerosol in Experiments A – D in this study. These lower atmospheric concentrations will make the formation of HA oligomers and HA-based BrC less likely. However, HA in the atmosphere is still likely to form AAld, GAld, GX, and MG during photooxidation, and participate in radical-initiated oligomer formation with a range of other species, especially when crowded at air–water interfaces with other surface-active species. The importance of the air–water interface in this work is seen in the fact that at least 80% of ions detected in the photooxidized aerosol phase were not detected in an earlier study of HA + AS reaction mixtures that were photolyzed in bulk aqueous solution.10 Thus, while HA is unlikely to be a significant source of atmospheric BrC, it is expected to contribute significantly to multiphase SOA formation in the presence of aqueous particles, similar to other small multifunctional carbonyl species.
Certain of the HA-containing SOA products identified in this study share chemical formulas with compounds detected in recent field studies, and are unique enough that they may be useful as atmospheric tracers of HA oligomerization chemistry in future source apportionment studies. All of the CxHyOz product formulas have been identified in aerosol field studies, but most of these formulas already have been linked to products of biomass burning or specific oxidation and/or dimerization processes of biogenic precursor species, precluding their potential use as chemical tracer ions for HA oligomerization. The exceptions are C17H26O5 (m/z 311 with H+ ionization), which was detected in a Zurich, Switzerland winter field study and assigned to a “non-source specific” SOA principle component,46 and C10H22O9 (m/z 287 with H+), which was a “top five” particle-phase HOM in the BAECC field study in Hyytiälä, Finland.47 Few of the N-containing product formulas have been reported in aerosol field studies to date, with three exceptions. C15H27NO7 (m/z 334 with H+) was detected by FT-ICR-MS in aerosol WSOC during summer 2010 at the Storm Peak Laboratory (3210 m ASL) near Steamboat Springs, CO. C17H23NO5 (m/z 322 with H+) and C18H32N2O9 (m/z 421 with H+) were detected during the ACROSS field study of an urban plume from Paris advecting over a forest.48 These latter two compounds were assigned to “terpene-isoprene HOMs” and “sunlit terpene” principal components, respectively. Since HA is a common oxidation product of isoprene and other biogenic precursor species,1 the prior classifications of most of these chemical formulas as biogenic SOA in field studies are certainly compatible with HA oligomerization chemistry. Thus, the five listed tracer ions (and perhaps other N-containing ions from Table 4) may be useful for attributing SOA formation to HA oligomerization in future field studies.
Acknowledgments
This work was supported by NSF grants AGS-1129002, AGS-1826593, and AGS-2218491. L.N.H. was funded by the Barbara Stokes Dewey Foundation and Research Corporation for Science Advancement (CCSA 22473). CNRS-INSU is gratefully acknowledged for supporting CESAM as an open facility through the National Instrument label. This project/work has received funding from the European Union’s Horizon 2020 research and innovation programme through the EUROCHAMP-2020 Infrastructure Activity under grant agreement No. 730997. AERIS/ACTRIS is acknowledged for supporting the Eurochamp data center. The authors thank Prof. Bénédicte Picquet-Varrault for posting the chamber data. UNC acknowledges the National Institute of Environmental Health Sciences (NIEHS) grant No. P30ES010126 for the UHPLC/ESI-HR-QTOFMS instrument used during this study.
Data Availability Statement
Concentration–time profiles for the large chamber experiments are freely accessible in.edf format through the chamber database at data.eurochamp.org maintained by AERIS for the benefit of ACTRIS ERIC. Expt. A: https://doi.org/10.25326/YRJG-ES08. Expt. B: https://doi.org/10.25326/D7Y1–S078. Expt C: https://doi.org/10.25326/4VYF-QG62. Expt. D: https://doi.org/10.25326/78ZM-8T09. Expt. E: https://doi.org/10.25326/9C7C-X242.
Supporting Information Available
The Supporting Information is available free of charge at https://pubs.acs.org/doi/10.1021/acsearthspacechem.4c00237.
Details on significant oligomer molecules detected in SOA by UHPLC/ESI-HR-QTOFMS in experiments B–D, graphical summaries of experiments A and E, individual Kendrick mass defect plots for experiments B–D, and PTR-ToF-MS traces during experiment B for HA and four aldehyde species (PDF)
Author Present Address
† Present address: PSI Center for Energy and Environmental Sciences, Paul Scherrer Institute (PSI), 5232 Villigen, Switzerland
The authors declare no competing financial interest.
Special Issue
Published as part of ACS Earth and Space Chemistryspecial issue “Hartmut Hermann Festschrift”.
Supplementary Material
References
- Spaulding R. S.; Schade G. W.; Goldstein A. H.; Charles M. J. Characterization of secondary atmospheric photooxidation products: evidence for biogenic and anthropogenic sources. Journal of Geophysical Research, [Atmospheres] 2003, 108 (D8), 4247. 10.1029/2002JD002478. [DOI] [Google Scholar]
- Schaefer T.; Schindelka J.; Hoffmann D.; Herrmann H. Laboratory Kinetic and Mechanistic Studies on the OH-Initiated Oxidation of Acetone in Aqueous Solution. J. Phys. Chem. A 2012, 116 (24), 6317–6326. 10.1021/jp2120753. [DOI] [PubMed] [Google Scholar]
- Böge O.; Mutzel A.; Iinuma Y.; Yli-Pirilä P.; Kahnt A.; Joutsensaari J.; Herrmann H. Gas-phase products and secondary organic aerosol formation from the ozonolysis and photooxidation of myrcene. Atmos. Environ. 2013, 79, 553–560. 10.1016/j.atmosenv.2013.07.034. [DOI] [Google Scholar]
- Schöne L.; Schindelka J.; Szeremeta E.; Schaefer T.; Hoffmann D.; Rudzinski K. J.; Szmigielski R.; Herrmann H. Atmospheric aqueous phase radical chemistry of the isoprene oxidation products methacrolein, methyl vinyl ketone, methacrylic acid and acrylic acid – kinetics and product studies. Phys. Chem. Chem. Phys. 2014, 16 (13), 6257–6272. 10.1039/c3cp54859g. [DOI] [PubMed] [Google Scholar]
- Rodigast M.; Mutzel A.; Schindelka J.; Herrmann H. A new source of methylglyoxal in the aqueous phase. Atmos. Chem. Phys. 2016, 16 (4), 2689–2702. 10.5194/acp-16-2689-2016. [DOI] [Google Scholar]
- Lee Y.-N.; Zhou X. Method for the determination of some soluble atmospheric carbonyl compounds. Environ. Sci. Technol. 1993, 27, 749–756. 10.1021/es00041a020. [DOI] [Google Scholar]
- Dominutti P. A.; Renard P.; Vaïtilingom M.; Bianco A.; Baray J. L.; Borbon A.; Bourianne T.; Burnet F.; Colomb A.; Delort A. M.; Duflot V.; Houdier S.; Jaffrezo J. L.; Joly M.; Leremboure M.; Metzger J. M.; Pichon J. M.; Ribeiro M.; Rocco M.; Tulet P.; Vella A.; Leriche M.; Deguillaume L. Insights into tropical cloud chemistry in Réunion (Indian Ocean): results from the BIO-MAÏDO campaign. Atmos. Chem. Phys. 2022, 22 (1), 505–533. 10.5194/acp-22-505-2022. [DOI] [Google Scholar]
- Powelson M. H.; Espelien B. M.; Hawkins L. N.; Galloway M. M.; De Haan D. O. Brown carbon formation by aqueous-phase aldehyde reactions with amines and ammonium sulfate. Environ. Sci. Technol. 2014, 48 (2), 985–993. 10.1021/es4038325. [DOI] [PubMed] [Google Scholar]
- Gao Y.; Zhang Y. Formation and photochemical investigation of brown carbon by hydroxyacetone reactions with glycine and ammonium sulfate. RSC Adv. 2018, 8 (37), 20719–20725. 10.1039/C8RA02019A. [DOI] [PMC free article] [PubMed] [Google Scholar]
- Sharp J. R.; Grace D. N.; Ma S.; Woo J. L.; Galloway M. M. Competing Photochemical Effects in Aqueous Carbonyl/Ammonium Brown Carbon Systems. ACS Earth Space Chem. 2021, 5, 1902. 10.1021/acsearthspacechem.1c00165. [DOI] [Google Scholar]
- Bzdek B. R.; Reid J. P.; Cotterell M. I. Open questions on the physical properties of aerosols. Communications. Chemistry 2020, 3 (1), 105. 10.1038/s42004-020-00342-9. [DOI] [PMC free article] [PubMed] [Google Scholar]
- Zhang Y.; Apsokardu M. J.; Kerecman D. E.; Achtenhagen M.; Johnston M. V. Reaction Kinetics of Organic Aerosol Studied by Droplet Assisted Ionization: Enhanced Reactivity in Droplets Relative to Bulk Solution. J. Am. Soc. Mass Spectrom. 2021, 32 (1), 46–54. 10.1021/jasms.0c00057. [DOI] [PubMed] [Google Scholar]
- Li Z.; Schwier A. N.; Sareen N.; McNeill V. F. Reactive processing of formaldehyde and acetaldehyde in aqueous aerosol mimics: surface tension depression and secondary organic products. Atmos. Chem. Phys. 2011, 11 (22), 11617–11629. 10.5194/acp-11-11617-2011. [DOI] [Google Scholar]
- Sareen N.; Schwier A. N.; Shapiro E. L.; Mitroo D.; McNeill V. F. Secondary organic material formed by methylglyoxal in aqueous aerosol mimics. Atmos. Chem. Phys. 2010, 10, 997–1016. 10.5194/acp-10-997-2010. [DOI] [Google Scholar]
- De Haan D. O.; Corrigan A. L.; Smith K. W.; Stroik D. R.; Turley J. T.; Lee F. E.; Tolbert M. A.; Jimenez J. L.; Cordova K. E.; Ferrell G. R. Secondary organic aerosol-forming reactions of glyoxal with amino acids. Environ. Sci. Technol. 2009, 43 (8), 2818–2824. 10.1021/es803534f. [DOI] [PubMed] [Google Scholar]
- Rodriguez A. A.; Rafla M. A.; Welsh H. G.; Pennington E. A.; Casar J. R.; Hawkins L. N.; Jimenez N. G.; de Loera A.; Stewart D. R.; Rojas A.; Tran M.-K.; Lin P.; Laskin A.; Formenti P.; Cazaunau M.; Pangui E.; Doussin J.-F.; De Haan D. O. Kinetics, Products, and Brown Carbon Formation by Aqueous-Phase Reactions of Glycolaldehyde with Atmospheric Amines and Ammonium Sulfate. J. Phys. Chem. A 2022, 126 (32), 5375–5385. 10.1021/acs.jpca.2c02606. [DOI] [PMC free article] [PubMed] [Google Scholar]
- Zhao R.; Lee A. K. Y.; Huang L.; Li X.; Yang F.; Abbatt J. P. D. Photochemical processing of aqueous atmospheric brown carbon. Atmos. Chem. Phys. 2015, 15 (11), 6087–6100. 10.5194/acp-15-6087-2015. [DOI] [Google Scholar]
- Aiona P. K.; Lee H. J.; Leslie R.; Lin P.; Laskin A.; Laskin J.; Nizkorodov S. A. Photochemistry of Products of the Aqueous Reaction of Methylglyoxal with Ammonium Sulfate. ACS Earth and Space Chemistry 2017, 1 (8), 522–532. 10.1021/acsearthspacechem.7b00075. [DOI] [Google Scholar]
- Harrison A. W.; Waterson A. M.; De Bruyn W. J. Spectroscopic and Photochemical Properties of Secondary Brown Carbon from Aqueous Reactions of Methylglyoxal. ACS Earth and Space Chemistry 2020, 4 (5), 762–773. 10.1021/acsearthspacechem.0c00061. [DOI] [Google Scholar]
- De Haan D. O.; Hawkins L. N.; Welsh H. G.; Pednekar R.; Casar J. R.; Pennington E. A.; de Loera A.; Jimenez N. G.; Symons M. A.; Zauscher M.; Pajunoja A.; Caponi L.; Cazaunau M.; Formenti P.; Gratien A.; Pangui E.; Doussin J. F. Brown carbon production in ammonium- or amine-containing aerosol particles by reactive uptake of methylglyoxal and photolytic cloud cycling. Environ. Sci. Technol. 2017, 51 (13), 7458–7466. 10.1021/acs.est.7b00159. [DOI] [PubMed] [Google Scholar]
- Jimenez N. G.; Sharp K. D.; Gramyk T.; Ugland D. Z.; Tran M.-K.; Rojas A.; Rafla M. A.; Stewart D.; Galloway M. M.; Lin P.; Laskin A.; Cazaunau M.; Pangui E.; Doussin J.-F.; De Haan D. O. Radical-Initiated Brown Carbon Formation in Sunlit Carbonyl–Amine–Ammonium Sulfate Mixtures and Aqueous Aerosol Particles. ACS Earth and Space Chemistry 2022, 6, 228–238. 10.1021/acsearthspacechem.1c00395. [DOI] [Google Scholar]
- Gordon B. P.; Moore F. G.; Scatena L. F.; Valley N. A.; Wren S. N.; Richmond G. L. Model Behavior: Characterization of Hydroxyacetone at the Air–Water Interface Using Experimental and Computational Vibrational Sum Frequency Spectroscopy. J. Phys. Chem. A 2018, 122 (15), 3837–3849. 10.1021/acs.jpca.8b01193. [DOI] [PubMed] [Google Scholar]
- De Haan D. O.; Tolbert M. A.; Jimenez J. L. Atmospheric condensed-phase reactions of glyoxal with methylamine. Geophys. Res. Lett. 2009, 36, L11819. 10.1029/2009GL037441. [DOI] [Google Scholar]
- Noziere B.; Dziedzic P.; Cordova A. Products and kinetics of the liquid-phase reaction of glyoxal catalyzed by ammonium ions (NH4+). J. Phys. Chem. A 2009, 113 (1), 231–237. 10.1021/jp8078293. [DOI] [PubMed] [Google Scholar]
- Yu G.; Bayer A. R.; Galloway M. M.; Korshavn K. J.; Fry C. G.; Keutsch F. N. Glyoxal in aqueous ammonium sulfate solutions: products, kinetics, and hydration effects. Environ. Sci. Technol. 2011, 45, 6336–6342. 10.1021/es200989n. [DOI] [PubMed] [Google Scholar]
- Kampf C. J.; Jakob R.; Hoffmann T. Identification and characterization of aging products in the glyoxal/ammonium sulfate system -- implications for light-absorbing material in atmospheric aerosols. Atmos. Chem. Phys. 2012, 12, 6323–6333. 10.5194/acp-12-6323-2012. [DOI] [Google Scholar]
- Noziere B.; Cordova A. A kinetic and mechanistic study of the amino acid catalyzed aldol condensation of acetaldehyde in aqueous and salt solutions. J. Phys. Chem. A 2008, 112 (13), 2827–2837. 10.1021/jp7096845. [DOI] [PubMed] [Google Scholar]
- Sedehi N.; Takano H.; Blasic V. A.; Sullivan K. A.; De Haan D. O. Temperature- and pH-dependent aqueous-phase kinetics of the reactions of glyoxal and methylglyoxal with atmospheric amines and ammonium sulfate. Atmos. Environ. 2013, 77, 656–663. 10.1016/j.atmosenv.2013.05.070. [DOI] [Google Scholar]
- Glushonok G. K.; Glushonok T. G.; Maslovskaya L. A.; Shadyro O. I. A 1H and 13C NMR and UV study of the state of hydroxyacetone in aqueous solutions. Russ. J. Gen. Chem. 2003, 73 (7), 1027–1031. 10.1023/B:RUGC.0000007604.91106.60. [DOI] [Google Scholar]
- Wang J.; Doussin J. F.; Perrier S.; Perraudin E.; Katrib Y.; Pangui E.; Picquet-Varrault B. Design of a new multi-phase experimental simulation chamber for atmospheric photosmog, aerosol and cloud chemistry research. Atmos. Meas. Technol. 2011, 4, 2465–2494. 10.5194/amt-4-2465-2011. [DOI] [Google Scholar]
- Picquet-Varrault B.Eurochamp-2: Integration of European Simulation Chambers for Investigating Atmospheric Processes; Mediterranean Center for Environmental Studies (CEAM): Valencia, Spain, 2010. [Google Scholar]
- De Haan D. O.; Tapavicza E.; Riva M.; Cui T.; Surratt J.; Smith A. C.; Jordan M.-C.; Nilakantan S.; Almodovar M.; Stewart T. N.; de Loera A.; De Haan A. C.; Cazaunau M.; Gratien A.; Pangui E.; Doussin J. F. Nitrogen-containing, light-absorbing oligomers produced in aerosol particles exposed to methylglyoxal, photolysis, and cloud cycling. Environ. Sci. Technol. 2018, 52 (7), 4061–4071. 10.1021/acs.est.7b06105. [DOI] [PubMed] [Google Scholar]
- Ervens B.; George C.; Williams J. E.; Buxton G. V.; Salmon G. A.; Bydder M.; Wilkinson F.; Dentener F.; Mirabel P.; Wolke R.; Herrmann H. CAPRAM 2.4 (MODAC mechanism): An extended and condensed tropospheric aqueous phase mechanism and its application. Journal of Geophysical Research: Atmospheres 2003, 108 (D14), 4426. 10.1029/2002JD002202. [DOI] [Google Scholar]
- Kroll J. H.; Ng N. L.; Murphy S. M.; Varutbangkul V.; Flagan R. C.; Seinfeld J. H. Chamber studies of secondary organic aerosol growth by reactive uptake of simple carbonyl compounds. J. Geophys. Res. 2005, 110, D23207. 10.1029/2005JD006004. [DOI] [Google Scholar]
- De Haan D. O.; Hawkins L. N.; Weber J. A.; Moul B. T.; Hui S.; Cox S. A.; Esse J. U.; Skochdopole N. R.; Lynch C. P.; Le C.; Cazaunau M.; Bergé A.; Pangui E.; Heuser J.; Doussin J.-F.; Picquet-Varrault B. Multiphase Guaiacol Photooxidation: Fenton Reactions, Brown Carbon, and Secondary Organic Aerosol Formation in Suspended Aerosol Particles. ACS ES&T Air 2024, 1 (5), 346–356. 10.1021/acsestair.3c00057. [DOI] [Google Scholar]
- Bedjanian Y. Temperature-Dependent Kinetic Study of the Reaction of Hydroxyl Radicals with Hydroxyacetone. J. Phys. Chem. A 2020, 124 (14), 2863–2870. 10.1021/acs.jpca.0c00429. [DOI] [PubMed] [Google Scholar]
- Vu N. D.; Khamaganov V.; Nguyen V. S.; Carl S. A.; Peeters J. Absolute Rate Coefficient of the Gas-Phase Reaction between Hydroxyl Radical (OH) and Hydroxyacetone: Investigating the Effects of Temperature and Pressure. J. Phys. Chem. A 2013, 117 (47), 12208–12215. 10.1021/jp407701z. [DOI] [PubMed] [Google Scholar]
- Dillon T. J.; Horowitz A.; Hölscher D.; Crowley J. N.; Vereecken L.; Peeters J. Reaction of HO with hydroxyacetone (HOCH2C(O)CH3): rate coefficients (233–363 K) and mechanism. Phys. Chem. Chem. Phys. 2006, 8 (2), 236–246. 10.1039/B513056E. [DOI] [PubMed] [Google Scholar]
- Mikhailov E.; Vlasenko S.; Martin S. T.; Koop T.; Pöschl U. Amorphous and crystalline aerosol particles interacting with water vapor: conceptual framework and experimental evidence for restructuring, phase transitions and kinetic limitations. Atmos. Chem. Phys. 2009, 9 (24), 9491–9522. 10.5194/acp-9-9491-2009. [DOI] [Google Scholar]
- Novotny O.; Cejpek K.; Velisek J. Formation of α-hydroxycarbonyl and α-dicarbonyl compounds during degradation of monosaccharides. Czech Journal of Food Sciences 2007, 25 (3), 119–130. 10.17221/740-CJFS. [DOI] [Google Scholar]
- Hawkins L. N.; Welsh H. G.; Alexander M. V. Evidence for pyrazine-based chromophores in cloud water mimics containing methylglyoxal and ammonium sulfate. Atmos. Chem. Phys. 2018, 18 (16), 12413–12431. 10.5194/acp-18-12413-2018. [DOI] [Google Scholar]
- Galloway M. M.; Chhabra P. S.; Chan A. W. H.; Surratt J. D.; Flagan R. C.; Seinfeld J. H.; Keutsch F. N. Glyoxal uptake on ammonium sulphate seed aerosol: reaction products and reversibility of uptake under dark and irradiated conditions. Atmos. Chem. Phys. 2009, 9, 3331–3345. 10.5194/acp-9-3331-2009. [DOI] [Google Scholar]
- Zhou X.; Huang G. Measurement of Atmospheric Hydroxyacetone, Glycolaldehyde, and Formaldehyde. Environ. Sci. Technol. 2009, 43 (8), 2753–2759. 10.1021/es803025g. [DOI] [PubMed] [Google Scholar]
- Kawamura K.; Okuzawa K.; Aggarwal S. G.; Irie H.; Kanaya Y.; Wang Z. Determination of gaseous and particulate carbonyls (glycolaldehyde, hydroxyacetone, glyoxal, methylglyoxal, nonanal and decanal) in the atmosphere at Mt. Tai. Atmos. Chem. Phys. 2013, 13 (10), 5369–5380. 10.5194/acp-13-5369-2013. [DOI] [Google Scholar]
- St. Clair J. M.; Spencer K. M.; Beaver M. R.; Crounse J. D.; Paulot F.; Wennberg P. O. Quantification of hydroxyacetone and glycolaldehyde using chemical ionization mass spectrometry. Atmos. Chem. Phys. 2014, 14 (8), 4251–4262. 10.5194/acp-14-4251-2014. [DOI] [Google Scholar]
- Qi L.; Chen M.; Stefenelli G.; Pospisilova V.; Tong Y.; Bertrand A.; Hueglin C.; Ge X.; Baltensperger U.; Prévôt A. S. H.; Slowik J. G. Organic aerosol source apportionment in Zurich using an extractive electrospray ionization time-of-flight mass spectrometer (EESI-TOF-MS) – Part 2: Biomass burning influences in winter. Atmos. Chem. Phys. 2019, 19 (12), 8037–8062. 10.5194/acp-19-8037-2019. [DOI] [Google Scholar]
- Xu R.; Thornton J. A.; Lee B. H.; Zhang Y.; Jaeglé L.; Lopez-Hilfiker F. D.; Rantala P.; Petäjä T. Global simulations of monoterpene-derived peroxy radical fates and the distributions of highly oxygenated organic molecules (HOMs) and accretion products. Atmos. Chem. Phys. 2022, 22 (8), 5477–5494. 10.5194/acp-22-5477-2022. [DOI] [Google Scholar]
- Alage S.Investigations of highly oxygenated organic molecules (HOMs) in the laboratory and in the real atmosphere: ACROSS project. Ph.D. Thesis, Université Paris; - Est Créteil Val-de-Marne - Paris 12, Paris, France, 2023. [Google Scholar]
Associated Data
This section collects any data citations, data availability statements, or supplementary materials included in this article.
Supplementary Materials
Data Availability Statement
Concentration–time profiles for the large chamber experiments are freely accessible in.edf format through the chamber database at data.eurochamp.org maintained by AERIS for the benefit of ACTRIS ERIC. Expt. A: https://doi.org/10.25326/YRJG-ES08. Expt. B: https://doi.org/10.25326/D7Y1–S078. Expt C: https://doi.org/10.25326/4VYF-QG62. Expt. D: https://doi.org/10.25326/78ZM-8T09. Expt. E: https://doi.org/10.25326/9C7C-X242.


