

Abstract
Background
Age-related macular degeneration (AMD), is a neurodegenerative ocular disease. This study investigated the role of ferroptosis-related genes and their interaction with immune cell infiltration in AMD.
Methods
We screened differential expression genes (DEGs) of AMD from data sets in Gene Expression Omnibus. We identified ferroptosis-related differentially expressed genes (ferroDEGs) by intersecting DEGs with ferroptosis-related genes. Protein–protein interactions network and Cytoscape were used for screening hub genes. Next, we analyzed immune cell infiltration using CIBERSORT and examined the crosstalk between hub ferroDEGs and immune cell infiltration. Hub genes expression in each cell cluster and the proportions of different cell clusters between AMD and normal samples were examined using single-cell data. The hub ferroDEG expressions were verified in cell and mouse models using RT–qPCR, western blot, and immunofluorescence assay. The roles of ANXA1 in ferroptosis and its crosstalk with microglia were investigated.
Results
We identified hub ferroDEGs that include six genes (ANXA1, DKK1, CD44, VIM, TGFB2, DUSP1). Functional analysis of those hub ferroDEGs was found to be correlated with leukocyte migration and chemotaxis, macrophage migration, and gliogenesis. The high-risk ferroptosis group exhibited elevated levels of CD8+ T cells, activated NK cells, and M2 macrophages. Single-cell sequencing data revealed a high degree of cell heterogeneity in macular degeneration and the monocytes proportion in the macular area was higher in AMD samples. Moreover, we observed elevated mRNA and protein levels of CD44, ANXA1 (P < 0.01), while ANXA1 knockdown reduced GPX4 expression in the cell model. Finally, we validated increased ANXA1 expression and observed its colocalization with microglia in mouse models using immunofluorescence assays.
Conclusions
This study offers insights into the AMD pathogenesis and identifies ANXA1 as a potential target related to protecting from ferroptosis and immune response for future research.
Graphical Abstract

Supplementary Information
The online version contains supplementary material available at 10.1186/s40001-024-02163-1.
Keywords: Age-related macular degeneration, Ferroptosis, Immune cell infiltration, ANXA1
Introduction
Age-related macular degeneration (AMD) is a neurodegenerative disease that significantly impairs vision in the elderly [1]. It is projected to affect around 288 million people in Western countries by 2040 [2, 3], with even more Asians impacted than the rest of the world combined by 2050 [4]. AMD has two forms: neovascular AMD and non-neovascular AMD. Neovascular AMD is characterized by abnormal blood vessels that invade the subretinal space, causing edema and bleeding. In contrast, non-neovascular AMD features abnormal pigmentation and degeneration of the retinal pigment epithelium (RPE), known as geographic atrophy. Although neovascular AMD can be treated by anti-vascular endothelial growth factor injections [5], no treatment is currently available for non-neovascular forms. Various risk factors contribute to AMD, including aging, genetic factors, environmental influences, and epigenetic changes that lead to cell death [6, 7]. Although the pathogenesis of AMD is not thoroughly understood, it is well known that oxidative-stress-mediated RPE cell death is strongly implicated in AMD pathogenesis [8]. Cell death mechanisms, including apoptosis, necroptosis, pyroptosis, and autophagy, contribute to AMD development [9–11]. Ferroptosis is characteristic of an iron-dependent accumulation of lipid peroxides [12]. Although numerous studies have reported that iron accumulation in RPE cells contributes to the development of AMD [13–17], the specific mechanisms remain poorly understood. Therefore, AMD-specific ferroptosis-related genes (FRGs) and their potential roles in AMD pathogenesis warrant further investigation. In addition, immune cell infiltration, such as lymphocytes and mononuclear phagocytes [18], mast cells [19], and macrophages [20], has been implicated in the AMD progression, highlighting immunomodulatory targets or immunotherapy as emerging trends for AMD treatment. However, the main immune cell type involved in the pathogenesis of AMD is still not clearly identified.
Herein, we aimed to thoroughly describe the expression patterns of FRGs in AMD, and explore the correlation between FRGs and immune cell infiltration at a single-cell and transcriptional level. It could provide new insights into the mechanism of AMD, aiding further investigation.
Methods
Data acquisition and preprocessing
We obtained data sets GSE125564 [21] and GSE29801 [22], which were derived from Homo sapiens samples. The microarray data set GSE125564 was performed on GPL23159. The data set includes seven samples: four diagnosed with AMD and three without. All samples were derived from iPS-derived RPE human donors. The microarray data set GSE29801 was performed on GPL4133. 175 samples were derived from RPE /choroid and 118 from the retina in the macular or extra-macular region (including those without reported eye diseases, possible preclinical AMD, or AMD). This study included 60 samples, comprising 28 normal samples and 32 AMD samples. We also downloaded the single-cell transcriptome sequencing (sc-RNAseq) data set GSE135922 [23, 24] from the GEO website. This data set contains samples from Homo sapiens and was performed on Illumina Hi-Seq 4000 (Homo sapiens). We selected macular and peripheral samples of RPE and choroid tissue from donors 1–7 in the data set, including 2 AMD samples and 5 normal samples (samples 3–4 are AMD samples, donors 1–2 and 5–7 are normal samples). The data set includes two sequencing experiments, with donors 1–3 from the first experiment (no enrichment treatment) and donors 4–7 from the second experiment (CD31 magnetic bead enrichment treatment). A total of 14 samples were enrolled. Supplementary Table S1 provides detailed information on data sets from GEO.
Differential expression analysis of transcriptional data
First, we installed the R package (V4.2.0) and downloaded the two data sets (GSE125564 and GSE29801). The data generated from GSE125564 and GSE29801 were normalized and merged by batch correction using the sva package in R [25] (v3.44.0). We utilized the limma package [26] (v3.52.1) to examine differential expression between the AMD and normal samples. The significance threshold was defined as logFoldChange (logFC) of 0.5 and a P value below 0.05.
Functional enrichment analysis
Gene ontology [27] (GO) analysis was performed for functional enrichment of genes at various dimensions. The algorithm calculates the significance of differential gene enrichment for each GO term using the hypergeometric distribution. The results provide a P value indicating the significance of enrichment, with lower values indicating higher statistical significance. Kyoto Encyclopedia of Genes and Genomes [28] (KEGG) pathway enrichment analysis utilized a hypergeometric distribution test, identifying pathways with P < 0.05 as significantly enriched.
Immune scoring
We utilized the estimate package [29] (version 1.0.13) to calculate the stromal score, immune score, and estimate score for each sample. These scores represent stromal cell scores, immune cell scores, and combined stromal–immune cell scores, respectively. First, we employed the filterCommonGenes function to integrate the varying gene counts from each platform. This was done using 10,412 common genes. We utilized the estimateScore function to compute the stromal, immune, and estimate scores for each sample. The median immune score was used as the cutoff value to distinguish between high and low immune score groups. Differential analysis between the two groups was conducted using the limma package (v3.52.1) with a fold change threshold of 0.5 and a P value < 0.05. We generated box plots to exhibit the immune scores between AMD and the control. Differential gene expression between high and low immune score groups was visualized using heatmaps and volcano plots.
Protein–protein interaction network (PPI)
We obtained 653 FRGs from the GeneCards database and 933 FRGs from the FerrDb database [30]. After taking the union and removing duplicates, we obtained 1354 FRGs (Supplementary Table S2). We identified ferroptosis-related differentially expressed genes (ferroDEGs) by overlapping differentially expressed genes (DEGs) with FRGs. We conducted PPI analysis on these genes via the STRING database [31] and visualized the hub genes using Cytoscape software [32] (version 3.9.1). The ROC curve was plotted using the pROC package (version 3.44.0) [33].
GSEA (gene set enrichment analysis)
GSEA [34] analyzes the difference in pathway and biological process activities. We utilized the clusterProfiler package [35] (version 4.4.3) to conduct enrichment analysis on all genes from the GO and KEGG databases. We set parameters with a minimum of 10 genes, a maximum of 500 genes, and applied P value correction using the Benjamini–Hochberg method. Gene sets obtained from OrgDB and KEGG databases showed significant enrichment with P values < 0.05.
GSVA (gene set variation analysis)
GSVA [36] algorithm is non-parametric and unsupervised. We downloaded the msigdb.v7.0.symbols.gmt file from the MSigDB [37] (Molecular Signatures Database) database. We used the "gsva" method from the GSVA package [36] (version 1.44.5) in R to analyze the merged and batch-corrected data sets of GSE29801 and GSE125564. GSVA converts multiple gene expressions into a signature gene expression matrix. For each pathway, a rank statistic based on the Kolmogorov–Smirnov test is calculated, and the expression matrix is transformed into an Enrichment Score (ES) matrix representing the enrichment of each pathway in each cell. GSVA analysis was conducted using the GSVA package [36] (version 1.44.5), followed by differential analysis with the limma package [26] (version 3.52.1) to identify significantly different pathways (P < 0.05). The threshold was defined as FoldChange > 0.5 and P < 0.05. The pheatmap package (version 1.0.12) was applied to visualize the results.
Immune cell infiltration analysis
We converted the combined batch removal data sets of GSE29801 and GSE125564 into the proportion of immune cells using CIBERSORT [38] to evaluate 22 human immune cell subsets. The total of all estimated immune cell type scores for each sample equals 1 cell subpopulation.
Quality control of single-cell data using Seurat
Using the Seurat [39] package (version 4.1.1) in R, we imported the result matrix of the single-cell data set of 14 samples and created a Seurat object for this analysis. We filtered out cells with mitochondrial gene content > 20%, hemoglobin gene content > 3, minimum gene expression < 200, and maximum gene expression > 3000. We then identified genes with the highest variance across individual cells and performed data normalization. Next, principal component analysis (PCA) was run using highly variable genes as input, and significant principal components were screened by the ElbowPlot function. We selected the top 10 principal components as significant inputs for t-distributed stochastic neighbor embedding (t-SNE). We examined the distributions of t-SNE and PCA among these cells and compared the correlation between unique molecular identifier counts and the number of genes among cells.
Single-cell clustering analysis and cell type annotation
We applied the FindClusters function to cluster the cells. The resolution parameter was set to the default value for analyzing the entire data set. The parameter was set to 0.9 for a separate analysis of the AMD and the control. We visualized the clusters using t-SNE. We further identified differential markers between cell clusters. We used the HumanPrimaryCellAtlasData data set from the R package SingleR [40] (version 1.10.0) for cell type annotation of the single-cell data. We then examined the marker expression in each cluster and compared the proportions of different cell clusters between different samples.
Cell culture, transfection, and treatment
ARPE-19 cells were maintained at 37 °C in DMEM/F12 medium containing 10% fetal bovine serum and 1% penicillin–streptomycin (Gibco). For each experiment, we seeded 2.5 × 10⁵ cells per well in 6-well plates or 5 × 10⁵ cells per well in 6 cm dishes. For transfection, we cultured ARPE-19 cells to approximately 50% confluence in a 6-well plate. Then, we transfected the cells with 100 nM small interfering RNA (siRNA), targeting either the negative control (NC) siRNA (si-NC) or si-ANXA1, using the riboFECT™ CP Transfection kit (Guangzhou RiboBio Co., Ltd.). si-ANXA1 sense (5′–3′): GGACUUUGGUGUGAAUGAA, antisense (5′–3′): UUCAUUCACACCAAAGUCC. We conducted subsequent experiments 48 h after transfection. For treatment, ARPE-19 cells were treated with sodium iodate (NaIO3, SI) (dissolved in 1X PBS, 10 mM) for 24 h to generate an oxidative-stress cell model of AMD.
Quantitative real-time PCR (RT–qPCR)
We extracted RNA from cells using TRIzol Reagent (Invitrogen, USA). We synthesized RNA into cDNA. RT–qPCR was performed using the SYBR Premix Ex Taq II kit (Takara) and the Bio-rad CFX96 system were applied for RT–qPCR. Data were normalized to β-actin. Relative expression was determined using the 2−△△Ct method. Supplementary Table S3 lists the primers.
Western blot
We extracted whole proteins and loaded equal amounts from all samples into SDS–PAGE gels. The proteins were then transferred onto an activated PVDF membrane (Millipore, Bedford, USA). Following blocking, the membranes were incubated with primary antibodies and correspondent secondary antibodies and finally developed using ECL solutions (Fdbio Science) with chemiluminescence instrument (Tanon, Shanghai, China). Relative protein density was calculated using ImageJ from three replicates. The primary antibodies used are as follows: anti-HO-1 (A19062; 35 kDa; 1:2000; Abclonal), anti-GPX4 (A11243; 17 kDa; 1:1000; Abclonal), anti-ANXA1(21,990–1-AP; 37 kDa; 1:5000; Proteintech), anti-CD44 (#DF6392; 82 kDa; 1:1000; affinity), anti-rabbit IgG (#7074S; 1:2000; Cell Signaling).
Immunocytochemistry analysis
ARPE-19 cells were plated onto circular sterile coverslips in 24-well plates. We fixed the cells with 4% PFA for 15 min, followed by blocking and permeabilization with normal goat serum and 0.1% TritonX-100. Cells were incubated overnight at 4 °C with a primary antibody against ANXA1 (21,990–1-AP; 1:200; Proteintech). Subsequently, cells were treated with the secondary antibody anti-rabbit IgG (H&L) Alexa Fluor 555 (Abcam, ab150078), and DAPI (Invitrogen) for nucleus visualization. Fluorescence photos were obtained by fluorescence microscope (LSM980, Zeiss).
Animal treatment
The Zhongshan Ophthalmic Center Animal Ethics Committee approved the animal experiments (approval number: O2021046). We housed 6–8-week-old C57BL/6 J mice in a specific pathogen-free (SPF) room with a 12-h light–dark cycle. We dissolved solid sodium iodate (SI) in sterile phosphate-buffered saline (PBS) and then used for tail vein injection at 20 mg/kg. The equivalent volume of PBS was administrated to the control group. The experiments were conducted with three mice per group. Mice were performed for examination or subsequent experiments 7 days after injections.
Optical coherence technology (OCT) and autofluorescence (AF)
Fundus AF images were obtained using a confocal scanning laser ophthalmoscope. SD–OCT examinations for mouse eyes were also performed with an HRA + OCT device. We applied a 1% carboxymethylcellulose sodium gel to keep the mice's eyes moist and used a custom-built head holder to maintain moisture. Images were captured using the standard 30° field model. Tobramycin eye ointment was applied to prevent eye dryness.
Hematoxylin–eosin (H&E)
Mice were euthanized, and their eyes were preserved in 4% paraformaldehyde. After dehydration and embedding, the eye tissue was sliced into 4 μm thick sections cross optic nerve. The slices were stained with H&E to visualize eyeball morphology. Photographs were taken using an optical microscope.
Transmission electron microscope (TEM)
TEM was employed to examine the mitochondria of RPE tissues. Initially, the tissues were preserved in a 2.5% glutaraldehyde solution overnight at 4 °C. Subsequent to this fixation step, the samples were treated with 1% osmium tetroxide and uranyl acetate for further processing. The dehydration of the tissues was achieved using ethanol, followed by embedding them in epoxy resin. For enhanced visualization, the samples were stained with uranyl acetate and lead citrate. Ultimately, the ultrathin sections of the specimens were analyzed using a TEM (Tecnai Spirit, Netherlands).
Immunofluorescence assay for cryosections and RPE flat mount
Mice were euthanized, and their eyes were fixed in 4% paraformaldehyde overnight. For cryosection, fixed eyeballs were embedded in OCT (Ted Pella Inc.) and cut into 10 μm thick sections after complete dehydration. For RPE flat mounts, we removed the anterior segment, lens, and retina. The cryosections or RPE flat mounts were incubated with either rabbit or mouse anti-ANXA1 (21,990–1-AP, 1:200, Proteintech; 66,344–1-Ig, 1:200, Proteintech), rabbit monoclonal anti-IBA1 (ab178846, 1:200, Abcam), followed by incubation with Alexa Fluor 555-conjugated, goat anti-rabbit IgG antibodies (#4413, 1:1000, Cell Signalling) or Alexa Fluor 488-conjugated, goat anti-mouse IgG antibodies (#4408, 1:1000, Cell Signalling). The nucleus was stained with DAPI (Invitrogen, 1:100). Fluorescence images were acquired by a confocal fluorescence microscope (LSM980, Zeiss).
Statistical analysis
Data calculations were performed using R software (version 4.2.0), while experimental data were analyzed with GraphPad Prism 8. For most experiments, two-tailed unpaired t tests were performed to statistically calculate differences between groups. A P value less than 0.05 was deemed statistically significant.
Results
Enrichment analysis of DEGs and immune scores in AMD
We identified 46 DEGs (42 upregulated and 4 downregulated) by analyzing the merged and batch-corrected data sets of GSE29801 and GSE125564. The overall design of this study is available in Fig. 1. We then conducted GO/KEGG enrichment analysis for those DEGs. The GO enrichment results ranked each term in descending order based on the number of counts (Supplementary Table S4). The top 10 terms from the three major functional categories were visualized using a bar plot (Fig. 2A). The KEGG enrichment analysis mainly involved pathways such as complement and coagulation cascades, and glutathione metabolism (Fig. 2B, Supplementary Table S4). We then used ESTIMATE to calculate immune scores and performed a differential analysis of immune scores between the AMD and the control. The results indicated significant differences in the stromal score (P = 0.02) and estimate score (P < 0.035) between the AMD and the control, while there was no significant difference in the immune score (P = 0.16) (Fig. 2C–E). Heatmaps and volcano plots visualized the differential gene expression between the high and low immune score groups (Fig. 2F, G).
Fig. 1.

Flowchart of study design
Fig. 2.

GO, KEGG enrichment analysis and immune score. A Gene ontology (GO) in BP (Biological Process), MF (Molecular Function) and CC (Cellular Component). B Enrichment results of KEGG. C Box plots showing differences in stromal scores between the AMD and the control. D Box plots showing differences in immune score between the AMD and the control. E Box plots showing differences in estimated scores between the AMD and the control. F Heatmap of DEGs between the high- and low-immune score group, with green representing the high immune score group and red representing the low immune score group. G Volcano between the high- and low-immune score group, with blue referring to down-regulated genes, red for up-regulated genes, and gray for genes with no significance
Expression profiling of FRGs in AMD
The heatmap illustrating the expression of FRGs in AMD patients compared to controls is shown in Fig. 3A. Then, the intersection of the top 500 FRGs in the GeneCards database and DEGs from the AMD and the control were selected. Ultimately, we identified seven overlapping genes (ATF3, DKK1, GPX3, FZD7, CD44, ANXA1 and HP). We plotted boxplots of the top six genes to compare their expression between the AMD and the control (Fig. 3B–G), of which, the expression of DKK1, GPX3, FZD7, and ANXA1 was upregulated. To determine the chromosomal distribution of FRGs, we randomly selected 500 genes and plotted their locations on the chromosomes (Fig. 3H).
Fig. 3.

Expression profiling of ferroptosis-related genes (FRGs). A Heatmap of FRGs between AMD and the control, with green representing the control group and red representing the AMD group. B–G Box diagram of expression of FRGs (ATF3, DKK1, GPX3, FZD7, CD44, ANXA1) between the AMD and the control. H Chromosome distribution of FRGs. The orange square represents the pseudogene, the green circle for processed transcripts, and the purple triangle for mRNA. The corresponding band's color represents the gene's expression level, with red indicating down-regulated genes and blue indicating up-regulated genes. ***P < 0.001, **P < 0.01, *P < 0.05, ns, no significance
Correlation analysis between FRGs and clinical features of AMD
We analyzed the clinical information of all patients in the data set to explore the correlation between FRGs and clinical features of AMD. Considering that age was not included in the GSE125564, we only extracted the clinical data from the GSE29801 data set including age and gender. Participants were categorized into youth and elderly groups based on the median age. We then generated a heatmap of the FRGs between different age and gender groups (Fig. 4A). We also analyzed the expression of the 6 overlapped genes in different groups. The results indicated significant differences in GPX3 (P = 0.002), FZD7 (P = 0.001), and ANXA1 (P = 0.033) between youth and elderly patients. In contrast, ATF3 (P = 0.11), DKK1 (P = 0.075), and CD44 (P = 0.089) did not show significant differences (Fig. 4B–G). There was no obvious difference in all the 6 genes in the gender group (Fig. 4H–M).
Fig. 4.

Correlation of differentially expressed ferroptosis-related genes (FRGs) and clinical signs. A Heat map of the differentially expressed FRGs in different age and gender groups. B–G Box diagram showed the expression of FRGs in age groups. H–M Box plots illustrating the expression of genes and the expression of FRGs in gender groups. ***P < 0.001, **P < 0.01, *P < 0.05, ns, no significance
Protein‐protein interaction (PPI) network analysis of FRGs
To clarify the role of FRGs in AMD, we first identified the intersection of DEGs and FRGs, termed ferroDEGs, and illustrated it with a Venn Diagram (Fig. 5A). We retained a total of 11 common genes (ATF3, CD44, FZD7, DUSP1, NNMT, ANXA1, DKK1, GPX3, HP, TGFB2, and VIM). These genes were subsequently analyzed for PPI construction (Fig. 5B). Hub genes were screened using Cytoscape software. We plotted ROC curves for the hub genes (ANXA1, DKK1, CD44, VIM, TGFB2, DUSP1) (Fig. 5C). The results indicated AUC values of 0.73 for ANXA1, 0.72 for TGFB2, and 0.78 for VIM.
Fig. 5.

Identification of hub genes related to ferroptosis. A Venn diagram illustrating intersection of FRGs and DEGs between AMD and the control. The blue circle represented FRGs, and the red circle represented differentially expressed genes between AMD and the control. B Protein–protein interaction network diagram, blue represents the up-regulated gene, yellow represents the down-regulated gene, the dot size represents the times the protein appears in the interaction, and the thickness of the connecting lines indicates the combined score. C ROC curves of 6 hub genes, with different colors representing different hub genes. PPI, Protein–protein interaction network. ROC, Receiver operating characteristic. FRGs, ferroptosis-related genes; DEG, differentially expressed genes
Functional enrichment analysis
We conducted GO and KEGG enrichment analyses of hub genes (Fig. 6A, B). The results indicated significant enrichment of GO terms, including myeloid leukocyte migration, leukocyte chemotaxis, regulation of cardiocyte differentiation, focal adhesion, cell-substrate junction, macrophage migration inhibitory factor receptor complex, and gliogenesis. KEGG analysis showed that microRNAs in cancer, Proteoglycans in cancer, and MAPK signaling pathway were significantly enriched. To elucidate ferroptosis's role across AMD stages, we analyzed the gene expression differences between high- and low-risk groups and conducted GSEA (Fig. 6C–F, Supplementary Table S5). The results showed significant enrichment in processes such as response to wounding, collagen-containing extracellular matrix, cell chemotaxis, wound healing, endoplasmic reticulum lumen, extracellular matrix organization, leishmaniasis, phagosome, TGF-beta signaling pathway, complement, and coagulation cascades. The results of GSVA (Supplementary Table S6) showed that 157 pathways were enriched (145 pathways were significantly upregulated and 12 pathways significantly downregulated). The heatmap of GSVA in high and low risk of ferroptosis is available in Fig. 6G.
Fig. 6.

Functional enrichment analysis. A GO in BP (Biological Process), MF (Molecular Function), and CC (Cellular Component). B Enrichment results of the KEGG. C–F Results of GSEA enrichment pathway. G Heatmap displays the GSVA analysis results across different ferroptosis. The green represents the high-risk group, and the red represents the low-risk group
Immune cell infiltration analysis
The correlation between various immune cells is shown in heatmap (Fig. 7A) and scatter plots (Fig. 7B–J). The heatmap and scatter plot revealed a significant negative correlation between Naive B cell infiltration and both CD4 Naive T cells (P < 0.001) and resting Mast cells (P < 0.001). In contrast, a significant positive correlation was observed with M2 macrophages (P < 0.002). The infiltration level of resting natural killer T cells was negatively correlated with CD4 Naive T cells (P < 0.001) and positively correlated with Naive B cells (P = 0.03). Resting mast cell infiltration was inversely associated with M2 macrophages (P < 0.001). Additionally, naive CD4 T cells exhibited a negative correlation with CD8 T cells (P < 0.001) and a positive correlation with activated NK cells (P < 0.001) We also compared immune cell differences between high- and low-risk ferroptosis groups. The results indicated that CD8 T cell (P < 0.026) and activated NK cell (P < 0.017) infiltration levels were significantly higher in the high-risk ferroptosis groups. The infiltration level of M2 macrophages also tended to increase in the high-risk ferroptosis groups, although the difference was not statistically significant (P = 0.059) (Fig. 7K–M).
Fig. 7.

Immune infiltration cell analysis. A Heat map of correlation between various immune cells. Blue represents a positive correlation and red represents a negative correlation. The size of the dots represents the correlation coefficient. B–J Scatter plot showed the correlation between the infiltration levels of different immune cells. The line in the middle represents the fitting curve of the two infiltration levels of corresponding immune cells. The gray shade represents the confidence interval, R represents the correlation coefficient, and p represents the statistical P value. K–M Box diagram showed the difference in the infiltration level of T cells CD8, NK cells activated, and Macrophages M2 immune cells between the high- and low-risk groups with ferroptosis. Dark blue represents the high-risk group and orange represents the low-risk group
The correlation analysis of Hub genes and immune cell infiltration
A scatter plot illustrating the relationship between hub genes and immune cells is presented in (Fig. 8). The results indicated an inverse relationship between DUSP1 expression and Plasma cell infiltration (P = 0.0095) (Fig. 8A). However, there was no significant association with activated dendritic cells (P = 0.11) (Fig. 8B) or M0 macrophages (P = 0.089) (Fig. 8C). DKK1 expression was inversely related to the infiltration level of memory B cells (P = 0.043) (Fig. 8D), with no significant association with activated NK cells (P = 0.06) (Fig. 8E) or Microphages M1 (Fig. 8F). VIM expression was inversely correlated with resting NK cells (P = 0.0098) (Fig. 8G) and M0 macrophages (P = 0.028) (Fig. 8I), but positively correlated with activated NK cell infiltration (P = 0.0026) (Fig. 8H). TGFB2 expression showed a positive correlation with the infiltration level of naive B cells (P = 0.0021) (Fig. 8J) and M1 macrophages (Fig. 8L), and a negative correlation with Memory B cells (P = 0.0011) (Fig. 8K). ANXA1 expression was negatively related to NK cells resting (P = 0.0034) (Fig. 8M), and positively with NK cells activated (P = 0.0003) (Fig. 8N). CD44 expression was positively related to T cell CD4 naive (P = 0.0098) (Fig. 8O) and NK cells activated (P = 0.0031) (Fig. 8Q) and was inversely related to NK cells resting (P = 0.02) (Fig. 8P) and Macrophages M0 (P = 0.046) (Fig. 8R).
Fig. 8.

Correlations between hub genes of ferroptosis and immune cell infiltration. A–R Scatter plot shows the correlation between hub genes and different levels of immune cell infiltration. The X-axis represents different hub genes, the Y-axis represents different levels of immune cell infiltration, and the line in the middle represents the fitting curve of corresponding immune markers and immune cell infiltration levels. The gray bands represent confidence intervals, R represents correlation coefficients, and P represents statistical P values
The first scRNA-seq data revealed a high degree of cell heterogeneity in AMD
In the first analysis of the experiment, a total of 3006 cells were obtained. The PCA dimension reduction is illustrated in Fig. 9A. t-SNE dimension reduction was applied to visualize 16 independent clusters (Fig. 9B). We subsequently analyzed the expression levels of hub genes across different cell groups in the control samples (Fig. 9C). To clarify the differences between cells in the AMD and the control, we performed separate analyses using the same method. In the first single-cell sequencing experiment data, donors 1 and 2 were in the control, and donor 3 was an AMD patient. The control included 4 samples from 2 donors. After filtering out doublets, 1766 cells were obtained. The PCA dimension reduction is shown in Fig. 9D. After data normalization, we used the top 10 principal components for clustering (Fig. 9E). Next, we analyzed the expression profiles of hub genes in each control cell group (Fig. 9F). Then, The AMD group from donor 3, which included 2 samples, underwent separate analyses using the same method. 1240 cells were finally obtained after filtering. PCA dimension reduction is shown in Fig. 9G. The top 10 principal components were used for clustering (Fig. 9H). We also analyzed the expression profiles of hub genes in each control cell group (Fig. 9I).
Fig. 9.
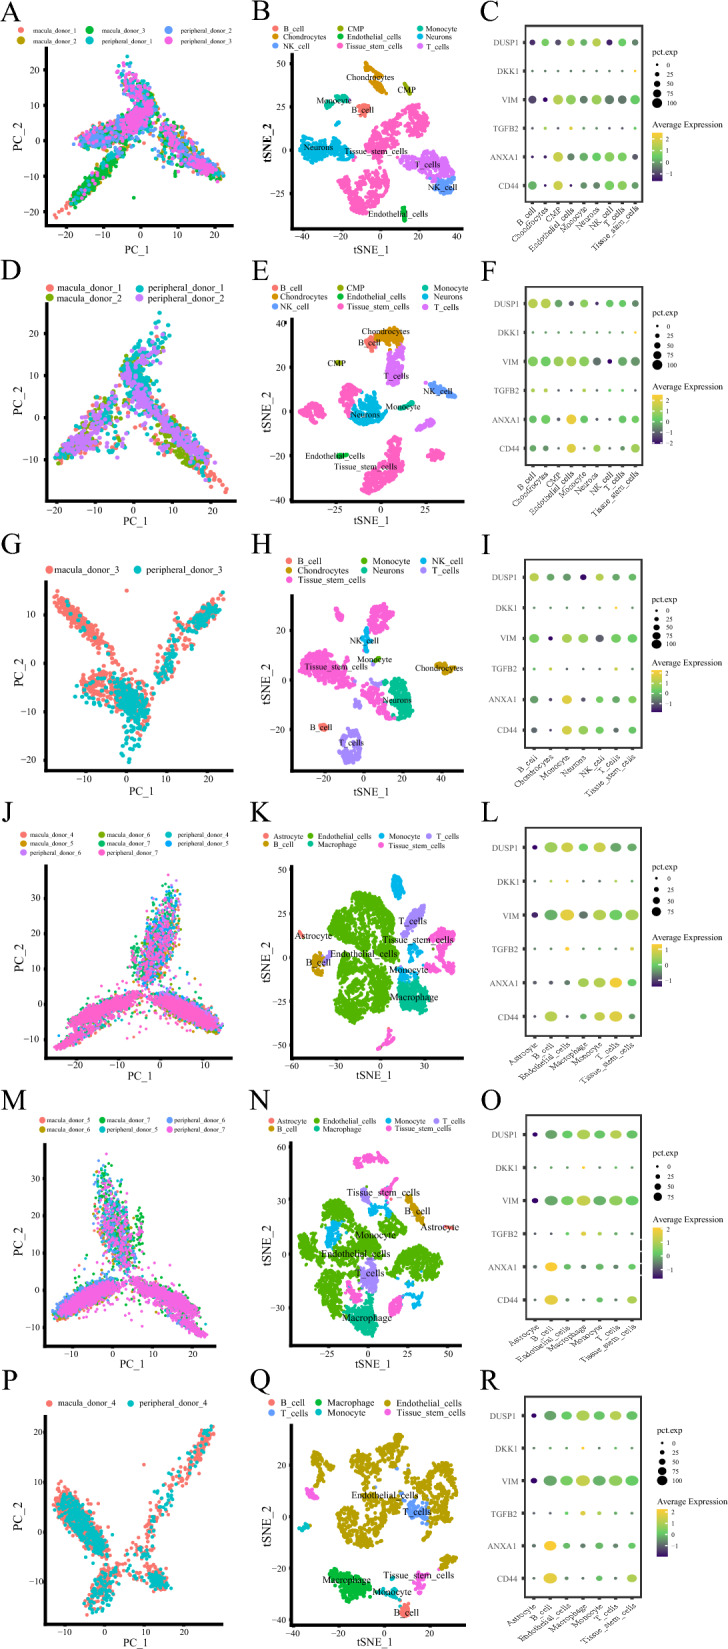
Expression of hub genes in the single-cell sequencing experiment. A, D, G Visualization of overall, normal, and disease samples after PCA dimensionality reduction in the first single-cell sequencing experiment, with different colors to label the samples. B, E, H tSNE distribution of different cell types in overall, normal, and disease samples in the first single-cell sequencing experiment, with different colors representing different cells. C, F, I Dot plots showing the expression of hub genes in different cell types in overall, normal, and disease samples in the first single-cell sequencing experiment, with yellow indicating high expression, blue indicating low expression, and the size of the dots representing the proportion of cells expressing the gene among all cells. J, M, P Visualization of overall, normal, and disease samples after PCA dimensionality reduction in the second single-cell sequencing experiment, with different colors used to label the samples. K, N, Q tSNE distribution of different cell types in overall, normal, and disease samples in the second single-cell sequencing experiment, with different colors representing different cells. L, O, R Dot plots showing the expression of hub genes in different cell types. in overall, normal, and disease samples in the second single-cell sequencing experiment, with yellow indicating high expression, blue indicating low expression, and the size of the dots representing the proportion of cells expressing the gene among all cells
The second scRNA-seq experiment data revealed a high degree of cellular heterogeneity in AMD
In the second experiment data analysis, we ultimately obtained 9,889 cells. We then extracted the top 3,000 highly variable genes for PCA dimension reduction (Fig. 9J). After data normalization, we used the top 10 principal components for clustering. t-SNE dimension reduction was applied to visualize 21 independent clusters (Fig. 9K). Subsequently, we analyzed the expression levels of hub genes across different cell groups (Fig. 9L). To clarify the differences of cells populations in the AMD and the control, we performed separate analyses on the disease and control groups using the same method. In the second single-cell sequencing experiment data, donors 5, 6, and 7 were in the control, and donor 4 was an AMD patient. The control included 6 samples from 3 donors. After filtering, 7663 cells were obtained. PCA dimension reduction is shown in Fig. 9M. We applied t-SNE dimensionality reduction to visualize 21 independent clusters (Fig. 9N). We then further studied the expression levels of hub genes in each cell group of the control (Fig. 9O). We then performed the same analysis on donor 4, an AMD patient, including 2 samples. After filtering we obtained 2226 cells. PCA dimensionality reduction is shown in Fig. 9P. We applied t-SNE dimensionality reduction to visualize 16 independent clusters (Fig. 9Q). We subsequently analyzed the expression levels of hub genes across different cell groups within the AMD cohort (Fig. 9R).
Changes in cell populations in AMD patients of the first scRNA-seq experiment
In the first single-cell sequencing experiment, we revealed the changes in cell populations in AMD patients (Fig. 10A–D). We extracted the top 10 DEGs for each cell population and plotted them as a heatmap (Fig. 10A). We also compared the proportions of each cell population in the overall, normal, and disease samples (Fig. 10B–D). Samples 1 and 2 in the first single-cell sequencing experiment were normal tissue samples; sample 3 was an AMD patient sample. The study found a lower proportion of T cells and NK cells, but a significantly higher proportion of neurons, in the macular area of AMD samples compared to normal samples.
Fig. 10.
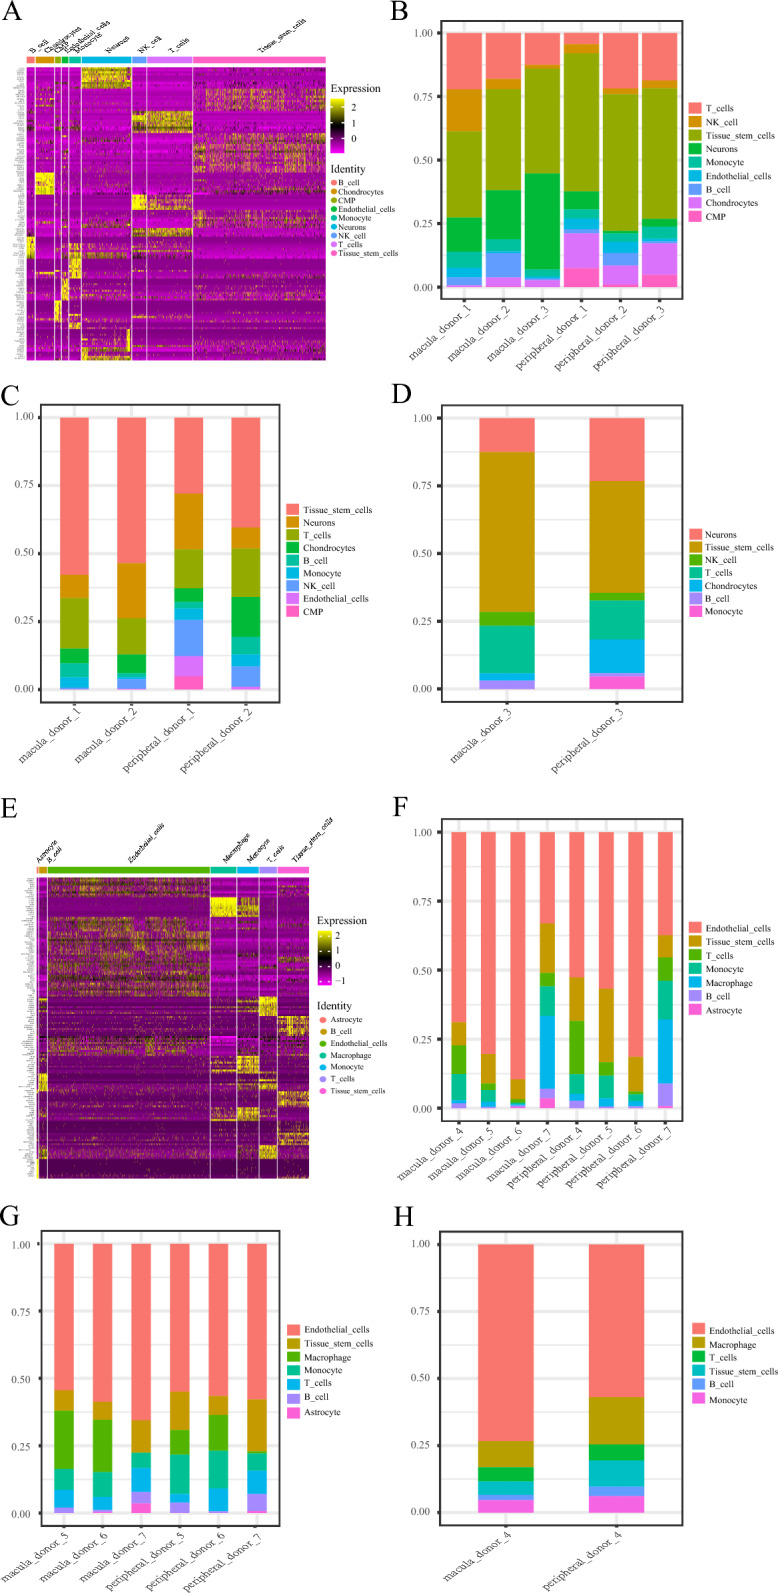
Changes of cell populations in single-cell sequencing data. A Heat map shows the top 10 specifically expressed genes of each cell population in the whole sample of the first single-cell sequencing experiment. Each color in the note represents a different cell population, and the left side is the gene name. Yellow represents up-regulated genes; purple represents down-regulated genes. B–D Bar chart shows the proportion of each cell population in the whole sample, normal sample, and disease sample in the first single-cell sequencing experiment, with different colors representing different cell populations. E Heat map showing the top 10 specifically expressed genes of each cell population in the whole sample in the second single-cell sequencing experiment. Each color in the note represents a different cell population, and the left side is the gene name. Yellow represents up-regulated genes; purple represents down-regulated genes. F, G, H Bar chart showing the proportion of each cell population in the whole sample, normal sample, and disease sample in the second single-cell sequencing experiment, with different colors representing different cell populations
Changes in cell populations in AMD patients of the second scRNA-seq experiment
The results of changes in cell populations in AMD patients in the second single-cell sequencing experiment are shown in Fig. 10E–H. We extracted the top 10 DEGs for each cell population and plotted them as a heatmap (Fig. 10E). We also compared the proportions of each cell population in the overall, normal, and disease samples (Fig. 10F–H). Sample 4 was an AMD patient sample, and samples 5–7 were normal tissue samples. The results of the second single-cell sequencing experiment indicated a significant increase in the proportion of endothelial cells in both the AMD and control groups. In normal sample 7, significant differences were observed in cell proportions between the macular and peripheral areas when compared to samples 5 and 6. This may be attributed to the heterogeneity of the disease or factors related to sample processing. The number of monocytes in the macular area was higher in AMD patients compared to the control group. In comparison, the proportion of endothelial cells was significantly higher. In the peripheral area of the macula, the proportions of T cells, monocytes, and B cells were lower in the control group than in the AMD group.
Experiment validation of hub genes
To validate the effect of hub genes, we first constructed an oxidative-stress RPE cell model using SI. We then validated those six hub genes by RT–qPCR (Fig. 11A). The mRNA expression of ANXA1 and CD44 was significantly upregulated. Then we further validated the expression of ferroptosis-related markers showing decreased GPX4 expression, increased HO-1 expression, and increased protein expression of CD44 and ANXA1 using western blot (Fig. 11B, C). We also performed immunocytochemistry to further validate the upregulation of ANXA1 expression in the RPE cell model induced by SI (Fig. 11D). Moreover, the knockdown of ANXA1 led to the deduction of GPX4 (Fig. 11E, F). Furthermore, we constructed a mice model with SI. Autofluorescence images showed loss of fluorophores from RPE loss in SI-induced mice (Fig. 12A). OCT exhibited apparent thinning in the retina in SI-induced mice (Fig. 12B). H&E staining further validated the retinal thinning and RPE injury (Fig. 12C). The results obtained from TEM indicated that RPE tissue isolated from SI-induced mice displayed unique morphological characteristics, including a reduction in mitochondrial size accompanied by diminished membrane density (Fig. 12D). These observations suggest the presence of ferroptosis within the RPE tissue of mice induced by SI. Immunofluorescence images for cryosections demonstrated a significant increase of ANXA1 expression in eye tissue in response to SI (Fig. 12E), especially in the RPE layer displayed in the RPE flat mount (Fig. 12F). Immunofluorescence staining of cryosections showed the colocalization of ANXA1 and IBA1 in mouse tissue (Fig. 12G).
Fig. 11.

Validation of hub genes expression in SI-induced RPE model. A Relative expression profile of mRNA expression of hub genes validated by RT-qPCR. B Protein expression of CD44 and ANXA1, and ferroptosis-related markers validated by western blot. C Relative protein expression normalized to β-actin. D Immunocytochemistry images showing ANXA1 expression in the SI-induced RPE model and the control. E Western blot showing knockdown efficiency of ANXA1 (si-ANXA1) and the effect on GPX4 expression. F Relative expression of si-ANXA1 and the effect on GPX4 expression. The data are mean ± SD of three independent replicates/groups and assessed by Student's t test. Bar = 50 µm; ***P < 0.001; **P < 0.01; *P < 0.05; ns, no significance. RT–qPCR, Reverse transcription–quantitative polymerase chain reaction. Ctrl, control. SI, solid sodium iodate
Fig. 12.

Validation of ANXA1 in SI-induced mice model. SI-induced mice model was verified by autofluorescence images (A), optical coherence technology (B), and hematoxylin–eosin (C). D Ultrastructure of mitochondria in RPE tissue from mice induced by SI or PBS was imaged by TEM. Red triangles: mitochondria. Scale bars = 0.5 μm. Immunofluorescence images for cryosections (E) and RPE flat mount (F). Red represents ANXA1 antibody; blue represents DAPI. Bar = 50 µm. SI, solid sodium iodate, n = 3. G Immunofluorescence of SI-induced mice model displayed ANXA1 (green) and IBA1 (red) staining. The presence of ANXA1-positive cells overlapped with IBA1-positive cells (white triangles) in their distribution. Bar = 50 µm, n = 3. RPE, retinal pigment epithelium; TEM, transmission electron microscope
Discussion
The pathogenesis of AMD is highly complex, and the specific causes are not fully understood. Although there are reports of ferroptosis in AMD pathogenesis [41], its complete integration with gene expression changes in human RPE tissue remains underexplored. The interaction between ferroptosis-related genes and immune cell infiltration is also not well understood. The rapid development of transcriptional or scRNA-seq technology has provided mounts of resources, which enabled researchers to explore the underlying molecular characteristics of AMD.
In this study, we identified 46 differentially expressed genes from two microarray data sets. GO and KEGG analysis showed that extracellular matrix-related molecular function and glutathione metabolism were mainly involved, which is consistent with previous study [42]. We found significant differences in immune scores for those DEGs, indicating the potential role of immune-related mechanisms in AMD. We found DKK1, GPX3, FZD7, and ANXA1 showed dramatically significant. GPX3, FZD7, and ANXA1 were upregulated in the elderly group, demonstrating these genes might be associated with aging in AMD. Although it is reported that a potentially higher risk of AMD for women, our results showed that FRGs had no significance in gender.
Further, we identified six hub ferroDEGs genes (ANXA1, DKK1, CD44, VIM, TGFB2, DUSP1) that have not been reported in AMD. In our ROC analysis, the AUC values for ANXA1, TGFB2, and VIM exceeded 0.7, indicating the underlying role in differentiating AMD and the control. We conducted functional analyses on these hub genes, revealing that leukocyte migration, chemotaxis, macrophage migration, and gliogenesis were primarily involved. This further underscored the potential role of immune and inflammatory mechanisms in AMD. We examined the correlation and differences in immune cell infiltration between high- and low-risk ferroptosis groups. The results indicated higher infiltration levels of CD8+ T cells, activated NK cells, and M2 macrophages in the former group. Substantial evidence shows that both the adaptive immune system and innate immune system participate in AMD pathogenesis [27]. CD8+ T cells played a role in both subforms of AMD [18, 43] NK cells, lymphocytes of the innate immune system, were involved in subretinal neovascular lesions in AMD [44]. Macrophages, inflammatory cells, may exert oxidative, inflammatory, and angiogenic effects in the context of AMD [45]. Furthermore, the correlation between hub genes and the level of immune cell infiltration was examined, indicating the crosstalk between FRGs and those immune cells in AMD.
To clarify the differences between independent cells in the AMD and the control, we performed separate single-cell analyses for RPE/choroid tissue, revealing a high degree of cellular heterogeneity in macular degeneration. Initial single-cell sequencing revealed a lower proportion of T cells and NK cells in the macular area of AMD samples compared to normal samples, suggesting repression of these cells in AMD patients. Conversely, neurons were significantly more abundant in AMD samples. In addition, the proportion of monocytes in the macular area was significantly higher in AMD patients than in normal individual. Our findings align with previous research indicating the crucial role of monocytes in AMD [46]. A previous study reported impairment of cholesterol clearance in monocytes initiates age-related retinal degeneration [47]. Monocytes originating from the myeloid blood system is reported to invade blood retinal barrier during eye tissue damage. These cells subsequently differentiated into pro-inflammatory macrophages, which promote the release of inflammatory cytokines and trigger an immune response in the eye tissue [48]. Microglia are the principal monocytes or macrophages in the normal retina. The role of these cells in AMD remains a subject of debate.
SI-induced retinal degeneration is an established model by inducing ferroptosis of RPE cells [16, 17, 49]. First, we constructed RPE cell model induced by SI and confirmed the presence of ferroptosis markers, and we also validated the expression of hub genes related to ferroptosis. We found that the expression of ANXA1 and CD44 was upregulated at both mRNA and protein levels. CD44 is a widely expressed transmembrane glycoprotein known to suppress ferroptosis in cancer cells [49]. CD44 is highly expressed in the RPE layer, acting as a barrier to keep a balance of retinal metabolism, and its upregulation occurs under conditions of inflammation and degeneration [50, 51]. In our study, upregulation of CD44 was induced by oxidative stress mediating ferroptosis which might interfere with retinal metabolism. Given that ANXA1 is significantly upregulated in our data sets, increased in the elderly group and its AUC exceeds 0.7 in our results from data sets, we then identified ANXA1 as a potentially key marker for further experimental validation. We also validated the elevation of ANXA1 protein expression in an SI-induced cell model by western blot and in SI-induced animal model by immunofluorescence assay for cryosections and RPE flat mount. It is worth noting that whether the elevation of ANXA1 is a cause or consequence of lesions evolving into AMD. Annexin A1 (ANXA1) is an endogenously anti-inflammatory protein that responds to tissue injury, which has been well documented to play protective roles in various diseases by alleviating inflammation [52–54]. Loss of ANXA1 aggravates inflammation-related vascular aging [55]. ANXA1 also exerts a protective role by inhibiting ferroptosis [56]. In ocular diseases, the protective effects of ANXA1 have also been confirmed for its anti-inflammation property [57]. In retinal diseases, overexpress CYP2J2 in the retina enhance the m6A methylation modification of ANXA1 to maintain vascular homeostasis [58]. Zhu et al. reported that ANXA1 alleviated choroidal neovascularization by inhibiting inflammasome activation and pyroptosis in RPE cells. These results indicate that ANXA1 is linked to the protection mechanism in ocular disease. Notably, our findings revealed that knocking down ANXA1 reduced the expression of GPX4, a marker of ferroptosis, suggesting loss of ANXA1 might accelerate ferroptosis. Taken together, the increase in ANXA1 levels may occur in response to ferroptosis in AMD and acts as a protective mechanism to halt further progression. To further clarify the protective mechanism of ANXA1, we should conduct in-depth studies. This includes overexpressing ANXA1 in cell and animal models to see if ferroptosis is reversed. Moreover, our results from functional analysis for hub genes also demonstrated inflammation and immune-related bioprocess including leukocyte migration and chemotaxis, macrophage migration, and gliogenesis. Microglia cell accumulation may cause detrimental inflammation resulting in AMD [59]. Furthermore, single-cell analysis revealed elevated ANXA1 expression in inflammation-related cells, such as monocytes and macrophages, suggesting a potential interaction with inflammatory or immune cell infiltration. ANXA1 is implicated in microglial activation during brain ischemia [60]. Furthermore, we confirmed the tissue colocalization of ANXA1 and microglia. Taken together, we speculated that ANXA1 might dampen inflammation and delay AMD progression by inhibiting ferroptosis and microglia activation, which warrants further experiments.
This study has several important limitations. First, our study included data sets with a small sample size. Second, bias is inevitable due to the integration of various omics data from public data sets. Third, this study does not include all stages of AMD, limiting the demonstration of disease progression. Fourth, further exploration is needed regarding the roles of FRGs and their interaction with the immune response in AMD. Fifth, the SI-induced model cannot represent the progression of AMD. Sixth, ANXA1 might serve as a protective role by repressing ferroptosis in AMD, which warrants further investigation and validation.
Conclusions
We concluded that the crosstalk between ferroptosis and immunity is implicated in AMD. Changes in the proportion of monocytes in the macular area may contribute to macular degeneration. The upregulation of ANXA1 identified in this study may be associated with the protective mechanism against ferroptosis in the pathogenesis of AMD.
Supplementary Information
Additional file 1. Table S1. Information of datasets from GEO.
Additional file 2. Table S2. The list of ferroptosis-related genes.
Additional file 3. Table S3. The primers for RT–qPCR.
Additional file 4. Table S4. The results of GO/KEGG.
Additional file 5. Table S5. The results of GSEA.
Additional file 6. Table S6. The results of GSVA.
Acknowledgements
We are grateful to the investigators who provided the publicly available datasets.
Abbreviations
- AMD
Age-related macular degeneration
- RPE
Retinal pigment epithelium
- FRGs
Ferroptosis-related genes
- scRNA-seq
Single-cell transcriptome sequencing
- GO
Gene Ontology
- KEGG
Kyoto Encyclopedia of Genes and Genomes
- ROC
Receiver operating characteristic
- DEGs
Differentially expressed genes
- GSEA
Gene Set Enrichment Analysis
- GSVA
Gene set variation analysis
- ES
Enrichment score
- PCA
Principal component analysis;
- t-SNE
T-distributed stochastic neighbor embedding
- PBS
Phosphate-buffered saline
- OCT
Optical Coherence Technology
- AF
Autofluorescence
- TEM
Transmission electron microscope
- H&E
Hematoxylin–eosin
- AUC
Area under the curve
Author contributions
J.C. was responsible for the overall design of the study, and writing of the manuscript. T.L. was responsible for the processing of bioinformatics data and constructing animal models. C.C. constructed cell modeling and molecular experimental validation. WB.Z. was responsible for the statistical work towards experimental data. L.L. and NY.L. reviewed and revised the manuscript. All authors read and approved the final manuscript.
Funding
This study was funded by the China Postdoctoral Science Foundation (Grand No. 2023M734071).
Availability of data and materials
No datasets were generated or analysed during the current study.
Declarations
Ethics approval and consent to participate
The study was conducted according to the guidelines of the Declaration of Helsinki, and approved by Zhongshan ophthalmic center Animal Care and Use Committee (O2021046).
Consent for publication
Not applicable.
Competing interests
The authors declare no competing interests.
Footnotes
Publisher's Note
Springer Nature remains neutral with regard to jurisdictional claims in published maps and institutional affiliations.
Jing Chen and Tu Lu contributed equally to this work.
Contributor Information
Lin Lu, Email: lulin@gzzoc.com.
Naiyang Li, Email: naiyangli@foxmail.com.
References
- 1.Guymer RH, Campbell TG. Age-related macular degeneration. Lancet (London, England). 2023;401(10386):1459–72. 10.1016/s0140-6736(22)02609-5. [DOI] [PubMed] [Google Scholar]
- 2.Wong WL, Su X, Li X, Cheung CM, Klein R, Cheng CY, Wong TY. Global prevalence of age-related macular degeneration and disease burden projection for 2020 and 2040: a systematic review and meta-analysis. Lancet Glob Health. 2014;2(2):e106–16. 10.1016/s2214-109x(13)70145-1. [DOI] [PubMed] [Google Scholar]
- 3.Fleckenstein M, Schmitz-Valckenberg S, Chakravarthy U. Age-related macular degeneration: a review. JAMA. 2024;331(2):147–57. 10.1001/jama.2023.26074. [DOI] [PubMed] [Google Scholar]
- 4.Wong CW, Yanagi Y, Lee WK, Ogura Y, Yeo I, Wong TY, Cheung CMG. Age-related macular degeneration and polypoidal choroidal vasculopathy in Asians. Prog Retin Eye Res. 2016;53:107–39. 10.1016/j.preteyeres.2016.04.002. [DOI] [PubMed] [Google Scholar]
- 5.Rosenfeld PJ, Brown DM, Heier JS, Boyer DS, Kaiser PK, Chung CY, Kim RY. Ranibizumab for neovascular age-related macular degeneration. N Engl J Med. 2006;355(14):1419–31. 10.1056/NEJMoa054481. [DOI] [PubMed] [Google Scholar]
- 6.Datta S, Cano M, Ebrahimi K, Wang L, Handa JT. The impact of oxidative stress and inflammation on RPE degeneration in non-neovascular AMD. Prog Retin Eye Res. 2017;60:201–18. 10.1016/j.preteyeres.2017.03.002. [DOI] [PMC free article] [PubMed] [Google Scholar]
- 7.Blasiak J, Sobczuk P, Pawlowska E, Kaarniranta K. Interplay between aging and other factors of the pathogenesis of age-related macular degeneration. Ageing Res Rev. 2022;81:101735. 10.1016/j.arr.2022.101735. [DOI] [PubMed] [Google Scholar]
- 8.Fleckenstein M, Keenan TDL, Guymer RH, Chakravarthy U, Schmitz-Valckenberg S, Klaver CC, Wong WT, Chew EY. Age-related macular degeneration. Nat Rev Dis Primers. 2021;7(1):31. 10.1038/s41572-021-00265-2. [DOI] [PubMed] [Google Scholar]
- 9.Hanus J, Anderson C, Wang S. RPE necroptosis in response to oxidative stress and in AMD. Ageing Res Rev. 2015;24(Pt B):286–98. 10.1016/j.arr.2015.09.002. [DOI] [PMC free article] [PubMed] [Google Scholar]
- 10.Gao J, Cui JZ, To E, Cao S, Matsubara JA. Evidence for the activation of pyroptotic and apoptotic pathways in RPE cells associated with NLRP3 inflammasome in the rodent eye. J Neuroinflammation. 2018;15(1):15. 10.1186/s12974-018-1062-3. [DOI] [PMC free article] [PubMed] [Google Scholar]
- 11.Kaarniranta K, Blasiak J, Liton P, Boulton M, Klionsky DJ, Sinha D. Autophagy in age-related macular degeneration. Autophagy. 2023;19(2):388–400. 10.1080/15548627.2022.2069437. [DOI] [PMC free article] [PubMed] [Google Scholar]
- 12.Dixon SJ, Lemberg KM, Lamprecht MR, Skouta R, Zaitsev EM, Gleason CE, Patel DN, Bauer AJ, Cantley AM, Yang WS, Morrison B 3rd, Stockwell BR. Ferroptosis: an iron-dependent form of nonapoptotic cell death. Cell. 2012;149(5):1060–72. 10.1016/j.cell.2012.03.042. [DOI] [PMC free article] [PubMed] [Google Scholar]
- 13.Zhao T, Guo X, Sun Y. Iron accumulation and lipid peroxidation in the aging retina: implication of ferroptosis in age-related macular degeneration. Aging Dis. 2021;12(2):529–51. 10.14336/ad.2020.0912. [DOI] [PMC free article] [PubMed] [Google Scholar]
- 14.Tang Z, Ju Y, Dai X, Ni N, Liu Y, Zhang D, Gao H, Sun H, Zhang J, Gu P. HO-1-mediated ferroptosis as a target for protection against retinal pigment epithelium degeneration. Redox biology. 2021;43:101971. 10.1016/j.redox.2021.101971. [DOI] [PMC free article] [PubMed] [Google Scholar]
- 15.Biesemeier A, Yoeruek E, Eibl O, Schraermeyer U. Iron accumulation in Bruch’s membrane and melanosomes of donor eyes with age-related macular degeneration. Exp Eye Res. 2015;137:39–49. 10.1016/j.exer.2015.05.019. [DOI] [PubMed] [Google Scholar]
- 16.Totsuka K, Ueta T, Uchida T, Roggia MF, Nakagawa S, Vavvas DG, Honjo M, Aihara M. Oxidative stress induces ferroptotic cell death in retinal pigment epithelial cells. Exp Eye Res. 2019;181:316–24. 10.1016/j.exer.2018.08.019. [DOI] [PMC free article] [PubMed] [Google Scholar]
- 17.Liu B, Wang W, Shah A, Yu M, Liu Y, He L, Dang J, Yang L, Yan M, Ying Y, Tang Z, Liu K. Sodium iodate induces ferroptosis in human retinal pigment epithelium ARPE-19 cells. Cell Death Dis. 2021;12(3):230. 10.1038/s41419-021-03520-2. [DOI] [PMC free article] [PubMed] [Google Scholar]
- 18.Behnke V, Wolf A, Langmann T. The role of lymphocytes and phagocytes in age-related macular degeneration (AMD). Cell Mol Life Sci. 2020;77(5):781–8. 10.1007/s00018-019-03419-4. [DOI] [PMC free article] [PubMed] [Google Scholar]
- 19.McHarg S, Booth L, Perveen R, Riba Garcia I, Brace N, Bayatti N, Sergouniotis PI, Phillips AM, Day AJ, Black GCM, Clark SJ, Dowsey AW, Unwin RD, Bishop PN. Mast cell infiltration of the choroid and protease release are early events in age-related macular degeneration associated with genetic risk at both chromosomes 1q32 and 10q26. Proc Natl Acad Sci USA. 2022;119(20): e2118510119. 10.1073/pnas.2118510119. [DOI] [PMC free article] [PubMed] [Google Scholar]
- 20.Zhao Q, Lai K. Role of immune inflammation regulated by macrophage in the pathogenesis of age-related macular degeneration. Exp Eye Res. 2024;239:109770. 10.1016/j.exer.2023.109770. [DOI] [PubMed] [Google Scholar]
- 21.Gong J, Cai H, Noggle S, Paull D, Rizzolo LJ, Del Priore LV, Fields MA. Stem cell-derived retinal pigment epithelium from patients with age-related macular degeneration exhibit reduced metabolism and matrix interactions. Stem Cells Transl Med. 2020;9(3):364–76. 10.1002/sctm.19-0321. [DOI] [PMC free article] [PubMed] [Google Scholar]
- 22.Newman AM, Gallo NB, Hancox LS, Miller NJ, Radeke CM, Maloney MA, Cooper JB, Hageman GS, Anderson DH, Johnson LV, Radeke MJ. Systems-level analysis of age-related macular degeneration reveals global biomarkers and phenotype-specific functional networks. Genome Med. 2012;4(2):16. 10.1186/gm315. [DOI] [PMC free article] [PubMed] [Google Scholar]
- 23.Voigt AP, Mulfaul K, Mullin NK, Flamme-Wiese MJ, Giacalone JC, Stone EM, Tucker BA, Scheetz TE, Mullins RF. Single-cell transcriptomics of the human retinal pigment epithelium and choroid in health and macular degeneration. Proc Natl Acad Sci USA. 2019;116(48):24100–7. 10.1073/pnas.1914143116. [DOI] [PMC free article] [PubMed] [Google Scholar]
- 24.Sterling JK, Baumann B, Foshe S, Voigt A, Guttha S, Alnemri A, McCright SJ, Li M, Zauhar RJ, Montezuma SR, Kapphahn RJ, Chavali VRM, Hill DA, Ferrington DA, Stambolian D, Mullins RF, Merrick D, Dunaief JL. Inflammatory adipose activates a nutritional immunity pathway leading to retinal dysfunction. Cell Rep. 2022;39(11): 110942. 10.1016/j.celrep.2022.110942. [DOI] [PMC free article] [PubMed] [Google Scholar]
- 25.Parker HS, Leek JT, Favorov AV, Considine M, Xia X, Chavan S, Chung CH, Fertig EJ. Preserving biological heterogeneity with a permuted surrogate variable analysis for genomics batch correction. Bioinformatics (Oxford, England). 2014;30(19):2757–63. 10.1093/bioinformatics/btu375. [DOI] [PMC free article] [PubMed] [Google Scholar]
- 26.Ritchie ME, Phipson B, Wu D, Hu Y, Law CW, Shi W, Smyth GK. limma powers differential expression analyses for RNA-sequencing and microarray studies. Nucleic Acids Res. 2015;43(7): e47. 10.1093/nar/gkv007. [DOI] [PMC free article] [PubMed] [Google Scholar]
- 27.Perez VL, Caspi RR. Immune mechanisms in inflammatory and degenerative eye disease. Trends Immunol. 2015;36(6):354–63. 10.1016/j.it.2015.04.003. [DOI] [PMC free article] [PubMed] [Google Scholar]
- 28.Kanehisa M, Furumichi M, Sato Y, Ishiguro-Watanabe M, Tanabe M. KEGG: integrating viruses and cellular organisms. Nucleic Acids Res. 2021;49(D1):D545–51. 10.1093/nar/gkaa970. [DOI] [PMC free article] [PubMed] [Google Scholar]
- 29.Yoshihara K, Shahmoradgoli M, Martínez E, Vegesna R, Kim H, Torres-Garcia W, Treviño V, Shen H, Laird PW, Levine DA, Carter SL, Getz G, Stemke-Hale K, Mills GB, Verhaak RG. Inferring tumour purity and stromal and immune cell admixture from expression data. Nat Commun. 2013;4:2612. 10.1038/ncomms3612. [DOI] [PMC free article] [PubMed] [Google Scholar]
- 30.Zhou N, Bao J. FerrDb: a manually curated resource for regulators and markers of ferroptosis and ferroptosis-disease associations. Database. 2020. 10.1093/database/baaa021. [DOI] [PMC free article] [PubMed] [Google Scholar]
- 31.Szklarczyk D, Gable AL, Nastou KC, Lyon D, Kirsch R, Pyysalo S, Doncheva NT, Legeay M, Fang T, Bork P, Jensen LJ, von Mering C. The STRING database in 2021: customizable protein-protein networks, and functional characterization of user-uploaded gene/measurement sets. Nucleic Acids Res. 2021;49(D1):D605–12. 10.1093/nar/gkaa1074. [DOI] [PMC free article] [PubMed] [Google Scholar]
- 32.Shannon P, Markiel A, Ozier O, Baliga NS, Wang JT, Ramage D, Amin N, Schwikowski B, Ideker T. Cytoscape: a software environment for integrated models of biomolecular interaction networks. Genome Res. 2003;13(11):2498–504. 10.1101/gr.1239303. [DOI] [PMC free article] [PubMed] [Google Scholar]
- 33.Robin X, Turck N, Hainard A, Tiberti N, Lisacek F, Sanchez JC, Müller M. pROC: an open-source package for R and S+ to analyze and compare ROC curves. BMC Bioinform. 2011;12:77. 10.1186/1471-2105-12-77. [DOI] [PMC free article] [PubMed] [Google Scholar]
- 34.Subramanian A, Tamayo P, Mootha VK, Mukherjee S, Ebert BL, Gillette MA, Paulovich A, Pomeroy SL, Golub TR, Lander ES, Mesirov JP. Gene set enrichment analysis: a knowledge-based approach for interpreting genome-wide expression profiles. Proc Natl Acad Sci USA. 2005;102(43):15545–50. 10.1073/pnas.0506580102. [DOI] [PMC free article] [PubMed] [Google Scholar]
- 35.Yu G, Wang LG, Han Y, He QY. clusterProfiler: an R package for comparing biological themes among gene clusters. OMICS. 2012;16(5):284–7. 10.1089/omi.2011.0118. [DOI] [PMC free article] [PubMed] [Google Scholar]
- 36.Hänzelmann S, Castelo R, Guinney J. GSVA: gene set variation analysis for microarray and RNA-seq data. BMC Bioinform. 2013;14:7. 10.1186/1471-2105-14-7. [DOI] [PMC free article] [PubMed] [Google Scholar]
- 37.Liberzon A, Birger C, Thorvaldsdóttir H, Ghandi M, Mesirov JP, Tamayo P. The molecular signatures database (MSigDB) hallmark gene set collection. Cell Syst. 2015;1(6):417–25. 10.1016/j.cels.2015.12.004. [DOI] [PMC free article] [PubMed] [Google Scholar]
- 38.Newman AM, Liu CL, Green MR, Gentles AJ, Feng W, Xu Y, Hoang CD, Diehn M, Alizadeh AA. Robust enumeration of cell subsets from tissue expression profiles. Nat Methods. 2015;12(5):453–7. 10.1038/nmeth.3337. [DOI] [PMC free article] [PubMed] [Google Scholar]
- 39.Butler A, Hoffman P, Smibert P, Papalexi E, Satija R. Integrating single-cell transcriptomic data across different conditions, technologies, and species. Nat Biotechnol. 2018;36(5):411–20. 10.1038/nbt.4096. [DOI] [PMC free article] [PubMed] [Google Scholar]
- 40.Aran D, Looney AP, Liu L, Wu E, Fong V, Hsu A, Chak S, Naikawadi RP, Wolters PJ, Abate AR, Butte AJ, Bhattacharya M. Reference-based analysis of lung single-cell sequencing reveals a transitional profibrotic macrophage. Nat Immunol. 2019;20(2):163–72. 10.1038/s41590-018-0276-y. [DOI] [PMC free article] [PubMed] [Google Scholar]
- 41.Liu D, Liu Z, Liao H, Chen ZS, Qin B. Ferroptosis as a potential therapeutic target for age-related macular degeneration. Drug Discov Today. 2024;29(4): 103920. 10.1016/j.drudis.2024.103920. [DOI] [PubMed] [Google Scholar]
- 42.Brodzka S, Baszyński J, Rektor K, Hołderna-Bona K, Stanek E, Kurhaluk N, Tkaczenko H, Malukiewicz G, Woźniak A, Kamiński P. The role of glutathione in age-related macular degeneration (AMD). Int J Mol Sci. 2024. 10.3390/ijms25084158. [DOI] [PMC free article] [PubMed] [Google Scholar]
- 43.Faber C, Singh A, Krüger Falk M, Juel HB, Sørensen TL, Nissen MH. Age-related macular degeneration is associated with increased proportion of CD56(+) T cells in peripheral blood. Ophthalmology. 2013;120(11):2310–6. 10.1016/j.ophtha.2013.04.014. [DOI] [PubMed] [Google Scholar]
- 44.Goverdhan SV, Khakoo SI, Gaston H, Chen X, Lotery AJ. Age-related macular degeneration is associated with the HLA-Cw*0701 genotype and the natural killer cell receptor AA haplotype. Invest Ophthalmol Vis Sci. 2008;49(11):5077–82. 10.1167/iovs.08-1837. [DOI] [PMC free article] [PubMed] [Google Scholar]
- 45.Shen T, Lin R, Hu C, Yu D, Ren C, Li T, Zhu M, Wan Z, Su T, Wu Y, Cai W, Yu J. Succinate-induced macrophage polarization and RBP4 secretion promote vascular sprouting in ocular neovascularization. J Neuroinflammation. 2023;20(1):308. 10.1186/s12974-023-02998-1. [DOI] [PMC free article] [PubMed] [Google Scholar]
- 46.Xue CC, Cui J, Gao LQ, Zhang C, Dou HL, Chen DN, Wang YX, Jonas JB. Peripheral monocyte count and age-related macular degeneration. The Tongren Health Care Study. Am J Ophthalmol. 2021;227:143–53. 10.1016/j.ajo.2021.03.010. [DOI] [PubMed] [Google Scholar]
- 47.Ban N, Lee TJ, Sene A, Choudhary M, Lekwuwa M, Dong Z, Santeford A, Lin JB, Malek G, Ory DS, Apte RS. Impaired monocyte cholesterol clearance initiates age-related retinal degeneration and vision loss. JCI Insight. 2018. 10.1172/jci.insight.120824. [DOI] [PMC free article] [PubMed] [Google Scholar]
- 48.Yu C, Roubeix C, Sennlaub F, Saban DR. Microglia versus monocytes: distinct roles in degenerative diseases of the retina. Trends Neurosci. 2020;43(6):433–49. 10.1016/j.tins.2020.03.012. [DOI] [PMC free article] [PubMed] [Google Scholar]
- 49.Upadhyay M, Bonilha VL. Regulated cell death pathways in the sodium iodate model: insights and implications for AMD. Exp Eye Res. 2024;238:109728. 10.1016/j.exer.2023.109728. [DOI] [PMC free article] [PubMed] [Google Scholar]
- 50.Huang D, Chen YS, Rupenthal ID. Hyaluronic acid coated albumin nanoparticles for targeted peptide delivery to the retina. Mol Pharm. 2017;14(2):533–45. 10.1021/acs.molpharmaceut.6b01029. [DOI] [PubMed] [Google Scholar]
- 51.Huang Y, Lu J, Zhao L, Fu X, Peng S, Zhang W, Wang R, Yuan W, Luo R, Wang X, Li Z, Zhang Z. Retinal cell-targeted liposomal ginsenoside Rg3 attenuates retinal ischemia-reperfusion injury via alleviating oxidative stress and promoting microglia/macrophage M2 polarization. Free Radic Biol Med. 2023;206:162–79. 10.1016/j.freeradbiomed.2023.06.024. [DOI] [PubMed] [Google Scholar]
- 52.Wu L, Liu C, Chang DY, Zhan R, Sun J, Cui SH, Eddy S, Nair V, Tanner E, Brosius FC, Looker HC, Nelson RG, Kretzler M, Wang JC, Xu M, Ju W, Zhao MH, Chen M, Zheng L. Annexin A1 alleviates kidney injury by promoting the resolution of inflammation in diabetic nephropathy. Kidney Int. 2021;100(1):107–21. 10.1016/j.kint.2021.02.025. [DOI] [PMC free article] [PubMed] [Google Scholar]
- 53.Xu X, Gao W, Li L, Hao J, Yang B, Wang T, Li L, Bai X, Li F, Ren H, Zhang M, Zhang L, Wang J, Wang D, Zhang J, Jiao L. Annexin A1 protects against cerebral ischemia-reperfusion injury by modulating microglia/macrophage polarization via FPR2/ALX-dependent AMPK-mTOR pathway. J Neuroinflammation. 2021;18(1):119. 10.1186/s12974-021-02174-3. [DOI] [PMC free article] [PubMed] [Google Scholar]
- 54.Purvis GSD, Solito E, Thiemermann C. Annexin-A1: therapeutic potential in microvascular disease. Front Immunol. 2019;10:938. 10.3389/fimmu.2019.00938. [DOI] [PMC free article] [PubMed] [Google Scholar]
- 55.You Q, Ke Y, Chen X, Yan W, Li D, Chen L, Wang R, Yu J, Hong H. Loss of endothelial annexin A1 aggravates inflammation-induched vascular aging. Adv Sci. 2024;11(15):e2307040. 10.1002/advs.202307040. [DOI] [PMC free article] [PubMed] [Google Scholar]
- 56.Qin S, Ren Y, Feng B, Wang X, Liu J, Zheng J, Li K, Chen M, Chen T, Mei H, Fu X. ANXA1sp protects against sepsis-induced myocardial injury by inhibiting ferroptosis-induced cardiomyocyte death via SIRT3-mediated p53 deacetylation. Mediat Inflamm. 2023;2023:6638929. 10.1155/2023/6638929. [DOI] [PMC free article] [PubMed] [Google Scholar]
- 57.Wang A, Zhang H, Li X, Zhao Y. Annexin A1 in the nervous and ocular systems. Neural Regen Res. 2024;19(3):591–7. 10.4103/1673-5374.380882. [DOI] [PMC free article] [PubMed] [Google Scholar]
- 58.Zhao B, Huang J, Lou X, Yao K, Ye M, Mou Q, Wen Z, Duan Q, Zhang H, Zhao Y. Endothelial CYP2J2 overexpression restores the BRB via METTL3-mediated ANXA1 upregulation. FASEB J. 2022;36(11): e22619. 10.1096/fj.202201061RR. [DOI] [PubMed] [Google Scholar]
- 59.Combadière C, Feumi C, Raoul W, Keller N, Rodéro M, Pézard A, Lavalette S, Houssier M, Jonet L, Picard E, Debré P, Sirinyan M, Deterre P, Ferroukhi T, Cohen SY, Chauvaud D, Jeanny JC, Chemtob S, Behar-Cohen F, Sennlaub F. CX3CR1-dependent subretinal microglia cell accumulation is associated with cardinal features of age-related macular degeneration. J Clin Investig. 2007;117(10):2920–8. 10.1172/jci31692. [DOI] [PMC free article] [PubMed] [Google Scholar]
- 60.Li X, Xia Q, Mao M, Zhou H, Zheng L, Wang Y, Zeng Z, Yan L, Zhao Y, Shi J. Annexin-A1 SUMOylation regulates microglial polarization after cerebral ischemia by modulating IKKα stability via selective autophagy. Sci Adv. 2021. 10.1126/sciadv.abc5539. [DOI] [PMC free article] [PubMed] [Google Scholar]
Associated Data
This section collects any data citations, data availability statements, or supplementary materials included in this article.
Supplementary Materials
Additional file 1. Table S1. Information of datasets from GEO.
Additional file 2. Table S2. The list of ferroptosis-related genes.
Additional file 3. Table S3. The primers for RT–qPCR.
Additional file 4. Table S4. The results of GO/KEGG.
Additional file 5. Table S5. The results of GSEA.
Additional file 6. Table S6. The results of GSVA.
Data Availability Statement
No datasets were generated or analysed during the current study.