Abstract
Background
Evaluation of regional left ventricle function using two-dimensional echocardiography (2DE) in patients with ischemic heart disease has limitations due to its low objectivity and qualitative nature. In addition, 2DE is limited because multiple acoustic windows are used to obtain the image, whereas three-dimensional echocardiography (3DE) uses a single window. This study aims to demonstrate the clinical utility of 3DE segmental volume analysis for evaluating regional wall motion abnormality (RWMA).
Methods
This retrospective study included 33 patients with ischemic heart disease and single-vessel territory RWMA confirmed on coronary angiography. RWMA was visually assessed using 2DE, generating 17-segment bull's-eye polar maps, and 3DE. In the 3DE study, two independent observers analyzed segmental volumes and segmental volume ejection fractions (SVEFs) using QLAB 3D quantification software. The optimal SVEF cutoff value differentiating normal from abnormal was determined using receiver operating curve analysis. The accuracy of 3DE in predicting culprit coronary arteries was compared with that of 2DE using Cohen κ coefficients, which also were used for interobserver and intraobserver variability assessments.
Results
Mean 3DE SVEFs were significantly lower in segments showing RWMA on 2DE. The optimal SVEF cutoff value was 44%, with sensitivity of 75.0% and specificity of 73.9% (area under the curve, 0.801; 95% CI, 0.763–0.838; P < 0.001). The reliability of 3DE-derived bull's-eye predictions of culprit coronary arteries was 81.8% (κ = 0.672; 95% CI, 0.555–0.789; P < 0.001). Interobserver and intraobserver variabilities were 97.0% (κ = 0.947; 95% CI, 0.894–1.00; P < 0.001) and 93.9% (κ = 0.897; 95% CI, 0.827–0.967; P < 0.001), respectively.
Conclusions
The 3DE segmental volume analysis effectively quantified regional left ventricle function and aligned well with 2DE and coronary angiography findings in predicting culprit coronary arteries. Thus, 3DE segmental volume analysis can serve as a quantitative and objective tool for RWMA assessment in patients with ischemic heart disease.
Keywords: Echocardiography, Three-dimensional, Regional left ventricle wall motion, Segmental volume, Myocardial Ischemia, Imaging, Left ventricular function
Background
Two-dimensional echocardiography (2DE) is the most commonly accessible and indispensable non-invasive imaging modality for assessing regional left ventricle (LV) function in patients with ischemic heart disease (IHD), for whom immediate and accurate diagnosis is crucial. However, 2DE is limited because it is subjective, semiquantitative, and expert-dependent [1, 2]. Another drawback of 2DE is that multiple acoustic windows are required to acquire images.
However, three-dimensional echocardiography (3DE) has the advantages of acquiring the entire LV from a single apical window and enabling rapid LV volume measurement without geometric assumptions [3]. In addition, the measurement method offers the advantage of acquiring images from locations less affected by bone structures or patient positioning, which can potentially lead to more consistent and reliable imaging results.
To assess regional wall motion abnormality (RWMA) using volume, which has an objective and quantitative property, an algorithm that can semiautomatically recognize LV endocardium and compute segmental volumes without geometrical assumptions was devised. Using this algorithm, the mean segmental volume ejection fraction (SVEF) was lower for LV segments having RWMA on 2DE [4]. The goals of this study were as follows: (1) determine a difference in SVEF by 2DE wall motion score; (2) identify the 3DE SVEF cutoff value that best predicted the presence of RWMA; and (3) demonstrate the usefulness of 3DE SVEF in the assessment of the culprit coronary artery in patients with IHD.
Methods
Study subjects
We retrospectively reviewed 39 consecutive patients who underwent echocardiography followed by invasive coronary angiogram. If emergency coronary angiogram was required, echocardiography was performed within 24 h. Inclusion criteria were a single-territory RWMA on 2DE and single-vessel obstructive coronary artery disease confirmed on coronary angiography; no valvular stenosis or greater than mild regurgitation; normal sinus rhythm without left bundle branch block; and no previous history of myocardial infarction. After excluding 6 patients with an inadequate image, low 3D image frame rate, or low resolution, 33 patients were enrolled in the current investigation. If RWMAs were discovered on 2DE, 3DE was performed for further analysis.
Echocardiographic examination
Conventional 2DE examinations were performed according to the most recent American and European echocardiography guidelines [1] using an X5-1 phased-array xMatrix transducer (X5-1 Transducer, Philips Healthcare) and cardiovascular ultrasound system (EPIQ CVx ver. 7.0, Philips Healthcare). As proposed by the American Society of Echocardiography (ASE) and the European Association of Cardiovascular Imaging (EACVI), LVs were divided into 17 segments to assess regional function [1, 5]. The 2D regional LV function was assessed using echocardiography based on observed wall thickness and endocardial motions of the myocardial segments. Each segment was evaluated in multiple views to assess regional function and tagged individually using a 4-point scoring system [1]: 1, normal; 2, hypokinetic (reduced thickening); 3, akinetic (absent or negligible thickening); and 4, dyskinetic (systolic thinning or stretching). The same probe was used to acquire the 3D image.
3D regional LV function analysis
Seventeen SVEFs were individually calculated for each patient in two stages. The first was 3D LV segmentation using a QLAB 3D Quantification Advanced software ver. 10.0 (Philips Healthcare) to conduct deformable modeling without geometric assumptions [6]. The second was SVEF calculations. four mitral annular and apical points were placed on the LV, and the location of the mid interventricular septum is designated to produce an output time-volume graph for each of the 17 segments. The segmental volume versus time data were exported as a Microsoft Excel file (Microsoft Corp). For each segment, the largest and smallest volumes were defined as end-diastolic volume (EDV) and end-systolic volume (ESV), respectively. Regional SVEF values were manually calculated using the formula below:
Next, SVEF values were calculated for each segment in each patient. For each segment, 2DE-derived wall motion scores (4-point scoring system) were individually matched in succession with 3DE SVEF values.
Analysis of variance (ANOVA) was used to determine whether 3DE SVEF could differentiate between 2DE-derived wall motion score groups.
Determining a 3DE SVEF cutoff value
Based on each 3DE SVEF, the optimal cutoff point to best discriminate the 2DE wall motion score was calculated using receiver operating curve (ROC) analysis with IBM SPSS ver. 19 (IBM Corp). Because a cutoff value has not been reported for abnormal 3DE SVEF, two models were developed: model 1 using a universal fixed SVEF value for all 33 patients and model 2 using the ratio between 3DE SVEF and individual's 3DE global ejection fraction (EF) value as a parameter. An ROC curve was created for each model, and the areas under the curve (AUCs) were compared.
Comparison of estimated culprit arteries determined using 2DE and 3DE bull's-eye maps
The 3DE bull's-eye polar maps were generated using a two-color scale. Individual LV segments were tagged red if their SVEFs were equal to or greater than the cutoff value and grey if they were lower than the cutoff.
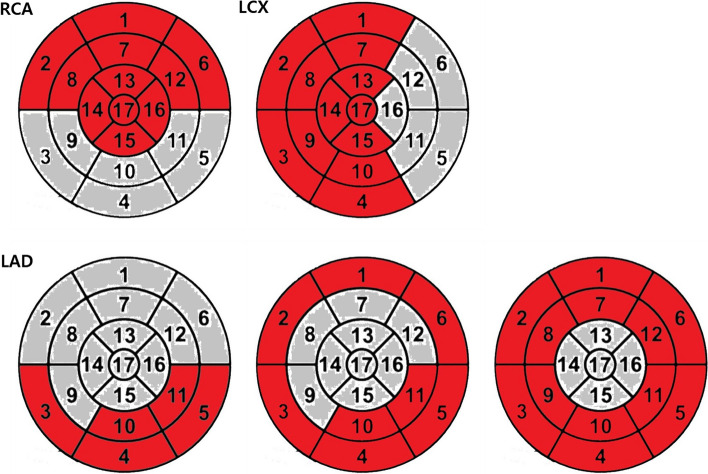
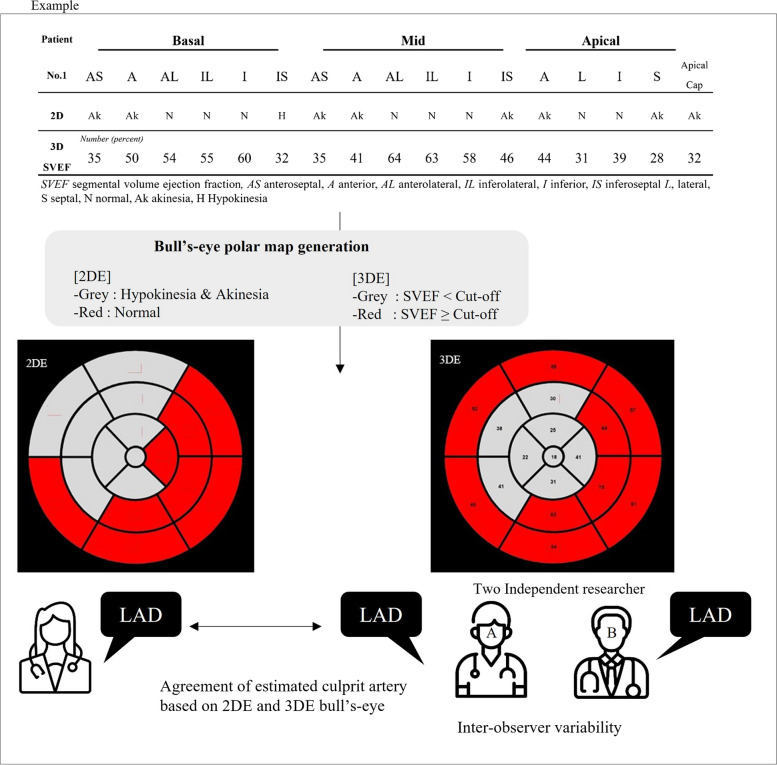
Culprit arteries were estimated in 2DE and 3DE images by an independent researcher using bull's-eye polar maps and typical coronary artery distributions established by the ASE and EACVI (Fig. 1) [1]. Cohen κ coefficients were used to assess the reliability of bull's-eye–derived culprit coronary artery prediction results based on 3DE compared with 2DE (Fig. 2).
Fig. 1.
Example of bull's-eye polar map showing the typical coronary artery distribution established by the American Society of Echocardiography and European Association of Cardiovascular Imaging [1]. The segments that could show RWMA were marked in grey, while those without RWMA were marked in red. RCA, right coronary artery; LCX, left circumflex coronary artery; LAD, left anterior descending artery; RWMA, regional wall motion abnormality
Fig. 2.
Overview of the comparison process for estimating culprit arteries determined using two-dimensional echocardiography (2DE) and three-dimensional echocardiography (3DE) bull's-eye maps. AS, anteroseptal; A, anterior; AL, anterolateral; IL, inferolateral; I, inferior; IS, inferoseptal; L, lateral; S, septal; Ak, akinesia; N, normal; H, hypokinesia; SVEF, segmental volume ejection fraction; LAD, left anterior descending artery
Interobserver and intraobserver variability
Interobserver variabilities of processes for creating 3D endocardial shell and SVEF analysis were determined using intraclass correlation coefficients (ICCs). Interobserver and intraobserver variabilities of 3DE-derived bull’s-eye culprit coronary artery prediction were determined using Cohen κ coefficients.
Results
Clinical characteristics and echocardiographic parameters
The clinical characteristics and echocardiographic parameters of the 33 study subjects are shown in Table 1: Mean patient age was 64.2 ± 12.1 years, 27 (81.8%) were male, 13 (39.4%) had hypertension, and 10 (30.3%) had diabetes. Mean body mass index was 23.07 ± 3.3 kg/m2, left ventricular ejection fraction (LVEF) was 48.5% ± 8.1%, and mean wall motion score index was 1.48 ± 0.30. The mean frame rate for full-volume 3DE datasets was 17 ± 3 Hz.
Table 1.
Baseline characteristics and echocardiographic parameters for 2DE
| Characteristic | Value (n = 33) |
|---|---|
| Male sex | 27 (81.8) |
| Age (yr) | 64.2 ± 12.1 |
| Height (cm) | 164.3 ± 7.5 |
| Weight (kg) | 64.3 ± 11.2 |
| Body mass index (kg/m2) | 23.7 ± 3.3 |
| Risk factor | |
| Hypertension | 13 (39.4) |
| Diabetes | 10 (30.3) |
| Congestive heart failure | 7 (21.2) |
| Cerebrovascular accident | 1 (3.0) |
| Systolic blood pressure (mmHg) | 119 ± 17 |
| Diastolic blood pressure (mmHg) | 76 ± 13 |
| Heart rate (bpm) | 72 ± 15 |
| Clinical diagnosis | |
| STEMI | 19 (57.6) |
| NSTEMI | 9 (27.3) |
| Stable angina | 5 (15.2) |
| Diseased vessel | |
| Left anterior descending artery | 20 (60.6) |
| Left circumflex artery | 5 (15.1) |
| Right coronary artery | 8 (24.2) |
| Echocardiographic parameter | |
| LVEF (%) | 48.5 ± 8.1 |
| LVESD (mm) | 38.0 ± 5.8 |
| LVEDD (mm) | 51.4 ± 4.9 |
| LVMI (g/m2) | 105.1 ± 32.2 |
| LAVI (mm3/m2) | 25.3 ± 11.0 |
| E' velocity (cm/sec) | 0.05 ± 0.01 |
| E velocity (m/sec) | 0.61 ± 0.14 |
| A velocity (m/sec) | 0.73 ± 0.19 |
| Wall motion score index | 1.48 ± 0.30 |
Values are presented as number (%) or mean ± standard deviation. Percentages may not total 100 due to rounding
2DE two-dimensional echocardiography, STEMI ST-segment elevation myocardial infarction, NSTEMI non-ST-segment elevation myocardial infarction, LVEF left ventricular ejection fraction, LVESD left ventricular end-systolic dimension, LVEDD left ventricular end-diastolic dimension, LVMI left ventricular mass index, LAVI left atrial volume index
Distribution of regional wall motion scores by segment determined using 2DE
The distribution of regional wall motion scores by segment determined on 2DE is shown in Table 2. Because there was no segment for dyskinesis, the regional wall motion group was separated into three subgroups: normal, hypokinesis, and akinesis. There were 14 akinesis segments, 320 normal segments, and 227 hypokinesis segments among the patients.
Table 2.
Distribution of regional wall motion scores by segment determined using 2DE (n = 33)
| 2DE regional wall motion score group | No. of segments | |||||||||||||||||
|---|---|---|---|---|---|---|---|---|---|---|---|---|---|---|---|---|---|---|
| Basal | Mid | Apical | Total | |||||||||||||||
| AS | A | AL | IL | I | IS | AS | A | AL | IL | I | IS | A | L | I | S | Apical cap | ||
| Normal | 22 | 24 | 27 | 24 | 22 | 20 | 16 | 16 | 20 | 22 | 18 | 17 | 13 | 17 | 16 | 13 | 13 | 320 |
| Hypokinesis | 9 | 8 | 6 | 7 | 10 | 12 | 16 | 17 | 13 | 10 | 15 | 16 | 19 | 15 | 17 | 18 | 19 | 227 |
| Akinesis | 2 | 1 | 0 | 2 | 1 | 1 | 1 | 0 | 0 | 1 | 0 | 0 | 1 | 1 | 0 | 2 | 1 | 14 |
| Dyskinesis | 0 | 0 | 0 | 0 | 0 | 0 | 0 | 0 | 0 | 0 | 0 | 0 | 0 | 0 | 0 | 0 | 0 | 0 |
2DE two-dimensional echocardiography, AS anteroseptal, A anterior, AL anterolateral, IL inferolateral, I inferior, IS inferoseptal, L lateral, S septal
Use of 3DE SVEF to analyze differences among normal, hypokinesis, and akinesis segments
ANOVA was performed to determine whether 3DE SVEF values can be used to differentiate among normal, hypokinesis, and akinesis segments. The analysis showed a significant difference between normal 3DE SVEF values and hypokinesis and akinesis values (F = 93.84; P < 0.001) but not those of between hypokinesis and akinesis (Fig. 3). After reclassifying hypokinesis and akinesis segments as abnormal, 3DE SVEF values for abnormal and normal segments were significantly different (Table 3).
Fig. 3.
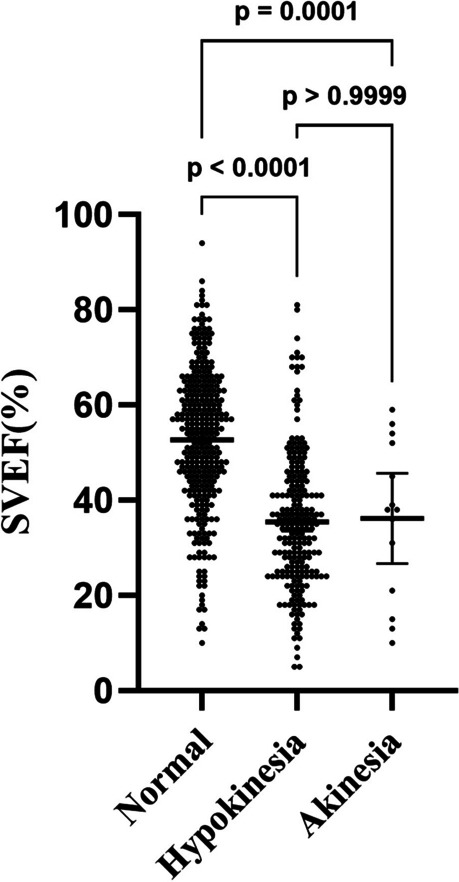
Comparison of three-dimensional echocardiography segmental volume ejection fraction (SVEF) for two-dimensional echocardiography regional wall motion scores using one-way analysis of variance with post hoc analysis and Bonferroni correction
Table 3.
Comparison of 3DE SVEF with 2DE for normal or abnormal segments
| 2DE result | P-value | ||
|---|---|---|---|
| Normal segment | Abnormal segment | ||
| 3DE SVEF (%) | 52.7 ± 15.0 | 35.5 ± 14.4 | < 0.001 |
Values are presented as mean ± standard deviation. Hypokinesia and akinesia segments were classified as abnormal
3DE three-dimensional echocardiography, SVEF segmental volume ejection fraction, 2DE two-dimensional echocardiography
Cutoff value for abnormal 3DE SVEF
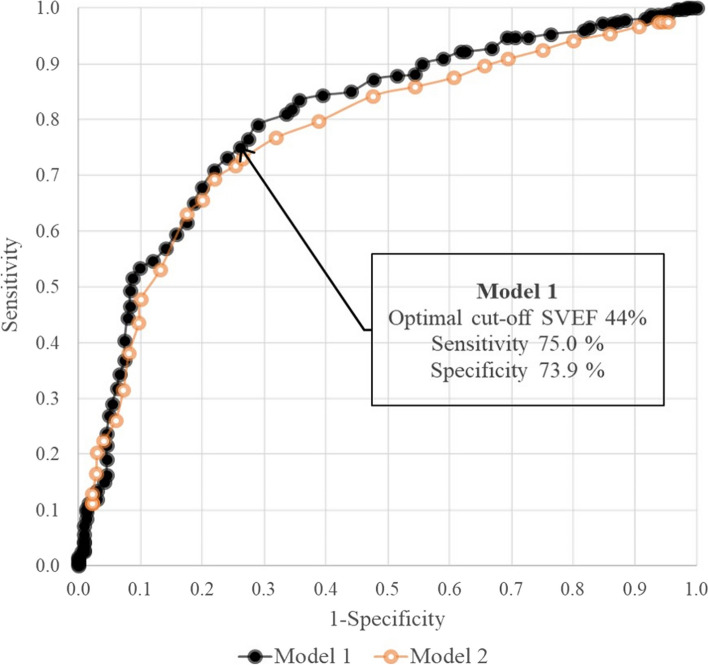
ROC curves for models 1 and 2 are provided in Fig. 4. Because model 1 had a larger AUC than the model 2, model 1 was considered to have a better diagnostic performance. Based on the model 1 ROC curve, the optimum SVEF cutoff value was 44%, with a sensitivity of 75.0% and a specificity of 73.9% (AUC, 0.801; 95% CI, 0.763 to 0.838; P < 0.001). The model 2 AUC was 0.775 (95% CI, − 0.201 to 1.750; P = 0.581).
Fig. 4.
Receiver operating characteristic (ROC) curves of models 1 and 2
Reliability of predicting coronary territory ischemia using 3DE bull’s-eye polar maps
The results of coronary angiography were 100% consistent with the 2DE predictions. A physician blind to 2DE bull’s-eye polar maps examined 3DE SVEF-derived bull’s-eye polar maps of the study participants and identified culprit coronary territory based on typical coronary artery distribution (Fig. 1). The reliability of 3DE-derived bull’s-eye culprit coronary artery prediction was 81.8% (κ = 0.672; 95% CI, 0.555 to 0.789; P < 0.001) (Table 4).
Table 4.
Reliability results of 3DE-derived bull's-eye culprit coronary artery prediction compared with 2DE
| Results of 3DE-derived bull's-eye culprit coronary artery prediction | Culprit coronary artery estimated using 2DE | |||
|---|---|---|---|---|
| LAD | LCX | RCA | TOTAL | |
| LAD | 18 | 1 | 1 | 20 |
| LCX | 0 | 4 | 2 | 6 |
| RCA | 2 | 0 | 5 | 7 |
| Total | 20 | 5 | 8 | 33 |
| κ statistic | 0.672 | |||
3DE three-dimensional echocardiography, 2DE two-dimensional echocardiography, LAD left anterior descending artery, LCX left circumflex coronary artery, RCA right coronary artery
Interobserver variabilities of 3D endocardial shells and SVEF analysis
Two examiners independently generated 3D endocardial shells and 3DE SVEF values and calculated ICCs for the SVEFs for each segment. Significant interobserver variability was not observed (ICC = 0.714; 95% CI, 0.655 to 0.762; P < 0.001).
Interobserver and intraobserver variabilities of 3DE-derived bull’s-eye predictions of culprit coronary arteries
Interobserver and intraobserver variabilities of 3DE-derived bull’s-eye culprit coronary arteries were 97.0% (κ = 0.947; 95% CI, 0.894 to 0.100; P < 0.001) and 93.9% (κ = 0.897; 95% CI, 0.827 to 0.967; P < 0.001), respectively.
Discussion
This study showed that 3DE segmental volume analysis could quantify regional LV function. Furthermore, 3DE SVEF values were significantly lower for segments showing RWMA on 2DE. After choosing a cutoff point of 44% for an abnormal 3DE SVEF, determined based on ROC curve analysis, 3DE-derived bull's-eye map coronary artery estimations showed significant agreement with 2DE estimations, which are the clinical gold standard for diagnosing IHD.
Visually determined 2DE RWMA is highly sensitive and used as a reference test [7] for imaging diagnosis of IHD and was a reference in this study. The abilities of other imaging modalities such as Doppler tissue imaging [8] and speckle tracking echocardiography [9] to predict the presence of coronary artery disease and overcome disadvantages of 2DE visual assessments have been evaluated. However, these are rarely used in clinical practice due to their limitations including lack of reference values, poor reproducibility, and significant intervendor variability in measurement [1, 10–12]. In contrast, the results of the present study were consistent with previous studies indicating that 3DE segmental volume analysis could potentially be used for quantitative analysis of RWMA. In addition, semiautomated segmental volume analysis showed the advantages of high objectivity, low interobserver variability, and excellent reproducibility. Segmental volume analysis may accurately reflect segmental RWMA because these volumes reflect the multidirectional length changes in the myocardium.
The analysis showed a significant difference between normal 3DE SVEF values and those for hypokinesis and akinesis. However, as shown in Fig. 3, the difference between hypokinesia and akinesia was nonsignificant in this study, as in a previous study [4]. Because only 14 akinesis segments were included in this study, statistical significance may not have been demonstrated.
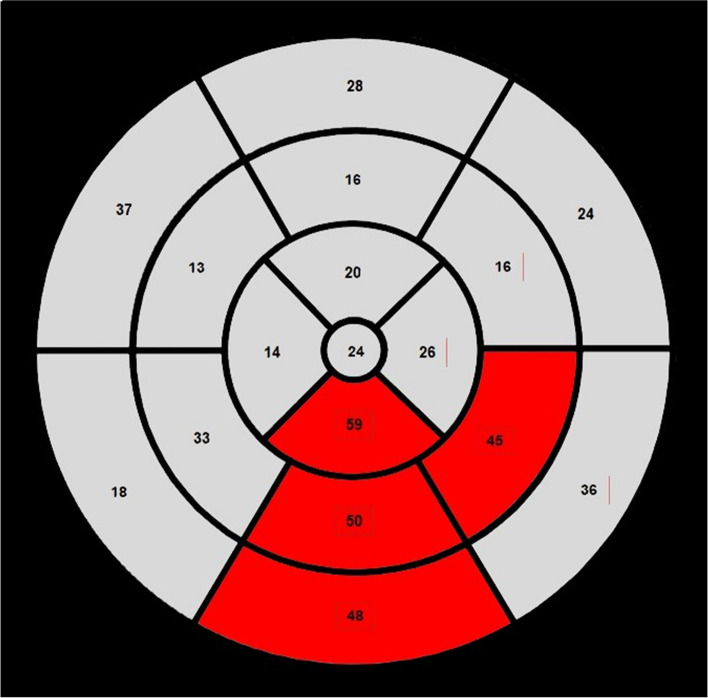
Because a standardized SVEF cutoff value has not been determined, we set the cutoff value of abnormal 3DE SVEF at 44% using ROC analysis. There was a concern that applying a fixed SVEF cutoff value might be inappropriate for patients with reduced global EF. For example, if a 44% SVEF cutoff point was determined for a patient with a global LVEF of 30%, the entire SVEF could be considered abnormal. Therefore, we explored the use of an individualized cutoff approach, expressed as a percentage of global EF, to identify the optimal value for assessing RWMA. However, it is incorrect to assume that all SVEFs are lower than the global LVEF (Fig. 5). We analyzed our data to determine the concordance rate of an SVEF cutoff value of 44% in cases where the global EF is either below or above 40%. For the group with a global EF < 40% (n = 12), the concordance rate was 91.6% (κ = 0.636; 95% CI, 0.009 to 1.264; P = 0.021). For subjects with a global EF ≥ 40% (n = 21), the concordance rate was 76.1% (κ = 0.628; 95% CI, 0.349 to 0.907; P < 0.001). These results suggest substantial prediction accuracy in both groups.Additionally, we analyzed our data to determine how the SVEF cutoff values vary in cases where the global EF is either below or above 40%.When the absolute fixed cutoff for two subgroups of global EF greater and lesser than 40% was calculated, the following results were obtained: for the group with EF < 40%, the optimal cutoff was 36% (sensitivity, 0.74; specificity 0.75); for the group with EF ≥ 40%, the optimal cutoff was 46% (sensitivity, 0.70; specificity, 0.80). Further investigation is required in low global EF populations.
Fig. 5.
A typical case of three-dimensional segmental volume ejection fraction and bull's-eye model for a patient with left ventricular ejection fraction 20%. Segmental volume ejection fractions of normal segments do not fall within the abnormal range. The segments that could show RWMA were marked in grey, while those without RWMA were marked in red. RWMA, regional wall motion abnormality
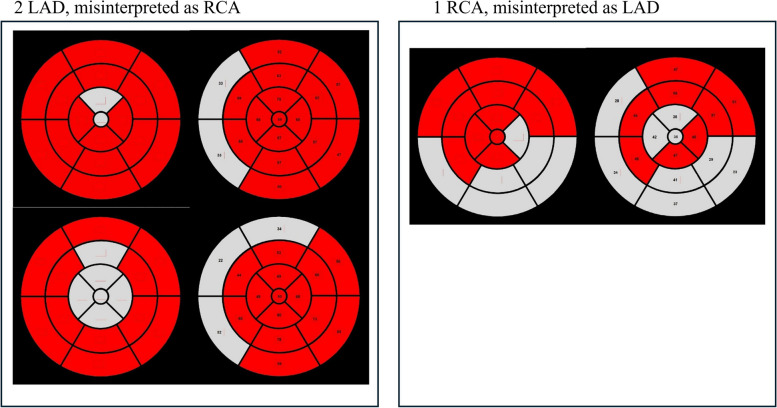
The reliability of 3DE-derived culprit coronary artery prediction was 81.8% (κ = 0.672; 95% CI, 0.555 to 0.789; P < 0.001). In the present study, the estimated culprit artery in 2D and in coronary angiography was consistent. Comparing 2D and 3D in this manner can ultimately lead to the same conclusion as when comparing to coronary angiography. In the present study, two patients with left anterior descending artery (LAD) were categorized as right coronary artery (RCA) and one patient with RCA was categorized as LAD (Fig. 6). In general, LAD and RCA abnormalities are significantly different in 2DE. Disagreement was observed in the apex and septal wall segments. In the apical segment, semiautomatic endocardial recognition was difficult when trabeculation was prominent, which was considered the main cause of recognition failure. This is consistent with previous research published by Mor-Avi et al. [6]. Due to the limitation of poor spatial resolution with real-time 3DE, endocardial surface details could not be clearly visualized. This affected the identification of LV boundaries, resulting in significant differences in global and regional volumes, especially the apex. In these cases, technical improvements and further research are needed to solve this problem.
Fig. 6.
Misinterpreted cases. A Two patients with left anterior descending artery (LAD) were categorized as right coronary artery (RCA). B One patient with RCA was categorized as LAD
The interobserver discrepancies in 3D endocardial shell generation and SVEF analysis were mainly due to differences in distinction of endocardium and trabeculae due to poor resolution. To improve interobserver variability, technological advancements are needed.
Limitations
The present study had several limitations. First, there was a high exclusion rate (16%) of subjects due to inadequate imaging, which was caused by a low 3D image frame rate or inadequate spatial resolution, particularly unclear apical wall borders.To resolve this issue, we are considering further research to analyze the SVEF of the LV by rotating images from the subcostal view to avoid the ribs, obtaining focused LV images, and creating clear boundaries of the endocardial wall using contrast 3D transthoracic echocardiography. Second, even considering the pilot nature of this study, the sample size was relatively small, and the study had a retrospective design. Third, 3DE SVEF does not account for myocardial thickening. Fourth, patients with multivessel disease were excluded, and follow-up studies are needed to determine whether the results can be adequately applied to patients with multivessel IHD.
Conclusions
The results of the present study showed that 3DE segmental volume analysis was feasible to quantify regional LV function, and the prediction of culprit coronary arteries was compatible with those of 2DE and coronary angiography. Therefore, 3DE segmental volume analysis can be used as a quantitative and objective tool for assessing RWMA in patients with IHD.
Acknowledgements
The authors sincerely thank the staff for their constant support and inspiration during this work.
Abbreviations
- 2DE:
Two-dimensional echocardiography
- 3DE:
Three-dimensional echocardiography
- ANOVA:
Analysis of variance
- ASE:
American Society of Echocardiography
- AUC:
Area under the curve
- EACVI:
European Association of Cardiovascular Imaging
- EDV:
End-diastolic volume
- EF:
Ejection fraction
- ESV:
End-systolic volume
- ICC:
Intraclass correlation coefficient
- IHD:
Ischemic heart disease
- LAD:
Left anterior descending artery
- LV:
Left ventricle
- LVEF:
Left ventricular ejection fraction
- RCA:
Right coronary artery
- ROC:
Receiver operating curve
- RWMA:
Regional wall motion abnormality
- SVEF:
Segmental volume ejection fraction
Authors’ contributions
J.-H. Kwak and K.-U. Choi have equally contributed to the present paper.
Funding
This work was supported by the 2022 Yeungnam University Research Grant.
Data availability
No datasets were generated or analysed during the current study.
Declarations
Ethics approval and consent to participate
This study was approved by the Institutional Review Board of Yeungnam University Medical Center (No. 2022–12-032). The requirement for participant informed consent was waived due to the retrospective nature of the study.
Consent for publication
Not applicable.
Competing interests
The authors declare no competing interests.
Footnotes
Publisher's Note
Springer Nature remains neutral with regard to jurisdictional claims in published maps and institutional affiliations.
Jin-Hwan Kwak and Kang-Un Choi contributed equally to this work.
References
- 1.Lang RM, Badano LP, Mor-Avi V, Afilalo J, Armstrong A, Ernande L, et al. Recommendations for cardiac chamber quantification by echocardiography in adults: an update from the American Society of Echocardiography and the European Association of Cardiovascular Imaging. Eur Heart J Cardiovasc Imaging. 2015;16:233–70. [DOI] [PubMed] [Google Scholar]
- 2.Choi JO, Cho SW, Song YB, Cho SJ, Song BG, Lee SC, et al. Longitudinal 2D strain at rest predicts the presence of left main and three vessel coronary artery disease in patients without regional wall motion abnormality. Eur J Echocardiogr. 2009;10:695–701. [DOI] [PubMed] [Google Scholar]
- 3.Surkova E, Muraru D, Aruta P, Romeo G, Bidviene J, Cherata D, et al. Current clinical applications of three-dimensional echocardiography: when the technique makes the difference. Curr Cardiol Rep. 2016;18:109. [DOI] [PubMed] [Google Scholar]
- 4.Youssef G, Saad Z, Ammar W, Sharaf Y. Assessment of left ventricular regional wall motion abnormalities using regional time-volume curves obtained by real time three-dimensional echocardiography. Egypt Heart J. 2018;70:189–94. [DOI] [PMC free article] [PubMed] [Google Scholar]
- 5.Segmentation AHAWGoM, Imaging: RfC, Cerqueira MD, Weissman NJ, Dilsizian V, Jacobs AK, Kaul S, Laskey WK, et al. Standardized myocardial segmentation and nomenclature for tomographic imaging of the heart: a statement for healthcare professionals from the Cardiac Imaging Committee of the Council on Clinical Cardiology of the American Heart Association. Circulation. 2002;105:539–542. [DOI] [PubMed]
- 6.Mor-Avi V, Jenkins C, Kühl HP, Nesser HJ, Marwick T, Franke A, et al. Real-time 3-dimensional echocardiographic quantification of left ventricular volumes: multicenter study for validation with magnetic resonance imaging and investigation of sources of error. JACC Cardiovasc Imaging. 2008;1:413–23. [DOI] [PubMed] [Google Scholar]
- 7.Sabia P, Afrookteh A, Touchstone DA, Keller MW, Esquivel L, Kaul S. Value of regional wall motion abnormality in the emergency room diagnosis of acute myocardial infarction: a prospective study using two-dimensional echocardiography. Circulation. 1991;84(3 Suppl):I85–92. [PubMed] [Google Scholar]
- 8.Derumeaux G, Ovize M, Loufoua J, André-Fouet X, Minaire Y, Cribier A, et al. Doppler tissue imaging quantitates regional wall motion during myocardial ischemia and reperfusion. Circulation. 1998;97:1970–7. [DOI] [PubMed] [Google Scholar]
- 9.Sjøli B, Ørn S, Grenne B, Ihlen H, Edvardsen T, Brunvand H. Diagnostic capability and reproducibility of strain by Doppler and by speckle tracking in patients with acute myocardial infarction. JACC Cardiovasc Imaging. 2009;2:24–33. [DOI] [PubMed] [Google Scholar]
- 10.Heimdal A, Støylen A, Torp H, Skjaerpe T. Real-time strain rate imaging of the left ventricle by ultrasound. J Am Soc Echocardiogr. 1998;11:1013–9. [DOI] [PubMed] [Google Scholar]
- 11.Leitman M, Lysyansky P, Sidenko S, Shir V, Peleg E, Binenbaum M, et al. Two-dimensional strain-a novel software for real-time quantitative echocardiographic assessment of myocardial function. J Am Soc Echocardiogr. 2004;17:1021–9. [DOI] [PubMed] [Google Scholar]
- 12.Stefani L, Toncelli L, Gianassi M, Manetti P, Di Tante V, Vono MR, et al. Two-dimensional tracking and TDI are consistent methods for evaluating myocardial longitudinal peak strain in left and right ventricle basal segments in athletes. Cardiovasc Ultrasound. 2007;5:7. [DOI] [PMC free article] [PubMed] [Google Scholar]
Associated Data
This section collects any data citations, data availability statements, or supplementary materials included in this article.
Data Availability Statement
No datasets were generated or analysed during the current study.


