Abstract
Androglobin (Adgb) was discovered as the fifth mammalian globin, but its structure and function remain elusive. In this study, the heme-binding globin domain of Adgb was expressed and its interaction with calmodulin (CaM) was investigated. The protein structure of Adgb and its complex with CaM were predicted using AlphaFold3 and HDOCK. The circularly permutated globin domain of Adgb was well folded with a heme group, which can interact with CaM via the IQ motif. In experimental studies, two mutants of CaM (G41C and G114C) were constructed and labeled with a fluorescent molecule (fluorescein-5-maleimide) in the N-lobe and C-lobe, respectively. Upon binding to Adgb, a greater fluorescence quenching effect was observed for the labeling of Cys41 in the N-lobe due to energy transfer to the heme group, which is consistent with the predicted structure of the Adgb–CaM complex. Furthermore, as shown by UV-vis kinetic studies, the binding of CaM enhanced the nitrite reductase activity of Adgb. This study reveals a regulatory role of CaM for the unique Adgb and provides valuable information for understanding the structure–function relationship.
The structure of the fifth mammalian globin, androglobin (Adgb), and its complex with calmodulin (CaM) were predicted using AlphaFold3 and HDOCK, and the binding of CaM was shown to enhance the nitrite reductase activity of Adgb.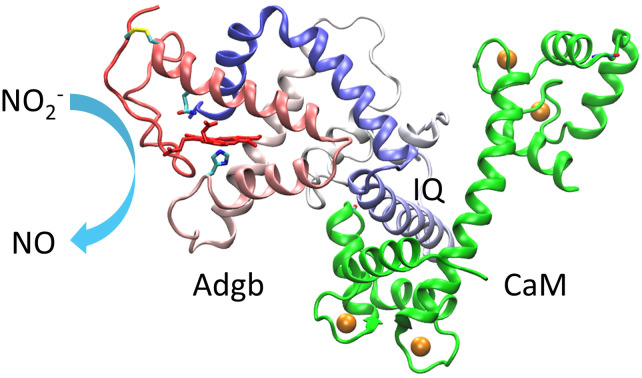
1. Introduction
Globins are heme-containing proteins that perform a variety of biological functions, including O2 binding and delivery, nitrite reduction, and NO binding.1 In addition to the four globin members, hemoglobin (Hb), myoglobin (Mb), neuroglobin (Ngb), and cytoglobin (Cygb), the fifth mammalian globin, androglobin (Adgb), was first discovered in the testis in 2012.2 It has also been shown to be expressed in the female reproductive tract and other tissues such as the lungs and brain.3 As a spermatogenesis-inducing factor, Adgb is required for male fertility and its absence leads to the formation of defective sperm heads and flagella.4 Regulation of Adgb by the transcription factor FOXJ1 also suggests a role in ciliogenesis.3 In addition, knockdown of Adgb has been shown to increase apoptosis and inhibit the growth of the glioma cell line.5 Recently, variants in the Adgb gene have been identified that cause asthenozoospermia and male infertility.6 Despite these advances, the function of Adgb is still not fully understood.
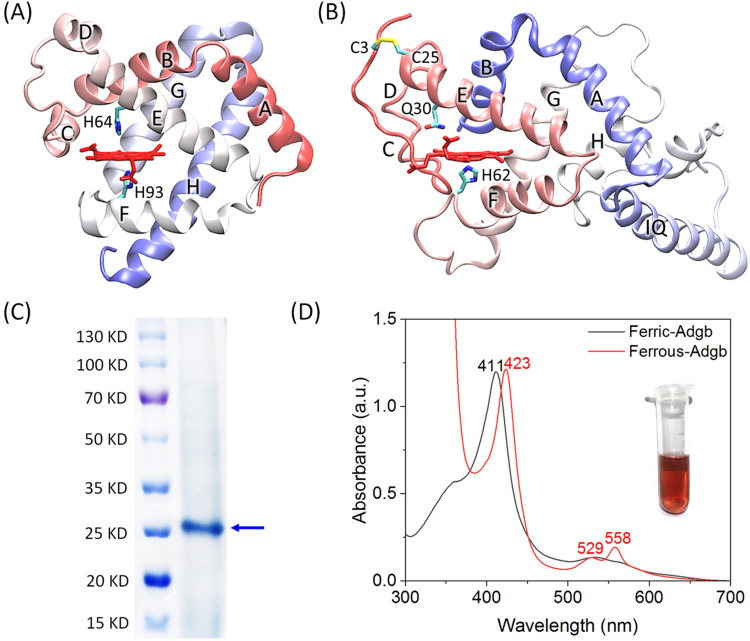
Adgb is a chimeric protein, containing a calpain-7-like region in the N-terminus, a heme-binding globin domain, and a coiled-coil region in the C-terminus.2 Unlike other globins such as Mb with eight helixes (HA-HH) (Fig. 1A),7 the heme-binding globin domain of Adgb is circularly permuted with an IQ motif for binding calmodulin (CaM) (HC-HH-IQ-HA-HB).2 Due to the difficulty in expressing the full-length protein, no X-ray or NMR structural information is available for Adgb. Recently, Reeder and co-workers predicted the structure of the heme-binding globin domain of Adgb using Modeller and AlphaFold2, and showed that Adgb has nitrite reductase (NIR) activity.8 It is important to note that NIR activity is a common function of heme globins,9 which play a role in maintaining NO homeostasis under hypoxic conditions with low oxygen concentrations. Nevertheless, it remains unclear whether this is a natural function of Adgb.
Fig. 1. (A) X-ray structure of sperm whale Mb (PDB code 1JP6), showing the overall structure with eight helixes (HA-HH), the heme group, the proximal His93 and the distal His64. (B) The modeling structure of the heme-binding globin domain of Adgb. The secondary structure of HC-HH-IQ-HA-HB is marked, the heme group, the proximal His62, the distal Gln30, and the disulfide bond of C3–C25 are highlighted. (C) SDS-PAGE of the purified heme-binding globin domain of Adgb. The protein markers are shown for comparison. (D) UV-vis spectra of Adgb in the ferric and ferrous states. The inset shows the protein solution of the ferric Adgb.
As a prototypical calcium sensor, CaM regulates hundreds of proteins in multiple signaling pathways and controls the majority of cellular functions.10,11 In the cases of heme proteins, studies of their interactions with CaM are limited only to the nitric oxide synthase (NOS).12 This protein contains several domains, including the heme domain, the CaM-binding IQ domain and coenzyme-binding domains, and catalyzes the metabolism of Arg to produce NO under normoxic conditions.13 Under hypoxic conditions, NOS loses its function and, alternatively, heme globins exhibit NIR activity by catalyzing the reduction of nitrite and regulating the intracellular concentration of NO.9,14–16 To date, there has been no study of the interaction between CaM and Adgb. Although it is known that CaM signaling is through the IQ motif,17 how CaM interacts with Adgb and regulates its NIR function remains unknown.
For this purpose, we herein expressed both the heme-binding globin domain of Adgb and CaM. The CaM was labeled with a fluorescent molecule, fluorescein-5-maleimide (FL) in the N-lobe or C-lobe. The structure of the heme-binding globin domain of Adgb and its interaction with CaM were modeled by AlphaFold318 and HDOCK,19 respectively. The results suggest that CaM can interact with Adgb and regulate its function mainly through the N-lobe, resulting in enhanced NIR activity, as shown by UV-vis kinetic studies.
2. Materials and methods
2.1. Protein modeling and docking studies
The amino acid sequence of the heme-binding globin domain of human Adgb was obtained as previously reported by Hoogewijs and co-workers.2 The AlphaFold3 program was used to model the structure, which predicts the 3D coordinates of all heavy atoms without the heme group. The resulting model was then subjected to molecular simulation by adding a heme group to the proposed heme binding pocket using the program VMD (visual molecular dynamics) 1.9.20 A patch of disulfide bond was applied to Cys3–Cys25. The protein system was minimized with NAMD2.9 (nanoscale molecular dynamics),21 using 10 000 minimization steps with the conjugate gradient method at 0 K, and equilibrated for 1 000 000 molecular dynamics steps (1 fs per step) at 300 K, then further minimized for 10 000 steps at 0 K.
The obtained structure and the X-ray structure of Ca2+-bound CaM (PDB code 1EXR22) were then used for molecular docking studies, using a web server of HDOCK for protein–protein docking based on a hybrid algorithm of template-based modeling.19 Among the top 10 models, the two models with the highest confidence scores were subjected to structural analysis using VMD1.9.20 The structure of the Adgb–CaM complex was also predicted with AlphaFold318 for comparison.
2.2. Protein expression and purification
The genes of Adgb (Cys132 was mutated to Ser to facilitate the protein purification, Fig. S1, ESI†) and CaM were synthesized by Nanjing Jinsirui Biotechnology Co. and inserted into the expression vector pET-30a(+). The vector was transformed into E. coli BL21(DE3) cells by the heat shock method (42 °C, 90 s). Adgb was expressed in 3 L of medium containing 50 μg mL−1 kanamycin sulfate and shaken at 37 °C (200 rpm). Protein expression was completed when the optical density was 0.8–1.0 at 600 nm, and then 0.5 mM IPTG was added to induce protein expression overnight. The harvested cells were sonicated to allow complete lysis, and then the centrifuged precipitate was denatured and purified using the same procedure as reported by Dewilde and co-workers.23 10% SDS-PAGE was then used to determine the purity of the sample.
CaM was expressed in the same medium. When the optical density was 0.8–1.0 at 600 nm, 0.5 mM IPTG was added to induce protein expression at 30 °C for 5 h. The His×6-CaM protein was eluted with nickel column buffer (50 mM Tris–HCl pH 7.5, 150 mM NaCl, 500 mM imidazole) and reacted at 25 °C for 4 h, and the His-tag was then digested with HRV3C enzyme. The G41C CaM and G114C CaM mutants were constructed using the quik change lightning site-directed mutagenesis kit and purified using the same procedure as that of CaM. For covalent modification with fluorescein-5-maleimide (FL, purchased from Adamas-beta), the protein was incubated with 5 eq. of FL in 20 mM phosphate buffer (pH 7.0) for 4 h. The modified proteins (termed FL-G41C CaM, FL-G114C CaM) were further purified using a PD-10 column (GE Healthcare) to remove the excess FL.
2.3. UV-vis studies
UV-vis spectra were recorded on a PerkinElmer Lambda 365. The protein concentration of Adgb was determined with an extinction coefficient of ε412nm = 99 ± 5 mM−1 cm−1, as calculated using the hemochromogen method.24 UV-vis spectrum of the protein was measured in the ferric state, and the spectrum of the ferrous state was obtained by adding a small amount of Na2S2O4. The protein concentrations of CaM, G41C-CaM and G114C-CaM were determined with an extinction coefficient of ε280nm = 2980 M−1 cm−1.25
2.4. Mass spectrometry
Protein samples were desalted using a PD-10 column (GE Healthcare). After the addition of formic acid to a final concentration of 1%, the mixture was transferred into the mass spectrometer chamber for measurement under positive mode. The data were analyzed using G2-XS QTOF mass spectrometry (Waters) and the multiple m/z peaks were transformed to the protein molecular weight by using the software MaxEnt1.
2.5. Fluorescence spectroscopy
Fluorescence spectra were recorded on an F-7000 fluorescence spectrometer using tandem double-window cuvettes (0.5 cm for each). The emission spectra of Adgb (5 μM) before and after mixing with an equal concentration of FL-G41C CaM and FL-G114C CaM, respectively, in 100 mM phosphate buffer, pH 7.0, were measured in a region of 450 to 650 nm with an excitation wavelength of 494 nm.
2.6. NIR activity assay
The NIR activity of Adgb in the absence and the presence of CaM was determined using an HP8453 diode array UV-vis spectrophotometer. The reaction of the protein (5 μM) in deoxygenated phosphate buffer (100 mM, pH 7.0) was measured anaerobically by degassing the sealed cuvette and refilling with highly purified N2 gas with varying concentrations of sodium nitrite (2.5–15 mM) in the presence of an excess of Na2S2O4. The spectral changes were monitored and the absorbance difference (ΔA386–423nm) was calculated using the equation reported by Reeder and co-workers.8 The absorbance difference versus time was fitted to the double-exponential equation. The rate constants of k1 (fast) versus the nitrite concentrations were fitted to the Michaelis–Menten equation to obtain the rate constant of nitrite reduction (knitrite, mM−1 s−1).
3. Results and discussion
3.1. Predicted structure and purification of Adgb
Based on the amino acid sequence reported by Hoogewijs and co-workers,2 the structure of the heme-binding globin domain of Adgb including the CaM-binding motif IQ was predicted using AlphaFold3. Since the modelled structure did not contain the heme group, we added a heme group to the proposed heme binding pocket and performed an MD simulation. As shown in Fig. 1B, the modeling structure shows that the heme group binds to the heme pocket between helixes E and F, similar to that of Mb (Fig. 1A). His62 in helix F acts as the heme proximal ligand, and Asn30 in helix E is located in the heme distal position, in agreement with the prediction of previous studies.2,8 The helical structures of C and D are not well formed, which are stabilized by the disulfide bond between Cys3 and Cys25. The IQ motif is located between helices H and A, and adopts a long helical structure, which is a typical conformation for CaM binding. The C-terminal helices A and B package with helices G and H, resulting in the classical sandwich structure of globins.26
The heme-binding globin domain of Adgb was then expressed and purified from E. coli cells according to the procedure, as previously reported.23 As shown by SDS-PAGE, the target band was in agreement with the expected molecular weight for the protein polypeptide (∼25 kD) (Fig. 1C). In addition, no bands of dimeric or multimeric forms were observed, suggesting that the protein was well folded in the monomeric form. UV-vis spectra of Adgb showed that the isolated protein was in the oxidized form, with a Soret band at 411 nm. In the reduced state, the Soret band was shifted to 423 nm, with two visible bands appearing at 529 and 558 nm (Fig. 1D), which are characteristic of ferrous heme in the six-coordination state, such as Hbs27 and neuroglobin (Ngb) with bis-His six-coordination. These observations suggest that Gln30 in the heme distal site may coordinate to the heme iron in the ferrous state.
3.2. Labeling of CaM and interaction with Adgb
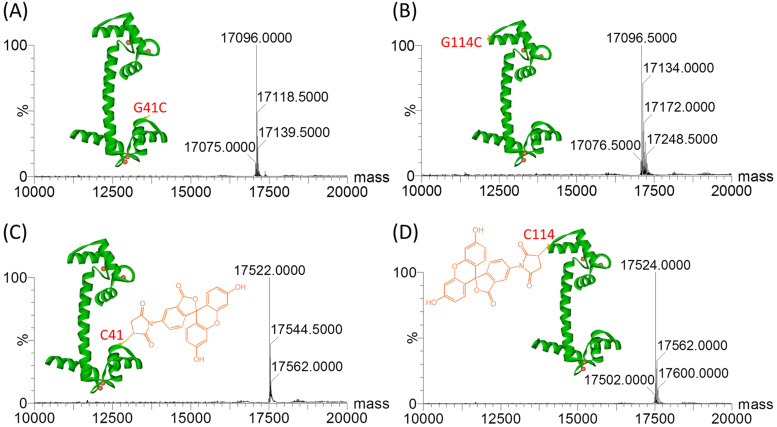
To study the interaction between Adgb and CaM, we expressed CaM in E. coli cells and constructed two mutants, G41C CaM and G114C CaM, by introducing a Cys residue into the loop region of the N-lobe and C-lobe, respectively. The single Cys facilitates the covalent modification by fluorescent molecules such as fluorescein-5-maleimide (FL) with a maleimide group (Fig. S2, ESI†).28 Protein mass spectra confirmed that CaM (Fig. S3, ESI†) and the two mutants (Fig. S4 and Fig. 2A and B, ESI†) were obtained with high purity. The modified proteins, termed FL-G41C CaM and FL-G114C CaM, were further confirmed by mass analysis, which showed an increase of 426 Da (calculated molecular weight, 427.3 Da) in the protein mass spectra (Fig. 2C and D), indicating that one FL molecule was covalently attached to the protein peptide chain.
Fig. 2. ESI-MS spectra of G41C CaM (A) and (C) and G114C CaM (B) and (D) mutants before ((A) and (B), calculated 17 095 Da) and after ((C) and (D), calculated 17 522.3 Da) modification by FL. The X-ray structure of Ca2+-bound CaM (PDB code 1EXR) and the chemical structure of FL are shown as insets to highlight the positions of Gly41 and Gly114 and the chemical modifications.
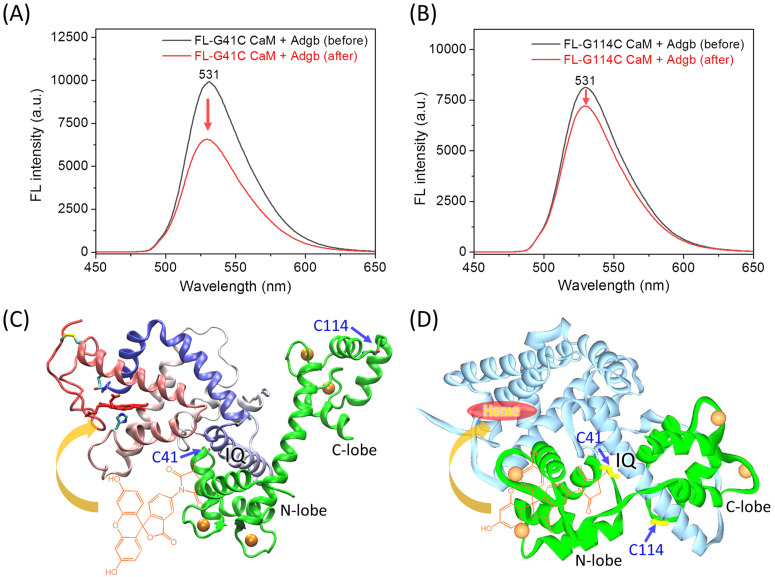
Fluorescence spectra of FL-G41C CaM and FL-G114C CaM were then collected before and after the addition of an equivalent amount of Adgb protein. As shown in Fig. 3A for FL-G41C CaM, the presence of Adgb resulted in a ∼35% decrease in the intensity of the absorbance at 531 nm, whereas only a ∼10% decrease was observed for the interaction between FL-G114C CaM and Adgb (Fig. 3B). These results suggest that a greater fluorescence quenching effect occurs when FL is covalently attached to the N-lobe at position 41 than when it is attached to the C-lobe at position 114, as a result of an energy transfer between FL and the heme group.29
Fig. 3. (A) and (B) Fluorescence spectra of FL-G41C CaM (A) and FL-G114C CaM (B) before and after mixing with Adgb. The arrows indicate the decrease in the intensity. (C) The docking structure of the Adgb–CaM complex with the lowest binding energy calculated by HDOCK. The chemical modification of Cys41 by FL is shown to clarify the energy transfer to the heme group, as indicated by the arrow. (D) The predicted structure of the Adgb–CaM complex by AlphaFold3. The position of heme binding is highlighted.
To further provide structural information for the experimental observations, we performed molecular docking studies of CaM binding to Adgb using two programs, HDOCK and AlphaFold3, which are based on the structural information and the amino acid sequence, respectively. The modeling structure of the heme-binding globin domain of Adgb and the X-ray structure of Ca2+-bound CaM (PDB code 1EXR22) were submitted to the online server of HDOCK, which generated ten complexes of Adgb–CaM. The docking structure with the lowest binding energy is shown in Fig. 3C. The complex structure shows that the IQ motif interacts with the N-lobe and the long helical structure of CaM. Consequently, the fluorescent group of FL covalently linked to Cys41 is closer to the heme group than that linked to Cys114, thus facilitating the energy transfer. This is further supported by the complex structure predicted by AlphaFold3, which shows that the IQ motif interacts with both the N-lobe and C-lobe of CaM, with the N-lobe close to the heme-binding pocket (Fig. 3D). Note that the long helical structure of Ca2+-bound CaM was not formed in the prediction by AlphaFold3, similar to the X-ray structure of the apo-CaM (PDB code 1CFD30). In addition, the heme group in the heme-binding globin domain of Adgb was missing because the simulation was based on the amino acid sequence only.18
3.3. NIR activity of Adgb and regulation by CaM
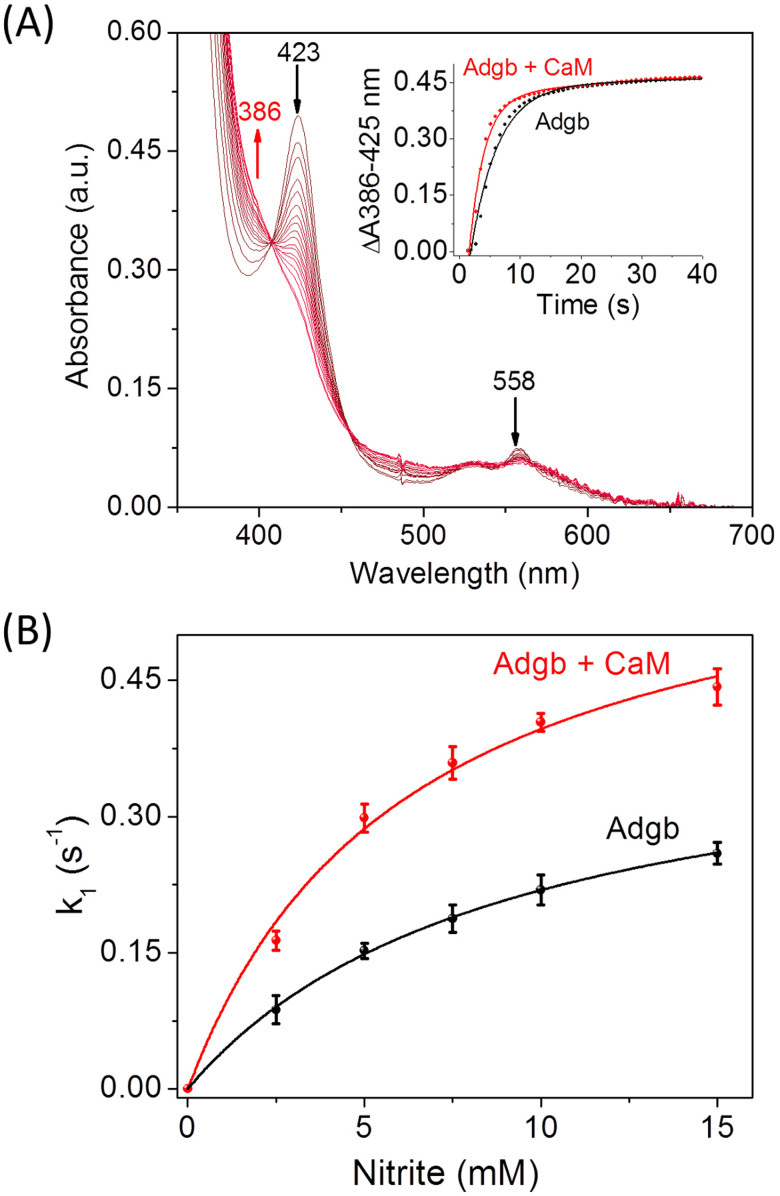
To investigate the regulatory effect of CaM on the NIR activity of Adgb, we determined the NIR activity of the heme-binding globin domain of Adgb in the absence and the presence of CaM using kinetic UV-vis studies under anaerobic conditions. Adgb was maintained in the reduced state by the addition of excess Na2S2O4. As shown in Fig. 4A, the Soret band (423 nm) of the ferrous heme decreased rapidly upon reaction with sodium nitrite, with an increase in absorbance at around 386 nm. In addition, the visible band at 558 nm decreased simultaneously. These spectral changes are consistent with the previous studies8 and are attributed to the reduction of nitrite and the generation of the product NO, which is recombined with the iron center.
Fig. 4. (A) UV-vis spectra of the ferrous Adgb–CaM complex (5 μM in 100 mM phosphate buffer, pH 7.0) in reaction with sodium nitrite (10 mM). The absorbance difference between 386 nm and 423 nm versus time is shown as an inset, which was fitted to the double-exponential equation, with that of ferrous Adgb shown for comparison. (B) The plots of the rate constant (k1) versus the nitrite concentrations for Adgb in the absence and the presence of CaM, which were fitted to the Michaelis–Menten equation.
Based on the spectral changes between 386 nm and 423 nm (Fig. 4A, inset), the rate constants of k1 (fast) were calculated to be 4.08 × 10⁻¹ s−1 for the Adgb–CaM complex, which is ∼1.8-fold that of Adgb, indicating that the presence of CaM enhances the rate of nitrite reduction. In addition, the concentrations of nitrite were varied to determine the catalytic parameters. As shown in Fig. 4B, the plots of k1 value versus nitrite concentration were well fitted to the Michaelis–Menten equation (Fig. 4B). The results showed that the Adgb–CaM complex has a catalytic efficiency (kcat/KM) of 0.102 mM−1 S−1 (kcat = 0.64 ± 0.04 s−1, KM = 6.23 ± 1.00 mM), which is ∼2.2-fold higher than that of Adgb (kcat = 0.42 ± 0.04 s−1, KM = 9.06 ± 0.49 mM, kcat/KM = 0.046 mM−1 S−1). These results suggest that the formation of the Adgb–CaM complex facilitates both the binding and reduction of nitrite.
4. Conclusion
In summary, we have expressed the heme-binding globin domain of Adgb and predicted its structure using AlphaFold3 and molecular dynamics simulation. The model structure showed that the circularly permutated globin domain was well folded with a heme group, and the N-terminal region was stabilized by an intramolecular disulfide bond of Cys3–Cys25. The interaction of CaM and Adgb was further investigated by labeling CaM with a fluorescent molecule, which showed that labeling of Cys41 in the N-lobe results in a greater fluorescence quenching effect due to energy transfer to the heme group. Molecular docking studies using both AlphaFold3 and HDOCK provided insight into the structure of the Adgb–CaM complex, revealing that CaM can interact with Adgb via the IQ motif. More importantly, UV-vis kinetic studies showed that the binding of CaM enhances the NIR activity of Adgb. Therefore, the regulatory role of CaM revealed in this study provides valuable information for understanding the structure–function relationship of the unique Adgb and its related diseases.
Data availability
The datasets supporting this article have been uploaded as part of the ESI.†
Conflicts of interest
There are no conflicts to declare.
Supplementary Material
Acknowledgments
This work was supported by the National Natural Science Foundation of China (32171270 and 22107046). We would also like to thank Ms Yiyanyu Wang for her help.
Electronic supplementary information (ESI) available. See DOI: https://doi.org/10.1039/d4cb00245h
References
- Burmester T. Hankeln T. Function and evolution of vertebrate globins. Acta Physiol. 2014;211(3):501–514. doi: 10.1111/apha.12312. [DOI] [PubMed] [Google Scholar]
- Hoogewijs D. Ebner B. Germani F. Hoffmann F. G. Fabrizius A. Moens L. Burmester T. Dewilde S. Storz J. F. Vinogradov S. N. Hankeln T. Androglobin: A Chimeric Globin in Metazoans That Is Preferentially Expressed in Mammalian Testes. Mol. Biol. Evol. 2011;29(4):1105–1114. doi: 10.1093/molbev/msr246. [DOI] [PMC free article] [PubMed] [Google Scholar]
- Koay T. W. Osterhof C. Orlando I. M. C. Keppner A. Andre D. Yousefian S. Suárez Alonso M. Correia M. Markworth R. Schödel J. Hankeln T. Hoogewijs D. Androglobin gene expression patterns and FOXJ1-dependent regulation indicate its functional association with ciliogenesis. J. Biol. Chem. 2021;296:100291. doi: 10.1016/j.jbc.2021.100291. [DOI] [PMC free article] [PubMed] [Google Scholar]
- Keppner A. Correia M. Santambrogio S. Koay T. W. Maric D. Osterhof C. Winter D. V. Clerc A. Stumpe M. Chalmel F. Dewilde S. Odermatt A. Kressler D. Hankeln T. Wenger R. H. Hoogewijs D. Androglobin, a chimeric mammalian globin, is required for male fertility. eLife. 2022;11:e72374. doi: 10.7554/eLife.72374. [DOI] [PMC free article] [PubMed] [Google Scholar]
- Huang B. Lu Y. S. Li X. Zhu Z. C. Li K. Liu J. W. Zheng J. Hu Z. L. Androglobin knockdown inhibits growth of glioma cell lines. Int. J. Clin. Exp. Pathol. 2014;7(5):2179–2184. [PMC free article] [PubMed] [Google Scholar]
- Qu R. Zhang Z. Wu L. Li Q. Mu J. Zhao L. Yan Z. Wang W. Zeng Y. Liu R. Dong J. Li Q. Sun X. Wang L. Sang Q. Chen B. Kuang Y. ADGB variants cause asthenozoospermia and male infertility. Hum. Genet. 2023;142(6):735–748. doi: 10.1007/s00439-023-02546-0. [DOI] [PubMed] [Google Scholar]
- Urayama P. Phillips, Jr. G. N. Gruner S. M. Probing substates in sperm whale myoglobin using high-pressure crystallography. Structure. 2002;10(1):51–60. doi: 10.1016/s0969-2126(01)00699-2. [DOI] [PubMed] [Google Scholar]
- Reeder B. J. Deganutti G. Ukeri J. Atanasio S. Svistunenko D. A. Ronchetti C. Mobarec J. C. Welbourn E. Asaju J. Vos M. H. Wilson M. T. Reynolds C. A. The circularly permuted globin domain of androglobin exhibits atypical heme stabilization and nitric oxide interaction. Chem. Sci. 2024;15(18):6738–6751. doi: 10.1039/d4sc00953c. [DOI] [PMC free article] [PubMed] [Google Scholar]
- Gladwin M. T. Kim-Shapiro D. B. The functional nitrite reductase activity of the heme-globins. Blood. 2008;112(7):2636–2647. doi: 10.1182/blood-2008-01-115261. [DOI] [PMC free article] [PubMed] [Google Scholar]
- Chin D. Means A. R. Calmodulin: a prototypical calcium sensor. Trends Cell Biol. 2000;10(8):322–328. doi: 10.1016/s0962-8924(00)01800-6. [DOI] [PubMed] [Google Scholar]
- Berchtold M. W. Villalobo A. Ca(2+)/calmodulin signaling in organismal aging and cellular senescence: Impact on human diseases. Biochim. Biophys. Acta, Mol. Basis Dis. 2025;2:167583. doi: 10.1016/j.bbadis.2024.167583. [DOI] [PubMed] [Google Scholar]
- Hanson Q. M. Carley J. R. Gilbreath T. J. Smith B. C. Underbakke E. S. Calmodulin-induced Conformational Control and Allostery Underlying Neuronal Nitric Oxide Synthase Activation. J. Mol. Biol. 2018;430(7):935–947. doi: 10.1016/j.jmb.2018.02.003. [DOI] [PubMed] [Google Scholar]
- Li J. Zheng H. Wang W. Miao Y. Sheng Y. Feng C. Role of an isoform-specific residue at the calmodulin-heme (NO synthase) interface in the FMN – heme electron transfer. FEBS Lett. 2018;592(14):2425–2431. doi: 10.1002/1873-3468.13158. [DOI] [PMC free article] [PubMed] [Google Scholar]
- Hendgen-Cotta U. B. Kelm M. Rassaf T. A highlight of myoglobin diversity: the nitrite reductase activity during myocardial ischemia-reperfusion. Nitric oxide. 2010;22(2):75–82. doi: 10.1016/j.niox.2009.10.003. [DOI] [PubMed] [Google Scholar]
- Kamga C. Krishnamurthy S. Shiva S. Myoglobin and mitochondria: a relationship bound by oxygen and nitric oxide. Nitric oxide. 2012;26(4):251–258. doi: 10.1016/j.niox.2012.03.005. [DOI] [PMC free article] [PubMed] [Google Scholar]
- Tong X.-Y. Yang X.-Z. Teng X. Gao S.-Q. Wen G.-B. Lin Y.-W. Myoglobin mutant with enhanced nitrite reductase activity regulates intracellular oxidative stress in human breast cancer cells. Arch. Biochem. Biophys. 2022;730:109399. doi: 10.1016/j.abb.2022.109399. [DOI] [PubMed] [Google Scholar]
- Bähler M. Rhoads A. Calmodulin signaling via the IQ motif. FEBS Lett. 2002;513(1):107–113. doi: 10.1016/s0014-5793(01)03239-2. [DOI] [PubMed] [Google Scholar]
- Abramson J. Adler J. Dunger J. Evans R. Green T. Pritzel A. Ronneberger O. Willmore L. Ballard A. J. Bambrick J. Bodenstein S. W. Evans D. A. Hung C.-C. O’Neill M. Reiman D. Tunyasuvunakool K. Wu Z. Žemgulytė A. Arvaniti E. Beattie C. Bertolli O. Bridgland A. Cherepanov A. Congreve M. Cowen-Rivers A. I. Cowie A. Figurnov M. Fuchs F. B. Gladman H. Jain R. Khan Y. A. Low C. M. R. Perlin K. Potapenko A. Savy P. Singh S. Stecula A. Thillaisundaram A. Tong C. Yakneen S. Zhong E. D. Zielinski M. Žídek A. Bapst V. Kohli P. Jaderberg M. Hassabis D. Jumper J. M. Accurate structure prediction of biomolecular interactions with AlphaFold 3. Nature. 2024;630(8016):493–500. doi: 10.1038/s41586-024-07487-w. [DOI] [PMC free article] [PubMed] [Google Scholar]
- Yan Y. Zhang D. Zhou P. Li B. Huang S. Y. HDOCK: a web server for protein-protein and protein-DNA/RNA docking based on a hybrid strategy. Nucleic Acids Res. 2017;45(W1):W365–W373. doi: 10.1093/nar/gkx407. [DOI] [PMC free article] [PubMed] [Google Scholar]
- Humphrey W. Dalke A. Schulten K. VMD: visual molecular dynamics. J. Mol. Graphics. 1996;14(1):27–28. doi: 10.1016/0263-7855(96)00018-5. [DOI] [PubMed] [Google Scholar]
- Kalé L. Skeel R. Bhandarkar M. Brunner R. Gursoy A. Krawetz N. Phillips J. Shinozaki A. Varadarajan K. Schulten K. NAMD2: Greater Scalability for Parallel Molecular Dynamics. J. Comput. Phys. 1999;151(1):283–312. [Google Scholar]
- Wilson M. A. Brunger A. T. The 1.0 Å crystal structure of Ca(2+)-bound calmodulin: an analysis of disorder and implications for functionally relevant plasticity. J. Mol. Biol. 2000;301(5):1237–1256. doi: 10.1006/jmbi.2000.4029. [DOI] [PubMed] [Google Scholar]
- Bracke A. Hoogewijs D. Dewilde S. Exploring three different expression systems for recombinant expression of globins: Escherichia coli, Pichia pastoris and Spodoptera frugiperda. Anal. Biochem. 2018;543:62–70. doi: 10.1016/j.ab.2017.11.027. [DOI] [PubMed] [Google Scholar]
- Morrison M. Horie S. Determination of heme a concentration in cytochrome preparations by hemochromogen method. Anal. Biochem. 1965;12(1):77–82. doi: 10.1016/0003-2697(65)90144-2. [DOI] [PubMed] [Google Scholar]
- Pace C. N. Vajdos F. Fee L. Grimsley G. Gray T. How to measure and predict the molar absorption coefficient of a protein. Protein Sci. 1995;4(11):2411–2423. doi: 10.1002/pro.5560041120. [DOI] [PMC free article] [PubMed] [Google Scholar]
- Keppner A. Maric D. Correia M. Koay T. W. Orlando I. M. C. Vinogradov S. N. Hoogewijs D. Lessons from the post-genomic era: Globin diversity beyond oxygen binding and transport. Redox Biol. 2020;37:101687. doi: 10.1016/j.redox.2020.101687. [DOI] [PMC free article] [PubMed] [Google Scholar]
- Kakar S. Hoffman F. G. Storz J. F. Fabian M. Hargrove M. S. Structure and reactivity of hexacoordinate hemoglobins. Biophys. Chem. 2010;152(1):1–14. doi: 10.1016/j.bpc.2010.08.008. [DOI] [PMC free article] [PubMed] [Google Scholar]
- Nanda J. S. Lorsch J. R. Labeling a protein with fluorophores using NHS ester derivitization. Methods Enzymol. 2014;536:87–94. doi: 10.1016/B978-0-12-420070-8.00008-8. [DOI] [PubMed] [Google Scholar]
- Soon J. W. Oohora K. Hayashi T. A disulphide bond-mediated hetero-dimer of a hemoprotein and a fluorescent protein exhibiting efficient energy transfer. RSC Adv. 2022;12(44):28519–28524. doi: 10.1039/d2ra05249k. [DOI] [PMC free article] [PubMed] [Google Scholar]
- Kuboniwa H. Tjandra N. Grzesiek S. Ren H. Klee C. B. Bax A. Solution structure of calcium-free calmodulin. Nat. Struct. Biol. 1995;2(9):768–776. doi: 10.1038/nsb0995-768. [DOI] [PubMed] [Google Scholar]
Associated Data
This section collects any data citations, data availability statements, or supplementary materials included in this article.
Supplementary Materials
Data Availability Statement
The datasets supporting this article have been uploaded as part of the ESI.†


