Abstract
The recent development of automated patch clamp technology has increased the throughput of electrophysiology but at the expense of visual access to the cells being studied. To improve visualization and the control of cell position, we have developed a simple alternative patch clamp technique based on microfluidic junctions between a main chamber and lateral recording capillaries, all fabricated by micromolding of polydimethylsiloxane (PDMS). PDMS substrates eliminate the need for vibration isolation and allow direct cell visualization and manipulation using standard microscopy. Microfluidic integration allows recording capillaries to be arrayed 20 μm apart, for a total chamber volume of <0.5 nl. The geometry of the recording capillaries permits high-quality, stable, whole-cell seals despite the hydrophobicity of the PDMS surface. Using this device, we are able to demonstrate reliable whole-cell recording of mammalian cells on an inexpensive microfluidic platform. Recordings of activation of the voltage-sensitive potassium channel Kv2.1 in mammalian cells compare well with traditional pipette recordings. The results make possible the integration of whole-cell electrophysiology with easily manufactured microfluidic lab-on-a-chip devices.
Keywords: microfluidics, patch clamp, drug screening, single-cell assay
Pipette-based recording of membrane currents is the mainstay in the characterization of cellular ion channels (1). Traditional patch clamp recording is accomplished in a vibration-free environment by using a micromanipulator to position the tip of a glass pipette against the membrane of a cell. Carefully applied negative pressure through the pipette tip causes the membrane to invaginate into the pipette and causes a gigaohm seal to form between the pipette and cell. For whole-cell recording, a second application of negative pressure or electrical current ruptures the captured membrane, providing continuity between the pipette electrode and the cell's cytoplasm. In voltage clamp mode, the membrane is clamped to a preset potential, and the current required to maintain this potential is recorded. Current recordings with different electrical protocols and in the presence of different reagents are used to characterize ion channel properties.
Despite the success of the traditional patch clamp technique, it requires complex and expensive setups and remains highly laborious. Thus, the patch clamp technique is limiting in proteomics and drug development screens, which demand high-throughput automated measurements (2). To address this need, chip-based patch clamp devices using micromachined substrates from glass (3), quartz (4), coated silicon nitride (5), and treated elastomers (6) have been proposed. These devices are being developed into commercial platforms for pharmaceutical drug screening and drug safety testing (7-9). All chip-based devices developed to date use a planar geometry, where the recording pore is etched in a horizontal membrane dividing the top cell compartment from the bottom recording electrode compartment (10, 11). Variations of this configuration include nozzle designs consisting of a raised region around the circumference of the patch orifice (5, 12). The planar patch approach has improved measurement throughput, but it relies on elaborate robotic machinery for electrolyte and reagent delivery. The result is limitations on the density of cell trapping sites and limited ability to visualize and manipulate the cells being studied. There is also relatively slow delivery of reagents to the cells.
Replacing silicon micromachining with polydimethylsiloxane (PDMS) micromolding has two important technological advantages. First, the fabrication is sufficiently simple (requiring only molding and bonding) and economical to enable the production of single-use, disposable devices. Second, unlike silicon-based devices, the PDMS device is transparent and can be bonded to a 12-mm glass coverslip, permitting placement on the stage of an inverted microscope and visualization of cells during recording. Klemic et al. (6, 13) performed whole-cell recording of Xenopus oocytes (6) and mammalian cells (13) by employing 2- to 20-μm-wide pores in a micromolded planar PDMS substrate after plasma treatment. These experiments are important, but the planar geometry has several limitations. For oocyte electrophysiology, the planar pores are arrayed with a distance of ≈1 mm between patch sites, requiring additional fabrication, alignment, and bonding steps to obtain a working device with integrated microfluidics (6). For mammalian electrophysiology, an optically opaque cell suspension is needed (13), negating the benefits of PDMS translucency. And for all cell types, plasma treatment is used to obtain a hydrophilic PDMS surface for improved sealing, but the effects are temporary, requiring all planar devices to be used within hours of fabrication (6, 13).
We recently proposed a microfluidics-based lateral geometry for electrical measurements of cells (14). With this device, the average seal resistance was ≈150 MΩ (megaohms), which is too low for obtaining a whole-cell configuration and patch clamp recording. We have subsequently developed the technique of partial cure bonding of the elastomer, which results in improvement in cell-attached seal resistance to the gigaohm range.
In this study, we have developed a 12-channel patch clamp array that is <0.5 nl in total volume and incorporates partial cure bonding, yielding robust seals on individually selected mammalian cells under optical observation. The device is used to record activation of the voltage-gated potassium channel Kv2.1, which was stably expressed in mammalian CHO cells. Seals are established without the need of vibration isolation equipment. Kv2.1 channel activation data correspond well with data measured by the traditional pipette-based technique, using the same reagents and protocols.
Materials and Methods
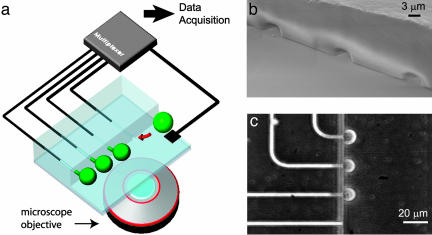
Patch Array Fabrication. Elastomer devices (Fig. 1) are fabricated as follows. A mold is prepared by using surface micromachining techniques. First, the narrow patch capillaries are made with 3.1-μm-high patterns using deep reactive ion etching. Recording capillaries are 20 μm apart, which allows trapping of 12 cells along the main channel in a volume of 0.36 nl (150 × 60 × 40 μm3). Therefore, in the active device area, the reagent dead volume is 30 pl per recording site. Second, 50-μm-high patterns are added for wide connection regions using SU-8 negative photoresist. After the PDMS (Dow-Corning Sylgard 184) base and curing agent are mixed (1:10), the liquid mixture is poured onto the mold and cured at room temperature for 24 h. For fluidic connections to outside tubing, 0.5-mm holes are punched mechanically into the cured and detached PDMS device. A thin PDMS layer is spin-cast on a glass substrate at 3,000 rpm for 30 s and partially cured (90°C for 1 min). The device is bonded to the substrate by gently placing the two in contact and fully curing the bottom layer (120°C for 5 min). A scanning electron micrograph image of the device after bonding is shown in Fig. 1b. For use, plastic tubes are connected to the reservoirs by means of punched holes to load both cells and electrolyte solutions and to apply suction to the patch channel.
Fig. 1.
Patch clamp array on a microfluidic platform. (a) Cell trapping is achieved by applying negative pressure to recording capillaries, which open into a main chamber containing cells in suspension. Attached cells deform, protruding into the capillaries. Patch clamp recordings are obtained by placing AgCl electrodes in each of the capillaries, as well as in the main chamber. Signals are fed through a multiplexing circuit and into the data acquisition system. (Multiplexer setup and microscope objective are not to scale.) The device is bonded to a glass coverslip for optical monitoring. (b) Scanning electron micrograph of three recording capillary orifices as seen from the main chamber. The capillary dimensions are 4 × 3 μm, with a site-to-site distance of 20 μm. (c) Darkfield optical microscope image of cells trapped at three capillary orifices. Trapping was achieved by applying negative pressure to the recording capillaries. The device consists of 12 capillaries arrayed 6 along each side of the main chamber fluidic channel, along a 120-μm distance.
Cells. A CHO cell line expressing Kv2.1 channels in a tetracycline-dependent manner (15) was provided by Stephen J. Korn (University of Connecticut, Storrs) and used for electrophysiology. Cells were maintained at 37°C in DMEM with 10% FBS/100 mg/ml streptomycin/100 μg/ml penicillin (Invitrogen/GIBCO). For fluorescence measurements (Fig. 2), cells in suspension were first incubated with 5 μg/ml calcein AM (Molecular Probes) at 37°C for 10 min. Tetracycline (Sigma) was added to the culture media to a final concentration of 4 μg/ml 24 h before recording to induce Kv2.1 expression. Whole-cell patch clamp of cells without the addition of tetracycline did not detect any outward rectifying potassium current.
Fig. 2.
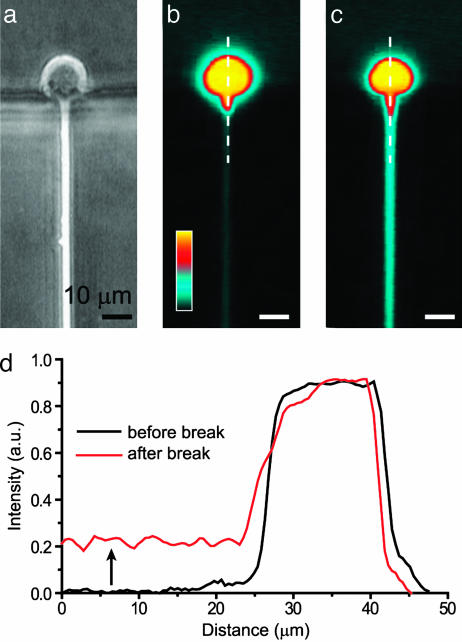
Fluorescence measurements. (a) Phase contrast image of a cell trapped at the orifice of a recording capillary. (b) Fluorescence image of the same cell labeled with the cytoplasmic dye calcein showing cell deformation inside the capillary. Dye intensity is represented by a pseudocolor scale. (c) After the application of a negative pressure pulse, the cell deforms further, and a break of the membrane patch leads to a whole-cell configuration and dye leak into the capillary. (d) Graphs of fluorescence intensity as a function of distance (along dotted lines in b and c) show increased deformation and dye diffusion inside the recording capillary (arrow).
Patch Array Electrophysiology. Electrical connection to the recording capillaries is achieved by inserting Ag/AgCl electrodes into tubing connections outside the active area of the device. The electrodes are, in turn, connected to the inputs of a customized multiplexer circuit, which feeds into the headstage (PC-ONE-60, Dagan Instruments, Minneapolis) of a traditional patch clamp amplifier (PC-ONE, Dagan Instruments). The amplifier was driven by custom software written in the labview programming environment and interfaced by means of an analog-to-digital conversion board (DAQ 6024E, National Instruments, Austin, TX). An Axon Instruments (Union City, CA) 200A amplifier and pclamp 8.2 software were also used for comparison, with no difference in results.
Before each set of experiments, the device is mounted on the stage of a Nikon TS100 inverted microscope. The microfluidic chambers are filled with electrolyte solution, and the electrical connection between the reference and patch electrodes is confirmed by applying a 5-mV square pulse and recording the current response. A typical recording capillary access resistance is in the range of 10-14 MΩ. This resistance is higher than the desired 2- to 5-MΩ access resistance of traditional tapered micropipettes. However, because the device channel is not tapered like a heat-pulled micropipette, the channel length contributes to the measured access resistance without affecting functionality. For instance, halving the length of the channel would halve the measured access resistance without affecting the final seal resistance. Once the device is filled, adherent cells are trypsinized, spun down at 1,000 rpm for 5 min, and resuspended in sterile electrolyte solution at a concentration 5 × 10⁶ cells per ml. A 3-ml syringe is used to inject cells into the main channel. Gentle positive pressure (7 kPa) is applied to the patch channel while cells were loaded into the main fluidic channel to prevent contamination at the patch site. A cell can be trapped either randomly or selectively by controlling the flow through the main fluidic channel. A cell found within 100-200 μm of the patch channel opening can be trapped within a 3-s time interval by applying 14-21 kPa of negative pressure to the patch channel. Immediately after trapping the cell, the negative pressure is removed, and the cell is allowed to form an electrical seal with the patch channel orifice.
All patch array measurements were performed without the use of vibration isolation equipment.
Traditional Patch Electrophysiology. CHO-Kv2.1 cells were plated on 12-mm glass coverslips (Fisher Scientific) at low density 48 h before recording and exposed to 4 μg/ml tetracycline 24 h before recording to induce Kv2.1 expression. Recording patch electrodes were fashioned from 1.5-mm thin-wall glass pipettes (World Precision Instruments, Sarasota, FL) pulled to a final tip impedance of 2-5 MΩ with a P-87 micropipette puller (Sutter Instruments, Novato, CA). Currents were collected with the Axopatch 200A amplifier, Digidata 1200 A/D board, and pclamp 8.2 software. All recordings were performed at ambient temperature.
Signals and Solutions. For both the patch array and traditional electrophysiology, currents were sampled at 5 kHz and filtered with a 2-kHz low-pass Bessel filter. The holding potential was -80 mV, and depolarizing stimuli were applied at an interval of 10 s unless otherwise specified. All signals were postprocessed with automated leak subtraction by custom-written routines that subtracted a calculated leak current from all data traces. The leak resistance was assumed to be constant and was obtained from the current response to a voltage step from -80 mV to -100 mV. Obtaining data for the leak-subtraction technique is faster than the P/4 protocol (16) and does not require a priori knowledge of the test waveform. Both speed and independence of test waveforms are advantageous to high-throughput screening. For Kv2.1 recording in this study, our protocol produced leak-subtracted data that were equivalent to the P/4 protocol and are used in all data presented.
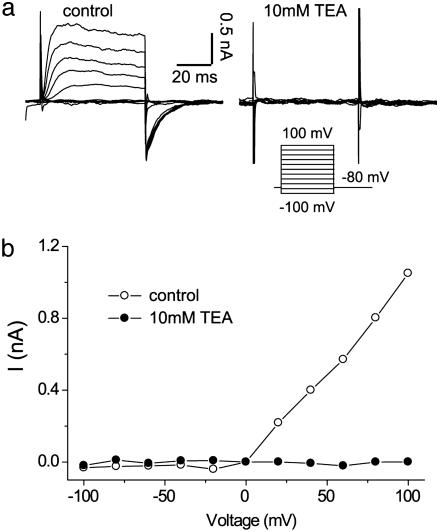
Both the internal and external electrolyte solution contained (in mM): 140 KCl, 2 CaCl2, 2 MgCl2, 20 Hepes, and 10 glucose. pH was adjusted to 7.3 with KOH, and osmolality was adjusted to 300 milliosmolar with glucose. For data in Fig. 5, tetraethylammonium (TEA) (10 mM, Sigma) solution was flowed through the main chamber after a cell was attached to the PDMS recording capillary, allowing for the separation of the internal and external solutions.
Fig. 5.
Pharmacologic blockade. (a) Kv2.1 channel currents before (Left) and after (Right) the introduction of 10 mM TEA into the extracellular solution. Voltage clamp protocol was the same as in Fig. 3. (b) Current-voltage curves before (open circles) and after (filled circles) the introduction of the blocker TEA. All data were leak-subtracted.
Results
Cell Manipulation. Cell trapping can be confirmed by light microscopy. The cells are placed in suspension in the central chamber and are sequentially brought to the patch pores by applying negative pressure (28 kPa) to the patch capillaries. The total time required for trapping is <3 s per cell. We have been able to use objectives with a working distance of <1 mm to capture images of trapped cells. Trapped cells (shown schematically in Fig. 1a) can be visualized by using dark field microscopy as seen in Fig. 1c. Cells labeled with the cytoplasmic dye calcein (see Materials and Methods) were used to quantify both membrane deformation and membrane integrity inside the recording capillary (Fig. 2). Fluorescent images of trapped cells indicated that the cell membrane routinely protrudes large distances (×>10 μm) into the channel, for a relatively low trapping pressure of 28 kPa. Therefore, seal formation is not restricted to the recording capillary orifice and can occur several micrometers along the length of the capillary. A pressure spike leads to a membrane break, corresponding to a rise in cellular capacitance. Cytoplasmic access can also be confirmed by observing the diffusion of dye from the cell interior into the recording capillary (Fig. 2d). The ability to make these types of measurements is a unique advantage of the lateral trapping design, because both the recording capillary and the cell are in the same optical plane. Mechanical and electrical breakdown of the membrane and dye diffusion out of the cell can be quantified, and we have used such data to characterize single-cell electroporation on a similar platform (17).
Whole-Cell Recording. Experiments were performed by first filling the patch clamp array with electrolyte solution. Open capillary resistances, the equivalent of access resistance for traditional pipette recording, was 10-14 MΩ. Negative pressure attracts the cells and traps them at the capillary orifices, after which pressure is normalized to allow for seal formation. Application of a second quick negative pressure pulse then leads to membrane break and electrode access to the cytoplasm (Fig. 2). Whole-cell configuration was confirmed by measuring capacitance, which was 7-10 pF for the CHO cells in suspension. Occasionally, the cell membrane broke during cell trapping at the patch channel opening, leading directly to a whole-cell configuration.
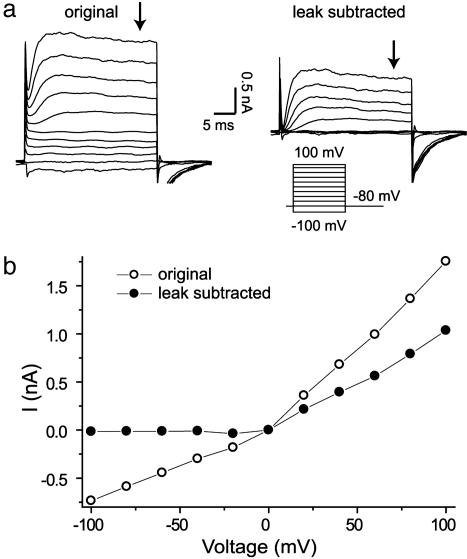
Activation currents were recorded in whole-cell voltage clamp mode from CHO cells stably expressing the potassium channel Kv2.1. Automated leak subtraction was performed on all recordings. The benefit of effective leak subtraction on recorded activation currents is seen in Fig. 3, which is taken from data with a whole-cell seal resistance of 130 MΩ to emphasize the effect of leak subtraction. Steady-state activation currents were recorded 200 ms after the start of the voltage pulse (arrows in Fig. 3a).
Fig. 3.
Whole-cell Kv2.1 currents recorded by using the patch clamp array. (a) (Left) Raw data. (Right) Leak-subtracted data. The cell membrane potential was depolarized from -100 mV to +100 mV in 20-mV increments for 25 ms. The holding potential was -80 mV. The automated leak subtraction protocol is described in the text. (b) Steady-state activation current-voltage relationship for raw (open circles) and leak-subtracted (filled circles) data. Data were obtained from the end of the depolarizing pulse (arrows in a).
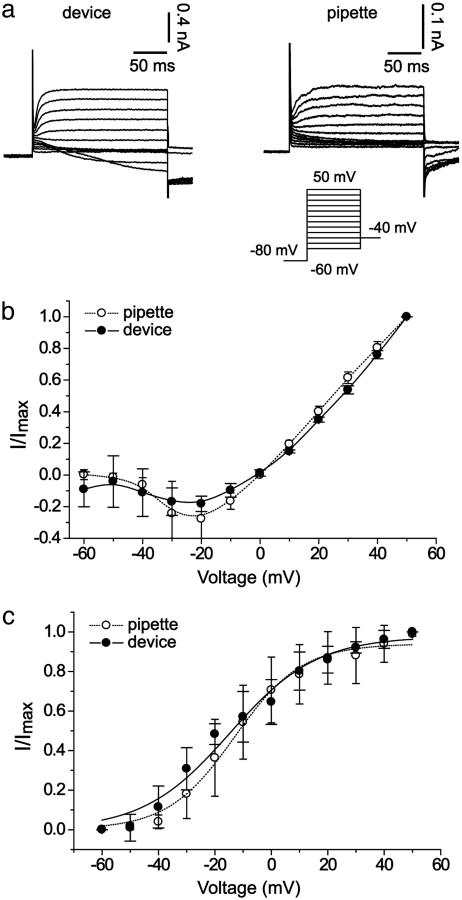
Validation of device performance requires a direct comparison between recordings of Kv2.1 using the device and pipette-based recordings. In Fig. 4, activation current-voltage curves and tail currents were recorded by using both recording techniques. Recordings were performed by using similar protocols and solutions, with the exception that the patch array uses recently trypsinized cells in suspension, whereas the traditional patch clamp uses adherent cells cultured on a coverslip. The current-voltage curves were obtained from data 200 ms into the depolarizing pulse (arrows in Fig. 3a), and tail currents were obtained 0.6 ms after repolarization to -40 mV. With seal resistances of <1GΩ (gigaohm), recordings are biased by a linear leak current. For the patch array in cell-attached mode, the seal resistance was 150 MΩ to 1.2 GΩ, with 27% of the seals >250 MΩ and 5% >1 GΩ. In whole-cell mode, the cells had a seal resistance of 100-250 MΩ at -80 mV.
Fig. 4.
Ion channel recordings with the patch clamp array and glass pipettes. (a) Representative recordings from the patch clamp array (Left) and a patch pipette (Right). Channel (Kv2.1) activation was recorded in the whole-cell configuration. The cell membrane potential was depolarized from -60 mV to +50 mV in 10-mV increments for 260 ms, followed by a repolarization to -40 mV for tail current recording. The holding potential was -80 mV. All data were leak-subtracted. (b) Steady-state activation current recorded with the patch clamp array (filled circles; n = 4) and a patch pipette (open circles; n = 4). (c) Comparison of normalized tail currents at Vm = -40 mV. Recordings from the patch array were made without use of a vibration isolation table.
Channel activity recorded with the patch array shows channel closure at voltages <-20 mV, as well as activation and linear increase at positive voltage (Fig. 4b). A minor decrease in inward current exists at voltages <0 mV in the patch array recordings. Although this difference may indicate an additional nonlinear leak component at negative voltages, crossover voltage and voltage corresponding to peak inward current are similar with the two recording techniques, indicating matching channel behavior. Analysis of the tail currents also reveals good agreement between recordings from the patch array and traditional patch clamp techniques (Fig. 4c). A Boltzmann fit to the tail current data yields a 50% activation voltage V50% = -12.9 ± 1.2 mV and slope factor k = 11.9 ± 1.0 mV for the pipette data. These data correspond well to V50% = -13.4 ± 2.3 mV and k = 14.8 ± 1.9 mV for the patch array and to the V50% = -12.2 mV of the Kv2.1 cDNA construct expressed in HEK293 cells (18).
An important test of channel activity is the ability to block its response with known antagonists. Kv2.1 is known to be blocked by TEA (19), and this reagent was introduced into the main chamber between two sets of activation recordings. Perfusing the main chamber with TEA is equivalent to changing the perfusate in a patch clamp tissue bath. Current response from the same cell both before and after introduction of the block is shown in Fig. 5a, indicating the successful suppression of K+ currents. The steady-state activation current-voltage curves are plotted in Fig. 5b both before (open circles) and after (filled circles) exposure to TEA.
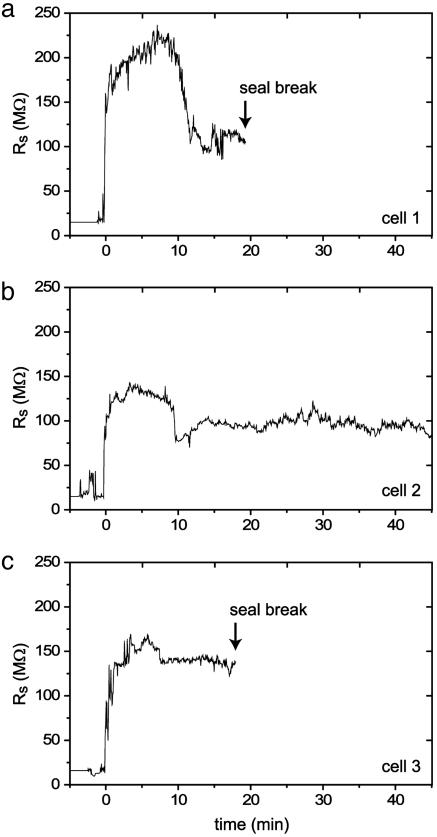
Seal Stability. Pipette-based patch clamp recording systems are susceptible to loss of seal integrity due to mechanical vibration of the pipette tip. Careful anchoring of the pipette manipulators and elaborate vibration isolation tables are among the precautions necessary for successful patch clamp recording. Even with these preparations, whole-cell seals do not last >1 h under ideal circumstances and more commonly last 10-15 min. In the patch clamp array, the recording capillary and cell substrate are mechanically bonded, eliminating the need for external positioning devices and minimizing the effects of ambient vibration. We tested the duration of the seal by using the array to obtain whole-cell voltage clamping of three successive cells (Fig. 6). As with all device data presented, we did not use vibration isolation equipment. Whole-cell configuration was confirmed by measuring cell capacitance. Whole-cell seals for the three CHO cells tested for longevity lasted 18-45 min. These three cells were representative. Seals typically lasted 20-40 min, after which seal/membrane resistance drops to <50 MΩ. The mechanism responsible for eventual seal breakdown is not yet understood.
Fig. 6.
Stability of patch seals. (a-c) Measurements of seal resistance over time for three consecutively patched cells. Cells were in the whole-cell configuration throughout the duration of the measurement, confirmed with periodic cell capacitance measurement. Arrows indicate time points at which the cells lost their seal (seal resistance drops to <50 MΩ). The average useful recording time was 27 ± 15 min.
Discussion
We have developed a disposable patch clamp microarray with integrated microfluidics as an electrophysiological measurement tool. Its fabrication is based on elastomer micromolding. The key features of this design are high patch site density, built-in integration with microfluidics, and the ability to study cells by standard microscopy techniques during electrical recording. The device was successfully used for whole-cell recording of the voltage-gated channel Kv2.1 expressed by CHO cells. These recordings compare well with traditional patch clamp recordings of the same cell line.
PDMS substrates were first used successfully to perform whole-cell recording of Xenopus oocytes by micromolding of an orifice in a planar substrate (6). Modification of the planar design by air molding facilitates mammalian cell recording (13), but with several distinct disadvantages. First, the planar design requires widely spaced arrays, limiting applicability to high-throughput screening. Second, the presence of fluid reservoirs both above and below the patch orifice, along with the use of an opaque cell suspension, makes it difficult to visualize and select cells of interest (e.g., fluorescently labeled cells within a larger cell population). A third limitation of the planar technique is the requirement for oxygen plasma treatment before use to obtain adequate seals. Plasma treatment is unstable and requires device use within hours of manufacture.
Other nonelastomer devices have been used to perform whole-cell recording of mammalian cells by employing a similar planar design with vertical, lithographically defined pores in silicon and other substrates (4, 11, 20, 21). Although integration of planar patch designs with microfluidics is a stated goal for a variety of groups, it remains a technologically challenging task. Fluidic interconnections for both the intracellular and extracellular reservoirs require fluidic network fabrication for both the top and bottom of the planar patch substrate. The fluidics must then both be bonded to the substrate with relatively good alignment, which limits the patch site density. Additionally, the presence of components both below and above the patch pore significantly impedes visual access of the trapped cells.
Our micromolded patch array is capable of mammalian cell recording in a high-density format. The device contains an array of lateral capillaries that traps cells efficiently and forms a tight electrical seal. This scheme has the advantage of integrated microfluidics for compound exchange on both the intracellular and extracellular sides of the cell membrane. The distance between patch sites is 20 μm (Fig. 1), a two-orders-of-magnitude reduction in the recording capillary spacing compared with existing devices (7, 8, 11). Another convenient feature of this design is the low volume associated with the recording chamber. In our current design, the volume of the main chamber containing 12 patch sites is 0.36 nl. By comparison, planar patch technology requires reagent volumes of 10-100 μl per patch site (2, 8, 21, 22). Therefore, the reduction in dead volume over current technology is of order 104. This reduced chamber volume presents us with the opportunity to perform rapid solution exchange and expose attached cells to different reagents in fast succession with very small reagent consumption and highly uniform solution content between the arrayed patch sites.
A key parameter of any patch clamp device is its ability to generate gigaohm seals. Of cells tested here, 27% had a cell-attached resistance of >250 MΩ (average 301 MΩ), and gigaohm seals were obtained for 5% of cells. Whereas hydrophilic glass-like surfaces were previously believed to be a requirement for gigaseal formation (6, 13, 23), these data demonstrate the possibility of gigaseal formation on hydrophobic elastomer surfaces. Even for more modest sealing resistances (>100 MΩ), we were able to obtain whole-cell configuration and accurately record whole-cell currents down to 20 pA. These recordings matched pipette-based recording of the same cell line (Fig. 4).
It would be optimal to obtain a higher percentage of gigaohm seals and thus not subject the data to any postprocessing, such as leak subtraction. Given that the cell trapping time is fast and multiple cells can be trapped simultaneously, the possible throughput is still acceptable, even if selecting for gigaohm seals. However, it would be much improved by increasing the yield of gigaohm seal formation. Partial cure bonding protocols provided a significant advance. It is logical, then, that further optimization of the device geometry and fabrication protocol will lead to increases in seal resistance. We expect that by raising the recording channel of the floor of the main chamber, there will be considerably improved seal resistances. There is increased production complexity with this approach, and it is an active area of investigation.
The ability of the patch array to record channel response to pharmacologic blockade was demonstrated by blocking the ion channel current with a known antagonist, TEA. In this context, we have explored the possibility of using fast microfluidic delivery for fast reagent application to the trapped cells, and preliminary experiments show that microfluidic injection enables reagent application with time scales on the order of 20 ms (data not shown). Fast gating kinetics in response to high-speed reagent delivery is an area that is open for exploration. Further integration of microfluidics with elastomeric valves (24), prolonged incubation (25), and high-throughput electrophysiology is now possible using very simple and inexpensive fabrication.
The demonstrated ability for performing fluorescent measurements on multiple patched cells in close proximity (Fig. 2) will be instrumental in correlating fluorescent data from binding assays (7), protein expression profiles, and intracellular calcium concentration with patch clamp recordings. Although similar studies using traditional pipette patch setups have been performed, other high-throughput designs are not suitable for this type of combined measurement because the planar substrate is either opaque or requires the use of long working-distance objectives.
In conclusion, we present whole-cell patch clamp recording of mammalian cells using a micromolded patch clamp array. The key features of this design are inherent microfluidic integration, very high density of patch sites, and the ability to measure both cell deformation and membrane integrity during electrical recording. Accurate recording of ionic currents was validated through a head-to-head comparison with traditional electrophysiology. Pharmaceutical modification of ion channel availability was also demonstrated by measuring changes in ion channel currents after the introduction of the K+ channel blocker TEA into the extracellular solution. The ability of soft lithography to produce a microfluidic platform for high-throughput electrophysiology makes possible the seamless integration of additional functionalities such as cell culture, cell sorting, and the analysis of protein content in a single disposable device.
Acknowledgments
We thank Björn Schroeder for helpful discussion and Nima Aghdam for 3D graphic design. This work was supported by National Institutes of Health Grant MH65334 and American Heart Association Grant 0475022N. Y.-N.J. and L.Y.J. are Howard Hughes Medical Institute Investigators.
Author contributions: C.I.-Z., R.M.S., J.S., Y.-N.J., L.Y.J., and L.P.L. designed research; C.I.-Z., R.M.S., and J.S. performed research; C.I.-Z., R.M.S., Y.-N.J., L.Y.J., and L.P.L. analyzed data; and C.I.-Z. and R.M.S. wrote the paper.
Abbreviations: PDMS, polydimethylsiloxane; TEA, tetraethylammonium; MΩ, megaohms.
References
- 1.Sakmann, B. & Neher, E. (1984) Annu. Rev. Physiol. 46, 455-472. [DOI] [PubMed] [Google Scholar]
- 2.Dove, A. (2003) Nat. Biotechnol. 21, 859-864. [DOI] [PubMed] [Google Scholar]
- 3.Fertig, N., Klau, M., George, M., Blick, R. H. & Behrends, J. C. (2002) Appl. Phys. Lett. 81, 4865-4867. [Google Scholar]
- 4.Fertig, N., Blick, R. H. & Behrends, J. C. (2002) Biophys. J. 82, 3056-3062. [DOI] [PMC free article] [PubMed] [Google Scholar]
- 5.Lehnert, T., Gijs, M. A. M., Netzer, R. & Bischoff, U. (2002) Appl. Phys. Lett. 81, 5063-5065. [Google Scholar]
- 6.Klemic, K. G., Klemic, J. F., Reed, M. A. & Sigworth, F. J. (2002) Biosens. Bioelectron. 17, 597-604. [DOI] [PubMed] [Google Scholar]
- 7.Entzeroth, M. (2003) Curr. Opin. Pharmacol. 3, 522-529. [DOI] [PubMed] [Google Scholar]
- 8.Bennett, P. B. & Guthrie, H. R. E. (2003) J. Biomol. Screen. 8, 660-667.14711391 [Google Scholar]
- 9.Neubert, H. J. (2004) Anal. Chem. 76, 327a-330a. [DOI] [PubMed] [Google Scholar]
- 10.Wood, C., Williams, C. & Waldron, G. J. (2004) Drug Discov. Today 9, 434-441. [DOI] [PubMed] [Google Scholar]
- 11.Wang, X. B. & Li, M. (2003) Assay Drug Dev. Technol. 1, 709-717. [DOI] [PubMed] [Google Scholar]
- 12.Stett, A., Burkhardt, C., Weber, U., van Stiphout, P. & Knott, T. (2003) Recept. Channels 9, 59-66. [PubMed] [Google Scholar]
- 13.Klemic, K. G., Klemic, J. F. & Sigworth, F. J. (2005) Pflügers Arch. 449, 564-572. [DOI] [PubMed] [Google Scholar]
- 14.Seo, J., Ionescu-Zanetti, C., Diamond, J., Lal, R. & Lee, L. P. (2004) Appl. Phys. Lett. 84, 1973-1975. [Google Scholar]
- 15.Trapani, J. G. & Korn, S. J. (2003) BMC Neurosci. 4, 15. [DOI] [PMC free article] [PubMed] [Google Scholar]
- 16.Bezanilla, F. & Armstrong, C. M. (1977) J. Gen. Physiol. 70, 549-566. [DOI] [PMC free article] [PubMed] [Google Scholar]
- 17.Khine, M., Lau, A., Ionescu-Zanetti, C., Seo, J. & Lee, L. P. (2005) Lab on a Chip 5, 38-43. [DOI] [PubMed] [Google Scholar]
- 18.Trapani, J. G. & Korn, S. J. (2003) Biophys. J. 84, 195-204. [DOI] [PMC free article] [PubMed] [Google Scholar]
- 19.Immke, D. & Korn, S. J. (2000) J. Gen. Physiol. 115, 509-518. [DOI] [PMC free article] [PubMed] [Google Scholar]
- 20.Xu, J., Wang, X. B., Ensgn, B., Li, M., Guia, A. & Xu, J. Q. (2001) Drug Discov. Today 6, 1278-1287. [DOI] [PubMed] [Google Scholar]
- 21.Asmild, M., Oswald, N., Krzywkowski, K. M., Friis, S., Jacobsen, R. B., Reuter, D., Taboryski, R., Kutchinsky, J., Vestergaard, R. K., Schroder, R. L., et al. (2003) Recept. Channels 9, 49-58. [PubMed] [Google Scholar]
- 22.Xu, J., Guia, A., Rothwarf, D., Huang, M. X., Sithiphong, K., Ouang, J., Tao, G. L., Wang, X. B. & Wu, L. (2003) Assay Drug Dev. Technol. 1, 675-684. [DOI] [PubMed] [Google Scholar]
- 23.Sakmann, B. & Neher, E. (1983) Single Channel Recording (Plenum, New York).
- 24.Thorsen, T., Maerkl, S. J. & Quake, S. R. (2002) Science 298, 580-584. [DOI] [PubMed] [Google Scholar]
- 25.Lee, P. J., Hung, P. J., Shaw, R., Jan, L. & Lee, L. P. (2005) Appl. Phys. Lett. 86, 223902. [Google Scholar]


