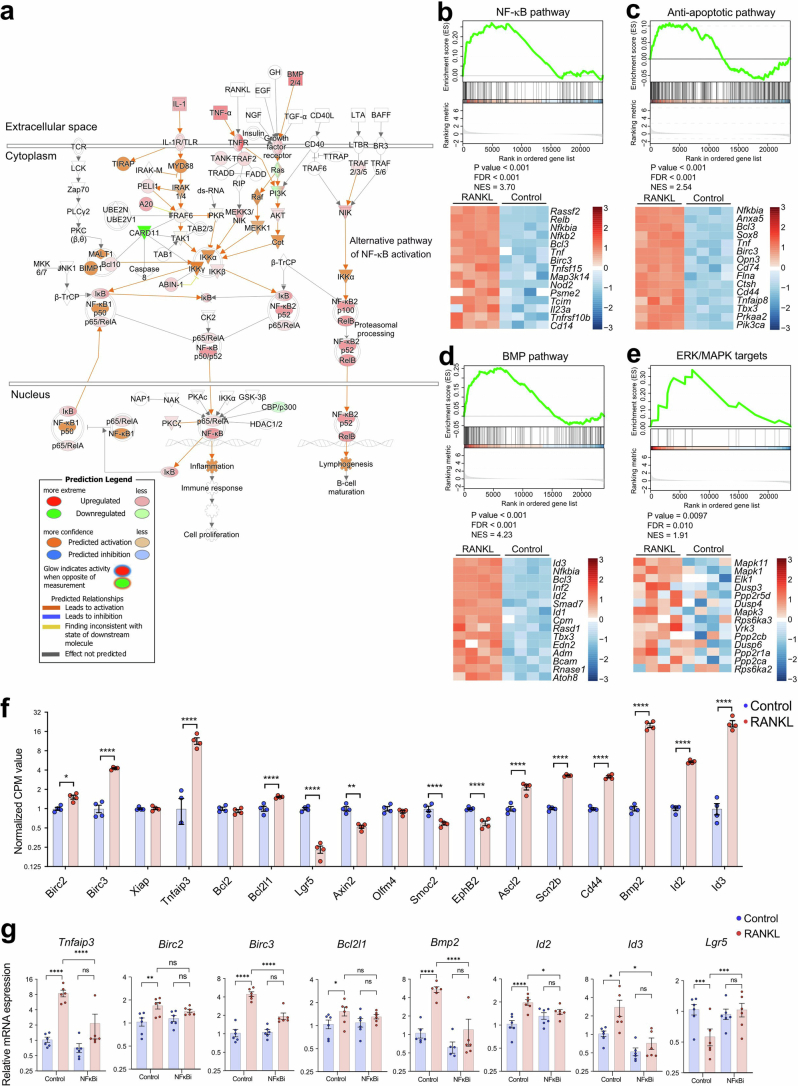
Extended Data Fig. 2. Bulk RNA-seq profiling of RANK–RANKL-stimulated mouse intestinal organoids.
a-e, RANK–RANKL-induced gene expression changes in jejunal organoids without (control, n = 4) and with rmRANKL (n = 4) stimulation. Total RNA was isolated 12 hrs after addition of rmRANKL (50 ng/ml) and processed for bulk RNA-seq. a, RANK–RANKL-triggered expression changes in NF-κB signalling as assessed by Ingenuity Pathway Analysis. The node colours indicate changes in expression levels of the indicated genes, determined by DESeq2 (p < 0,05). Red, up-regulated gene expression in RANKL treated samples; green, down-regulated gene expression; white, no expression changes; orange, Ingenuity predicted activation. Orange arrows indicate activation of the specified downstream signalling pathways; grey arrows indicate previously reported connections, albeit these pathways were not identified in our data set using Ingenuity. The Ingenuity enrichment statistics for this pathway were determined using Fischer’s Exact Test p-value with Benjamin–Hochberg correction, 4.93E-08; Z score, 2,722. b-e, RANK–RANKL-induced changes of the NF-κB, anti-apoptotic, BMP, and ERK/MAPK pathways as assessed by Gene set enrichment analysis (GSEA) enrichment plots (top panels). Bottom panels show heatmaps of the top 15 genes upregulated in response to RANKL stimulation. Expression profiles of RANKL-stimulated jejunal organoids were compared to non-stimulated (control) jejunal organoids cultured for the same time periods. f, Differential gene expression analysis of RNAseq data from mouse jejunal organoids without (control) and with rmRANKL stimulation. RNA was isolated 12 h after addition of rmRANKL (50 ng/ml). Normalized CPM values of selected anti-apoptotic genes, stem cell signature genes and BMP signalling genes are shown. Individual data points are shown (n = 4/4). g, Quantitative RT–PCR analyses to compare expression levels of anti-apoptotic genes, stem cell signature genes and BMP signalling genes in mouse jejunal organoids. Data represent the relative expression of the indicated genes in jejunal organoids cultured in the presence of rmRANKL (50 ng/ml) without (control, DMSO solvent) or with the NFκB inhibitor (NFκBi) sc-514 (100 mM). Gene expression was compared to control (no RANKL treatment) organoids (set at 1). n = 6 independent jejunal organoids were analysed for each group. rmRANKL stimulation was done for 12 h. Data are mean ± s.e.m. *P < 0.05; **P < 0.01; ***P < 0.001; ****P < 0.0001; ns, not significant. Enrichment-adjusted p-values (P value), False Discovery Rates (FDR), and Normalized Enrichment Scores (NES) were calculated using two-sided fast pre-ranked gene set enrichment analysis (fGSEA) (b-e). Two-sided DESeq2 Wald tests, adjusted with the Benjamini–Hochberg procedure (f); Repeated measure One-way analysis of variance (ANOVA) with Tukey’s post hoc test (g).

