Abstract
Background
Low-grade glioma (LGG) is a slow-growing but invasive tumor that affects brain function. Histone deacetylases (HDACs) play a critical role in gene regulation and tumor progression. This study aims to develop a prognostic model based on HDAC-related genes to aid in risk stratification and predict therapeutic responses.
Methods
Expression data from The Cancer Genome Atlas (TCGA) and Chinese Glioma Genome Atlas (CGGA) were analyzed to identify an optimal HDAC-related risk signature from 73 genes using 10 machine learning algorithms. Patients were stratified into high- and low-risk groups based on the median risk score. Prognostic accuracy was evaluated using Kaplan–Meier survival analysis and receiver operating characteristic (ROC) curves. Functional enrichment analyses, including Gene Ontology (GO), Kyoto Encyclopedia of Genes and Genomes (KEGG), and Gene Set Enrichment Analysis (GSEA), were performed to explore pathways linked to the gene signature. Immune infiltration and tumor microenvironment characteristics were assessed using Single Sample Gene Set Enrichment Analysis (ssGSEA) and ESTIMATE algorithm. SubMap was applied to predict responsiveness to immune checkpoint inhibitors, and chemotherapeutic sensitivity was analyzed via the Genomics of Drug Sensitivity in Cancer (GDSC) database.
Results
A prognostic model consisting of four HDAC-related genes—SP140, BAZ1B, SP100, and SIRT1—was identified. This signature displayed strong prognostic accuracy, achieving a C-index of 0.945. Individuals with LGG were systematically divided into high-risk and low-risk cohorts based on the median risk value, enabling more precise risk stratification. The survival prognosis was significantly worse in the high-risk cohort compared to the low-risk group, highlighting distinct survival trajectories. Notably, the two cohorts exhibited marked shifts in immune checkpoint gene transcriptional profiles and immune cell infiltration maps, underscoring fundamental biological differences that contribute to these differing prognoses.
Conclusion
We developed an HDAC-related four-gene prognostic model that correlates with survival, immune landscape, and therapeutic response in LGG patients. This model may guide personalized treatment strategies and improve prognostic accuracy, warranting further validation in clinical settings.
Keywords: Prognosis, Low grade glioma, HDAC, Immunotherapy, Tumor microenvironment
Introduction
LGG is a common primary brain tumor originating from glial cells in the central nervous system. It accounts for over one-third of all primary central nervous system malignancies and exhibits significant genetic and transcriptional heterogeneity [1, 2]. Due to this heterogeneity, approximately 70% of LGG patients progress to more aggressive glioma subtypes within 10 years [3]. Despite advancements in neurosurgical techniques and chemoradiotherapy in recent years, which have improved patient prognosis to some extent, the high surgical risk and postoperative recurrence rates remain major challenges [4, 5]. As research progresses, it has become evident that the prognosis of LGG is closely linked to its genetic and molecular characteristics [6]. Notably, the 2021 WHO classification update for central nervous system tumors redefined gliomas according to their molecular characteristics [7]. Therefore, discovering new prognostic indicators and therapeutic molecular targets for LGG is crucial.
HDACs are enzymes that regulate lysine acetylation and play a crucial function in chromatin structure modification and gene expression regulation [8, 9]. Their function contrasts with that of histone acetyltransferases (HATs). Under normal circumstances, HATs and HDACs work in concert to regulate the dynamic equilibrium of histone acetylation and deacetylation in the nucleus [10–12]. Disruption of this balance, however, can lead to cancer development. For instance, the overexpression of HDACs in certain cancer cells results in a more compact nucleosome structure, thereby inhibiting gene expression and promoting cancer cell proliferation and metastasis. Additionally, studies have suggested that HDACs may be involved in processes such as tumor angiogenesis and immune evasion [13, 14]. As a result, HDAC inhibitors have been widely studied and are being used to treat various cancers, including liver, gastric, and breast cancers [15, 16]. However, the precise role of HDAC-associated regulatory genes in LGG remains elusive and is yet to be fully elucidated. Therefore, investigating the prognostic value of these HDAC-related genes is essential for developing highly selective targeted therapies for LGG.
Leveraging a machine learning-based integration approach, we propose to develop a prognostic model using HDAC-related genes. This model is designed to evaluate prognosis, immune composition, genomic alterations, and treatment responses, with a particular focus on immune checkpoint inhibitors and chemotherapy. These findings could provide new insights into the role of HDAC-related genes in LGG and inform future therapeutic strategies.
Methods
Data acquisition
The RNA-seq data and corresponding clinical records pertaining to LGG patients were retrieved from the comprehensive TCGA database (accessible at https://cancergenome.nih.gov/). To further validate the robustness of our results, we used an external dataset from the CGGA database (available at http://www.cgga.org.cn/) for independent verification of our findings. The mRNA data from TCGA were transformed into TPM (transcripts per million) format, and the data from CGGA were normalized. Patients with a survival time less than 30 days were excluded, leading to a final cohort of 481 LGG cases. This included 481 patients from TCGA and 420 from CGGA for further analysis. Additionally, 73 HDAC-associated genes were identified through the Molecular Signatures Database (MSigDB) for study.
Calculation of HDAC scores and analysis of related gene expression
We calculated and ranked HDAC scores to reflect the expression levels of HDAC-related genes among samples. Furthermore, these gene expression levels were analyzed in relation to clinical characteristics, such as age, gender, IDH1 status, radiation therapy, and survival outcomes. This analysis sought to investigate the associations between gene expression and a range of clinical factors.
Differential expression analysis of HDAC-related genes
We transformed the expression data of 73 HDAC-related genes using log2(TPM + 1) and visualized the differences between normal and tumor tissues with box plots.
Establishment of HDAC-related prognostic model
To identify the most effective HDAC-related prognostic model, we utilized a machine learning integration strategy that incorporates 101 predictive models. This approach combined 10 machine learning algorithms: Ridge, Elastic Net (Enet), Gradient Boosting Machine (GBM), Lasso, Partial Least Squares Regression for Cox (plsRcox), StepCox, CoxBoost, Supervised Principal Components (SuperPC), Random Survival Forest (RSF), and survival-Support Vector Machine (survival-SVM), under a tenfold cross-validation framework. Patients were divided into two risk groups according to the risk model. We assessed differences in overall survival (OS) between two groups utilizing data from TCGA dataset, and these findings were validated with ROC curve analysis from the CGGA dataset. Additionally, we analyzed progression-free survival (PFS) and disease-free survival (DFS) to assess the signature's prognostic power. Moreover, the OS was analyzed based on the expression levels of the hub genes.
Clinical feature analysis and functional enrichment analysis
To gain profound insights into the clinical implications of our risk stratification, we delved into a comprehensive analysis and comparison of various clinical characteristics between two risk cohorts. Our focus encompassed pivotal factors like survival status, age, tumor grade, gender, IDH1 mutational status, and the administration of radiation therapy. Additionally, pathway enrichment analyses were conducted using gene sets from GO, KEGG, and Hallmark databases.
Analysis of tumor mutation burden
To assess TMB levels for each individual patient, we extracted pertinent data from the comprehensive TCGA repository. TMB levels were then analyzed and compared across high- and low-risk groups. Additionally, survival rates were evaluated based on varying TMB levels in combination with the respective risk groups.
Analysis of copy number variations (CNVs) and calculation of stemness index
The somatic mutation data of LGG patients were obtained from the TCGA database, enabling us to conduct an in-depth analysis of the genetic amplification and deletion patterns in two cohorts. The CNV landscape was analysed through the Genomic Identification of Significant Targets in Cancer (GISTIC) algorithm. Subsequently, CNV burden was compared between the two risk groups at both the focal and arm levels. Furthermore, we utilized the One Class Linear Regression (OCLR) algorithm as a tool to quantify the stemness potential of LGG tumors, deriving both the mRNA stemness index (mRNAsi) and the DNA methylation-based stemness index (mDNAsi). These indices were subsequently analyzed in relation to clinical characteristics. Additionally, comparisons of mRNAsi and mDNAsi values were made between two groups.
Immune infiltration analysis
The ESTIMATE algorithm was used to quantify immune cell infiltration (ImmuneScore) and stromal content (StromalScore) in each sample. Subsequently, ESTIMATE scores were calculated to estimate tumor purity. Leveraging the ssGSEA algorithm, we quantified the scores of 21 distinct immune cell subsets and 21 immune functions within the tumor microenvironment, enabling a comparative analysis between two groups. Butterfly plots were utilized to visually represent the relationship between risk scores and immune function pathways.
Predicting immunotherapy and chemotherapy responses for personalized treatment
To gain further insights, we delved into the expression dynamics of 50 immune checkpoint genes, comparing their levels between the high- and low-risk groups. Given the clinical significance of anti-PD-1, anti-PD-L1, anti-PD-L2, and anti-CTLA4 antibodies, we further explored the relationship between risk scores and these specific immune checkpoints. Additionally, the SubMap algorithm was utilized to predict how LGG patients might respond to anti-PD1 and anti-CTLA4 therapies. Beyond immunotherapy, the GDSC database was employed to forecast chemotherapy drug sensitivity in patients. Utilizing the R package “pRRophetic,” we performed predictions of drug sensitivity.
Statistical analysis
All statistical analyses were conducted using R software. Continuous variables were assessed using either the t-test or the Wilcoxon test, depending on the data distribution, while categorical variables were evaluated using the Chi-square test. The significance level was set at P < 0.05.
Results
Expression profile of HDAC-related genes
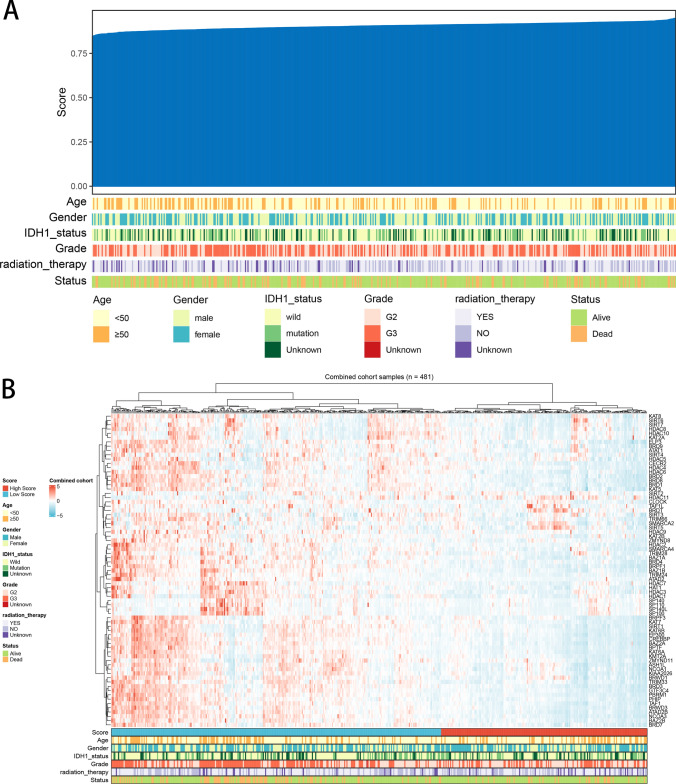
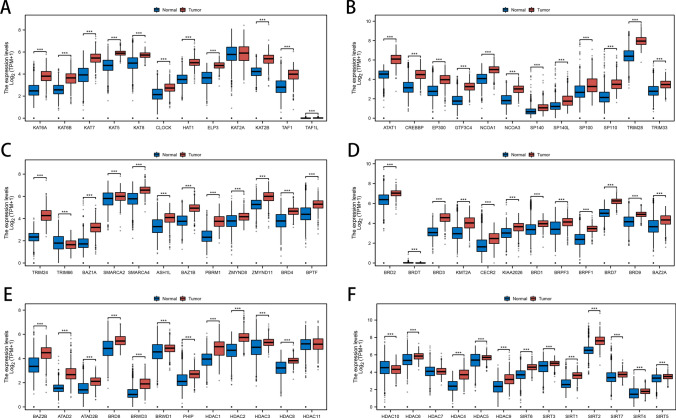
We used the ssGSEA algorithm to quantify the expression levels of HDAC molecules in each patient, and based on the expression levels of these genes, patients were clustered and classified into high and low HDAC score groups. We ranked patients by their HDAC scores and examined the relationship between these scores and clinical features (Fig. 1A). Subsequently, we visualized the expression patterns of HDAC-related genes in a heatmap, incorporating factors such as age, gender, IDH1 status, radiation therapy, and survival status for each patient (Fig. 1B). Furthermore, the expression levels of the 73 HDAC-related genes were analyzed and compared between normal and cancerous tissues (Fig. 2A–F).
Fig. 1.
Patient Profiles and HDAC-Related Gene Expression Profiles. A Heatmap displaying clinicopathological characteristics and HDAC-related gene scores for each patient. B Heatmap showing the expression levels of the 73 HDAC-related genes
Fig. 2.
Comparative Analysis of HDAC-Related Gene Expression in LGG Tumors and Normal Tissues. A-F Boxplots comparing the expression levels of 73 HDAC-related genes between LGG tumors and normal tissues
Development of HDAC-related prognostic model
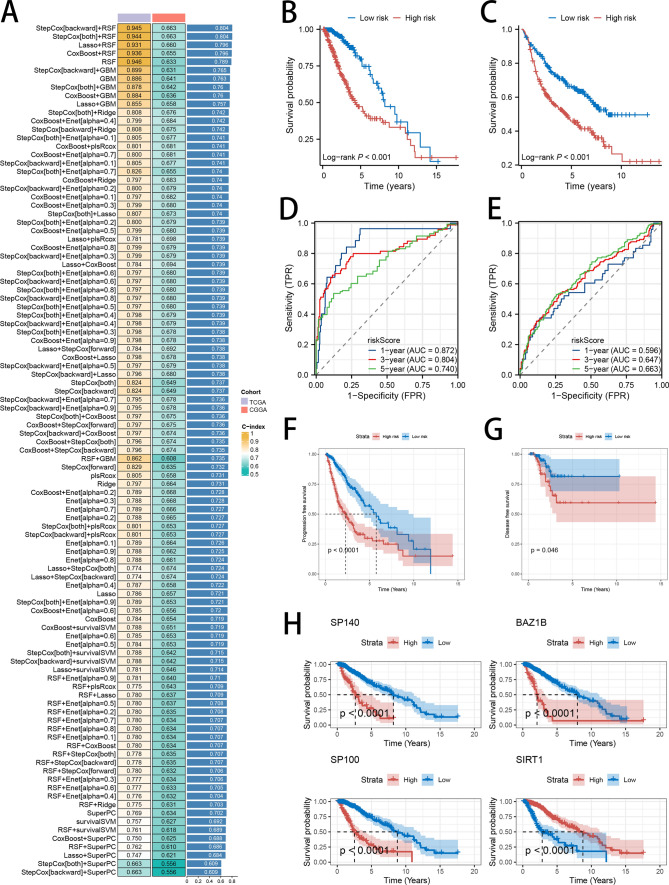
To create a prognostic model, we employed 10 diverse predictive models—RSF, StepCox, Enet, plsRcox, CoxBoost, Lasso, GBM, Ridge, survival-SVM and SuperPC, —using a tenfold validation method. This rigorous strategy aimed to pinpoint the strongest signature that achieved the highest C-index. The identified signature was developed using the TCGA LGG training data and the CGGA LGG external data. The final, top-performing signature was determined by integrating StepCox (backward) and RSF algorithms, leading to the identification of four key genes (SP140, BAZ1B, SP100, and SIRT1), achieving the highest C-index (Fig. 3A). The corresponding risk score was calculated using the following formula: Risk score = EXPSP100*0.12221867 + EXPSIRT1*(−0.03025300) + EXPSP140*(−0.21727173) + EXPBAZ1B*0.01519232. Based on the median score derived from our model, patients were categorized into two distinct groups: high-risk and low-risk. The Kaplan–Meier survival analysis consistently demonstrated that patients in the low-risk category had notably superior survival outcomes compared to those in the high-risk group, across both the TCGA and CGGA datasets (Fig. 3B, C). To enhance the validation of the signature's prognostic accuracy, ROC curve analysis was utilized. The area under the curve (AUC) values for the signature in the TCGA cohort indicated robust predictive accuracy, with readings of 0.872, 0.804, and 0.740 at 1, 3, and 5 years, respectively (Fig. 3D). In comparison, the AUC figures in the CGGA cohort were modestly lower, standing at 0.596, 0.647, and 0.663 at the same time intervals (Fig. 3E). Furthermore, PFS and DFS were significantly better in the low-risk group (Fig. 3F, G). Further confirmation underscores the prognostic significance of the four hub genes, SP140, BAZ1B, and SP100, where elevated expression levels correlate with poorer patient outcomes compared to those with lower expressions, whereas increased SIRT1 expression was associated with more favorable survival (Fig. 3H).
Fig. 3.
Construction of the HDAC-Related Risk Signature in LGG Patients. A Testing of 101 combinations of machine learning algorithms for HDAC-related signatures using a tenfold cross-validation framework. B, C Kaplan–Meier survival analysis of OS in LGG patients, stratified by the two identified risk groups. D, E ROC analysis showing the AUC for predicting OS at 1, 3, and 5 years in both the TCGA and CGGA datasets. F, G Kaplan–Meier analysis of PFS and DFS in LGG, stratified by the two risk groups in the TCGA dataset. H Kaplan–Meier survival analysis of OS in LGG, stratified by the expression levels of the four hub genes
Clinical characteristics and pathway enrichment analysis
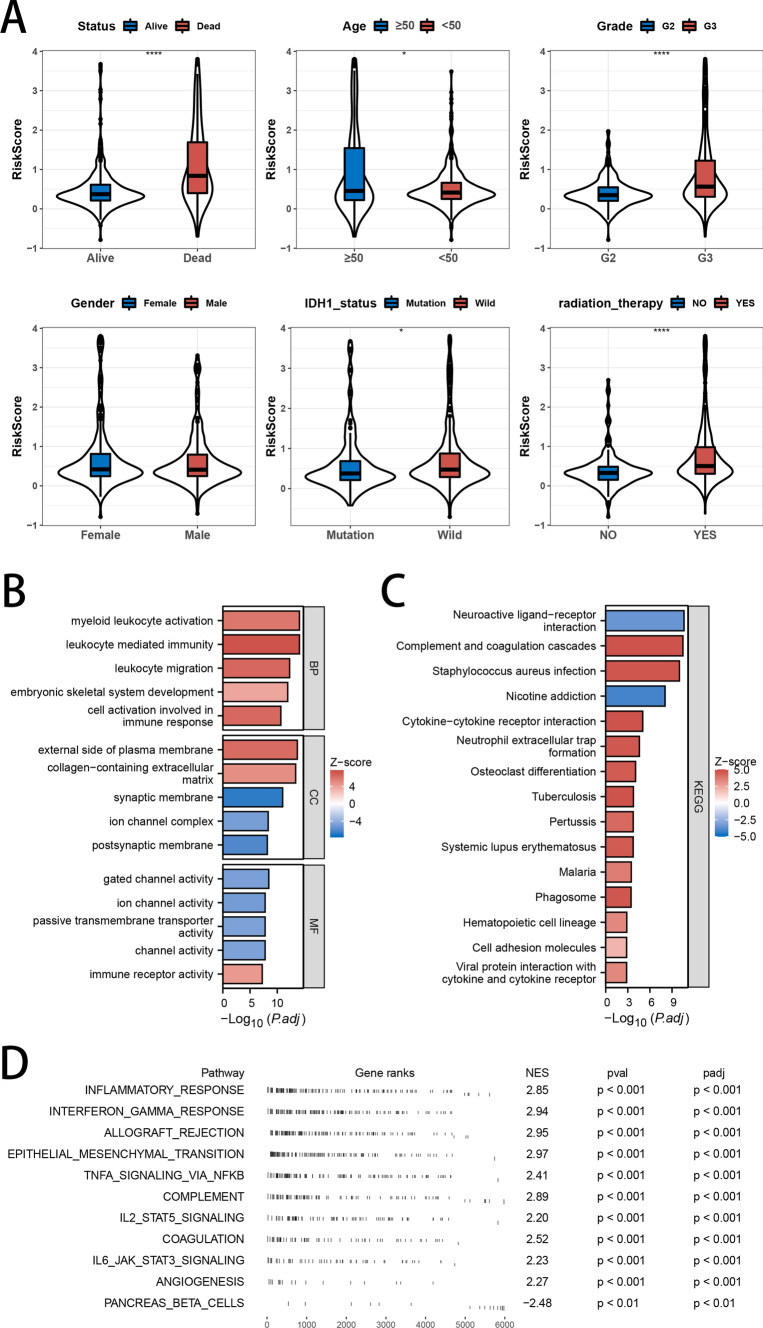
The violin plot illustrated the distribution of risk scores across various clinical characteristics. Patients who were deceased, had grade 3 tumors, possessed wild-type IDH1 genes, or underwent radiotherapy exhibited higher risk scores (Fig. 4A). To identify the functional and molecular mechanisms that differentiate high-risk from low-risk groups, we carried out GO, KEGG, and GSVA pathway enrichment analyses on the differentially expressed genes between the two groups. GO analysis revealed that the differentially expressed genes were predominantly involved in leukocyte-mediated immunity, myeloid leukocyte activation, the external side of the plasma membrane, gated channel activity, collagen-containing extracellular matrix, and channel activity (Fig. 4B). KEGG pathway analysis demonstrated that the differentially expressed genes were notably concentrated in pathways related to inflammatory processes, including neuroactive ligand-receptor interaction, cytokine-cytokine receptor interaction, viral protein interaction with cytokine and cytokine receptor, and complement and coagulation cascades (Fig. 4C). Finally, GSEA was carried out on the full cohort to evaluate the biological implications of the signature. The results showed enrichment in pathways such as inflammatory response, TNF-alpha signaling via NF-kB, interferon-gamma response, allograft rejection, and epithelial-mesenchymal transition (Fig. 4D).
Fig. 4.
Association analysis of Clinical Characteristics, Functional Enrichment Analysis, and Risk Scores. A Analysis of risk score differences across subgroups categorized by clinicopathological characteristics. B–D GO, KEGG, and GSEA enrichment analyses
Variations in tumor mutation burden
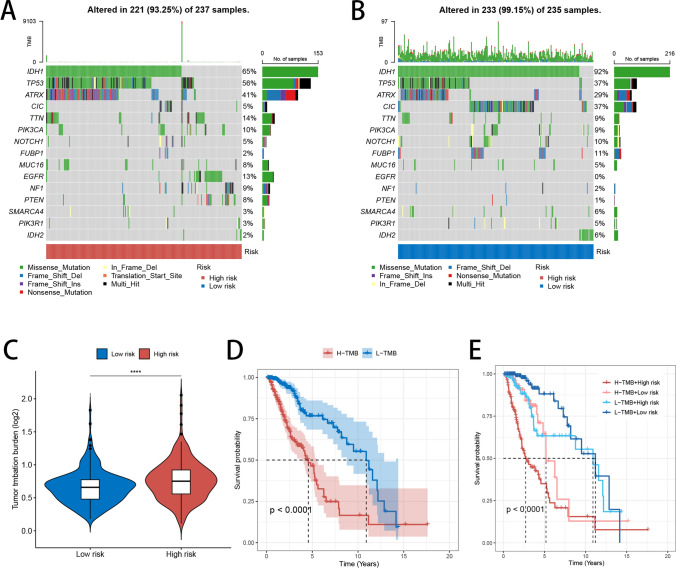
The gene mutation waterfall plot presented TMB across all samples in both high- and low-risk groups, emphasizing the 15 genes with the highest mutation rates in each category (Fig. 5A, B). Notably, most of these top genes exhibited elevated mutation rates in the high-risk group, with TP53 and ATRX as key examples. Patients classified under the high-risk group displayed elevated TMB levels compared to the low-risk group (Fig. 5C). Kaplan–Meier survival analysis showed that patients exhibiting lower TMB levels had significantly more favorable prognoses than those with higher TMB levels (Fig. 5D). Additionally, our study, which integrated TMB and risk signature scores for glioma prognosis, showed that individuals with both low TMB and low-risk scores had the most favorable outcomes, in contrast to those with high TMB and high-risk scores, who faced the poorest outcomes (Fig. 5E).
Fig. 5.
Gene Mutation Analysis. A, B Waterfall plots showing TMB in high- and low-risk groups, highlighting the 15 most frequently mutated genes. C Violin plot illustrating TMB levels in high- and low-risk groups. D Survival analysis of patients with high and low TMB levels. E Survival analysis of patients based on combined TMB levels and risk scores
Analysis of CNVs, mDNAsi, and mRNAsi
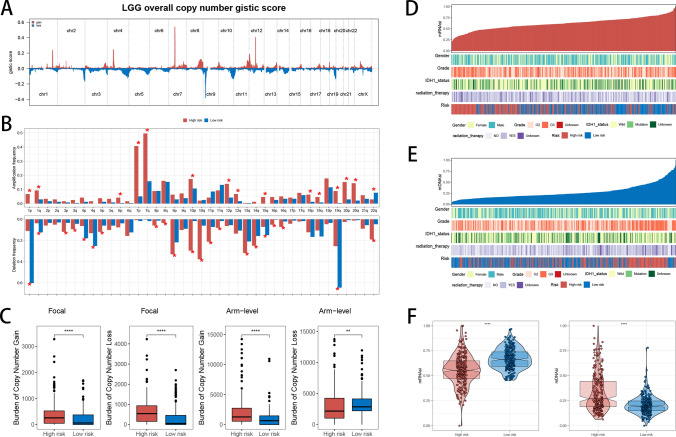
To identify potential cancer-driving genes, we utilized GISTIC scores to assess CNV data from patients, identifying genomic regions with notable amplification or deletion. Initially, we reported GISTIC scores for each chromosome across all LGG patients (Fig. 6A). Subsequently, when contrasting the frequencies of genetic amplification and deletion between the high- and low-risk cohorts, we uncovered a significant trend: patients in the high-risk group exhibited a higher frequency of localized genomic amplification, suggesting potential biological mechanisms (Fig. 6B). At the focal level, high-risk patients exhibited a greater burden of both copy number gains and losses relative to low-risk patients. At the chromosomal arm level, high-risk patients displayed more significant copy number gains and fewer losses compared to their low-risk counterparts (Fig. 6C). mRNAsi and mDNAsi are indices used to evaluate stem cell characteristics in tumor samples, and these indices are derived from mRNA expression and DNA methylation patterns, respectively. Higher stemness indices are typically associated with increased malignancy, invasiveness, and resistance to treatment in tumors. We explored the relationship between mRNAsi and mDNAsi and the clinicopathological features of LGG patients, further revealing the potential value of these two indices in tumor biology (Fig. 6D, E). Our analysis identified notable differences in mRNAsi and mDNAsi between high- and low-risk groups. Specifically, high-risk patients showed lower mRNAsi and higher mDNAsi (Fig. 6F). The observation that high-risk patients possess lower mRNAsi and higher mDNAsi points to distinct regulation of biological pathways at various levels. Further investigation is required to clarify these mechanisms and their impact on tumor progression and refractoriness to treatment.
Fig. 6.
Genomic Alteration Analysis. A Profiles of overall copy number GISTIC scores in LGG patients. B Comparison of amplification and deletion frequency differences between high- and low-risk groups. C Comparison of the burden of copy number gains and losses between high- and low-risk groups at both focal and arm levels. D, E Display of clinicopathological characteristics alongside mRNAsi and mDNAsi for each patient. F Comparison of mRNAsi and mDNAsi levels between high- and low-risk groups
Analysis of the tumor microenvironment
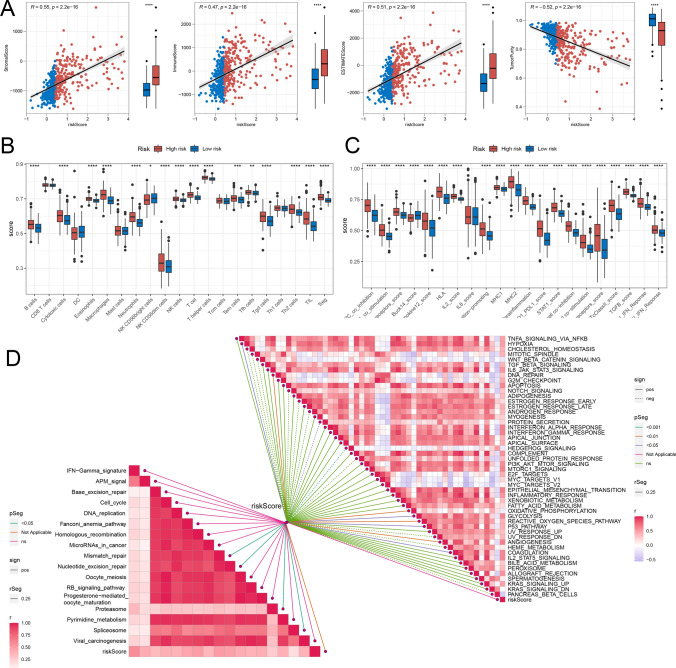
Our study delved into a comprehensive analysis of the tumor microenvironment in LGG patients, with a focus on its constituent elements and their intricate interplay with tumor cells. Our findings revealed that in the high-risk group, StromalScore, ImmuneScore, and ESTIMATEScore were elevated, indicating a more immune-rich and stromal-dense tumor microenvironment, while TumorPurity was decreased, suggesting a lower proportion of malignant tumor cells relative to the overall tissue composition (Fig. 7A). Concerning immune cell infiltration, high-risk patients demonstrated increased presence of immunosuppressive cells, including neutrophils, macrophages, T helper cells, and regulatory T cells (Tregs) (Fig. 7B). Regarding immune function analysis, high-risk patients had higher scores for inhibitory immune responses compared to low-risk patients, especially in APC co-inhibition, PD1-PDL1 interaction, and T cell co-inhibition (Fig. 7C). Molecular and signaling pathways in the TME exhibited significant correlations with risk scores. Specifically, positive correlations were found between risk scores and pathways like HYPOXIA, DNA REPAIR, GLYCOLYSIS, P53 pathway, and Mismatch repair, in contrast to negative correlations with PROTEIN SECRETION and HEDGEHOG SIGNALING pathways (Fig. 7D).
Fig. 7.
Immune Infiltration and Variations in Biological Pathways. A Comparison of StromalScore, ImmuneScore, ESTIMATEScore, and TumorPurity between the two risk groups. B, C Analysis of infiltrated immune cell levels and immune function differences between the two risk groups. D Correlation study between risk scores and biological pathways
Analysis of immunotherapy and chemotherapy drug responses
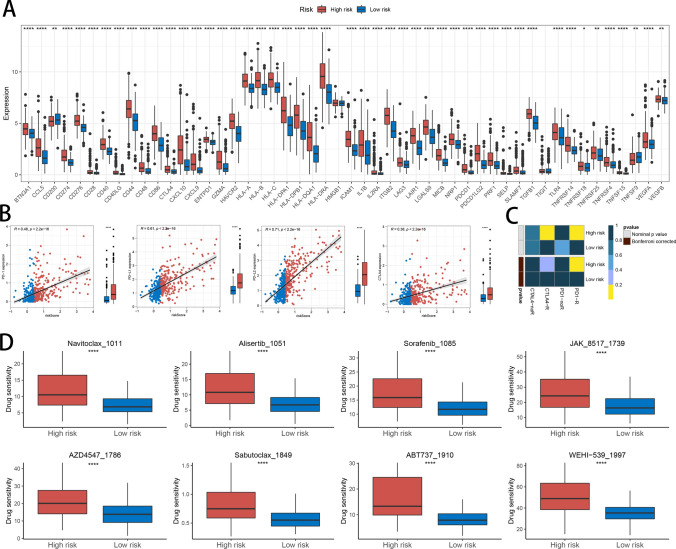
Immune checkpoint detection is a crucial aspect of immunotherapy. To elucidate the significance of HDAC-related risk signature in immunotherapy, we performed an analysis to investigate the linkage between immune checkpoint expression profiles and patient risk categorization. Our analysis found higher expression levels of CD274, CD40, PDCD1, VEGFA, and CTLA4 in high-risk compared to low-risk patients (Fig. 8A). To deepen our understanding, we delved into the associations between the risk scores and the expression levels of pivotal immune checkpoints, including PD-1, PD-L1, PD-L2, and CTLA4, aiming to uncover potential links. The results revealed a positive correlation, indicating that higher risk scores may be linked to elevated expression of these immune checkpoints (Fig. 8B). To predict immunotherapy response, we utilized SubMap, a powerful tool for identifying similar subgroups across gene expression datasets. By comparing gene expression patterns, SubMap analysis suggested that patients classified as high-risk might exhibit a favorable therapeutic response to anti-PD-1 treatment, hinting at potential benefits from this targeted therapy (Fig. 8C). Given that high-risk patients had poorer prognoses in previous analyses, we identified chemotherapy drugs that could offer effectiveness for this group. The predicted sensitive drugs for high-risk patients included Navitoclax_1011, Alisertib_1051, Sorafenib_1085, JAK_8517_1739, AZD4547_1786, Sabutoclax_1849, ABT737_1910, and WEHI-539_1997 (Fig. 8D).
Fig. 8.
The Relationship Between Risk Scores and Responses to Immunotherapy and Chemotherapy. A Comparison of immune checkpoint expression levels between the two risk groups. B Correlation analysis of PD-1, PD-L1, PD-L2, and CTLA4 expression levels with risk scores. C Prediction of immunotherapy responses to anti-PD-1 and anti-CTLA-4 in high- and low-risk patient groups based on SubMap analysis. D Comparison of antitumor drug sensitivity between high- and low-risk groups
Discussion
LGG represents a significant subtype of primary brain tumors, characterized by slower progression compared to more aggressive gliomas [17]. However, the clinical management of LGG is complicated by a complex interplay of genetic and epigenetic factors that contribute to tumor growth and therapeutic resistance [18]. HDACs are key regulators of gene expression and chromatin architecture, impacting critical processes like cell cycle regulation, apoptosis, and cellular differentiation [19]. Recent studies highlight HDACs’ role in LGG development and progression, with abnormal HDAC activity being linked to poorer prognoses and more aggressive tumor phenotypes [20]. Despite these findings, the specific mechanisms by which HDACs influence LGG pathophysiology, particularly their impact on the tumor microenvironment and immune modulation, remain elusive in understanding. This study seeks to clarify the significance of HDACs in LGG through comprehensive bioinformatics analyses, with the goal of identifying new therapeutic targets to improve treatment outcomes for patients with this complex disease.
To explore the clinical relevance of HDAC-related genes in LGG, we utilized 101 combinations of machine learning algorithms and identified four key genes—SP140, BAZ1B, SP100, and SIRT1—from 481 patients in the training cohort and 420 patients in the validation cohort. Using these genes, we constructed an HDAC-related risk score system to serve as a prognostic indicator for LGG. Consistent validation across both datasets revealed that individuals categorized as high-risk generally faced more dire prognoses, whereas those belonging to the low-risk group tended to experience more favorable clinical outcomes. Among the key genes, SP140, BAZ1B, and SP100 were identified as risk factors, whereas SIRT1 was found to be a protective factor. SP140, a transcriptional suppressor highly expressed in head and neck squamous cell carcinoma, correlates with increased tumor mutation load and a positive response to immunotherapy [21]. It is worth noting that the SP140 inhibitor GSK761 significantly inhibited the proliferation of U87 and U251 glioma cell lines in experiments [22]. BAZ1B, overexpressed in colorectal cancer (CRC), enhances CRC cell proliferation and colony formation [23]. In contrast, SIRT1 overexpression in colon cancer has been associated with reduced proliferation and tumor suppression [24, 25]. ROC curve analysis confirmed that the HDAC-related risk signature is an accurate quantitative tool for predicting OS at 1, 3, and 5 years in patients with LGG.
GO enrichment analysis revealed significant functional differences between two risk groups, emphasizing immune pathways, such as cell activation in immune response, leukocyte-mediated immunity, and immune receptor activity. These immune-related responses were enriched in upregulated genes among the differentially expressed genes, suggesting that the HDAC-related risk signature may be linked to immune responses and immunotherapy outcomes. Additionally, pathway analysis identified a positive correlation between risk scores and DNA repair, P53 pathway, and mismatch repair. Compared to normal tissues, tumor tissues exhibited higher levels of cellular proliferation, significantly increased DNA damage, and inactivation of the apoptotic gene P53. Mismatch repair, which is responsible for correcting base insertions, deletions, and mismatches during DNA replication, is crucial for maintaining genetic stability [26, 27]. Mutations or functional defects in mismatch repair genes result in the failure to correct these errors, triggering the accumulation of genetic mutations, which in turn accelerates tumor development [28]. Key genes in our risk model, including BAZ1B, SP100, SIRT1, and SP140, influence DNA repair, genomic stability, the P53 pathway, and immune cell activation, thereby impacting tumor progression and treatment response [22, 29–31].
The high-risk group showed significantly elevated expression of PD-1, PD-L1, and CTLA4 compared to the low-risk group. These immune checkpoint genes are crucial for tumor immune evasion, and their elevated expression typically indicates a greater tumor capacity to weaken the immune system, leading to poorer patient outcomes [32]. However, this high expression also implies that high-risk patients may exhibit greater responsiveness to immune checkpoint inhibitors, including PD-1, PD-L1 and CTLA4 inhibitors, potentially making immunotherapy more beneficial for them [33]. Moreover, high-risk group exhibited increased infiltration of Tregs, Th2 cells, and macrophages, which has significant implications for prognosis and immunotherapy. Tregs, known for their immunosuppressive effects within the tumor microenvironment, help tumors evade immune surveillance and are generally associated with worse outcomes [34]. M2-type macrophages also promote tumor growth and metastasis through their immunosuppressive properties [35]. Th2 cells can either facilitate or hinder tumor progression, depending on their subtype [36]. SubMap analysis further supported the notion that high-risk patients might respond favorably to PD-1 antibody treatment, aligning with the immune infiltration findings. In summary, the changes in gene expression and immune cell infiltration not only indicate a poorer prognosis for high-risk patients but also suggest they may be more responsive to specific immunotherapies. Therefore, personalized treatment strategies targeting these immune markers could be crucial in enhancing therapeutic outcomes and improving prognosis for high-risk patients.
Several limitations must be acknowledged in this research. Initially, the data were acquired from publicly accessible databases, without the inclusion of self-generated sequencing data, potentially affecting the uniqueness and reliability of the findings. To mitigate this limitation, future studies should integrate self-generated data to improve the accuracy and robustness of the results. Second, while the findings are primarily based on bioinformatic analyses, further experimental validation—such as in vitro studies or in vivo models—is essential to confirm the biological relevance and clinical applicability of the identified gene signature. Future studies should incorporate these experimental approaches to validate our results and explore their therapeutic implications.
Conclusion
In summary, this study emphasizes the substantial clinical significance of HDAC-related genes in predicting LGG outcomes. By applying 101 machine learning models, we identified four key genes—SP140, BAZ1B, SP100, and SIRT1—which were crucial in constructing a prognostic risk score system. This system accurately distinguishes high-risk from low-risk patients, with the former showing poorer prognoses. Additionally, the study underscores the complex relationship between these HDAC-related genes and immune responses, particularly within the context of immunotherapy. High-risk patients exhibited elevated immune checkpoint gene expression levels and increased immune cell infiltration, indicating that they may benefit more from targeted immunotherapies. These findings emphasize the potential for personalized treatment strategies that leverage genetic and immunological insights, ultimately aiming to improve therapeutic outcomes and patient prognosis in LGG.
Acknowledgements
Not applicable.
Author contributions
WW is responsible for the design of the project. WKS is responsible for data analysis and manuscript preparation. ZWJ reviewed and revised the manuscript, and LZY contributed to data collection.
Funding
Not applicable.
Data availability
LGG RNA-seq data (TPM values) along with clinical information were acquired from the TCGA-LGG database (https://portal.gdc.cancer.gov/), while the validation dataset was retrieved from the CGGA (http://www.cgga.org.cn/).
Declarations
Ethics approval and consent to participate
Not applicable.
Consent for publication
Not applicable.
Competing interests
The authors declare no competing interests.
Footnotes
Publisher's Note
Springer Nature remains neutral with regard to jurisdictional claims in published maps and institutional affiliations.
References
- 1.Ostrom QT, et al. CBTRUS statistical report: primary brain and other central nervous system tumors diagnosed in the United States in 2015–2019. Neuro Oncol. 2022;24(5):v1–95. [DOI] [PMC free article] [PubMed] [Google Scholar]
- 2.Baumert BG, et al. Temozolomide chemotherapy versus radiotherapy in high-risk low-grade glioma (EORTC 22033–26033): a randomised, open-label, phase 3 intergroup study. Lancet Oncol. 2016;17(11):1521–32. [DOI] [PMC free article] [PubMed] [Google Scholar]
- 3.Kiran M, et al. A prognostic signature for lower grade gliomas based on expression of long non-coding RNAs. Mol Neurobiol. 2019;56(7):4786–98. [DOI] [PMC free article] [PubMed] [Google Scholar]
- 4.Bush NA, Chang SM, Berger MS. Current and future strategies for treatment of glioma. Neurosurg Rev. 2017;40(1):1–14. [DOI] [PubMed] [Google Scholar]
- 5.Lombardi G, et al. Clinical management of diffuse low-grade gliomas. Cancers (Basel). 2020. 10.3390/cancers12103008. [DOI] [PMC free article] [PubMed] [Google Scholar]
- 6.Delev D, et al. Surgical management of lower-grade glioma in the spotlight of the 2016 WHO classification system. J Neurooncol. 2019;141(1):223–33. [DOI] [PubMed] [Google Scholar]
- 7.Louis DN, et al. The 2021 WHO classification of tumors of the central nervous system: a summary. Neuro Oncol. 2021;23(8):1231–51. [DOI] [PMC free article] [PubMed] [Google Scholar]
- 8.Turner BM. Histone acetylation and an epigenetic code. BioEssays. 2000;22(9):836–45. [DOI] [PubMed] [Google Scholar]
- 9.Seto E, Yoshida M. Erasers of histone acetylation: the histone deacetylase enzymes. Cold Spring Harb Perspect Biol. 2014;6(4): a018713. [DOI] [PMC free article] [PubMed] [Google Scholar]
- 10.Shen Y, Wei W, Zhou DX. Histone acetylation enzymes coordinate metabolism and gene expression. Trends Plant Sci. 2015;20(10):614–21. [DOI] [PubMed] [Google Scholar]
- 11.Eckschlager T, et al. Histone deacetylase inhibitors as anticancer drugs. Int J Mol Sci. 2017. 10.3390/ijms18071414. [DOI] [PMC free article] [PubMed] [Google Scholar]
- 12.Huang M, et al. Small molecule HDAC inhibitors: Promising agents for breast cancer treatment. Bioorg Chem. 2019;91: 103184. [DOI] [PubMed] [Google Scholar]
- 13.Ellis L, Hammers H, Pili R. Targeting tumor angiogenesis with histone deacetylase inhibitors. Cancer Lett. 2009;280(2):145–53. [DOI] [PMC free article] [PubMed] [Google Scholar]
- 14.Khan AN, Tomasi TB. Histone deacetylase regulation of immune gene expression in tumor cells. Immunol Res. 2008;40(2):164–78. [DOI] [PMC free article] [PubMed] [Google Scholar]
- 15.Sanmamed MF, Chen L. A paradigm shift in cancer immunotherapy: from enhancement to normalization. Cell. 2018;175(2):313–26. [DOI] [PMC free article] [PubMed] [Google Scholar]
- 16.Shanmukha KD, et al. Histone deacetylase (HDACs) inhibitors: Clinical applications. Prog Mol Biol Transl Sci. 2023;198:119–52. [DOI] [PubMed] [Google Scholar]
- 17.Gui C, et al. Tumor growth dynamics in serially-imaged low-grade glioma patients. J Neurooncol. 2018;139(1):167–75. [DOI] [PubMed] [Google Scholar]
- 18.Venneti S, Huse JT. The evolving molecular genetics of low-grade glioma. Adv Anat Pathol. 2015;22(2):94–101. [DOI] [PMC free article] [PubMed] [Google Scholar]
- 19.Li Y, Seto E. HDACs and HDAC inhibitors in cancer development and therapy. Cold Spring Harb Perspect Med. 2016. 10.1101/cshperspect.a026831. [DOI] [PMC free article] [PubMed] [Google Scholar]
- 20.Shen L, et al. Comprehensive analyses reveal the role of histone deacetylase genes in prognosis and immune response in low-grade glioma. PLoS ONE. 2022;17(10): e0276120. [DOI] [PMC free article] [PubMed] [Google Scholar]
- 21.Tanagala KKK, et al. SP140 inhibits STAT1 signaling, induces IFN-γ in tumor-associated macrophages, and is a predictive biomarker of immunotherapy response. J Immunother Cancer. 2022. 10.1136/jitc-2022-005088. [DOI] [PMC free article] [PubMed] [Google Scholar]
- 22.Li X, et al. SP140 inhibitor suppressing TRIM22 expression regulates glioma progress through PI3K/AKT signaling pathway. Brain Behav. 2024;14(3): e3465. [DOI] [PMC free article] [PubMed] [Google Scholar]
- 23.Grochowska A, et al. Evidence supporting the oncogenic role of BAZ1B in colorectal cancer. Am J Cancer Res. 2022;12(10):4751–63. [PMC free article] [PubMed] [Google Scholar]
- 24.Herranz D, Serrano M. SIRT1: recent lessons from mouse models. Nat Rev Cancer. 2010;10(12):819–23. [DOI] [PMC free article] [PubMed] [Google Scholar]
- 25.Firestein R, et al. The SIRT1 deacetylase suppresses intestinal tumorigenesis and colon cancer growth. PLoS ONE. 2008;3(4): e2020. [DOI] [PMC free article] [PubMed] [Google Scholar]
- 26.Gorgoulis VG, et al. Activation of the DNA damage checkpoint and genomic instability in human precancerous lesions. Nature. 2005;434(7035):907–13. [DOI] [PubMed] [Google Scholar]
- 27.Halazonetis TD, Gorgoulis VG, Bartek J. An oncogene-induced DNA damage model for cancer development. Science. 2008;319(5868):1352–5. [DOI] [PubMed] [Google Scholar]
- 28.Cohen R, et al. Clinical and molecular characterisation of hereditary and sporadic metastatic colorectal cancers harbouring microsatellite instability/DNA mismatch repair deficiency. Eur J Cancer. 2017;86:266–74. [DOI] [PubMed] [Google Scholar]
- 29.Dziulko AK, Allen H, Chuong EB. An endogenous retrovirus regulates tumor-specific expression of the immune transcriptional regulator SP140. Hum Mol Genet. 2024;33(16):1454–64. [DOI] [PMC free article] [PubMed] [Google Scholar]
- 30.Xiao A, et al. WSTF regulates the H2A.X DNA damage response via a novel tyrosine kinase activity. Nature. 2009. 10.1038/nature07668. [DOI] [PMC free article] [PubMed] [Google Scholar]
- 31.Sharma D, Muniyan R. Pharmacophore-guided in-silico discovery of SIRT1 inhibitors for targeted cancer therapy. Comput Biol Chem. 2024;113: 108275. [DOI] [PubMed] [Google Scholar]
- 32.Pardoll DM. The blockade of immune checkpoints in cancer immunotherapy. Nat Rev Cancer. 2012;12(4):252–64. [DOI] [PMC free article] [PubMed] [Google Scholar]
- 33.Yamaguchi H, et al. Advances and prospects of biomarkers for immune checkpoint inhibitors. Cell Rep Med. 2024;5(7): 101621. [DOI] [PMC free article] [PubMed] [Google Scholar]
- 34.Saleh R, Elkord E. FoxP3(+) T regulatory cells in cancer: prognostic biomarkers and therapeutic targets. Cancer Lett. 2020;490:174–85. [DOI] [PubMed] [Google Scholar]
- 35.Wang H, Tian T, Zhan J. Tumor-associated macrophages (TAMs) in colorectal cancer (CRC) from mechanism to therapy and prognosis. Int J Mol Sci. 2021. 10.3390/ijms22168470. [DOI] [PMC free article] [PubMed] [Google Scholar]
- 36.Shang Q, et al. Polysaccharides regulate Th1/Th2 balance: a new strategy for tumor immunotherapy. Biomed Pharmacother. 2024;170: 115976. [DOI] [PubMed] [Google Scholar]
Associated Data
This section collects any data citations, data availability statements, or supplementary materials included in this article.
Data Availability Statement
LGG RNA-seq data (TPM values) along with clinical information were acquired from the TCGA-LGG database (https://portal.gdc.cancer.gov/), while the validation dataset was retrieved from the CGGA (http://www.cgga.org.cn/).


