

Summary
Autophagy-lysosomal degradation is a conserved homeostatic process considered to be crucial for cardiac morphogenesis. However, both its cell specificity and functional role during heart development remain unclear. Here, we introduced zebrafish models to visualize autophagic vesicles in vivo and track their temporal and cellular localization in the larval heart. We observed a significant accumulation of autolysosomal and lysosomal vesicles in the atrioventricular and bulboventricular regions and their respective valves. We addressed the role of lysosomal degradation based on the Spinster homolog 1 (spns1) mutant (not really started, nrs). nrs larvae displayed morphological and functional cardiac defects, including abnormal endocardial organization, impaired valve formation and retrograde blood flow. Single-nuclear transcriptome analyses revealed endocardial-specific differences in lysosome-related genes and alterations of notch1-signalling. Endocardial-specific overexpression of spns1 and notch1 rescued features of valve formation and function. Altogether, our results reveal a cell-autonomous role of lysosomal processing during cardiac valve formation affecting notch1-signalling.
Subject areas: Molecular biology, Cell biology, Developmental biology, Transcriptomics, Model organism
Graphical abstract
Highlights
-
•
Zebrafish allow tracking autophagic vesicles in vivo in the developing heart
-
•
Localized autophagy-lysosomal degradation supports heart valve development
-
•
Spns1-deficiency disrupts endocardial lysosomal function affecting valve formation
-
•
Impaired lysosomal function alters notch1-signalling in nascent valves
Molecular biology; Cell biology; Developmental biology; Transcriptomics; Model organism
Introduction
The macroautophagy/autophagy-lysosomal pathway plays a fundamental role in the maintenance of the cardiovascular system. Autophagy mediates the recycling of cytoplasmic components, organelle turnover, and the availability of basic building blocks and metabolites. It is active in all cells under basal conditions, but can also be activated under stress conditions.1,2 During vertebrate embryonic development, autophagy-lysosomal processes are necessary to supply metabolites, enable organelle degradation for tissue remodeling, and support cell differentiation.3,4,5 In addition, autophagic processes have been suggested to control cell signaling driving tissue patterning and morphogenesis, with the lysosome acting as a cellular signaling center.5,6 Indeed, lysosomal function has been associated with congenital and acquired cardiovascular and valve diseases7; and inherited lysosomal storage disorders have been linked to valve pathologies such as pulmonary valve stenosis, mitral valve degeneration, and valve calcification.8,9,10,11 Moreover, links have been identified between autophagy-related gene expression and congenital atrioventricular valve defects.6,12 Yet, despite its evident biological and clinical significance, the function of lysosomal degradation during cardiac valve development has not been addressed.
Autophagic degradation requires the formation of an isolation organelle, known as the autophagosome, to sequester cytoplasmic components and target them to the lysosome. The lysosome contains digestive enzymes to break down cellular cargoes and is designed to maintain an acidic environment that allows their optimal activity.13 Fusion of the autophagosome with the lysosome leads to formation of the autolysosome, in which the cargo is processed. The resulting building blocks and degradation products are recycled or secreted.13 To study these highly dynamic processes during heart formation, experimental models that permit their precise in vivo observation are essential. The zebrafish has long been considered an outstanding model organism for heart development studies thanks to its advantageous features for in vivo high-resolution imaging, such as external embryonic development, transparency, and amenability to genetic manipulation.14 Furthermore, the similarities between its fast-developing heart and the mammalian heart make it particularly suitable to study the progression of congenital cardiovascular diseases. Many morphological characteristics of mammalian heart valves are shared with the zebrafish, and their formation is coordinated by the same signaling pathways that regulate mammalian endocardial cushion formation, endothelial-to-mesenchymal transition (endoMT), and valve interstitial cell proliferation.15,16
The availability of cell- and organelle-specific zebrafish reporters and genome editing approaches have supported the study of processes underlying cardiovascular disease, including autophagy.17,18,19 The zebrafish model has allowed to establish a link between autophagy-related gene expression and the corresponding transcriptional patterning of the early developing vertebrate heart,6 to mimic cardiac phenotypes observed in lysosomal storage disorders18 and to functionally characterize mutations in lysosome-related genes associated with congenital cardiac defects.20,21 Still, the cell-type specific function of autophagy-lysosomal degradation during cardiac valve development is not fully understood and the developmental signaling pathways to which it is coupled remain elusive. Here, we utilized high-resolution live imaging to describe in detail the autophagy-lysosomal events taking place during zebrafish heart development. We established a new knock-in autophagosome reporter and used cell- and organelle-specific transgenic lines to follow autophagosome and lysosome formation in the beating larval heart. This allowed us to reveal how autophagic degradation is connected to the cellular events which coordinate cardiac valve formation.
Based on the not really started (nrs) zebrafish model, which carries a retroviral insertion affecting the expression of the gene Spinster homolog 1 (spns1), we investigated how improper lysosomal function influences valve formation and function. spns1 encodes a lipid-transporter that lethally affects lysosomal acidity and, consequently, the function of pH-dependent lysosomal proteases.22,23 The nrs mutant is a thoroughly characterized model of lysosomal-function impairment, which has allowed the study of lysosomal deficiency in the context of embryogenesis,24 senescence25,26 and muscle degeneration.27 Interestingly, the human SPNS1 locus is located within the chromosome region 16p11.2, a region that has been associated with myxomatous mitral valve prolapse,28 aortic valve abnormalities,29 septal defects and coarctation of aorta.30 Utilizing light-sheet, confocal and electron microscopy, we compared the morphology and function of mutant and sibling hearts and found that lysosome activity in endocardial cells is required for proper valve morphogenesis. With single-nuclei transcriptome analysis of the nrs mutant heart, we exposed a role for lysosomal function in notch1 signaling and propose a link between the lysosomal function and correct valve development.
Results
Autophagosome formation accompanies valve development
To elucidate the role of autophagy-lysosomal processing during cardiac valve formation, we characterized the localization and kinetics of autophagosome, autolysosome and lysosome accumulation in the developing zebrafish heart. For this, we established and made use of zebrafish transgenic models and live fluorescent dyes to locate these organelles within three distinct cardiac regions: the ventricle (V), the outflow tract (OFT) and the atrioventricular canal (AVC) (Figures 1 and 2; Figures S1–S3). We optimized a previously described31 experimental setup for in vivo imaging of zebrafish larvae along with a downstream image processing workflow to obtain a four-dimensional reconstruction (3D+t) of the beating larval heart (Figure 1A–C).31 This allowed us to identify the nascent valves in the OFT and AVC, which is only accurately possible when visualized in motion.32 We performed live imaging at four larval stages, during which the main sequence of cellular processes that lead to valve formation takes place33,34: endocardial cell (EnC) clustering at the AVC (48 h postfertilization, hpf), EnC migration into the cardiac jelly (56 hpf), formation of a multilayered primitive valvular structure (72 hpf) and elongation of the valve leaflet (96 hpf). Finally, we established an image segmentation pipeline that allowed automated regional quantification of fluorescently labeled autophagosomes, autolysosomes and lysosomes.
Figure 1.

Autophagosome formation accompanies valve development
(A) Experimental plan followed for in vivo imaging of the developing zebrafish heart. Transgenic zebrafish larvae were imaged at 48, 56, 72 and 96 hpf upon 3 h treatment with chloroquine (2 mM) to observe autophagosomes and lysosomes in the beating heart using light-sheet microscopy and following a 3D+t acquisition mode.
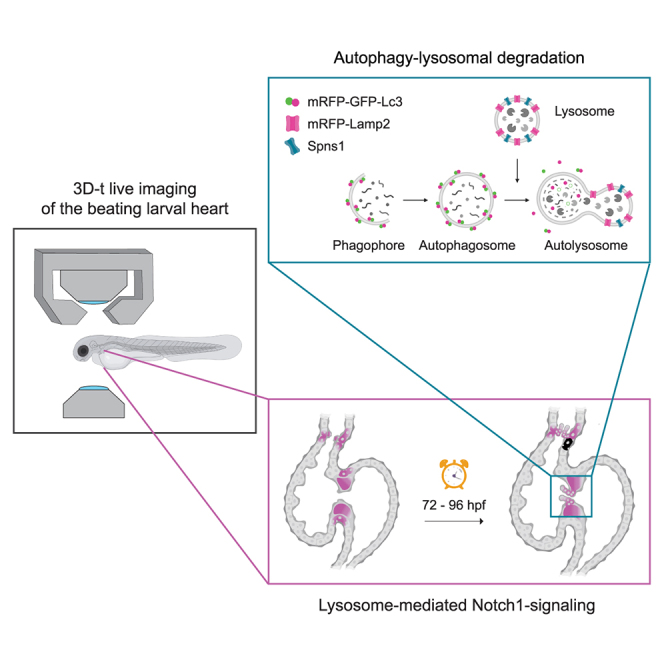
(B) Schematic overview of the process of autophagy-lysosomal degradation involving phagosome and autophagosome formation, fusion with lysosome, and lysosomal degradation. The transgenic autophagosome tagged reporter proteins used in this study are illustrated.
(C) Graphic representation of the cardiac region imaged. AVC, atrioventricular canal; EnCs, endocardial cells; VIC, valve interstitial cells; EnVCs, endocardial valve cells.
(D–F) Reconstructed image acquisitions by 3D+t light-sheet microscopy. Shown are always merged (color) and single channel views (inverted greyscale). Anterior is to the top, ventricle to the left, atria to the right. Middle part constriction is the AVC. Developmental stages are indicated within the panels as hours postfertilization (hpf). Graphs show number of mRFP-GFP + puncta within ventricle and AVC regions at the different developmental stages. Shown are numbers in individual animals as well as median and quartile values. Each point represents one larva. Statistical test: two-way ANOVA, ∗p ≤ 0.05, ∗∗p ≤ 0.01, ∗∗∗p ≤ 0.001). Scale bars represent 10 μm. (D) Tg(β-actin2:mRFP-GFP-Lc3) larvae show mRFP-GFP+ autophagosomes ubiquitously distributed in the developing heart and accumulation of mRFP+-only autolysosomes in the atrioventricular canal (AVC) during development. Arrows point to double-positive puncta in atrioventricular valves. TgKI(mRFP-Lc3) expresses an mRFP-tagged version of the endogenous autophagosome backbone protein Lc3. This reporter line was crossed into the endocardial Tg(fli1a:GFP) (E) and myocardial Tg(myl7:GFP) (F) lines. Arrows mark mRFP+-puncta in endocardium and myocardium, respectively. See also Figure S2.
Figure 2.

Lysosome accumulation during cardiac valve development
(A) Experimental set up for in vivo lysosome imaging in the developing zebrafish heart. Transgenic zebrafish larvae were imaged at 48, 56, 72 and 96 h post fertilization (hpf) using light-sheet microscopy and following a 3D+t acquisition mode.
(B) Schematic overview of the process of autophagy-lysosomal degradation involving phagosome and autophagosome formation, fusion with lysosome, and lysosomal degradation. Lysosomes were tracked using LysoTracker or a transgenic reporter line expressing lamp2 fused with red fluorescent protein mRFP.
(C) Graphic representation of the cardiac region imaged, corresponding to the atrioventricular canal (AVC). EnCs, endocardial cells; VIC, valve interstitial cells; EnVCs, endocardial valve cells.
(D–F) Reconstructed live image acquisitions by 3D+t light-sheet microscopy. Shown are optical sections through hearts at the indicated developmental stages. Anterior is to the top, the ventricle to the left and atria to the right. Upper panels show merged channels (color), lower panels single channels (inverted greyscale). Arrows mark mRFP+-puncta in the atrioventricular valves. Graphs show quantification of fluorescent puncta in the ventricle and AVC regions at different developmental stages. Shown are numbers in individual animals as well as median and quartile values. Each dot represents one larva. Statistical test: two-way ANOVA, ∗p ≤ 0.05, ∗∗p ≤ 0.01, ∗∗∗p ≤ 0.001, ∗∗∗∗p ≤ 0.0001). Scale bars represent 10 μm. (D) Tg(cmv:EGFP-Lc3) embryos were stained with LysoTracker to observe GFP+ autophagosome and LysoTracker+ acidic lysosomal vesicles in the developing heart. Note that EGFP signal is also strongly detected in circulating erythrocytes between 48 and 56 hpf, but later localizes mainly to the in AVC. LysoTracker-labelled lysosomes are scarcely observed before 56 hpf in cardiac tissues, but accumulate in the AVC at 72 hpf and are prominent in the developing valves at 96 hpf. (E and F) The lysosome reporter Tg(lamp2:RFP) was crossed into Tg(fli1:GFP) (E) or Tg(myl7:GFP) (F) to assess lysosomes colocalization in endocardium and myocardium, respectively.
(G) Cardiac sections of Tg(cmv:GFP-LC3);(lamp2:RFP) immunostained for GFP (green), RFP (magenta) and ALCAM (yellow). Arrows point to RFP/GFP double positive puncta. ALCAM staining allows to demarcate the myocardium at the AVC. Scale bars represent 10 μm. See also Figure S3.
We used the ubiquitous dual-fluorophore transgenic line Tg(actb2:mRFP-GFP-map1lc3b)udc2Tg here referred to as Tg(β-actin2:mRFP-GFP-Lc3),35 which expresses the autophagosome microtubule-associated protein light chain 3B (MAP1LC3B, hereafter referred as Lc3) tagged with both a monomeric red (mRFP) and green fluorescent protein (GFP). This line allowed to follow the distribution of autophagosomes (mRFP+-GFP+ puncta) and autolysosomes (mRFP+-only puncta). We first confirmed that mRFP+ and GFP+ puncta were detectable in fixed samples (Figure S1A). Then, we used in vivo imaging for further characterization during AVC and OFT valve formation from 48 to 96 hpf (Figures 1D, S2A-D, and Video S1). Prior to imaging, larvae were shortly treated with the lysosomal-inhibitor chloroquine to block autophagic flux36 and to allow the observation of autophagosome puncta, following similar protocols used to observe autophagy activation in zebrafish models.17,35 Compared to the scarcely found mRFP-GFP+ autophagosomes, mRFP-labelled autophagosomes/autolysosomes were detected in high numbers as discrete puncta across the heart from 48 hpf onwards. We quantified the number of mRFP-GFP+ and mRFP+-only puncta as a proxy for autophagosome and autolysosome accumulation in the V, AVC and OFT regions. This quantification suggested an increase in autolysosomes during heart tube maturation from 48 to 96 hpf in the three cardiac regions (Figures 1D and S2D).
The video shows the z-stack projection, one z-plane and a sequence of the stack images acquired by 3D + t light-sheet microscopy and upon reconstruction by retrospective gating. The cytoplasmic signal of GFP (green) as well as discrete mRFP+ autophagosomes/autolysosomes (magenta puncta) are sparsely distributed throughout the ventricle (V). Accumulation of both GFP/mRFP+ autophagosomes (white puncta) and mRFP+ autolysosomes can be distinguished the outflow track (OFT) and atrioventricular canal (AVC), suggesting increased autophagic activity in these regions (yellow arrows), related to Figure 1
A caveat with the use of an ubiquitous line such as Tg(β-actin2:mRFP-GFP-Lc3) is that tissues with particularly high β-actin2 promoter activity, such as the myocardium, will show higher reporter expression as compared to the less-contractile endocardium. To overcome this bias and accomplish an accurate tracking of autophagosome/autolysosome accumulation in all cardiac tissues, we decided to create a knock-in transgenic line (TgKI(mRFP-map1lc3b), hereafter referred to as TgKI(mRFP-Lc3), that allows the visualization of the endogenous Lc3 and thus unbiased tracking of autophagosome/autolysosome vesicles (Figures S1B–E). For this, we introduced the coding sequence of the fluorescent protein mRFP upstream of and in frame with the first exon of the map1lc3b zebrafish orthologue, to generate a tagged native protein (Figure S1C,E.37 We confirmed detection of autophagosomes/autolysosomes with this line by crossing it into the autophagosome reporter Tg(cmv:EGFP-Lc3) (Figure S1F).
By crossing TgKI(mRFP-Lc3) with the endocardial Tg(fli1a:GFP) reporter, (Figures 1E, S2E, and Video S2), we could locate autophagosomes in the endocardium. Interestingly, the increase in mRFP+-puncta during development was highest in the endocardium close to the AVC and OFT, compared to the endocardium of the rest of the ventricle. We next crossed TgKI(mRFP-Lc3) into the myocardial reporter Tg(myl7:GFP) (Figures 1F and S2F; Video S3). Here, we also observed an increase over time, but contrary to the endocardium, the increase was not restricted to a particular cardiac region. During OFT development, the endocardium of the bulbus arteriosus is covered by an outer fibroblast layer. We found that mRFP-Lc3 expression was also detected in periostin-positive fibroblasts (postnb+) lining the OFT surface from 72 hpf onwards (Figure S2G).
The knock-in endogenous autophagosome reporter TgKI(mRFP-Lc3) allows to observe the accumulation (white arrows) of mRFP+ autophagosomes/autolysosomes (magenta puncta) in the endocardium (Tg(fli1a:GFP, yellow), particularly in endocardial valve cells of the outflow track (OFT) and atrioventricular canal (AVC). A z-stack projection, one z-plane and a sequence of the stack images acquired by 3D + t light-sheet microscopy and upon reconstruction by retrospective gating are shown (V: ventricle), related to Figure 1
The knock-in endogenous autophagosome reporter TgKI(mRFP-Lc3) allows to observe the accumulation (white arrows) of mRFP+ autophagosomes/autolysosomes (magenta puncta) in cardiomyocytes (Tg(myl7:GFP, yellow) in the outflow track (OFT) just below the clapping valve, and at the base of the valves in the atrioventricular canal (AVC). The video shows a z-stack projection, one z-plane and a sequence of the stack images acquired by 3D + t light-sheet microscopy and upon reconstruction by retrospective gating. (V: ventricle), related to Figure 1
Lysosome accumulation during valve development
To follow the complete autophagic pathway, we next tracked lysosome accumulation using LysoTracker Deep Red (Figure 2A–D; Figures S3A–D and Video S4), hereafter referred to as LysoTracker, which allows to fluorescently label acidic vesicles in vivo. To observe their co-localization with autophagosomes, we used the ubiquitous autophagosome reporter Tg(cmv:EGFP-Lc3). Contrary to the β-actin2-promoter-mediated mRFP-GFP autophagosome reporter, the Tg(cmv:EGFP-Lc3) transgenic line showed high expression in erythrocytes at 48 and 56 hpf (Figure 2D). From 72 hpf onwards, cells in the OFT and AVC regions showed high green fluorescence and some distinguishable EGFP-Lc3+ puncta, confirming our observations of autophagy activation with the ubiquitous and the endogenous LC3-reporters in these regions. Due to the high EGFP-Lc3 signal in the atrioventricular and outflow regions, neither automated segmentation of GFP+-puncta nor the quantification of GFP+-autophagosomes colocalizing with LysoTracker+-lysosomes was possible. Nevertheless, similar to our quantifications on autolysosomes, we observed an accumulation of lysosomes in the course of heart development. Moreover, we noticed that the increase of LysoTracker+ puncta from 48 to 96 hpf was highest in the AVC and OFT regions (Figures 2D and S3D), suggesting elevated lysosomal activity during valvulogenesis.5
The autophagosome reporter Tg(cmv:EGFP-Lc3) shows high fluorescence (green) in the outflow tract (OFT) and the atrioventricular canal (AVC) suggesting greater accumulation of autophagic vesicles in these cardiac regions. Similarly, a significant accumulation of LysoTracker-labelled lysosomes (magenta puncta) is observed in the developing cardiac valves (yellow arrows). These results indicate a high rate of autophagic-lysosomal processing during valve development. The video shows a z-stack projection, one z-plane and a sequence of the stack images acquired by 3D + t light-sheet microscopy and upon reconstruction by retrospective gating. (V: ventricle), related to Figure 2
Since the LysoTracker dye may also label acidic endosomes and its fluorescence depends on the dye permeability and environmental pH,19 we complemented our characterization with a transgenic Lamp2-reporter TgBAC(lamp2:RFP). TgBAC(lamp2:RFP) animals were crossed into Tg(kdlr:EGFP-CAAX), Figures 2E and S3E and Video S5) and Tg(myl7:GFP) (Figures 2F and S3F and Video S6) to identify lysosomes in endocardial cells and cardiomyocytes, respectively. We observed that the increase in lamp2:RFP puncta was particularly evident in the AVC in both the endocardium and the myocardium during progression of development, peaking at 72 hpf. Immunostaining on fixed larvae confirmed that cmv:EGFP-LC3+/lamp2:mRFP+ puncta could be detected in the myocardial and endocardial parts of forming cardiac valves (Figure 2G). We also detected lysosomes within the fibroblasts covering the OFT (Figure S3G), consistent with the result obtained with mRFP-Lc3.
Figure 3.

Impaired lysosomal degradation in the developing nrs-mutant heart
(A–C) The transgenic lines Tg(β-actin2:mRFP-GFP-Lc3), Tg(cmv:EGFP-Lc3) and Tg(kdlr:EGFP-CAAX);(lamp2:RFP) were crossed into the nrs mutant background to assess autophagic processing in the larval heart at 3 days postfertilization (dpf) by light-sheet microscopy. Projections and optical sections of reconstructed 3D+t acquisitions are shown. White arrows point to mRFP+ autophagosomes/autolysosomes and lysosomes accumulating at different regions of the heart. Scale bars represent 25 μm.
(D) The number of puncta was estimated for mRFP+-autophagosomes/autolysosomes, LysoTracker+ lysosomes and lamp2+ lysosomes and normalized to the ventricle cross-sectional area. The results show a significant accumulation of all autophagic vesicles in nrs-mutant hearts compared to their siblings, which indicates an impairment in autophagic flux. Data are represented as mean ± SD. Each dot represents one larva. Statistical analysis was performed using Welch’s t-test. Scale bars represent 25 μm.
(E and F) Graphs showing the quantification of average lysosomal size in different cardiac areas (Ventricle, V; AVC and OFT) in wildtype siblings and nrs mutants. Each dot represents one larva. Shown are also median and quartiles. Statistical analysis was performed using two-way ANOVA.
(G) Transmission electron microscopy of 4 dpf mutant and sibling hearts. Note the presence of massive lysosomal compartments with partially degraded contents in nrs hearts (yellow arrowheads), mostly in endothelial cells in the OFT and AVC (N = 3). Sibling ventricular and atrioventricular endocardial valve cells (blue-colored nuclei) show a characteristic cuboidal shape that was not visible in nrs endocardial cells at the AVC and outflow tract (OFT). In nrs mutants, the cardiac lumen was filled with lysosomal-derived contents (red arrowheads). Er, erythrocyte; n, nucleus. Scale bars represent 1 μm in the overview images and 0.5 μm in the zoom-in images (yellow rectangles). See also Figure S4.
The video shows a z-stack projection, one z-plane and a sequence of the stack images acquired by 3D + t light-sheet microscopy and upon reconstruction by retrospective gating. Lysosomes (mRFP+ puncta) are observed throughout the larval heart (V: ventricle), yet they are most densely localized in krdl+ endocardial cells and valve cells (white arrows) of the outflow tract (OFT) and atrioventricular canal (AVC). This hints toward special lysosomal function requirements for cells in these regions, related to Figure 2
The video shows a z-stack projection, one z-plane and a sequence of the stack images acquired by 3D + t light-sheet microscopy and upon reconstruction by retrospective gating. Lysosomes (mRFP+ puncta) are observed to be distributed throughout the larval ventricle (V), yet they appear to be denser (white arrows) in myocardial cells (yellow) adjacent to the base of the valves in the outflow tract (OFT) and atrioventricular canal (AVC), suggesting higher lysosomal activity on these cardiac regions during the formation of their respective valves, related to Figure 2
Impaired lysosomal degradation in the developing nrs mutant heart
To understand the function of autophagy-lysosome degradation in the development of the heart, we used the nrs zebrafish mutant,24 in which lysosomal-function is impaired.26 Following our established experimental workflow to observe autophagic vesicles in the developing heart, we evaluated autophagic processing in the nrs mutant compared to siblings (Figure 3A–C). Consistent with previous observations in the nrs yolk24,25 and skeletal muscle,27 we found a significant accumulation of mRFP+-autolysosomes, LysoTracker+ vesicles and lamp2+-lysosomes in the mutant heart at 3 days post-fertilization (dpf) (Figure 3D). Quantification of lysosome-puncta revealed that their average size was increased in nrs hearts compared to siblings (Figures 3E and 3F). The observed enlarged autolysosomal/lysosomal compartments suggest impaired degradation.25
To confirm alterations in autolysosome turnover, we used transmission electron microscopy from OFT and AVC regions of mutant and sibling hearts (Figure 3G). Mutant hearts revealed a disorganization of the OFT and AVC tissues and large lysosomal vesicles containing partially degraded cargoes in endothelial cells of the OFT and AVC. Furthermore, the organized endothelial cell lining in the developing OFT valves and the cuboidal shape of the AVC endothelial valve cells of sibling hearts was not apparent in the mutant hearts. Although, we did not observe phenotypic changes of cardiomyocyte mitochondria or actin fibers in nrs hearts (Figure S4A), we found dark structures full of double membrane autophagic vacuoles within the mutant myocardium, suggesting an accumulation of unprocessed lysosomal contents. In addition, we observed vesicle-like structures in the lumen of the mutant heart with high similarity to the lysosomal contents that accumulate in endocardial cells (Figure 3G). Together, our results point toward a significant impairment of lysosomal processing in nrs hearts, particularly affecting endocardial tissues and the organization of endothelial valve cells.
Lysosomal mutants present abnormal valve development and function
Given that autolysosomes are accumulating at the OFT and AVC, we focused next on these areas to further characterize the cardiac phenotype in nrs (Figure 4). The length of the OFT was proportionally smaller in the mutant heart at 3 dpf, though no differences were found at 4 dpf (Figure 4A-B). In contrast, the AVC was proportionally wider in the mutant at both developmental time points (Figure 4A-B). In the mutant, the endocardium at the AVC failed to organize, and endocardial cells accumulated at the AVC without displaying proper ALCAM expression (Figure 4A-B). Indeed, while endocardial ALCAM+-cells lining the OFT valves were present in most siblings, they were found in less than 40% of the mutants at 3 dpf and in only ∼30% at 4 dpf. In the case of the AV-valves, which consist of aligned cuboidal ALCAM+-endocardial cells both at 3 and 4 dpf, only ∼26–28% of the larvae showed ALCAM expression in atrioventricular endocardial valve cells (EnVCs), and their organization was lost. When observing valve function, we detected that endocardial tissue contraction was restrained, and that movement in the outflow tract was obstructed (Video S7). Elongated and clapping valves were rarely functional in the mutant hearts, and correspondingly, a high prevalence of retrograde flow was observed (Figure 4C–F and Video S8). In conclusion, both valve morphology and function were severely impaired in mutant hearts. We further observed that nrs mutant hearts had a mild reduction in ventricle size and a more spherical ventricular shape (Figures S4B-C). The alterations in cardiac morphology correlated with alterations in function: the heart rate was lower (Figure S4D and Figure 4G), as was cardiac output (Figure S4E). However, no evidence of shortening of the ejection fraction (Figure S4F) or arrythmia (RMSSD, Figure S4G) was found.
Figure 4.

nrs mutant have abnormal valve development and function
(A and B) Cardiac morphology and valve development was evaluated in Tg(kdrl:GFP) transgenic nrs mutants between 3 and 4 dpf. Confocal microscopy images of whole mount larval hearts immunostained for GFP (endocardium) and ALCAM (myocardium and endocardial valve cells). Nuclei are counterstained with DAPI. Arrows point to ALCAM+ endocardial valve cells within the atrioventricular canal (AVC) and outflow tract (OFT). Right panels show a schematic representation of the observed phenotypic alterations in nrs compared to siblings. When normalized to the ventricle cross-sectional area, the length of the OFT in the mutant heart was proportionally smaller at 3 dpf in nrs larvae, whereas the AVC was significantly wider compared to their siblings at both experimental time-points. Most sibling hearts displayed ALCAM+-organized primitive valve layers at 3 dpf (OFT 91%, AVC 73%; total siblings = 22) and aligned Acam+-valve endothelial cells at 4 dpf (OFT 100%, AVC 85%; total sibling = 19). In contrast, ALCAM+-endocardial cells were rarely observed in mutant larvae both at 3 dpf (OFT 40%, AVC 26% total nrs = 18) and 4 dpf (OFT 31%, AVC 28%; total nrs = 20) and the organization of valve endothelial cells was lost by 4 dpf. Data are represented as mean ± SD. Each dot represents one larva. Statistical analysis was performed using Mann-Whitney-U test. Scale bars represent 10 μm.
(C) To evaluate valve function and blood flow, sibling and mutant larvae were immersed in BODIPY FL C5-Ceramide, a green-fluorescent dye which counterstains the blood plasma and live imaged by light-sheet microscopy. Scale bars represent 10 μm. Qualitative parameters were considered to evaluate (D) OFT- and (E) AV-valve elongation and function (0: no valve cells; 1: valve cushions, 2: delaminated valve cells, 3: elongated clapping valves). Each dot represents one valve. Chi-square test was applied to analyze differences between experimental groups.
(F) Percentage of larvae presenting normal, low, retrograde or no blood flow.
(G) Heart rate was calculated from the number of beats during the acquisition of 150 frames. Data are represented as mean ± SD. Each dot represents one larva. Statistical analysis was performed using Mann-Whitney-U test.
The video shows the z-stack projections of beating sibling and nrs hearts to exemplify the constrained movement of the mutant endocardium (green) compared to the sibling. In contrast, the myocardium (magenta) contractility does not seem to be as affected in nrs mutants. Further, compared to the sibling heart, the outflow tract (white arrow) in the mutant heart shows limited capacity of expansion, related to Figure 4
The video allows to compare the development, morphology and movement of sibling and nrs mutant bulboventricular (OFT) and atrioventricular (AVC) cardiac valves. In contrast to the elongated, detached and clapping valves preventing retrograde blood flow in sibling hearts, mutant valves have hardly delaminated or elongated by 96 hpf and they cannot properly close, related to Figure 4
To assess the cardiac susceptibility to mutations in spns1, we evaluated cardiac morphology and function in spns1 crispants (Figure S5). Compared to mutants, spns1 crispants showed a more transparent and extended yolk compared to the wild type (Figure S5A), which has been associated with a decreased severity of the mutant phenotype.26 Despite this, spns1 crispants still showed a significant reduction in ventricle size and an increased circularity as compared to control injected larvae (Figure S5B–D). Just like in the mutants, the formation of organized valve leaflets was affected in the crispants, with only 36% of the larvae showing ALCAM+-endothelial cells delineating the nascent atrioventricular valve leaflets, compared to 68% of the control larvae (Figure S5E). As in the mutant, both OFT and AV valve elongation were diminished by spns1 deficiency (Figures S5F–S5H) and thickened non-clapping valves were found in most crispants, which partially affected unidirectional blood flow (Figure S5I). However, in contrast to the mutants (Figure 4G), spns1 crispants showed no difference in heart rate compared to controls, which suggests that impaired valve development in spns1-deficient larvae is independent of ventricular function (Figure S5J). Altogether, our results indicate that loss of spns1 function compromises cardiac development, particularly affecting valve morphogenesis and function.
Endocardial-specific overexpression of spns1 rescues valve development and function
Since our results suggest that lysosomal impairment particularly affects endocardial development and function, and that the absence of spns1 disrupts lysosomal processes in the endocardial tissue, we investigated whether the endocardial-specific expression of the wild type spns1 gene could rescue the observed cardiac phenotypes. For this, we established a UAS-mediated transgenic line that permitted tissue specific spns1 expression in endothelium when crossed with a fli1a-Gal4 line (Figure 5). As above, we obtained double transgenic mutant larvae by crossing single transgenic heterozygous parents (Figure 5A). When we verified the expression of spns1 in the mutants via qPCR (Figure 5B), we found that most of the living nrs-mutants at 4 dpf were double transgenic Tg(fli1a:Gal4);(UAS:spns1), hinting toward a rescue effect in nrs survival (Figure 5C). While endocardial overexpression of spns1 did not induce any significant morphological or functional change in the ventricle (Figure 5D), it led to a partial rescue of valve elongation in the mutant valves (Figure 5E–G). This resulted in valve function recovery, reflected by an increased percentage of larvae with normal blood flow (Figure 5H, Video S9), which could not be attributed to heart function recovery (Figure 5I). Moreover, electron microscopy revealed a reduction in the frequency and size of lysosomal vesicles with partially degraded cargo in endocardial cells (Figure 5J–K), though lysosomal contents were still found in the cardiac lumen and myocardium (Figure 5L). In summary, these results suggest that spns1-dependent lysosomal function is required in endocardial cells to regulate correct myocardial-endocardial cell interaction and organization and drive valve morphogenesis.
Figure 5.

Endothelial specific overexpression of spns1 rescues valve development and function
(A) To address the endocardial-specific susceptibility toward lysosomal impairment, a rescue strategy based on the endothelial-specific overexpression of the wild-type spns1 gene was implemented. For this, single transgenic heterozygous parents (spns1+/−;fli1a:Gal4 and spns1+/−;UAS:spns1) were crossed to obtain control (nrs;UAS:spns1) and rescue (nrs;fli1a:Gal4;UAS:spns1) larvae.
(B) Overexpression of the spns1 was verified by qPCR. Data are represented as mean ± SD. Each dot represents a pool of larvae.
(C) Larval survival percentage at 4 dpf for each experimental group.
(D) Confocal microscopy images of whole-mount immunostaining of larval hearts show enhanced ALCAM staining in the OFT and AVC in rescued hearts. Scale bars represent 25 μm.
(E) Light-sheet microscopy of BODIPY FL C5 -stained larvae was performed to evaluate cardiac and valve function. Scale bars represent 10 μm.
(F) OFT- and (G) AV-valve elongation and function were evaluated qualitatively (0: no valve cells; 1: valve cushions, 2: delaminated valve cells, 3: elongated clapping valves). Each dot represents one valve. Chi-square test was applied to analyze differences between experimental groups.
(H) Percentage of larvae presenting normal, low, retrograde or no blood flow.
(I) Heart rate was calculated from the number of beats during the acquisition of 150 frames. Statistical analysis was performed using Mann-Whitney-U test. Data are represented as mean ± SD. Each dot represents one larva.
(J and K) Transmission electron microscopy revealed a reduction in the accumulation of partially degraded lysosomal contents in endocardial cells of rescued larvae (yellow arrowheads), and a partial restoration of endocardial morphology. Per experimental group N ≥ 3 larvae and N ≥ 8 images of endocardial cells per larva were considered for the analysis. Data are represented as mean ± SD. Each dot represents one lysosome. Statistical analysis was performed using Mann-Whitney-U test. Scale bars represent 5 or 1 μm as indicated in the upper panels.
(L) Accumulation of lysosomal contents seemed to be reduced in myocardial cells (CMs, yellow arrowheads, yet lysosomal contents in the blood plasma were still present in the rescue group (red arrowheads). Scale bar length is defined in the upper panel (control).
Endothelial-specific overexpression of the wild-type spns1 gene partially rescues cardiac valve development and function. Above all, rescued atrioventricular (AVC) valves are able to properly open and close, and thus support unidirectional blood flow. (OFT: outflow tract), related to Figure 5
Expression of lysosome related genes and notch1b-signalling is affected in nrs-mutants
To understand how transcriptomic programs were affected by lysosomal dysfunction in nrs hearts, we performed a comparative analysis between sibling and mutant hearts at 3 dpf using single-nuclei RNAseq (snRNAseq). We identified 18 different cell populations including 3 myocardial and 5 endocardial subclusters (Figures 6A, S6A–C, and Table S1). To identify the valve cells (EnVCs) among the endocardial subclusters, we compared the expression of annotated genes involved in valve development or genes previously proposed as valve cell markers38,39,40,41,42,43,44,45,46,47 (Table S2), namely notch1b, nrg1, rspo2, alcama, cdh5 and has2 (EnVCs, Figure S6B). Similarly, based on the expression of atrioventricular cell markers (bmpr2b, col1a1a, robo1, hapln1b, notch1b, ednraa, col1a2, fn1a), we identified one myocardial subcluster as atrioventricular cardiomyocytes (CMs AVC, Figure S6C). When comparing the cell populations between siblings and mutants, we observed that, in contrast to other cell types, the proportion of myocardial and endocardial cells was reduced in the subclusters that had highest valve development-related gene expression (CMs AVC, EnCs 3, EnCs 4 and EnVCs), as well as neurons (Figure 6B), suggesting higher susceptibility to spns1 impairment in these populations.
Figure 6.

Expression of lysosome related genes and notch1b-signalling is affected in nrs-mutants
Results obtained from a snRNA transcriptome analysis of sibling and nrs mutant hearts at 3 dpf.
(A) UMAP showing the various identified cell types from the snRNA-seq performed for mutant and sibling hearts at 3 dpf.
(B) The proportion of different cell types observed in sibling versus mutant suggest that lysosomal impairment above all affects the representation of atrioventricular cardiomyocytes (CMs AVC), three endocardial populations (EnCs 3, EnCs 4) among them endocardial valve cells (EnVCs) and neurons in the larval heart.
(C) Sankey diagram illustrates the cell-specificity of overrepresented lysosomal and membrane related gene pathways found in nrs mutants compared to siblings highlighting the relevance of lysosomal degradation in EnVCs. The width of the arrows is proportional to the number of differentially expressed genes in each cell cluster contributing to the pathway.
(D and E) Gene set Enrichment Analysis using the differentially expressed genes between siblings versus mutants in EnVCs (D) and atrioventricular CMs (E), where ‘activated’ and ‘suppressed’ represent the pathways that are activated or suppressed in the mutant condition. The results obtained suggest an upregulated transcriptional response in mutant EnVCs and atrioventricular CMs to compensate impaired lysosomal function.
(F) Ligand-receptor analysis from LIANA depicting the ligands from the source cells (top) to target cells (bottom) with ligand and receiving receptor shown on the y axis in the sibling and the mutant conditions. The ligand-receptor interactions affecting notch1b- and alcama-signaling are highlighted for the nrs mutant (red square = missing interaction, blue square = differing interaction).
To gain a deeper understanding of the pathways affected in the mutant heart, we performed a gene set enrichment analysis (GSEA) on the differentially expressed genes of each cell type (Figure 6C–E and Table S4). GSEA uses a ranked list of differentially expressed genes to calculate an enrichment score for each pathway.48 We used GSEA with the Gene Ontology (GO) cellular component gene set. We found that particularly in valve endocardial cells and atrioventricular cardiomyocytes, endosomal and lysosomal pathways were activated in mutants compared to siblings (Figure 6C). This suggests a coupling mechanism for the lack of functional lysosomes and relates to the increased number of autophagic vesicles found in the mutant atrioventricular canal (Figure 3D–F). In this regard, transcriptional responses to activate autophagy and lysosomal biogenesis have been described both upon lysosomal damage49 and in the context of epithelial development.50
We also performed over-representation analysis on the differentially expressed genes using gene ontology cellular components (Figure S7A and Table S5). This analysis identifies pathways, which have an overrepresented number of differentially expressed genes.51 We found an enrichment of genes related to the vacuolar proton-transporting V-type ATPase complex in the mutant EnVCs (Figure S7A and Table S5). This is consistent with the described balanced interaction between Spns1 and the lysosomal V−type ATPase,26 which maintains lysosome pH gradients by pumping protons into the lysosomal lumen in an ATP-dependent manner. Also, genes related to transmembrane transporter activity were overrepresented in EnVCs (Figure S7A), and several membrane-related pathways were significantly activated in both EnVCs and atrioventricular CMs (Figure 6D–E). These results suggest a role for spns1 in membrane organization and go in line with its previously described function as transmembrane phospholipid-transporter.22,23 Interestingly, no enrichment or overrepresentation was found in proliferation, apoptosis or senescence-related signaling pathways when comparing the mutant and sibling transcriptomes, suggesting that the observed phenotype is not due to a general cardiac development impairment, but rather the result of specific alterations in morphogenesis.
During heart development in general, and valve formation in particular, a tight signaling interaction between myocardium and endocardium is required.52,53 To identify the intercellular signaling responsible for the observed changes, we performed a ligand-receptor analysis using the LIANA (LIgand-receptor ANalysis frAmework) pipeline54 on both sibling and nrs mutant hearts (Figure 6F and Table S6). LIANA compiles the ligand-receptor interaction analysis from various sources and provides an aggregate rank for each potential interaction.54 We found that among the ten top-ranking ligand-receptor interactions between cardiomyocytes and endocardial cells, four affected notch1b-signalling. Specifically, contactin 1a (cntn1a)-, ybx1-, jag2-and adam10-notch1b interactions were altered in mutant versus sibling cardiac cells in cell populations near the AV region (CM AVC, EnVCs).
A deeper analysis revealed that the cause of the altered notch1b interactome was a reduction in the proportion of notch1b-expressing endocardial cells as well as atrioventricular cardiomyocytes (Figure S7B). These cells also showed a reduction in net notch1b expression and in the cell number and expression levels for the notch ligand jag2b, as well as altered expression of the Notch1-activating enzyme adam10 in some endocardial subclusters (Figure S7B). We also found that alcama-dependent interactions involving cardiomyocytes and endocardial cells were affected in the mutant (Figure 6F), which can be explained in part by the reduced ALCAM expression observed in the mutant AV endocardial cells (Figure 4B).
Endocardial specific upregulation of notch1 signalling rescues heart development and function
Given the importance of notch1b-signaling to valve formation,52,55 and to validate our transcriptomics results, we decided to investigate Notch1 activity in nrs mutant vs. siblings. Lineage tracing analysis using the Notch1 activity fate mapping line Tg(tp1:CreERT2);(ubi:Switch) revealed a lower number of tp1-derived+ cells in mutant hearts, confirming reduced notch1 signaling (Figure 7A–B). Indeed, the reduction in tp1-derived cells was even more severe in the AVC and OFT valve regions (Figure 7C). To functionally evaluate if the mutant phenotype was driven by notch1 signaling, we decided to overexpress the constitutively active intracellular domain of Notch1 specifically in endocardial cells using a Gal4/UAS-mediated strategy and the transgenic line Tg(UAS:myc-Notch1a-intra).56 We obtained single and double transgenic mutant larvae through the crossing of heterozygous single transgenic parents (Figure 7D) and compared the larval heart morphology at 4 dpf. Our results showed that expression of the active Notch1 receptor57 in the endocardium led to a significant increase in the ventricle area (Figure 7E). Moreover, the overexpression of notch1 reinstated to some extent the morphological and functional characteristics of the atrioventricular canal (Figure 7F–H and Video S10), which resulted in a higher percentage of mutant larvae with normal blood flow (Figure 7I). Our results hence show that expression of notch1 in the endocardium could partially rescue the cardiac nrs phenotype.
Figure 7.

Endothelial specific overexpression of notch1 rescues heart development and function
(A) Lineage tracing analysis using the tamoxifen (4-OHT) inducible notch1-activity fate mapping line Tg(tp1:CreERT2) revealed a lower number of tp1+-derived cells in the mutant heart, confirming reduced notch1 signaling. Stack projections of whole mount immunostained hearts imaged by confocal microscopy are shown. Scale bars represent 25 μm.
(B and C) Quantification of tp1-mCherry positive cells in the ventricle (B) and AVC/OFT valve regions (C) of siblings vs. nrs mutants. Data are represented as mean ± SD. Each dot represents one larva. Statistical analysis was performed using Mann-Whitney-U test.
(D) Endothelial-cell specific overexpression of a constitutively active form of the Notch1 receptor in nrs larvae was achieved by outcrossing heterozygous single transgenic parents (spns1+/−, Tg(fli1a:Gal4) and spns1+/−, Tg(UAS:notch1-intra)). Rescue of the cardiac phenotypes observed in the mutant hearts was evaluated between control (nrs, Tg(UAS:notch1-intra)) and rescue (nrs, Tg(fli1a:Gal4; UAS:notch1-intra)) conditions.
(E) Whole-mount immunostaining of control and rescued nrs hearts showed that notch1 overexpression significantly increased the ventricle size of the mutants (MHC: Myosin heavy chain). Each dot represents one larva. Data are represented as mean ± SD. Statistical analysis was performed using Welch’s t-test. Scale bars represent 25 μm.
(F–H) Cardiac and valve function was evaluated in BODIPY FL C5 -stained larvae using light-sheet microscopy. Scale bars represent 10 μm. Qualitative parameters were considered to evaluate OFT- (G) and AV-valve (H) elongation and function (0: no valve cells; 1: valve cushions, 2: delaminated valve cells, 3: elongated clapping valves). Each dot represents one valve. Chi-square test was applied to analyze differences between experimental groups.
(I) Percentage of larvae presenting normal, low, retrograde or no blood flow.
Endothelial-specific overexpression of a constitutively active version of the Notch1 receptor promotes the delamination and elongation of the mutant atrioventricular (AVC) cardiac valves, and to a lesser degree the bulboventricular (OFT) valves. This supports the closure of the valves and prevents retrograde flow, related to Figure 7
Discussion
Despite the clinical relevance of the pathophysiological connection between cellular homeostatic processes and congenital cardiac diseases, the role of autophagy-lysosomal degradation during cardiac development is understudied, partly due to limited options to visualize these dynamic processes in vivo and during the formation of specific cardiac structures, such as the heart valves. Furthermore, assessment of autophagic activity in the zebrafish previously relied on the use of ectopic lc3b expression under the control of tissue-specific or semi-ubiquitous promoters,6,17,35,58 which fails to recapitulate endogenous expression and expression in cell types that do not activate the used promoter.
In this work, we provide a detailed characterization of autophagosome, autolysosome and lysosome accumulation during heart and valve development. The TgKI(mRFP-Lc3) knock-in line established here allows to assess spatiotemporal autophagosome/autolysosome patterning at the subcellular level in zebrafish organ development, homeostasis and regeneration. In addition to confirming a sustained increase in autophagosome/autolysosome numbers in the myocardium between 48 and 96 hpf,58 we observed a marked accumulation of autophagosomes/autolysosomes in the bulboventricular and atrioventricular endocardium at the developmental stage of cardiac valve formation. Furthermore, we uncovered a significant accumulation of LysoTracker+ acidic vesicles in endocardial cells of the OFT and AVC, and the corresponding valves, as well as lamp2+-lysosomes in the AVC endocardium and myocardium during valve delamination and elongation (72–96 hpf). The use of in vivo imaging in this work allowed the acquisition of real-time information on the dynamics of autophagy vesicle accumulation in the developing valves and assess the cell type specificity of this process. Indeed, we used different transgenic lines with cmv, β-actin and lc3b regulatory regions to rule out that differences in cell type specific promoter activity led to differences in organelle detection.
Cardiac valve development is largely mediated by the transduction of mechanical forces, such as hemodynamic shear stress and reversing flow, to which endocardial cells in the AVC and OFT are exposed once the heart starts contracting.59,60 Interestingly, both oscillatory shear stress and disturbed flow induce autophagy in atherosclerotic lesions61 in a cytoprotective process that was previously described to implicate a lysosome associated protein.62 In line with this, our results indicate that localized activation of autophagic processes supports the formation of the cardiac valves. It is important to point out that 1-phenyl-2-thiourea (PTU), treatment performed in our experiments to inhibit pigment formation and improve the transparency of the embryos, has been shown to alter autophagic flux,63 and thus could influence the outcome of the results provided herein. Due to the scattering induced by pericardial pigments, there is no alternative that allows imaging of beating zebrafish larval hearts using light-sheet imaging, since according to the same study, even mutant lines such as casper zebrafish show altered autophagic flux. Therefore, to address the local and stage-dependent accumulation of autophagic vesicle accumulation, we have normalized or compared all quantifications to the signal obtained in ventricle. By doing this, we consider the potential bias of PTU to be neutralized.
The nrs mutant model allowed us to investigate how impaired lysosomal function affects valve formation and function. The smaller and rounder ventricles described here for the nrs-mutant have also been observed upon lamp2 loss of function64 and in a zebrafish knock-down for iduronate-2-sulfatase resembling mucopolysaccharidosis type II.65 Moreover, we found a severe impairment of both OFT and AVC valve development in nrs hearts, which affected the delamination and elongation of valves, and consequently their proper function. This correlated with the accumulation of autolysosomal contents observed in these cardiac regions in nrs mutants. Abnormal valve phenotypes have been associated with inherited lysosomal storage diseases, which are caused by genetic defects in lysosomal enzymes, leading to a progressive lysosomal accumulation of substrates.8,9 The similarity of the phenotypes observed in nrs larvae and other human lysosomal disease zebrafish models,65,66 suggests that mutations in the spns1 gene could lead to a similar pathology in humans. Importantly, our endocardial-specific rescue of the nrs valve phenotype shows that spns1-dependent lysosomal function is required cell-autonomously in the endocardium for proper valve formation. The observation that the heartbeat was affected in nrs mutants, suggests a further role for spns1 during pacemaker formation.
Endocardial cell volume decrease is required during zebrafish cardiac valve formation,32 and indeed, our transcriptome analysis of the mutant heart revealed significant deviations in plasma membrane components. We thus propose that autophagic-degradation participates in the reorganization of cellular contents and plasma membrane remodeling during cardiac valve development. Two studies have recently identified Spns1 as a proton-dependent lysophosphatidylcholine transporter that is required for membrane phospholipid salvage and recycling.22,23 These studies have shown that, similar to what we observed in nrs mutants, Spns1 deficiency in knockdown murine and zebrafish models leads to the lysosomal accumulation of lipid molecules and consequently to overall lysosomal dysfunction due to luminal alkalization.22,23 Altogether, these studies and the results presented in this work indicate a role for lysosomes in phospholipid metabolism and plasma membrane remodeling, directly affecting cardiac valve development.
Previous works have shown the importance of Notch1b-signalling in early endocardial tissue patterning in the nascent valve cushions, as well as proliferation and remodeling during the later stages of valve development.55 The ligand-receptor analysis and the experimental validations we performed indicate that lysosomal impairment affects notch1b-mediated communication within cardiomyocytes and endocardial cells, whereas endocardial-specific notch1 overexpression rescues ventricle size and atrioventricular valve elongation in nrs mutants. Studies on stem cell expansion have described autophagy to modulate Notch signaling by regulating Notch1 degradation,67 whereas in neural stem cell asymmetrical divisions, differences in Notch signal activity depend on lysosome inheritance and the acidifying endolysosomal environment that allows the activating proteolytic cleavage of Notch1.68 Consistent with this, we found that impaired autophagosome processing and lysosome acidification in nrs affects notch1-signalling. Our results hence support previous findings showing that disruption of lysosomal function impairs Notch1-signaling21,50 and provides functional support for Notch1 as a central signaling pathway being affected by aberrant endocardial lysosomal function during valve formation.
Finally, our results reveal that endocardial cell organization is severely affected in nrs mutants. Autophagy and lysosomal processes are known to contribute to cell organization in other tissues69,70,71 and to be tightly interlinked with ECM deposition and remodeling.72,73,74 For example, in the vasculature, where flow-induced endothelial cell alignment is disturbed by alterations in autophagy,70 or in the cartilage, where autophagy impairments disorganize differentiating chondrocytes and their surrounding ECM.71 Indeed, lysosomal impairment in nrs mutants directly affected alcama-signaling, a cell-adhesion molecule for which several functional roles related to cell clustering, proliferation and migration in developing tissues have been described.75,76 On the other hand, a subset of endocardial cells undergoes endoMT to form interstitial valve cells during valve formation.34 Given that in nrs mutants valve morphology is altered, it is possible that part of the endoMT process is affected. Indeed, the role of the autophagy-lysosomal pathway in the regulation of epithelial-mesenchymal transition and cell migration has been vastly studied in the field of cancer.77 Lastly, Spns1 was previously shown to interact with p53 and Beclin 1.25 It will be of interest to explore the role of this interaction in the context of valvulogenesis and its link to developmental senescence. Since proper valve function greatly depends on correct valve morphogenesis and structural integrity, which in turn is linked to valve pathologies,78 it is clinically relevant to understand how autophagy-lysosomal turnover influences this process.
Limitations of the study
While the standard methodology to address autophagy activation is to quantify the number of autophagosomes and lysosomes in fixed samples, in this study we aimed to go a step further and provide quantitative data on autophagosomes and lysosomes in the beating larval heart using in vivo light-sheet microscopy. As a drawback, image resolution was limited by the available microscopy set-up, the signal intensity of the transgenic reporters, and the location of the tissue of interest. The experimental protocol required treatment with the lysosome acidification drug chloroquine to detect discrete fluorescent puncta. This affected the assessment of autophagic flux and the use of pH sensors to evaluate lysosome acidification. Given that our LC3-KI line does not contain a GFP cassette, we cannot distinguish between autophagosomes and autolysosomes. However, the fact that the number of mRFP-GFP+ puncta was considerably lower and signal-colocalization was minimal when using the ubiquitous transgenic reporter visualized on fixed samples, provides confidence that the majority of the observed signal derived from autolysosome vesicles. A drawback of deep tissue imaging is that a lower signal-to-noise ratio limits the segmentation of individual autophagosomes, autolysosomes and lysosomes at the subcellular level. Puncta spaced smaller than the Rayleigh criterion cannot be resolved as separate entities. Therefore, an apparent enlargement of segmented instances in image analysis may indicate an increased density of puncta rather than enlarged individual structures.
The nrs mutant phenotype posed a particular challenge for imaging due to an altered heart morphology and pericardial fluid composition, which impeded the in vivo study of endoMT processes. To further understand the function of these organelles during valve formation, it will be of great interest to study their formation, subcellular distribution, and functional dynamics in tissue specific spns1 mutants.25,26 Finally, while our work proposes a link between lysosomal function and notch1-signalling, complementary in vitro models would get additional mechanistic insight into notch1-activation and the effect on downstream target genes.
Resource availability
Lead contact
Further information and requests for resources and reagents should be directed to and will be fulfilled by the lead contact, N.M. (nadia.mercader@unibe.ch).
Materials availability
The information on the zebrafish lines generated in this study has been deposited to Zebrafish international network (ZFIN) with codes ZDB-ALT-230926-15 and ZDB-ALT-230926-16 and will be shared upon request.
Data and code availability
The snRNAseq raw data are deposited on GEO under GSE (GEO: GSE246850). The analyzed data are made available under a shiny app (https://mybinder.org/v2/gh/MercaderLabAnatomy/PUB_Chavez_et_al_2023_shiny_binder/main?urlpath=shiny/bus-dashboard/) made using ShinyCell with additional modifications.79 The code for analyses, image processing scripts and quantification pipelines are available at https://github.com/MercaderLabAnatomy/PUB_Chavez_et_al_2023 and https://github.com/MercaderLabAnatomy/T-MIDAS. Experimental raw data have been deposited on Zenodo (Zenodo: https://doi.org/10.5281/zenodo.13982794). Other information required to reanalyze the data reported in this paper can be requested to the lead contact.
Acknowledgments
We thank M. Affolter and M. Bagnat for providing the TgBAC (lamp2:RFP)pd1044 zebrafish line and Julien Vermot, José Luis de la Pompa and Patricia Boya for comments on the manuscript. Electron microscopy sample preparation and imaging were performed with devices provided by the Microscopy Imaging Center (MIC) of the University of Bern. Special thanks to B. Haenni for his support with sample processing. We thank Xavier Langa, Anna Gliwa and Ahmet Kürk for their assistance in zebrafish husbandry. Many thanks to Ayisha Marwa MP and Nick Kirschke for their support during sample collection. Illustrations and schemes were created with BioRender.com and with the support of S. Chávez Rosas.
Funding sources
This work was supported by grants 310030L_182575 from the Swiss National Science Foundation and H2020-SC1-2019-Single-Stage-RTD REANIMA-874764 to N.M., SELF2020-23 from University of Bern, Swiss Life research grant 2021 and ESC Basic Research Fellowship 2022 to M.N.C.
Author contributions
M.N.C. designed and performed the experiments, analyzed and interpreted results, wrote the manuscript, secured funding; P.A. performed snRNA-seq bioinformatics analysis and generated related figures, gave statistics advice, contributed to data interpretation and writing the manuscript; M.M. performed image segmentation, and established pipelines for the quantification of autophagosomes and lysosomes from in vivo acquisitions, contributed to writing the manuscript; I.J.M. performed immunostainings and further experiments for revision of the article and contributed to writing the revised manuscript; A.E. contributed to optimization of imaging set-ups, heart function analysis and image processing pipelines; R.A.M. designed and generated the construct to establish the Tg(UAS:spns1) transgenic line and contributed to writing the manuscript; N.M. supervised the research, designed experiments, interpreted results, wrote the manuscript, secured funding.
Declaration of interests
The authors declare that they have no conflict of interest.
STAR★Methods
Key resources table
| REAGENT or RESOURCE | SOURCE | IDENTIFIER |
|---|---|---|
| Antibodies | ||
| anti-alcam | DSHB | Cat# ZN-8 |
| anti-Chicken IgY (H+L) - Alexa Fluor® 488 | Invitrogen | Cat# A-11039; RRID: AB_2534096 |
| anti-GFP | Aves | Cat# GFP-1010; RRID: AB_2307313 |
| anti-mCherry | Novus Biologiclas | Cat# NBP2-25157; RRID: AB_2753204 |
| anti-MHC | DSHB | Cat# MF20 |
| anti-mouse IgG1 - Alexa Fluor® 488 | Invitrogen | Cat# A-21121; RRID: AB_2535764 |
| anti-mouse IgG2b - Alexa Fluor® 568 | Invitrogen | Cat# A-21144; RRID: AB_2535780 |
| anti-rabbit (H+L) Superclonal™ - Alexa Fluor® 647 | Invitrogen | Cat# A-27040; RRID: AB_2536101 |
| Bacterial and virus strains | ||
| DH5-alpha competent E.coli | New England Biolabs | Cat# C2987I |
| Chemicals, peptides, and recombinant proteins | ||
| 1-phenyl-2-thiourea (PTU) | Sigma-Aldrich | Cat# P7629-10 |
| 16% Paraformaldehyde aqueous solution | Electron Microscopy Sciences | Cat# 15710 |
| 2,3-Butanedione monoxime | Sigma-Aldrich | Cat# B0753 |
| 4-hydroxytamoxifen | Sigma-Aldrich | Cat# H7904 |
| 4’,6-Diamidino-2-phenylindole (DAPI) | Sigma-Aldrich | Cat# D9542 |
| Acetone | Sigma-Aldrich | Cat# 320110 |
| BODIPY™ FL C5-Ceramide | Invitrogen | Cat# D3521 |
| BSA | Sigma-Aldrich | Cat# A7906 |
| Chloroquine diphosphate salt | Sigma-Aldrich | Cat# C6628 |
| Chromium Nuclei Isolation Kit with RNase Inhibitor | 10x Genomics | Cat# PN-1000494 |
| CRISPR-Cas9 tracrRNA | IDT | Cat# 1072534 |
| Dimethyl sulfoxide | Sigma-Aldrich | Cat# D4540 |
| DNA Clean & Concentrator | Zymo Research | Cat# D4014 |
| Epon | Sigma-Aldrich | Cat# 45359 |
| Ethanol | Grogg Chemie | Cat# G003 |
| Fast Digerst HindIII | Thermofisher Scientific | Cat# FD0504 |
| Fast Digest BamHI | Thermofisher Scientific | Cat# FD0054 |
| Fast Digest ScaI | Thermofisher Scientific | Cat# FD0434 |
| foetal bovine serum | Sigma-Aldrich | Cat# F7524 |
| Fragment Analyzer NGS Fragment Kit | Agilent | Cat# DNF-473 |
| Gateway LR Clonase II Enzyme mix | Invitrogen | Cat# 11791020 |
| Glutaraldehyde | Agar Scientific | Cat# AGR1009 |
| Goat serum | Dominique Dutscher | Cat# S2000 |
| HiFi Cas9 Nuclease V3 | IDT | Cat# 1081060 |
| illumina NovaSeq 6000 S1 Reagent Kit v1.5 | Illumina | Cat# 20028319 |
| iScript Reverse Transcription SuperMix | Bio-Rad | Cat# 1708841 |
| KCl | Sigma-Aldrich | Cat# P9333 |
| Leibovitz's L-15 Medium | Thermo Fisher Scientific | Cat# 11415064 |
| LysoTracker™ Deep Red | Invitrogen | Cat# L12492 |
| Maxima First Strand cDNA synthesis kit | Thermo Fisher Scientific | Cat# K1671 |
| OsO4 | Electron Microscopy Sciences | Cat# 19100 |
| pENTR/D-TOPO vector | Invitrogen | Cat# K240020 |
| Phosphate buffered saline | NZYtech | Cat# MB18201 |
| PowerUp SYBR Green Master Mix | Thermo Fisher Scientific | Cat# A25742 |
| Prep User Guide | 10X Genomics | Cat# CG000505 |
| Proteinase K | Roche | Cat# 03 115 801 001 |
| Q5® High-Fidelity DNA Polymerase | New England Biolabs | Cat# M0491 |
| Qubit dsDNA HS Assay Kit | Thermo Fisher Scientific | Cat# Q32851 |
| Sodium cacodylate trihydrate | Sigma-Aldrich | Cat# C0250 |
| T7 Endonuclease I | New England Biolabs | Cat# M0302 |
| Triton X-100 | Sigma-Aldrich | Cat# T9284 |
| TRIzol Reagent | Invitrogen | Cat# 10296010 |
| Deposited data | ||
| snRNASeq Data | NCBI GEO | GEO: GSE246850 |
| Raw data | Zenodo | Zenodo: https://doi.org/10.5281/zenodo.13982794 |
| Experimental models: Transgenic zebrafish models used in the study | ||
| Tg(actb2:mRFP-GFP-map1lc3b)udc2Tg | Allende lab | ZDB-ALT-210122-18 |
| TgKI(mRFP-map1lc3b)brn7 | This study, Mercader lab | ZDB-ALT-230926-15 |
| Tg(CMV:EGFP-map1lc3b)zf155 | Kishi lab | ZDB-ALT-091029-2 |
| TgBAC(lamp2:RFP)pd1117 | Affolter lab | ZDB-ALT-150520-1 |
| Tg(fli1a:GFP)y1 | ZIRC | ZDB-ALT-011017-8 |
| Tg(fli1a:DsRedex)um13 | Lawson lab | ZDB-ALT-100525-3 |
| Tg(kdrl:GFP)la116 | Stainier lab | ZDB-ALT-070529-1 |
| Tg(fli1a:Gal4FF)ubs3 | Affolter Lab | ZDB-ALT-120113-6 |
| Tg(kdrl:EGFP-CAAX)ubs47 | Affolter lab100 | |
| Tg(myl7:GFP)f1 | Djonov lab | ZDB-ALT-060719-2 |
| Tg(myl7:mCherry)ko08 | Kawahara lab | ZDB-ALT-090423-3 |
| Tg(EPV.Tp1-Mmu.Hbb:CreERT2,cryaa:mCherry)s959 | Singh lab | ZDB-ALT-131001-3 |
| Tg(–3.5ubi:loxP-EGFP-loxP-mCherry)cy1701 | Zon lab | ZDB-ALT-110124-1 |
| nrs (spns1hi891Tg/hi891Tg) | Kishi lab | ZDB-FISH-150901-8505 |
| Tg(UAS:spns1)brn8 | This study, Mercader lab | ZDB-ALT-230926-16 |
| Tg(UAS:myc-Notch1-intra)kca3Tg | ZIRC | ZDB-ALT-020918-8 |
| Oligonucleotides | ||
| See Table S7. | ||
| Plasmids | ||
| pKHR4 | Addgene | Cat# 74592; RRID: Addgene_74592 |
| pDestTol2pA2CrymCherry | Addgene | Cat# 64023; RRID: Addgene_64023 |
| Software and algorithms | ||
| Code and analyses | This study | https://github.com/MercaderLabAnatomy/PUB_Chavez_et_al_2023 |
| Fiji | https://fiji.sc/ | https://doi.org/10.1038/nmeth.2019 |
| Matlab | https://ch.mathworks.com/products/matlab.html | R2024a Update 3 |
| Napari | https://napari.org | https://doi.org/10.5281/zenodo.3555620 |
| R v4.0 | https://www.r-project.org/ | R version 4.0.0 |
| Seurat v4.0 | CRAN v4.0 | https://doi.org/10.1016/j.cell.2021.04.048 |
| T-MIDAS | https://github.com/MercaderLabAnatomy/T-MIDAS | https://doi.org/10.5281/zenodo.10728503 |
Experimental model and study participant details
Zebrafish husbandry
Experiments were conducted with zebrafish (Danio rerio) embryos and larvae between 30- and 96 hpf. Sex differences were not addressed as zebrafish sex determination does not depend on heteromorphic sex chromosomes and does not occur until the juvenile stages (22 dpf). Eggs were obtained by natural spawning using slope breeding tanks from adult zebrafish aged 4–18 months. Larvae were grown at 28°C in E3 medium containing 1-phenyl-2-thiourea (0.003%, PTU, Sigma-Aldrich, P7629-10) to avoid pigmentation. Adult zebrafish were maintained at a maximal fish density of 5 per Liter and under the following environmental conditions: 27.5°C–28°C, 650–700 μs/cm, pH 7.5 and daily 10% water exchange. All experimental protocols were approved by the cantonal authorities in Bern (Amt für Landwirtschaft und Natur; National license number 35 and license for the generation of genetically modified animals number G BE8/19) and performed at the Institute of Anatomy. An overview of all transgenic lines used in this study with information about their origin can be found in the key resources table. Transgenic zebrafish embryos and larvae were selected under a fluorescent stereoscope (Nikon, SMZ800N). Mutant nrs larvae were identified by their described opaque yolk phenotype26 under a brightfield stereoscope. Genotyping was performed to confirm the mutant genotype in larvae, to select heterozygous nrs adult zebrafish and to identify Gal4+-transgenic zebrafish. The respective primer sequences can be found in the key resources table.
Method details
Generation of new transgenic lines
The endogenous autophagosome reporter line TgKI(mRFP-lc3) was generated following a previously described strategy for Cas9 protein-mediated oligonucleotide insertion.80 Briefly, gRNA candidates were designed based on a previously sequenced 432 bp region covering the first exon and intron of map1lc3b using crispor.tefor.net and https://eu.idtdna.com/site/order/designtool/index/CRISPR_CUSTOM). For gRNA selection, cutting efficiency was determined by T7-endonuclease assay (T7 Endonuclease I, New England Biolabs, M0302) according to the manufacturer’s protocol. Sequences for two ∼1 kb homology arms flanking the CRISPR targeting site were obtained by PCR (Q5 High-Fidelity DNA Polymerase, New England Biolabs, M0491) from parental zebrafish (AB strain) genomic DNA according to the manufacturer’s protocol. Three mutations were introduced to avoid CRISPR/Cas targeting through PCR and site-directed mutagenesis. The coding sequence of the fluorescent protein mRFP was obtained by PCR using the plasmid pTol2- β actin2:mRFP-GFP-Lc335 as template. It was then modified to contain a short linker protein sequence (IDELNS) based on a similar construct,81 to guarantee proper protein folding. Fragments were assembled into plasmid pKHR482 (Addgene, 74592, Grunwald lab) by Gibson cloning to obtain the final repair template. To establish the knock-in line, fragment containing the repair template was obtained by enzymatic digestion with BamHI, HindIII and ScaI (FastDigest Restriction Enzymes, Thermofisher Scientific, FD0054, FD0504, FD0434), purified (DNA Clean & Concentrator, Zymo Research) and injected (25 ng/μL) along with Cas9 protein (0.3 mg/mL), gRNA (5.6 μM crRNA and tracerRNA, synthesized by IDT Integrated DNA Technologies) and 0.2 μM KCl (Sigma, P9333-500G) into one-cell stage embryos. The respective primers and gRNA sequences are listed in the key resources table. Correct in-frame insertion of the mRFP-sequence into the zebrafish genome and expression of the endogenous fluorescently labeled Lc3 protein was confirmed by sequencing of gDNA and cDNA in F1-larvae, respectively. A schematic illustration of the repair template and the sequence alignment of the integrated transgene can be found in Figures S1B and S1D. The line has been deposited at ZFIN under the name TgKI(mRFP-map1lc3b)brn7. The construct pTol2-cry:mCherry-UAS:spns1 used for the tissue-specific overexpression of the wild-type spns1 gene was generated by Gateway-mediated cloning. Briefly, total RNA was extracted from wild type zebrafish larvae (AB strain) through TRIzol RNA-extraction (Invitrogen, 10296010) and cDNA synthesis was performed using iScript Reverse Transcription SuperMix (Bio-Rad, 1708841). The coding sequence of the zebrafish Spinster 1 (spns1) gene was amplified from cDNA by Phusion PCR using specific primers (Table S7) and subsequently cloned into the pENTR/D-TOPO vector (Invitrogen, K240020) to generate the pME-spns1 vector. The cloned sequence was verified by Sanger sequencing (Eurofins genomics). Multisite Gateway LR recombination was performed using the Gateway LR Clonase II Enzyme mix (Invitrogen, 11791020) to recombine the generated pME-spns1 plasmid, the Tol2Kit plasmids #327 (p5E-UAS) and #302 (p3E-polyA)83 and the destination vector pDestTol2pA2CrymCherry (Addgene, 64023; provided by Joachim Berger & Peter Currie84) to assemble the final pTol2-cry:mCherry-UAS:spns1 vector. The transgenic line Tg(UAS:spns1, cry:mCherry) was generated through Tol2-mediated recombination85 by injecting one-cell stage embryos with the plasmid (25 ng/μL), 40 ng/mL Tol2 mRNA and 0.2 μM KCl (Sigma, P9333-500G). Overexpression of the wild-type spns1 gene was confirmed by RT-qPCR analysis using PowerUp SYBR Green Master Mix (Thermo Fisher Scientific). We obtained RNA from pools of 7–15 single (Tg(UAS:spns1)) and double transgenic (Tg(fli1a:Gal4; UAS:spns1)) nrs mutant larvae at 4 dpf, and generated cDNA using Maxima First Strand cDNA synthesis kit (Thermo Fisher Scientific). The respective primer sequences for spns1 and rps11 (ribosomal protein S11), which was used as housekeeping gene, can be found under key resources. The line has been deposited at ZFIN under the name Tg(UAS:spns1, cry:mCherry)brn8.
Administration of 4-hydroxytamoxifen
4-hydroxytamoxifen (4-OHT; Sigma, H7904) stock solution was prepared in ethanol at 10 mM. To facilitate the dissolution of the powder, the stock was heated for 10 min at 65°C and then stored at −20°C, protected from the light. Embryos were incubated in E3 with 10 μM 4-OHT between 30 and 72 h postfertilization.
gRNA synthesis and generation of spns1 crispants
Two guide RNA (gRNA) were designed using CRISPRscan86 based on their predicted efficiency to target in spns1, proximal location to its first exon, and low predicted off-target effects (key resources table). crRNA and tracerRNA were synthesized by IDT Integrated DNA Technologies, mixed in 1:1 ratio in Nuclease-Free Duplex Buffer and heated at 95°C for 5 min to prepare the gRNA duplex solution. To generate spns1 crispants, one-cell stage embryos obtained from crosses of heterozygous nrs mutant and wild type zebrafish were microinjected with a solution containing both gRNAs (4.5 μM each), Cas9 protein (0.3 mg/mL)and 0.2 μM KCl (Sigma, P9333-500G). An injection solution without Cas9 protein was used as control. Cutting efficiency was verified via T7 endonuclease assay, and crispants were selected based on the opaque yolk phenotype.
In vivo confocal microscopy
Embryos of the desired developmental stage were anesthetized with tricaine (0.08 mg/mL pH7). Prior to imaging heartbeat was arrested by incubating the embryos for 30 min in E3 with tricaine (0.08 mg/mL pH7) and 20 mM of 2,3-Butanedione monoxime (BDM). Embryos were then mounted in 0.8% low melting agarose, covered with the above-mentioned solution, and imaged with a Leica TCS SP8 confocal microscope, using a 20× water immersion objective.
In vivo light sheet fluorescence microscopy
Embryos were raised until the desired developmental stage. For autophagosome and lysosome quantification, larvae were treated with 2 mM chloroquine to stop autophagic flux (3 h for autophagosome/lysosome quantification during development, 12 h to compare autophagosome and lysosome accumulation in nrs mutants). To label acidic vesicles/lysosomes, zebrafish were incubated for 3 h in 1 μM LysoTracker Deep Red (Invitrogen, L12492) in E3 (DMSO). For the visualization of cardiac valves, larvae were incubated with 2 μM BODIPY FL C5-Ceramide (Thermo Fisher Scientific) in E3 (0.1% DMSO) overnight. Before imaging, larvae were washed 3 × 15 min with fresh E3 and anesthetized using tricaine (0.08 mg/mL pH7). Larvae were then embedded in 0.75% low-melt agarose with 0.04 mg/mL tricaine, transferred into a FEB-capillary and mounted inside a Leica-imaging chamber filled with E3-medium with tricaine. Imaging was performed with a Leica TCS SP8 digital light sheet (DLS) microscope equipped with a Hamamatsu Flash 4.0 V3 camera with 4.2 mpx using the following settings: 25× detection objective with NA 0.95×water immersion, 2.5× illumination objective, 5 mm illumination mirror. Images were obtained following XYTCZ acquisition mode with 1.14 ms exposure time to allow later retrospective gating.
Transmission electron microscopy
Zebrafish larvae were selected at 4 dpf, euthanized by tricaine-overdose and fixed with 2.5% glutaraldehyde (Agar Scientific, Stansted, Essex, UK) and 2% paraformaldehyde in 0.1 M Na-Cacodylate buffer (Merck, Darmstadt, Germany) with a pH of 7.44. Samples were fixed for at least 24 h before being further processed. Samples were then washed with 0.1 M Na-Cacodylate buffer three times for 5 min each, postfixed with 1% OsO4 (Electron Microscopy Sciences, Hatfield, USA) in 0.1 M Na-cacodylate buffer at 4°C for 2 h, and then washed in 0.1 M Na-Cacodylate buffer (Merck, Darmstadt, Germany) three times for 5 min each. Thereafter samples were dehydrated in 70%, 80%, and 96% ethanol (Grogg, Bern, Switzerland) for 15 min each at room temperature. Subsequently, samples were immersed in 100% ethanol (Merck, Darmstadt, Germany) three times for 10 min each, in acetone (Merck, Darmstadt, Germany) for two times for 10 min each, and finally in acetone-Epon (1:1) overnight at room temperature. The next day, samples were embedded in Epon (Sigma-Aldrich, Buchs, Switzerland) and left to harden at 60°C for 5 days. Sections were produced with an ultramicrotome UC6 (Leica Microsystems, Vienna, Austria). First, sequential semithin sections (1 μm) were obtained and stained with a solution of 0.5% toluidine blue O (Merck, Darmstadt, Germany) for light microscopy to select cardiac regions comprising the atrioventricular canal and outflow tract. Upon selection, ultrathin sections (75 nm) were produced for electron microscopy, mounted on single slot copper grids, and stained with uranyless (Electron Microscopy Sciences, Hatfield, USA) and lead citrate (Leica Microsystems, Vienna, Austria) with an ultrastainer (Leica Microsystems, Vienna, Austria). Sections were examined with a transmission electron microscope (FEI Tecnai Spirit, Thermo Fisher Scientific).
Immunofluorescence
For whole-mount immunofluorescence, zebrafish larvae were selected at the desired developmental stage, euthanized by an overdose of tricaine and fixed overnight at 4°C in 4% paraformaldehyde (PFA, EMS, 15710). Larvae were washed three times for 15 min each with PBS, dehydrated following a methanol gradient (25%. 50%, 75% methanol in PBS, 15 min each) and stored in 100% methanol for at least one day at −20°C. Larvae were re-hydrated (75%, 50%, 25% methanol in PBS-TritonX100 (0.3%), 10 min each) and washed twice with PBS-TritonX100 (0.3%) for 10 min. The permeabilization procedure consisted of treatment with Proteinase K (10 μg/mL) for 20 min, followed by 20 min post-fixation with 4% PFA and incubation in ice-cold Ethanol-Aceton 2:1 for 7 min, with three PBS-TritonX100 (0.3%) 10 min washes in between. Blocking of non-specific binding sites was performed by overnight incubation in blocking solution (5% BSA, 5% goat serum, 1% DMSO, 1% Triton X-100) at 4°C. To achieve a better antibody penetration, the pericardial cavity was punctured using a tungsten needle and the incubation with first and secondary antibodies was performed overnight at 4°C. Primary antibody dilutions were prepared in PBS containing 5% BSA, 5% Goat serum and 0.002% sodium azide as follows: anti-alcam (1:100, ZN-8, DSHB), anti-MHC (1:100, MF20, DSHB), anti-mCherry (1:300, NBP2-25157, Novus Biologicals), anti-GFP (1:300, GFP-1010, Aves), anti-BrdU (1:200, abcam, ab6326). Goat-derived secondary antibodies (all obtained from Invitrogen, Thermofisher Scientific) were used in 1:300 dilution in PBS containing 5% BSA, 5% Goat serum: anti-mouse IgG1 - Alexa Fluor 488 (A-21121), anti-mouse IgG2b - Alexa Fluor 568 (A-21131), anti-rabbit (H + L) Superclonal - Alexa Fluor 647 (A27040),anti-Chicken IgY (H + L) - Alexa Fluor 488 (A-11039), anti-rat IgG (H + L)- Alexa Fluor 647 (A21247).
Heart function analysis
Transgenic Tg(fli1a:GFP) sibling and mutant larvae were selected at 3 dpf, and transferred to a flat-bottomed 96-well plate containing pre-molded 1% agarose pockets used to retain larvae in a ventral position. Imaging was performed using an automated microscopy platform (Acquifer Imaging Machine, Acquifer Germany). In this two-step imaging process, brightfield overview images of whole larvae were obtained using a 2× objective, which were used for the automated detection of the head region, and later, the estimation of the larval body length. Then, series of brightfield and green fluorescence images of the head region focused on the heart are acquired using a 10× objective to obtain a time series of the beating heart. Images were processed into hyper-stacks using the Acquifer built-in Fiji-software, and analyzed using previously described31 in-house developed scripts to determine larval body length, heart rate (number of beats estimated during image acquisition), ejection fraction (calculated from the difference between diastolic and systolic volume relative to the diastolic size), cardiac output (difference between diastolic and systolic volume multiplied by heart rate) and rhythmicity (RMSSD, evaluated by the root-mean-square of the successive differences between heart beats, which reflects the beat-to-beat variance). All FIJI plug-ins and Python scripts (“Heartbeat”, “Cardiac function”, “RMSSD”, “Size”) are available at “https://github.com/MercaderLabAnatomy/PUB_Chavez_et_al_2023”.
Gene expression library construction and analysis
Sibling and mutant larval hearts were obtained at 3 dpf by manual dissection using forceps and a tungsten needle as previously described.87 Pools of approx. 50 hearts were collected within 1 h in ice-cold Leibovitz’s L-15 Medium (Thermo Fisher Scientific) supplemented with 10% fetal bovine serum (Sigma -Aldrich, F7524), centrifuged for 4 min at 300 g, snap frozen and preserved in liquid nitrogen. Two replicates, each consisting of four pools, were obtained for each experimental group (sibling, mutant). Single nuclei suspensions containing 3800–4000 nuclei/μL were prepared using the Chromium Nuclei Isolation Kit with RNase Inhibitor (10 x Genomics, PN-1000494) following the samples Prep User Guide (10 x Genomics, CG000505, Rev A). The Transposition, GEM generation & barcoding, reverse transcription, and preparation of the gene expression and ATAC libraries was performed according to the 4Chromium Next GEM Single Cell Multiome ATAC + Gene Expression User Guide (10x Genomics, CG000338 Rev F) with all stipulated 10x Genomics reagents. Nuclei suspensions were incubated in a Transposition Mix that includes a Transposase. At the end of the transposition step, GEM generation and barcoding was immediately performed, and a quenching reagent was added to each sample to stop the reaction. The reactions were then stored at −80°C. Samples were retrieved from storage, cleaned-up as stipulated in step 3.0 of the user guide. Thereafter, a pre-amplification steps was performed with 6 PCR cycles, followed by cDNA amplification and 3′ gene expression library workflow using 16 PCR cycles. Generated cDNA and both types of libraries were evaluated for quantity and quality using a Thermo Fisher Scientific Qubit 4.0 fluorometer with the Qubit dsDNA HS Assay Kit (Thermo Fisher Scientific, Q32851) and an Advanced Analytical Fragment Analyzer System using a Fragment Analyzer NGS Fragment Kit (Agilent, DNF-473), respectively. The cDNA libraries were pooled and sequenced with a loading concentration of 300 p.m., asymmetric paired-end and dual indexed, using an illumina NovaSeq 6000 S1 Reagent Kit v1.5 100 cycles (illumina, 20028319) on an illumina NovaSeq 6000. The read set-up was as follows: read 1: 29 cycles, i7 index: 10 cycles, i5: 10 cycles and read 2: 89–91 cycles. The quality of the sequencing runs was assessed using illumina Sequencing Analysis Viewer (illumina version 2.4.7) and all base call files were demultiplexed and converted into FASTQ files using illumina bcl2fastq conversion software v2.20. A minimum of 50′000 reads/cell were generated for each library. All steps were performed at the Next Generation Sequencing Platform, University of Bern. The raw sequencing data was processed using cellranger v6.0.88 For alignment, we used Danio rerio Genome assembly GRCz11 v109 from Ensembl.89 The counts were then processed in R (v4.0) using Seurat (v4.0) and tidyverse.90,91,92 Possible doublets were removed using SingleCellExperiment and scDblFinder.93,94 Cells with a minimum of 200 genes and less than 5000 genes per cells were chosen for quality purposes. The final number of cells used for further processing was as follows: sib_1: 1673 cells, sib_2: 2193 cells, mut_1: 1643 cells, mut_2: 1940 cells. All possible mitochondrial reads (due to possible contamination) were removed before downstream processing. The samples were integrated using the Seurat Feature Integration pipeline and checked for batch correction. For the identification of the various cell types, marker genes provided in several publications38,41,42,43,44,46,47 and databases in EnrichR were used.39,40,45 Differential expression analysis for each cell type was performed using pseudobulk, EdgeR-LRT with the Libra package.95 Differentially expressed genes were converted to mouse orthologous genes with biomaRt and then subjected to pathway enrichment using overrepresentation analyses and Gene Set Enrichment Analyses (GSEA) with the Gene Ontology terms with the help from ClusterProfiler package.51,96,97 To identify the ligand receptor interactions, we used LIANA that consolidates multiple ligand receptor databases and provides an aggregate rank.54 Graphs were plotted using Seurat, ggplot2, ggpattern, viridis and dittoSeq.91,98
Image processing
Light-sheet microscopy acquisitions were processed using an HP-Zseries workstation (Dual Intel Xeone5-2667 v4 3.2 GHz, 256 GB, NVIDIA GeForce GTX 1080 Ti). Images were first exported from the lif-file into XYTC-tif files using the in house created macro Export6D. Retrospective gating was performed as previously described using the MATLAB (R2017a) tool BeatSync V2.1 to re-synchronize the 3D imaged hearts (3D-t reconstruction).31 To enhance images for downstream segmentations, the denoise_cyto3 model from Cellpose 3 (https://cellpose.readthedocs.io/en/latest/restore.html#denoisemodel) was used. Maximum intensity projections of the 3D image-stacks were obtained using ImageJ,99 for which images were cropped to the heart area using the in house created ImageJ macro ClearOutside_3DnC. Image processing scripts are available at https://github.com/MercaderLabAnatomy/PUB_Chavez_et_al_2023.
Quantification and statistical analysis
Image quantification
For the quantitative analysis of autophagosomes and lysosomes, manual 3D contour tracing and selection of regions of interest (ROIs; V: ventricle, OFT: outflow tract, AVC: atrioventricular canal) were performed in a first step and independent curation of the semantic segmentations was performed in a second step (two-person control). Both semantic segmentation and curation of image z-stacks (dimensions: XYZC, where C represents the color channel of the respective endocardial, myocardial or ubiquitous tissue marker) were performed in a slice-based approach using Napari and its labels layer functionality. The thickness of the traced contours varied between 1 and 2 (±1) cell diameters, corresponding to the thickness of the specific tissue and ROI. Autophagosome and lysosome puncta were segmented in 3D using the in-house image batch-processing suite T-MIDAS (https://github.com/MercaderLabAnatomy/T-MIDAS). Instance segmentation was either performed based on Otsu-thresholding or a user-defined intensity threshold (0<threshold<255 for 8bit). A schematic representation of the employed image segmentation workflow is included in Figure S8. To estimate autophagosome and lysosome accumulation in each region of the sibling and mutant hearts (V, AVC. OFT), the numbers of autophagosome and lysosome puncta were determined by counting the colocalization of each ROI (V, AVC, OFT) with the instance segmentations of autophagosome, autolysosome or lysosome signals. Colocalization was performed by Boolean masking of the instance segmentation with the ROIs of the semantic segmentation. Instance counts were then obtained by calculating the length of the vector of unique label ids. Lastly, counts were normalized by ROI volume. The estimation of cardiac morphological parameters (cross sectional ventricle area, circularity, outflow tract length and atrioventricular canal width) and of the lysosome area was performed using ImageJ on randomized images. Qualitative assessment of valve morphology and heart rate at 4 dpf was performed prior to the determination of the larvae genotype to attain a blinded analysis. All image processing scripts and pipelines are available at https://github.com/MercaderLabAnatomy/PUB_Chavez_et_al_2023 and https://github.com/MercaderLabAnatomy/T-MIDAS.
Statistical analysis
Statistical analysis was carried out using GraphPad Prism7. Two-way ANOVA was applied to analyze statistical differences in autophagosome and lysosome quantifications across cardiac regions and developmental time points. Welch’s t-test and Mann-Whitney-U test were applied to compare differences between sibling and mutant or control and rescue conditions upon assessment of normal distribution. The Chi-square probability distribution test was applied to analyze categorical variables (qualitative assessment of valve elongation). When statistical test results are presented as asterisks, p-values are defined as ∗p ≤ 0.05, ∗∗p ≤ 0.01, ∗∗∗p ≤ 0.001, ∗∗∗∗p ≤ 0.0001. All snRNAseq transcriptome analyses were done using differential genes with p-values less than 0.05. Statistical details of each experiment can be found in the figure legends.
Published: November 19, 2024
Footnotes
Supplemental information can be found online at https://doi.org/10.1016/j.isci.2024.111406.
Contributor Information
Myra N. Chávez, Email: myra.chavez.rosas@ki.se.
Nadia Mercader, Email: nadia.mercader@unibe.ch.
Supplemental information
Missing cell types in the file indicate no enrichment could be obtained for that cell type, related to Figure 6
Missing cell types in the file indicate no enrichment could be obtained for that cell type, related to Figure S7
References
- 1.Galluzzi L., Baehrecke E.H., Ballabio A., Boya P., Bravo-San Pedro J.M., Cecconi F., Choi A.M., Chu C.T., Codogno P., Colombo M.I., et al. Molecular definitions of autophagy and related processes. EMBO J. 2017;36:1811–1836. doi: 10.15252/embj.201796697. [DOI] [PMC free article] [PubMed] [Google Scholar]
- 2.Klionsky D.J., Petroni G., Amaravadi R.K., Baehrecke E.H., Ballabio A., Boya P., Bravo-San Pedro J.M., Cadwell K., Cecconi F., Choi A.M.K., et al. Autophagy in major human diseases. EMBO J. 2021;40 doi: 10.15252/embj.2021108863. [DOI] [PMC free article] [PubMed] [Google Scholar]
- 3.Boya P., Codogno P., Rodriguez-Muela N. Autophagy in stem cells: repair, remodeling and metabolic reprogramming. Development. 2018;145 doi: 10.1242/dev.146506. [DOI] [PubMed] [Google Scholar]
- 4.Perrotta C., Cattaneo M.G., Molteni R., De Palma C. Autophagy in the Regulation of Tissue Differentiation and Homeostasis. Front. Cell Dev. Biol. 2020;8 doi: 10.3389/fcell.2020.602901. [DOI] [PMC free article] [PubMed] [Google Scholar]
- 5.Allen E.A., Baehrecke E.H. Autophagy in animal development. Cell Death Differ. 2020;27:903–918. doi: 10.1038/s41418-020-0497-0. [DOI] [PMC free article] [PubMed] [Google Scholar]
- 6.Lee E., Koo Y., Ng A., Wei Y., Luby-Phelps K., Juraszek A., Xavier R.J., Cleaver O., Levine B., Amatruda J.F. Autophagy is essential for cardiac morphogenesis during vertebrate development. Autophagy. 2014;10:572–587. doi: 10.4161/auto.27649. [DOI] [PMC free article] [PubMed] [Google Scholar]
- 7.Bhat O.M., Li P.-L. Lysosome Function in Cardiovascular Diseases. Cell. Physiol. Biochem. 2021;55:277–300. doi: 10.33594/000000373. [DOI] [PMC free article] [PubMed] [Google Scholar]
- 8.Mueller P., Attenhofer Jost C.H., Rohrbach M., Valsangiacomo Buechel E.R., Seifert B., Balmer C., Kretschmar O., Baumgartner M.R., Weber R. Cardiac disease in children and young adults with various lysosomal storage diseases: Comparison of echocardiographic and ECG changes among clinical groups. Int J Cardiol Heart Vessel. 2013;2:1–7. doi: 10.1016/j.ijchv.2013.10.002. [DOI] [PMC free article] [PubMed] [Google Scholar]
- 9.Ruiz-Guerrero L., Barriales-Villa R. Storage diseases with hypertrophic cardiomyopathy phenotype. Glob. Cardiol. Sci. Pract. 2018;2018 doi: 10.21542/gcsp.2018.28. [DOI] [PMC free article] [PubMed] [Google Scholar]
- 10.Nordin S., Kozor R., Baig S., Abdel-Gadir A., Medina-Menacho K., Rosmini S., Captur G., Tchan M., Geberhiwot T., Murphy E., et al. Cardiac Phenotype of Prehypertrophic Fabry Disease. Circ. Cardiovasc. Imaging. 2018;11:e007168. doi: 10.1161/CIRCIMAGING.117.007168. [DOI] [PMC free article] [PubMed] [Google Scholar]
- 11.Platt F.M., d’Azzo A., Davidson B.L., Neufeld E.F., Tifft C.J. Lysosomal storage diseases. Nat. Rev. Dis. Primers. 2018;4:27. doi: 10.1038/s41572-018-0025-4. [DOI] [PubMed] [Google Scholar]
- 12.Yang R.M., Tao J., Zhan M., Yuan H., Wang H.H., Chen S.J., Chen Z., de Thé H., Zhou J., Guo Y., Zhu J. TAMM41 is required for heart valve differentiation via regulation of PINK-PARK2 dependent mitophagy. Cell Death Differ. 2019;26:2430–2446. doi: 10.1038/s41418-019-0311-z. [DOI] [PMC free article] [PubMed] [Google Scholar]
- 13.Bouhamdani N., Comeau D., Turcotte S. A Compendium of Information on the Lysosome. Front. Cell Dev. Biol. 2021;9 doi: 10.3389/fcell.2021.798262. [DOI] [PMC free article] [PubMed] [Google Scholar]
- 14.González-Rosa J.M. Zebrafish Models of Cardiac Disease: From Fortuitous Mutants to Precision Medicine. Circ. Res. 2022;130:1803–1826. doi: 10.1161/CIRCRESAHA.122.320396. [DOI] [PubMed] [Google Scholar]
- 15.O’Donnell A., Yutzey K.E. To EndoMT or Not to EndoMT. Circ. Res. 2020;126:985–987. doi: 10.1161/CIRCRESAHA.120.316846. [DOI] [PMC free article] [PubMed] [Google Scholar]
- 16.Kemmler C.L., Riemslagh F.W., Moran H.R., Mosimann C. From Stripes to a Beating Heart: Early Cardiac Development in Zebrafish. J. Cardiovasc. Dev. Dis. 2021;8:17. doi: 10.3390/jcdd8020017. [DOI] [PMC free article] [PubMed] [Google Scholar]
- 17.Mathai B.J., Meijer A.H., Simonsen A. Studying Autophagy in Zebrafish. Cells. 2017;6:21. doi: 10.3390/cells6030021. [DOI] [PMC free article] [PubMed] [Google Scholar]
- 18.Zhang T., Peterson R.T. Modeling Lysosomal Storage Diseases in the Zebrafish. Front. Mol. Biosci. 2020;7 doi: 10.3389/fmolb.2020.00082. [DOI] [PMC free article] [PubMed] [Google Scholar]
- 19.Klionsky D.J., Abdel-Aziz A.K., Abdelfatah S., Abdellatif M., Abdoli A., Abel S., Abeliovich H., Abildgaard M.H., Abudu Y.P., Acevedo-Arozena A., et al. Guidelines for the use and interpretation of assays for monitoring autophagy (4th edition)1. Autophagy. 2021;17:1–382. doi: 10.1080/15548627.2020.1797280. [DOI] [PMC free article] [PubMed] [Google Scholar]
- 20.Ta-Shma A., Zhang K., Salimova E., Zernecke A., Sieiro-Mosti D., Stegner D., Furtado M., Shaag A., Perles Z., Nieswandt B., et al. Congenital valvular defects associated with deleterious mutations in the PLD1 gene. J. Med. Genet. 2017;54:278–286. doi: 10.1136/jmedgenet-2016-104259. [DOI] [PubMed] [Google Scholar]
- 21.Lu P.-N., Moreland T., Christian C.J., Lund T.C., Steet R.A., Flanagan-Steet H. Inappropriate cathepsin K secretion promotes its enzymatic activation driving heart and valve malformation. JCI Insight. 2020;5 doi: 10.1172/jci.insight.133019. [DOI] [PMC free article] [PubMed] [Google Scholar]
- 22.He M., Kuk A.C.Y., Ding M., Chin C.F., Galam D.L.A., Nah J.M., Tan B.C., Yeo H.L., Chua G.L., Benke P.I., et al. Spns1 is a lysophospholipid transporter mediating lysosomal phospholipid salvage. Proc. Natl. Acad. Sci. USA. 2022;119 doi: 10.1073/pnas.2210353119. [DOI] [PMC free article] [PubMed] [Google Scholar]
- 23.Scharenberg S.G., Dong W., Ghoochani A., Nyame K., Levin-Konigsberg R., Krishnan A.R., Rawat E.S., Spees K., Bassik M.C., Abu-Remaileh M. An SPNS1-dependent lysosomal lipid transport pathway that enables cell survival under choline limitation. Sci. Adv. 2023;9 doi: 10.1126/sciadv.adf8966. [DOI] [PMC free article] [PubMed] [Google Scholar]
- 24.Young R.M., Marty S., Nakano Y., Wang H., Yamamoto D., Lin S., Allende M.L. Zebrafish yolk-specificnot really started (nrs) gene is a vertebrate homolog of theDrosophila spinster gene and is essential for embryogenesis. Dev. Dyn. 2002;223:298–305. doi: 10.1002/dvdy.10060. [DOI] [PubMed] [Google Scholar]
- 25.Sasaki T., Lian S., Qi J., Bayliss P.E., Carr C.E., Johnson J.L., Guha S., Kobler P., Catz S.D., Gill M., et al. Aberrant Autolysosomal Regulation Is Linked to The Induction of Embryonic Senescence: Differential Roles of Beclin 1 and p53 in Vertebrate Spns1 Deficiency. PLoS Genet. 2014;10 doi: 10.1371/journal.pgen.1004409. [DOI] [PMC free article] [PubMed] [Google Scholar]
- 26.Sasaki T., Lian S., Khan A., Llop J.R., Samuelson A.V., Chen W., Klionsky D.J., Kishi S. Autolysosome biogenesis and developmental senescence are regulated by both Spns1 and v-ATPase. Autophagy. 2017;13:386–403. doi: 10.1080/15548627.2016.1256934. [DOI] [PMC free article] [PubMed] [Google Scholar]
- 27.Coffey E.C., Astumian M., Alrowaished S.S., Schaffer C., Henry C.A. Lysosomal Function Impacts the Skeletal Muscle Extracellular Matrix. J. Dev. Biol. 2021;9:52. doi: 10.3390/jdb9040052. [DOI] [PMC free article] [PubMed] [Google Scholar]
- 28.Disse S., Abergel E., Berrebi A., Houot A.-M., Le Heuzey J.-Y., Diebold B., Guize L., Carpentier A., Corvol P., Jeunemaitre X. Mapping of a First Locus for Autosomal Dominant Myxomatous Mitral-Valve Prolapse to Chromosome 16p11.2-p12.1. Am. J. Hum. Genet. 1999;65:1242–1251. doi: 10.1086/302624. [DOI] [PMC free article] [PubMed] [Google Scholar]
- 29.Ghebranious N., Giampietro P.F., Wesbrook F.P., Rezkalla S.H. A novel microdeletion at 16p11.2 harbors candidate genes for aortic valve development, seizure disorder, and mild mental retardation. Am. J. Med. Genet. 2007;143A:1462–1471. doi: 10.1002/ajmg.a.31837. [DOI] [PubMed] [Google Scholar]
- 30.Li L., Huang L., Lin S., Luo Y., Fang Q. Discordant phenotypes in monozygotic twins with 16p11.2 microdeletions including the SH2B1 gene. Am. J. Med. Genet. 2017;173:2284–2288. doi: 10.1002/ajmg.a.38284. [DOI] [PubMed] [Google Scholar]
- 31.Marques I.J., Ernst A., Arora P., Vianin A., Hetke T., Sanz-Morejón A., Naumann U., Odriozola A., Langa X., Andrés-Delgado L., et al. Wt1 transcription factor impairs cardiomyocyte specification and drives a phenotypic switch from myocardium to epicardium. Development. 2022;149 doi: 10.1242/dev.200375. [DOI] [PMC free article] [PubMed] [Google Scholar]
- 32.Vignes H., Vagena-Pantoula C., Prakash M., Fukui H., Norden C., Mochizuki N., Jug F., Vermot J. Extracellular mechanical forces drive endocardial cell volume decrease during zebrafish cardiac valve morphogenesis. Dev. Cell. 2022;57:598–609. doi: 10.1016/j.devcel.2022.02.011. [DOI] [PubMed] [Google Scholar]
- 33.Steed E., Faggianelli N., Roth S., Ramspacher C., Concordet J.-P., Vermot J. klf2a couples mechanotransduction and zebrafish valve morphogenesis through fibronectin synthesis. Nat. Commun. 2016;7 doi: 10.1038/ncomms11646. [DOI] [PMC free article] [PubMed] [Google Scholar]
- 34.Gunawan F., Gentile A., Gauvrit S., Stainier D.Y.R., Bensimon-Brito A. Nfatc1 Promotes Interstitial Cell Formation During Cardiac Valve Development in Zebrafish. Circ. Res. 2020;126:968–984. doi: 10.1161/CIRCRESAHA.119.315992. [DOI] [PubMed] [Google Scholar]
- 35.Chávez M.N., Morales R.A., López-Crisosto C., Roa J.C., Allende M.L., Lavandero S. Autophagy Activation in Zebrafish Heart Regeneration. Sci. Rep. 2020;10:2191. doi: 10.1038/s41598-020-59106-z. [DOI] [PMC free article] [PubMed] [Google Scholar]
- 36.Mauthe M., Orhon I., Rocchi C., Zhou X., Luhr M., Hijlkema K.-J., Coppes R.P., Engedal N., Mari M., Reggiori F. Chloroquine inhibits autophagic flux by decreasing autophagosome-lysosome fusion. Autophagy. 2018;14:1435–1455. doi: 10.1080/15548627.2018.1474314. [DOI] [PMC free article] [PubMed] [Google Scholar]
- 37.Wu Z., Zhao J., Qiu M., Mi Z., Meng M., Guo Y., Wang H., Yuan Z. CRISPR/Cas9 Mediated GFP Knock-in at the MAP1LC3B Locus in 293FT Cells Is Better for Bona Fide Monitoring Cellular Autophagy. Biotechnol. J. 2018;13:e1700674. doi: 10.1002/biot.201700674. [DOI] [PubMed] [Google Scholar]
- 38.Grimes A.C., Kirby M.L. The outflow tract of the heart in fishes: anatomy, genes and evolution. J. Fish. Biol. 2009;74:983–1036. doi: 10.1111/j.1095-8649.2008.02125.x. [DOI] [PubMed] [Google Scholar]
- 39.Chen E.Y., Tan C.M., Kou Y., Duan Q., Wang Z., Meirelles G.V., Clark N.R., Ma’ayan A. Enrichr: interactive and collaborative HTML5 gene list enrichment analysis tool. BMC Bioinf. 2013;14:128. doi: 10.1186/1471-2105-14-128. [DOI] [PMC free article] [PubMed] [Google Scholar]
- 40.Kuleshov M.V., Jones M.R., Rouillard A.D., Fernandez N.F., Duan Q., Wang Z., Koplev S., Jenkins S.L., Jagodnik K.M., Lachmann A., et al. Enrichr: a comprehensive gene set enrichment analysis web server 2016 update. Nucleic Acids Res. 2016;44:W90–W97. doi: 10.1093/nar/gkw377. [DOI] [PMC free article] [PubMed] [Google Scholar]
- 41.Goddard L.M., Duchemin A.-L., Ramalingan H., Wu B., Chen M., Bamezai S., Yang J., Li L., Morley M.P., Wang T., et al. Hemodynamic Forces Sculpt Developing Heart Valves through a KLF2-WNT9B Paracrine Signaling Axis. Dev. Cell. 2017;43:274–289.e5. doi: 10.1016/j.devcel.2017.09.023. [DOI] [PMC free article] [PubMed] [Google Scholar]
- 42.Burkhard S.B., Bakkers J. Spatially resolved RNA-sequencing of the embryonic heart identifies a role for Wnt/β-catenin signaling in autonomic control of heart rate. Elife. 2018;7 doi: 10.7554/eLife.31515. [DOI] [PMC free article] [PubMed] [Google Scholar]
- 43.Duchemin A.-L., Vignes H., Vermot J. Mechanically activated piezo channels modulate outflow tract valve development through the Yap1 and Klf2-Notch signaling axis. Elife. 2019;8 doi: 10.7554/eLife.44706. [DOI] [PMC free article] [PubMed] [Google Scholar]
- 44.Fontana F., Haack T., Reichenbach M., Knaus P., Puceat M., Abdelilah-Seyfried S. Antagonistic Activities of Vegfr3/Flt4 and Notch1b Fine-tune Mechanosensitive Signaling during Zebrafish Cardiac Valvulogenesis. Cell Rep. 2020;32 doi: 10.1016/j.celrep.2020.107883. [DOI] [PubMed] [Google Scholar]
- 45.Xie Z., Bailey A., Kuleshov M.V., Clarke D.J.B., Evangelista J.E., Jenkins S.L., Lachmann A., Wojciechowicz M.L., Kropiwnicki E., Jagodnik K.M., et al. Gene Set Knowledge Discovery with Enrichr. Curr. Protoc. 2021;1 doi: 10.1002/cpz1.90. [DOI] [PMC free article] [PubMed] [Google Scholar]
- 46.Ma H., Liu Z., Yang Y., Feng D., Dong Y., Garbutt T.A., Hu Z., Wang L., Luan C., Cooper C.D., et al. Functional coordination of non-myocytes plays a key role in adult zebrafish heart regeneration. EMBO Rep. 2021;22 doi: 10.15252/embr.202152901. [DOI] [PMC free article] [PubMed] [Google Scholar]
- 47.Queen R., Moira C., Eley L., Kerwin J., Turner J.E., Yu J., Dhanaseelan T., Overman L., Soetjoardi H. Spatial transcriptomics reveals novel genes during the remodeling of the embryonic human arterial valves. bioRxiv. 2023 doi: 10.1371/journal.pgen.1010777. Preprint at. [DOI] [PMC free article] [PubMed] [Google Scholar]
- 48.Subramanian A., Tamayo P., Mootha V.K., Mukherjee S., Ebert B.L., Gillette M.A., Paulovich A., Pomeroy S.L., Golub T.R., Lander E.S., Mesirov J.P. Gene set enrichment analysis: A knowledge-based approach for interpreting genome-wide expression profiles. Proc. Natl. Acad. Sci. USA. 2005;102:15545–15550. doi: 10.1073/pnas.0506580102. [DOI] [PMC free article] [PubMed] [Google Scholar]
- 49.Bonam S.R., Wang F., Muller S. Lysosomes as a therapeutic target. Nat. Rev. Drug Discov. 2019;18:923–948. doi: 10.1038/s41573-019-0036-1. [DOI] [PMC free article] [PubMed] [Google Scholar]
- 50.Tognon E., Kobia F., Busi I., Fumagalli A., De Masi F., Vaccari T. Control of lysosomal biogenesis and Notch-dependent tissue patterning by components of the TFEB-V-ATPase axis in Drosophila melanogaster. Autophagy. 2016;12:499–514. doi: 10.1080/15548627.2015.1134080. [DOI] [PMC free article] [PubMed] [Google Scholar]
- 51.Wu T., Hu E., Xu S., Chen M., Guo P., Dai Z., Feng T., Zhou L., Tang W., Zhan L., et al. clusterProfiler 4.0: A universal enrichment tool for interpreting omics data. Innovation. 2021;2 doi: 10.1016/j.xinn.2021.100141. [DOI] [PMC free article] [PubMed] [Google Scholar]
- 52.Luxán G., D’Amato G., MacGrogan D., de la Pompa J.L. Endocardial Notch Signaling in Cardiac Development and Disease. Circ. Res. 2016;118:e1–e18. doi: 10.1161/CIRCRESAHA.115.305350. [DOI] [PubMed] [Google Scholar]
- 53.Qu X., Harmelink C., Baldwin H.S. Endocardial-Myocardial Interactions During Early Cardiac Differentiation and Trabeculation. Front. Cardiovasc. Med. 2022;9 doi: 10.3389/fcvm.2022.857581. [DOI] [PMC free article] [PubMed] [Google Scholar]
- 54.Dimitrov D., Türei D., Garrido-Rodriguez M., Burmedi P.L., Nagai J.S., Boys C., Ramirez Flores R.O., Kim H., Szalai B., Costa I.G., et al. Comparison of methods and resources for cell-cell communication inference from single-cell RNA-Seq data. Nat. Commun. 2022;13:3224. doi: 10.1038/s41467-022-30755-0. [DOI] [PMC free article] [PubMed] [Google Scholar]
- 55.MacGrogan D., Münch J., de la Pompa J.L. Notch and interacting signaling pathways in cardiac development, disease, and regeneration. Nat. Rev. Cardiol. 2018;15:685–704. doi: 10.1038/s41569-018-0100-2. [DOI] [PubMed] [Google Scholar]
- 56.Scheer N., Riedl I., Warren J.T., Kuwada J.Y., Campos-Ortega J.A. A quantitative analysis of the kinetics of Gal4 activator and effector gene expression in the zebrafish. Mech. Dev. 2002;112:9–14. doi: 10.1016/S0925-4773(01)00621-9. [DOI] [PubMed] [Google Scholar]
- 57.Scheer N., Groth A., Hans S., Campos-Ortega J.A. An instructive function for Notch in promoting gliogenesis in the zebrafish retina. Development. 2001;128:1099–1107. doi: 10.1242/dev.128.7.1099. [DOI] [PubMed] [Google Scholar]
- 58.Zhang J., Zuo Z., Li J., Wang Y., Huang J., Xu L., Jin K., Lu H., Dai Y. In situ assessment of statins’ effect on autophagic activity in zebrafish larvae cardiomyocytes. Front. Cardiovasc. Med. 2022;9 doi: 10.3389/fcvm.2022.921829. [DOI] [PMC free article] [PubMed] [Google Scholar]
- 59.Steed E., Boselli F., Vermot J. Hemodynamics driven cardiac valve morphogenesis. Biochim. Biophys. Acta. 2016;1863:1760–1766. doi: 10.1016/j.bbamcr.2015.11.014. [DOI] [PubMed] [Google Scholar]
- 60.Andrés-Delgado L., Mercader N. Interplay between cardiac function and heart development. Biochim. Biophys. Acta Mol. Cell Res. 2016;1863:1707–1716. doi: 10.1016/j.bbamcr.2016.03.004. [DOI] [PMC free article] [PubMed] [Google Scholar]
- 61.Kheloufi M., Vion A.-C., Hammoutene A., Poisson J., Lasselin J., Devue C., Pic I., Dupont N., Busse J., Stark K., et al. Endothelial autophagic flux hampers atherosclerotic lesion development. Autophagy. 2018;14:173–175. doi: 10.1080/15548627.2017.1395114. [DOI] [PMC free article] [PubMed] [Google Scholar]
- 62.Canham L., Sendac S., Diagbouga M.R., Wolodimeroff E., Pirri D., Tardajos Ayllon B., Feng S., Souilhol C., Chico T.J.A., Evans P.C., Serbanovic-Canic J. EVA1A (Eva-1 Homolog A) Promotes Endothelial Apoptosis and Inflammatory Activation Under Disturbed Flow Via Regulation of Autophagy. Arterioscler. Thromb. Vasc. Biol. 2023;43:547–561. doi: 10.1161/ATVBAHA.122.318110. [DOI] [PMC free article] [PubMed] [Google Scholar]
- 63.Chen X.-K., Kwan J.S.-K., Chang R.C.-C., Ma A.C.-H. 1-phenyl 2-thiourea (PTU) activates autophagy in zebrafish embryos. Autophagy. 2021;17:1222–1231. doi: 10.1080/15548627.2020.1755119. [DOI] [PMC free article] [PubMed] [Google Scholar]
- 64.Dvornikov A.V., Wang M., Yang J., Zhu P., Le T., Lin X., Cao H., Xu X. Phenotyping an adult zebrafish lamp2 cardiomyopathy model identifies mTOR inhibition as a candidate therapy. J. Mol. Cell. Cardiol. 2019;133:199–208. doi: 10.1016/j.yjmcc.2019.06.013. [DOI] [PMC free article] [PubMed] [Google Scholar]
- 65.Costa R., Urbani A., Salvalaio M., Bellesso S., Cieri D., Zancan I., Filocamo M., Bonaldo P., Szabò I., Tomanin R., Moro E. Perturbations in cell signaling elicit early cardiac defects in mucopolysaccharidosis type II. Hum. Mol. Genet. 2017;26:1643–1655. doi: 10.1093/hmg/ddx069. [DOI] [PubMed] [Google Scholar]
- 66.Yanagisawa H., Ishii T., Endo K., Kawakami E., Nagao K., Miyashita T., Akiyama K., Watabe K., Komatsu M., Yamamoto D., Eto Y. L-leucine and SPNS1 coordinately ameliorate dysfunction of autophagy in mouse and human Niemann-Pick type C disease. Sci. Rep. 2017;7 doi: 10.1038/s41598-017-15305-9. [DOI] [PMC free article] [PubMed] [Google Scholar]
- 67.Wu X., Fleming A., Ricketts T., Pavel M., Virgin H., Menzies F.M., Rubinsztein D.C. Autophagy regulates Notch degradation and modulates stem cell development and neurogenesis. Nat. Commun. 2016;7 doi: 10.1038/ncomms10533. [DOI] [PMC free article] [PubMed] [Google Scholar]
- 68.Bohl B., Jabali A., Ladewig J., Koch P. Asymmetric Notch activity by differential inheritance of lysosomes in human neural stem cells. Sci. Adv. 2022;8 doi: 10.1126/sciadv.abl5792. [DOI] [PMC free article] [PubMed] [Google Scholar]
- 69.Saera-Vila A., Kish P.E., Louie K.W., Grzegorski S.J., Klionsky D.J., Kahana A. Autophagy regulates cytoplasmic remodeling during cell reprogramming in a zebrafish model of muscle regeneration. Autophagy. 2016;12:1864–1875. doi: 10.1080/15548627.2016.1207015. [DOI] [PMC free article] [PubMed] [Google Scholar]
- 70.Vion A.-C., Kheloufi M., Hammoutene A., Poisson J., Lasselin J., Devue C., Pic I., Dupont N., Busse J., Stark K., et al. Autophagy is required for endothelial cell alignment and atheroprotection under physiological blood flow. Proc. Natl. Acad. Sci. USA. 2017;114:E8675–E8684. doi: 10.1073/pnas.1702223114. [DOI] [PMC free article] [PubMed] [Google Scholar]
- 71.Moss J.J., Wirth M., Tooze S.A., Lane J.D., Hammond C.L. Autophagy coordinates chondrocyte development and early joint formation in zebrafish. Faseb. J. 2021;35 doi: 10.1096/fj.202101167R. [DOI] [PMC free article] [PubMed] [Google Scholar]
- 72.Kim S.I., Na H.-J., Ding Y., Wang Z., Lee S.J., Choi M.E. Autophagy Promotes Intracellular Degradation of Type I Collagen Induced by Transforming Growth Factor (TGF)-β1. J. Biol. Chem. 2012;287:11677–11688. doi: 10.1074/jbc.M111.308460. [DOI] [PMC free article] [PubMed] [Google Scholar]
- 73.Kawano S., Torisu T., Esaki M., Torisu K., Matsuno Y., Kitazono T. Autophagy promotes degradation of internalized collagen and regulates distribution of focal adhesions to suppress cell adhesion. Biol. Open. 2017;6:1644–1653. doi: 10.1242/bio.027458. [DOI] [PMC free article] [PubMed] [Google Scholar]
- 74.Schaefer L., Dikic I. Autophagy: Instructions from the extracellular matrix. Matrix Biol. 2021;100–101:1–8. doi: 10.1016/j.matbio.2021.06.002. [DOI] [PubMed] [Google Scholar]
- 75.Swart G.W.M. Activated leukocyte cell adhesion molecule (CD166/ALCAM): Developmental and mechanistic aspects of cell clustering and cell migration. Eur. J. Cell Biol. 2002;81:313–321. doi: 10.1078/0171-9335-00256. [DOI] [PubMed] [Google Scholar]
- 76.Choudhry P., Joshi D., Funke B., Trede N. Alcama mediates Edn1 signaling during zebrafish cartilage morphogenesis. Dev. Biol. 2011;349:483–493. doi: 10.1016/j.ydbio.2010.11.006. [DOI] [PMC free article] [PubMed] [Google Scholar]
- 77.Chen H.-T., Liu H., Mao M.-J., Tan Y., Mo X.-Q., Meng X.-J., Cao M.-T., Zhong C.-Y., Liu Y., Shan H., Jiang G.M. Crosstalk between autophagy and epithelial-mesenchymal transition and its application in cancer therapy. Mol. Cancer. 2019;18:101. doi: 10.1186/s12943-019-1030-2. [DOI] [PMC free article] [PubMed] [Google Scholar]
- 78.Hinton R.B., Yutzey K.E. Heart Valve Structure and Function in Development and Disease. Annu. Rev. Physiol. 2011;73:29–46. doi: 10.1146/annurev-physiol-012110-142145. [DOI] [PMC free article] [PubMed] [Google Scholar]
- 79.Ouyang J.F., Kamaraj U.S., Cao E.Y., Rackham O.J.L. ShinyCell: simple and sharable visualization of single-cell gene expression data. Bioinformatics. 2021;37:3374–3376. doi: 10.1093/bioinformatics/btab209. [DOI] [PubMed] [Google Scholar]
- 80.Gagnon J.A., Valen E., Thyme S.B., Huang P., Akhmetova L., Pauli A., Montague T.G., Zimmerman S., Richter C., Schier A.F. Efficient mutagenesis by Cas9 protein-mediated oligonucleotide insertion and large-scale assessment of single-guide RNAs. PLoS One. 2014;9 doi: 10.1371/journal.pone.0098186. [DOI] [PMC free article] [PubMed] [Google Scholar]
- 81.Kaizuka T., Morishita H., Hama Y., Tsukamoto S., Matsui T., Toyota Y., Kodama A., Ishihara T., Mizushima T., Mizushima N. An Autophagic Flux Probe that Releases an Internal Control. Mol. Cell. 2016;64:835–849. doi: 10.1016/j.molcel.2016.09.037. [DOI] [PubMed] [Google Scholar]
- 82.Hoshijima K., Jurynec M.J., Grunwald D.J. Precise Editing of the Zebrafish Genome Made Simple and Efficient. Dev. Cell. 2016;36:654–667. doi: 10.1016/j.devcel.2016.02.015. [DOI] [PMC free article] [PubMed] [Google Scholar]
- 83.Kwan K.M., Fujimoto E., Grabher C., Mangum B.D., Hardy M.E., Campbell D.S., Parant J.M., Yost H.J., Kanki J.P., Chien C.-B. The Tol2kit: A multisite gateway-based construction kit forTol2 transposon transgenesis constructs. Dev. Dyn. 2007;236:3088–3099. doi: 10.1002/dvdy.21343. [DOI] [PubMed] [Google Scholar]
- 84.Berger J., Currie P.D. 503unc , a small and muscle-specific zebrafish promoter. genesis. 2013;51:443–447. doi: 10.1002/dvg.22385. [DOI] [PubMed] [Google Scholar]
- 85.Kawakami K. Tol2: a versatile gene transfer vector in vertebrates. Genome Biol. 2007;8:S7. doi: 10.1186/gb-2007-8-s1-s7. [DOI] [PMC free article] [PubMed] [Google Scholar]
- 86.Moreno-Mateos M.A., Vejnar C.E., Beaudoin J.-D., Fernandez J.P., Mis E.K., Khokha M.K., Giraldez A.J. CRISPRscan: designing highly efficient sgRNAs for CRISPR-Cas9 targeting in vivo. Nat. Methods. 2015;12:982–988. doi: 10.1038/nmeth.3543. [DOI] [PMC free article] [PubMed] [Google Scholar]
- 87.Singleman C., Holtzman N.G. Heart Dissection in Larval, Juvenile and Adult Zebrafish. J. Vis. Exp. 2011 doi: 10.3791/3165. [DOI] [PMC free article] [PubMed] [Google Scholar]
- 88.Zheng G.X.Y., Terry J.M., Belgrader P., Ryvkin P., Bent Z.W., Wilson R., Ziraldo S.B., Wheeler T.D., McDermott G.P., Zhu J., et al. Massively parallel digital transcriptional profiling of single cells. Nat. Commun. 2017;8 doi: 10.1038/ncomms14049. [DOI] [PMC free article] [PubMed] [Google Scholar]
- 89.Cunningham F., Allen J.E., Allen J., Alvarez-Jarreta J., Amode M.R., Armean I.M., Austine-Orimoloye O., Azov A.G., Barnes I., Bennett R., et al. Ensembl 2022. Nucleic Acids Res. 2022;50:D988–D995. doi: 10.1093/nar/gkab1049. [DOI] [PMC free article] [PubMed] [Google Scholar]
- 90.Hao Y., Hao S., Andersen-Nissen E., Mauck W.M., Zheng S., Butler A., Lee M.J., Wilk A.J., Darby C., Zager M., et al. Integrated analysis of multimodal single-cell data. Cell. 2021;184:3573–3587.e29. doi: 10.1016/j.cell.2021.04.048. [DOI] [PMC free article] [PubMed] [Google Scholar]
- 91.Stuart T., Butler A., Hoffman P., Hafemeister C., Papalexi E., Mauck W.M., Hao Y., Stoeckius M., Smibert P., Satija R. Comprehensive Integration of Single-Cell Data. Cell. 2019;177:1888–1902.e21. doi: 10.1016/j.cell.2019.05.031. [DOI] [PMC free article] [PubMed] [Google Scholar]
- 92.Wickham H., Averick M., Bryan J., Chang W., McGowan L., François R., Grolemund G., Hayes A., Henry L., Hester J., et al. Welcome to the Tidyverse. J. Open Source Softw. 2019;4:1686. doi: 10.21105/joss.01686. [DOI] [Google Scholar]
- 93.Amezquita R.A., Lun A.T.L., Becht E., Carey V.J., Carpp L.N., Geistlinger L., Marini F., Rue-Albrecht K., Risso D., Soneson C., et al. Orchestrating single-cell analysis with Bioconductor. Nat. Methods. 2020;17:137–145. doi: 10.1038/s41592-019-0654-x. [DOI] [PMC free article] [PubMed] [Google Scholar]
- 94.Germain P.-L., Lun A., Garcia Meixide C., Macnair W., Robinson M.D. Doublet identification in single-cell sequencing data using scDblFinder. F1000Res. 2021;10:979. doi: 10.12688/f1000research.73600.2. [DOI] [PMC free article] [PubMed] [Google Scholar]
- 95.Squair J.W., Gautier M., Kathe C., Anderson M.A., James N.D., Hutson T.H., Hudelle R., Qaiser T., Matson K.J.E., Barraud Q., et al. Confronting false discoveries in single-cell differential expression. Nat. Commun. 2021;12:5692. doi: 10.1038/s41467-021-25960-2. [DOI] [PMC free article] [PubMed] [Google Scholar]
- 96.Durinck S., Spellman P.T., Birney E., Huber W. Mapping identifiers for the integration of genomic datasets with the R/Bioconductor package biomaRt. Nat. Protoc. 2009;4:1184–1191. doi: 10.1038/nprot.2009.97. [DOI] [PMC free article] [PubMed] [Google Scholar]
- 97.Yu G., Wang L.-G., Han Y., He Q.-Y. clusterProfiler: an R Package for Comparing Biological Themes Among Gene Clusters. OMICS. 2012;16:284–287. doi: 10.1089/omi.2011.0118. [DOI] [PMC free article] [PubMed] [Google Scholar]
- 98.Bunis D.G., Andrews J., Fragiadakis G.K., Burt T.D., Sirota M. dittoSeq: universal user-friendly single-cell and bulk RNA sequencing visualization toolkit. Bioinformatics. 2021;36:5535–5536. doi: 10.1093/bioinformatics/btaa1011. [DOI] [PMC free article] [PubMed] [Google Scholar]
- 99.Schneider C.A., Rasband W.S., Eliceiri K.W. NIH Image to ImageJ: 25 years of image analysis. Nat. Methods. 2012;9:671–675. doi: 10.1038/nmeth.2089. [DOI] [PMC free article] [PubMed] [Google Scholar]
Associated Data
This section collects any data citations, data availability statements, or supplementary materials included in this article.
Supplementary Materials
The video shows the z-stack projection, one z-plane and a sequence of the stack images acquired by 3D + t light-sheet microscopy and upon reconstruction by retrospective gating. The cytoplasmic signal of GFP (green) as well as discrete mRFP+ autophagosomes/autolysosomes (magenta puncta) are sparsely distributed throughout the ventricle (V). Accumulation of both GFP/mRFP+ autophagosomes (white puncta) and mRFP+ autolysosomes can be distinguished the outflow track (OFT) and atrioventricular canal (AVC), suggesting increased autophagic activity in these regions (yellow arrows), related to Figure 1
The knock-in endogenous autophagosome reporter TgKI(mRFP-Lc3) allows to observe the accumulation (white arrows) of mRFP+ autophagosomes/autolysosomes (magenta puncta) in the endocardium (Tg(fli1a:GFP, yellow), particularly in endocardial valve cells of the outflow track (OFT) and atrioventricular canal (AVC). A z-stack projection, one z-plane and a sequence of the stack images acquired by 3D + t light-sheet microscopy and upon reconstruction by retrospective gating are shown (V: ventricle), related to Figure 1
The knock-in endogenous autophagosome reporter TgKI(mRFP-Lc3) allows to observe the accumulation (white arrows) of mRFP+ autophagosomes/autolysosomes (magenta puncta) in cardiomyocytes (Tg(myl7:GFP, yellow) in the outflow track (OFT) just below the clapping valve, and at the base of the valves in the atrioventricular canal (AVC). The video shows a z-stack projection, one z-plane and a sequence of the stack images acquired by 3D + t light-sheet microscopy and upon reconstruction by retrospective gating. (V: ventricle), related to Figure 1
The autophagosome reporter Tg(cmv:EGFP-Lc3) shows high fluorescence (green) in the outflow tract (OFT) and the atrioventricular canal (AVC) suggesting greater accumulation of autophagic vesicles in these cardiac regions. Similarly, a significant accumulation of LysoTracker-labelled lysosomes (magenta puncta) is observed in the developing cardiac valves (yellow arrows). These results indicate a high rate of autophagic-lysosomal processing during valve development. The video shows a z-stack projection, one z-plane and a sequence of the stack images acquired by 3D + t light-sheet microscopy and upon reconstruction by retrospective gating. (V: ventricle), related to Figure 2
The video shows a z-stack projection, one z-plane and a sequence of the stack images acquired by 3D + t light-sheet microscopy and upon reconstruction by retrospective gating. Lysosomes (mRFP+ puncta) are observed throughout the larval heart (V: ventricle), yet they are most densely localized in krdl+ endocardial cells and valve cells (white arrows) of the outflow tract (OFT) and atrioventricular canal (AVC). This hints toward special lysosomal function requirements for cells in these regions, related to Figure 2
The video shows a z-stack projection, one z-plane and a sequence of the stack images acquired by 3D + t light-sheet microscopy and upon reconstruction by retrospective gating. Lysosomes (mRFP+ puncta) are observed to be distributed throughout the larval ventricle (V), yet they appear to be denser (white arrows) in myocardial cells (yellow) adjacent to the base of the valves in the outflow tract (OFT) and atrioventricular canal (AVC), suggesting higher lysosomal activity on these cardiac regions during the formation of their respective valves, related to Figure 2
The video shows the z-stack projections of beating sibling and nrs hearts to exemplify the constrained movement of the mutant endocardium (green) compared to the sibling. In contrast, the myocardium (magenta) contractility does not seem to be as affected in nrs mutants. Further, compared to the sibling heart, the outflow tract (white arrow) in the mutant heart shows limited capacity of expansion, related to Figure 4
The video allows to compare the development, morphology and movement of sibling and nrs mutant bulboventricular (OFT) and atrioventricular (AVC) cardiac valves. In contrast to the elongated, detached and clapping valves preventing retrograde blood flow in sibling hearts, mutant valves have hardly delaminated or elongated by 96 hpf and they cannot properly close, related to Figure 4
Endothelial-specific overexpression of the wild-type spns1 gene partially rescues cardiac valve development and function. Above all, rescued atrioventricular (AVC) valves are able to properly open and close, and thus support unidirectional blood flow. (OFT: outflow tract), related to Figure 5
Endothelial-specific overexpression of a constitutively active version of the Notch1 receptor promotes the delamination and elongation of the mutant atrioventricular (AVC) cardiac valves, and to a lesser degree the bulboventricular (OFT) valves. This supports the closure of the valves and prevents retrograde flow, related to Figure 7
Missing cell types in the file indicate no enrichment could be obtained for that cell type, related to Figure 6
Missing cell types in the file indicate no enrichment could be obtained for that cell type, related to Figure S7
Data Availability Statement
The snRNAseq raw data are deposited on GEO under GSE (GEO: GSE246850). The analyzed data are made available under a shiny app (https://mybinder.org/v2/gh/MercaderLabAnatomy/PUB_Chavez_et_al_2023_shiny_binder/main?urlpath=shiny/bus-dashboard/) made using ShinyCell with additional modifications.79 The code for analyses, image processing scripts and quantification pipelines are available at https://github.com/MercaderLabAnatomy/PUB_Chavez_et_al_2023 and https://github.com/MercaderLabAnatomy/T-MIDAS. Experimental raw data have been deposited on Zenodo (Zenodo: https://doi.org/10.5281/zenodo.13982794). Other information required to reanalyze the data reported in this paper can be requested to the lead contact.