Abstract
There is increasing evidence that long non-coding (lnc)RNA EGFR-AS1 is involved in the development of numerous types of cancer, including non-small-cell lung cancer (NSCLC). The Cancer Genome Atlas (TCGA) demonstrates that EGFR-AS1 is highly expressed in NSCLC. Downregulation of EGFR-AS1 in A549 and PC9 NSCLC cells demonstrates inhibition of NSCLC proliferation, invasion and metastasis. The present study demonstrated that lncRNA EGFR-AS1 was essential for the development of NSCLC through its function as a competitive endogenous RNA binding to miR-449a and upregulating histone deacetylase 1. In brief, it identified a novel signaling pathway that mediated the invasion and metastasis of NSCLC and may therefore provide a new treatment target for NSCLC.
Keywords: non-small cell lung cancer, long non-coding RNA EGFR-AS1, microRNA-449a, histone deacetylase 1, competing endogenous RNA
Introduction
Lung cancer is the leading cause of death worldwide, accounting for ~80% of individuals suffering from non-small-cell lung cancer (NSCLC) (1). Although NSCLC treatment has markedly improved in the past few decades, NSCLC 5 year survival rate remains <20% (1). NSCLC is a heterogeneous malignancy with different subtypes and clinical indications. Therefore, different treatment strategies are required for this disease (2). The association between cell signals, tumor microenvironment and prognosis has provided a unique biological basis for the development of NSCLC in individual patients (3,4). The ultimate goal of cancer research is to develop a strategy that prevents tumor progression and improves prognosis. Therefore, identification of new biomarkers and therapeutic targets such as oncogene regulators is paramount for the treatment and prognosis of cancer patients.
Histone deacetylase 1 (HDAC1) is one of the most important epigenetic regulatory mechanisms for the removal of acetyl groups from histones. A number of studies indicate that HDAC1 is associated with cancer development. HDAC1, for instance, is a short interfering (si)RNA inhibitor that causes the cessation of the cell cycle, the inhibition of the growth and the death of the tumor cells in the colon (5,6). By contrast, HDAC1 overexpression can lead to gastric cancer cell proliferation and expansion, indicating that HDAC1 promotes cancer cell growth (7). Another study reported that HDAC1 can inhibit pancreatic cancer cell migration by binding to the CDH1 promoter and downregulating E-cadherin expression (8). HDAC1 overexpression has been reported in various types of cancer. The level of HDAC1 is commonly associated with the clinical characteristics and prognosis in patients with cancer (9-11). HDAC1 has been demonstrated to be upregulated in lung carcinoma (12,13), but its precise molecular mechanism remains to be elucidated.
More recently, long non-coding (lnc)RNAs have been found to be critical in the process of epigenetic control. Part of the lncRNAs may be involved in the regulation of gene and the other may serve as a substrate for the interaction between the protein and the protein, or as competing endogenous RNAs (ceRNAs) which attach to the microRNAs (miRNAs/miRs) (14,15). lncRNAs are aberrantly expressed in almost all types of cancer and may be involved in the regulation of the proliferation, drug-resistance and metastasis of cancer cells (16-18). Earlier research demonstrated that EGFR-AS1 enhances proliferation and invasion of liver cancer cells by accelerating the cell cycle (19). EGFR-AS1 is known to facilitate the development of chemotherapeutic resistance and is associated with poor outcomes in NSCLC (20). However, the expression and functions of EGFR-AS1 in NSCLC remain to be elucidated. miR-449 resides at the 2nd intron of CDC20 on chromosome 5. Genome-wide association study has shown this region (5q11.2) to be a powerful tumor sensitive locus (21). miR-449a is at a low level in some types of cancer, such as stomach (22), lung (23), breast (24), glioma (25), hepatic (26), ovary (27), retinoblastoma (28) and endometrium (29). miR-449a has been shown to be a strong inducer of cell apoptosis, cell cycle arrest and cell differentiation (30). In addition, miR-449a is associated with the development, proliferation and differentiation of cancer cells. The mechanism of EGFR-AS1 and HDAC1 in lung cancer requires detailed analysis and the role of miR-449a in lung cancer remains to be elucidated. Biological information predicts that EGFR-AS1 and HDAC1 3'-UTR are associated with miR-449a (31). It was hypothesized that EGFR-AS1 may be a ceRNA of miR-449a and upregulates HDAC1 to promote NSCLC proliferation, invasion and metastasis. Therefore, the present study proposed a new signaling axis, EGFR-AS1-miR-449a-HDAC1, involved in the progression of NSCLC.
To evaluate the role of EGFR-AS1-miR-449a-HDAC1 in malignant NSCLC, the present study studied its role in cancer progression in A549 and PC9. EGFR-AS1, miR-449a and HDAC1 were compared and their association was analyzed in patients with lung cancer and in surrounding tissues. The present study revealed that EGFR-AS1 sponges miR-449a and subsequently upregulates HDAC1, which promotes the malignant progression of NSCLC.
Materials and methods
Gene expression profiling using public databases
RNA-sequencing expression profiles and corresponding clinical information for lung carcinoma were downloaded from The Cancer Genome Atlas (TCGA) dataset (https://portal.gdc.com). The University of Alabama at Birmingham cancer data analysis portal (UALCAN; https://ualcan.path.uab.edu) was used for analysis.
Patient specimens
Between July 2022 and May 2023, 80 specimens of lung carcinoma and their adjacent tissues (>5 cm away from the cancerous tissue) resected surgically were collected, all of which were from Department of Respiratory Medicine, Shanghai Xuhui Central Hospital, Fudan University (Shanghai, China). All specimens were frozen in liquid nitrogen for RNA extraction. All participating patients gave their written informed consent. The present study was approved by the Shanghai Xuhui Central Hospital's Ethics Committee (approval no. 2022021).
Cell culture and transfection
MRC-5, A549, HCC827, PC9 and HCC2935 were from Authenticated Cell Cultures. MRC-5 and HCC2935 were cultured using DMEM medium (Invitrogen; Thermo Fisher Scientific, Inc.) containing 10% FBS (Invitrogen; Thermo Fisher Scientific, Inc.), 100 U/ml penicillin G, 100 U/ml streptomycin sulfate, and 2 mM L-glutamine. A549 cells were cultured using F12K medium (Invitrogen; Thermo Fisher Scientific, Inc.) containing 10% FBS (Invitrogen; Thermo Fisher Scientific, Inc.), 100 U/ml penicillin G, 100 U/ml streptomycin sulfate, and 2 mM L-glutamine. PC9 and HCC827 were cultured using RPMI1640 medium (Invitrogen; Thermo Fisher Scientific, Inc.) containing 10% FBS (Invitrogen; Thermo Fisher Scientific, Inc.), 100 U/ml penicillin G, 100 U/ml streptomycin sulfate, and 2 mM L-glutamine. The cells were cultured in a 37˚C incubator containing 5% CO2.
The siRNA targeting EGFR-AS1 and HDAC1, si-NC, miR-449a mimics, miR-449a inhibitor, miR-NC and inhibitor NC were all purchased from Shanghai Genechem Co., Ltd. For transfection, cells were seeded in 24 well plates at 5,000 cells per well or 800,000 per 15 cm dish and 10 nM siRNA, si-NC, miR-449a mimics, miR-449a inhibitor, miR-NC or inhibitor NC were transfected (at 37˚C) into cells, respectively, using Lipofectamine 3000® (Invitrogen; Thermo Fisher Scientific, Inc.) according to the manufacturer's instructions. At 48 h after the transfection, cells were subjected to RNA isolation or western blotting. The siRNA, miRNA mimics and miRNA inhibitors sequences used were: si-EGFR-AS1-1, sense (SS): 5'-GCAAGTTGAGTGCAAATAACT-3', anti-sense (AS): 5'-TTATTTGCACTCAACTTGCTA-3'; si-EGFR-AS-2, SS: 5'-CCACAGTATTCACAAAGAATT-3', AS: 5'-TTCTTTGTGAATACTGTGGTG-3'; si-HDAC1-1, SS: 5'-CAGCGATGACTACATTAAATT-3', AS: 5'-TTTAATGTAGTCATCGCTGTG-3'; si-HDAC1-2, SS: 5'-GCTTCAATCTAACTATCAAAG-3', AS: 5'-TTGATAGTTAGATTGAAGCAA-3'; miR-449a mimics, SS:5'-TGGCAGTGTATTGTTAGCTGGT-3', AS: 5'-ACCAGCTAACAATACACTGCCA-3'; miR-449a inhibitor, SS: 5'-AGGCTCACATAATCAATCGACCA-3', AS: 5'-TGGCAGTGTATTGTTAGCTGGT-3'; miR-NC, SS: 5'-GCATCAAGGTGAACTTCAAGA-3', AS: 5'-TCTTGAAGTTCACCTTGATGC-3'; inhibitor-NC, SS: 5'-GCATCAAGGTGAACTTCAA-3', AS: 5'-TTGAAGTTCACCTTGATGC-3'.
Reverse transcription-quantitative (RT-q) PCR
Total RNA was obtained from the cells as instructed by the manufacturer with TRIzol® reagent (Thermo Fisher Scientific, Inc.). The RNA of clean and concentrated samples was measured using a Spectrometer (Thermo Fisher Scientific, Inc.) and the absorbance was between 260-280 nm. The cDNA synthesis was carried out based on the instructions of the miScript II RT Kit (Qiagen). Briefly, 1 µg total RNA was added to 12 µl DEPC treated water, 2 µl miScript Reverse Transcriptase Mix (Qiagen GmbH), 2 µl miScript Nucleics Mix (Qiagen GmbH) and 4 µl 5x miScript HiSpec buffer (Qiagen GmbH). After incubating at 37˚C for 60 min the mixture was heated to 95˚C for 5 min to terminate the reaction. Using commercialized primers TaqMan Universal Mix II No UNG plus specific PCR primers (Thermo Fisher Scientific, Inc.) were used to detect the expression level of miR-449a according to the manufacturer's instructions. Amplification was performed on the ABI StepOne Plus system (Applied Biosystems; Thermo Fisher Scientific, Inc.). Using U6 as the internal reference, the 2-ΔΔCq method was used to calculate the relative expression level of miR-449a (32). The quantitative detection of EGFR-AS1 and HDAC1 mRNA was also performed on the ABI StepOne Plus system. Using GAPDH as an internal reference, the 2-ΔΔCq method was used to calculate the relative expression level of mRNAs (32). The incubation conditions were as follows: 95˚C for 30 sec, followed by 40 cycles at 95˚C for 8 sec and 60˚C for 30 sec. All experiments were repeated three times. Sequences of primers for amplification are given in Table I.
Table I.
Primers used in the present study.
| Primer | Direction | Sequence (5'-3') |
|---|---|---|
| EGFR-AS1 | Forward | GAGAGGCACGTCAGTGTGG |
| Reverse | GCGTAAACGTCCCTGTGCTA | |
| HDAC1 | Forward | GACGGACCGACTGACGGTAG |
| Reverse | AGTCATGCGGATTCGGTGAG | |
| GAPDH | Forward | TTTTGCGTCGCCAGCC |
| Reverse | ATGGAATTTGCCATGGGTGGA | |
| U6 | Forward | CTCGCTTCGGCAGCACA |
| Reverse | AACGCTTCACGAATTTGCGT |
Cell viability
Cell survival was measured by Cell Counting Kit-8 (Beyotime Institute of Biotechnology). The exponentially growing cells were seeded at a density of 2,000 cells per well in 96-well plates and incubated overnight at 37˚C. Then, the cells were treated with 10 µl CCK-8 for 4 h at 48 h after transfection. Absorbance density (OD, 450 nm) was measured using a microplate reader (Thermo Fisher Scientific, Inc.). Experimental study was conducted on six replicate wells per group.
Invasion and migration analysis
The cells were subjected to trypsinization, dilution in serum free medium and seeded at 50,000 cells per Transwell chamber (8 µm pore size; Corning) with or without Matrigel (BD Biosciences). Matrigel was frozen and thawed overnight at 4˚C on ice, diluted with Opti-MEM medium (Thermo Fisher Scientific, Inc.) at a ratio of 1:3 and mixed with precooled pipette tips to form a homogenized Matrigel matrix. The Transwell chamber was placed on ice, the diluted Matrigel with a concentration of 50 µl/cm2 growth area was added and it was left at 37˚C for 30 min before use. The culture medium with 10 percent of FBS was put into the wells and incubated for 12 h. The cells were fixed with 4% paraformaldehyde (MilliporeSigma) for 30 min at room temperature and stained with 0.1% crystal violet (MilliporeSigma) staining solution for 15 min at room temperature . Subsequently, three randomly selected fields of vision were analyzed and the number of cells that migrated through each insert was counted under a light microscope using a 20x objective. Each experiment was conducted in triplicate.
Dual luciferase reporter gene assay
The pmirGLO plasmid (1 µg; Promega Corporation) was digested with DraI and XbaI (Thermo Fisher Scientific, Inc.) according to the manufacturer's protocol. Insert DNA containing a wild-type miR-449a binding site (ACTGCC) or a mutant miR-449a binding site (TGACGG) was purchased from Shanghai Genechem Co., Ltd. Oligonucleotides were hybridized at 90˚C, then cooled to 4˚C over 5 min, and finally kept at 4˚C for 60 min. Hybridized inserts were ligated with T4 ligase (200 U, 10 µl reaction, 1:10 vector/insert ratio; Thermo Fisher Scientific, Inc.) into a multiple cloning site of pmirGLO downstream of the firefly luciferase gene for construct wild-type (wt-pmirGLO pGL3-EGFR-AS1) and mutant (mut-pmirGLO pGL3-EGFR-AS1) luciferase reporter plasmid. To identify EGFR-AS1 and miR-449a targets, wt-pmirGLO EGFR-AS1 or mut-pmirGLO-EGFR-AS1 were co-transfected with miR-449a mimics into HEK293 cells Lipofectamine 3000® (Invitrogen; Thermo Fisher Scientific, Inc.) according to the manufacturer's instructions. At 48 h after transfection, a dual luciferase assay kit (Promega Corporation) was used to lyse cells.
To study the interaction between HDAC1 3'-UTR and miR-449a targets, the pmirGLO plasmid (1 µg; Promega Corporation) was digested with DraI and XbaI (Thermo Fisher Scientific, Inc.) according to the manufacturer's protocol. Insert DNA containing a wild-type miR-449a binding site (CACTGCC) or a mutant miR-449a binding site (CTGACGG) was purchased from Shanghai Genechem Co., Ltd. Oligonucleotides were hybridized at 90˚C, then cooled to 4˚C over 5 min, and finally kept at 4˚C for 60 min. Hybridized inserts were ligated with T4 ligase (200 U, 10 µl reaction, 1:10 vector/insert ratio; Thermo Scientific) into a multiple cloning site of pmirGLO downstream of the firefly luciferase gene for construct HDAC1 3'-UTR wild-type (wt-pmirGLO-HDAC1 3'-UTR) and mutant (mut-pmirGLO-HDAC1 3'-UTR) luciferase reporter plasmid. Wild-type (wt-pmirGLO-HDAC1 3'-UTR) and or EGFR-AS1 (mut-pmirGLO-HDAC1 3'-UTR) luciferase reporters were co-transfected with miR-449a mimics into 293 cells using Lipofectamine 3000® (Invitrogen; Thermo Fisher Scientific, Inc.) according to the manufacturer's instructions. At 48 h after transfection, a dual luciferase assay kit (Promega Corporation) was used to lyse cells. The test was carried out on the basis of the activity of Renilla luciferase.
A Panomis Luminometer (Affymetrix; Thermo Fisher Scientific, Inc.) was used with a standard method to measure the activity of Renilla luciferase.
RNA immunoprecipitation (RIP)
The RIP was conducted according to manufacturer's instructions of EZMagna RIP kit (cat. no. 17-701; MilliporeSigma). The A549 cells were cultured to 80-80% confluence, then lysed with RIP lysis buffer (Millipore Sigma). The protein A/G magnetic beads underwent incubation with 5 µg antibodies specific for argonaute-(Ago)2 (cat. no. SAB4200085; MilliporeSigma) or normal murine IgG (cat. no. A7031; Beyotime Institute of Biotechnology) for 30 min at room temperature. The beads underwent incubation at 4˚C overnight with cell lysates after being washed three times with RIP wash buffer. The RNA purity and the concentration RNA was measured with a Nextwave TT 1000 spectrophotometer (Thermo Fisher Scientific, Inc.), determined at a 260-280 nm absorption. The RNeasy Micro Kit (Qiagen GmbH) was used for purification of RNA and quantification with qPCR. RT-qPCR was used to detect the co-precipitated RNA. The input % was utilized for calculating enrichment level of RNA.
Western blotting
The cells were lysed using Cell Lysis Solution (MilliporeSigma) at 4˚C with gentle agitation for 5 min at 1,000 rpm. Equal amounts (20 µg) of protein were determined using a BCA protein assay kit (Thermo Fisher Scientific, Inc.) and separated on 10% SDS-PAGE gels, and transferred onto PVDF membranes (Cytiva). After blocking with 5% skimmed milk at room temperature for 2 h, the membranes were incubated overnight at 4˚C with anti-HDAC1 antibody (cat. no. ab68436; Abcam; 1:1,000) and anti-β-actin antibody (cat. no. ab8226; Abcam; 1:2,000). After washing TBST buffer (0.1% Tween-20; Beyotime Institute of Biotechnology), the membranes were incubated with HRP-labeled goat anti-mouse IgG (cat. no. ab205719, Abcam; 1:50,000) at room temperature for 1 h. After washing the membranes three times, ECL luminescent solution (Thermo Fisher Scientific Inc.) was applied to the membranes and the results were observed on an Imagequant LAS4000 (Cytiva). The density of each band was quantified using ImageJ software (National Institutes of Health).
Statistical analysis
All analyses were performed using SPSS 20.0 (IBM Corp.). Data are presented as mean ± SD. A paired two-tailed t-test was used to compare EGFR-AS1, miR-449a and HDAC1 expression in lung carcinoma and their paired adjacent tissues. The unpaired Student's t-test was used to compare the significance between two groups, and one-way ANOVA and Tukey's post hoc test were used for multiple comparisons. The relationship of the EGFR-AS1 and miR-449a, HDAC1 and miR-449a, EGFR-AS1 and HDAC1 was measured with Pearson's correlative test. P<0.05 was considered to indicate a statistically significant difference.
Results
EGFR-AS1 and HDAC1 are upregulated, while miR-449a is downregulated, in NSCLC
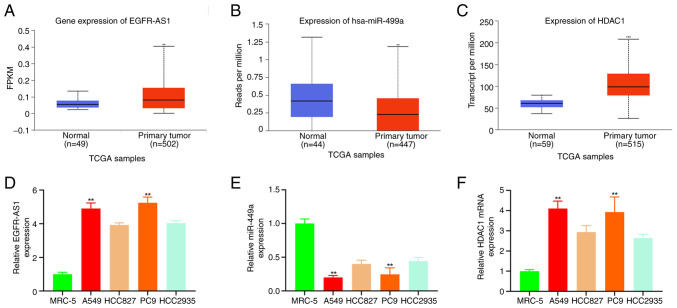
UALCAN analysis of TCGA NSCLC showed a significant increase of EGFR-AS1 and HDAC1 in NSCLC (Fig. 1A and C), while the levels of miR-449a were lower (Fig. 1B) compared with adjacent tissues. Furthermore, qPCR findings indicated that EGFR-AS1 and HDAC1 were more highly expressed in A549, HCC827, PC9 and HCC2935 cells (NSCLC) compared with MRC-5 cells (healthy lung fibroblast), with the greatest expression in A549 and PC9 (Fig. 1D and F). A contrary tendency was seen with miR-449a (Fig. 1E). Thus, A549 and PC9 were chosen for the next experiment.
Figure 1.
TCGA and qPCR were employed to measure EGFR-AS1, miR-449a and HDAC1 in NSCLC. (A) UALCAN test for NSCLC (EGFR-AS1) in NSCLC and adjacent tissues in TCGA samples. **P<0.01 compared with adjacent tissues. (B) UALCAN test for miR-449a was expressed in NSCLC and adjacent tissues in TCGA samples. **P<0.01 compared with normal adjacent tissues. (C) UALCAN analysis of HDAC1 expression in NSCLC cancer and adjacent tissues of TCGA data. ***P<0.01 compared with normal adjacent tissues. Quantification of (D) EGFR-AS1 expression (E) miR-449a expression and (F) HDAC1 expression in MRC-5 and NSCLC with qPCR. **P<0.01. TCGA, The Cancer Genome Atlas; qPCR, quantitative PCR; HDAC1, histone deacetylase 1; University of Alabama at Birmingham cancer data analysis portal; NSCLC, non-small-cell lung cancer; miR, microRNA.
Effect of EGFR-AS1 on proliferation, invasion, and metastasis of NSCLC
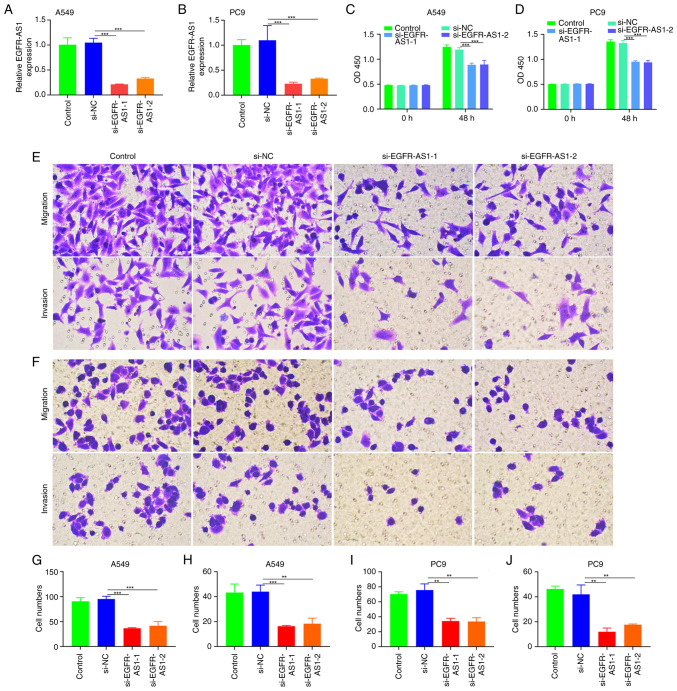
To investigate the role of EGFR-AS1 in NSCLC, siRNAs were used to inhibit EGFR-AS1 expression in A549 and PC9 cells (Fig. 2A and B). The CCK-8 assay showed that EGFR-AS1 markedly reduced A549 and PC9 proliferation (P<0.01; Fig. 2C and D). Furthermore, invasion and migration assays demonstrated that EGFR-AS1 could markedly inhibit A549 and PC9 in tumor cells (Fig. 2E-J).
Figure 2.
Influence of EGFR-AS1 on the proliferation, invasion and metastasis of NSCLC. Quantification of EGFR-AS1 expression during the transfer of siEGFR-AS1 to (A) A549 cells and (B) PC9 cells. The viability of EGFR-AS1-silenced (C) A549 cells and (D) PC9 cells according to the CCK-8 assay. Migration and invasion of EGFR-AS1-silenced (E, G and H) A549 cells and (F, I and J) PC9 cells (magnification, x200). **P<0.01; ***P<0.001. NSCLC, non-small-cell lung cancer; si, short interfering.
Inhibition of tumor growth, invasion and metastasis by miR-449a in NSCLC
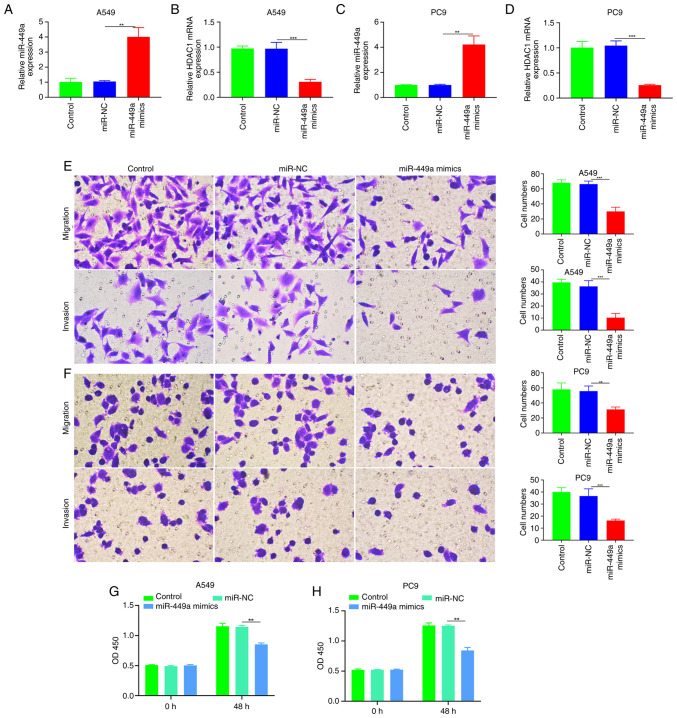
In order to investigate the influence of miR-449a on A549 and PC9 cells, the influence of miR-449a on tumor growth, invasion and metastasis in NSCLC was investigated (Fig. 3A-D). The results showed that A549 and PC9 were significantly affected (P<0.01) and were also aggressive and metastatic (Fig. 3E and F).
Figure 3.
Effect of miR-449A on cell proliferation and metastasis in NSCLC. (A) qPCR quantification of the expression of (A) miR-449a and (B) HDAC1 in A549 cells transfected with miR-449a mimics. (C) qPCR quantification of (C) miR-449a and (D) HDAC1 expression in PC9 cells transfected with miR-449a. Migration and invasion of (E) A549 and (F) PC9 cells transfected with miR-449a mimics (magnification, 200). Viability of (G) A549 and (H) PC9 cells transfected with miR-449a. **P<0.01; ***P<0.001. NSCLC, non-small-cell lung cancer; qPCR, quantitative PCR; miR, microRNA.
Inhibition of HDAC1 on proliferation, invasion and metastasis of NSCLC
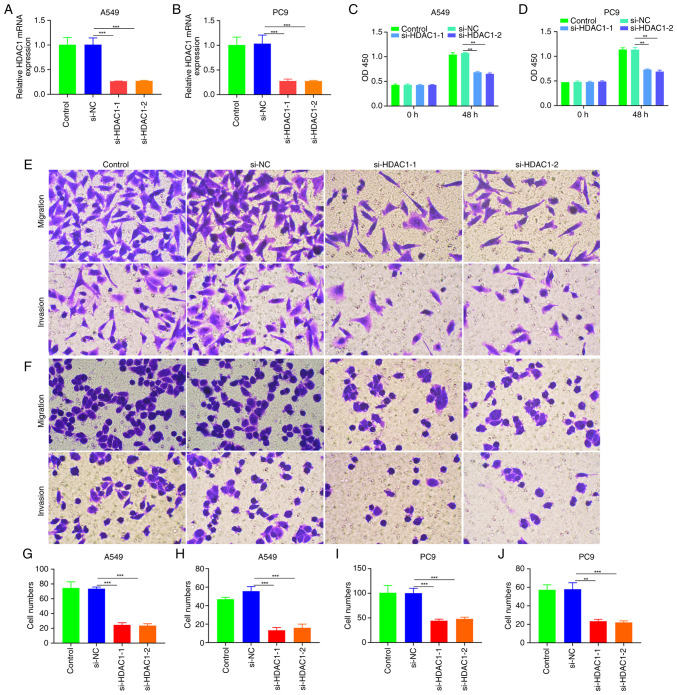
HDAC1 siRNA was used to transfect A549 and PC9 cells and investigate the downregulation of HDAC1 on proliferation, invasion and metastasis (Fig. 4A and B). CCK-8 demonstrated that HDAC1 could significantly inhibit invasion and metastasis of A549, PC9 and A549 cells (P<0.01; Fig. 4C-J).
Figure 4.
Effect of HDAC1 downregulation on NSCLC cell proliferation, invasion and metastasis. Quantification of the mRNA of HDAC1 in HDAC1 siRNA transfection in (A) A549 cells and (B) PC9 cells. the proliferation of HDAC1-silenced (C) A549 cells and (D) PC9 cells. Migration and invasion of HDAC1-silenced (E, G and H) A549 and (F, I and J) PC9 cells (magnification, 200). **P<0.01; ***P<0.001. HDAC1, histone deacetylase 1; NSCLC, non-small-cell lung cancer; si, short interfering.
Co-transfection of EGFR-AS1 and with miR-449a inhibitor can abrogate the effect of EGFR-AS1 silencing on HDAC1 expression
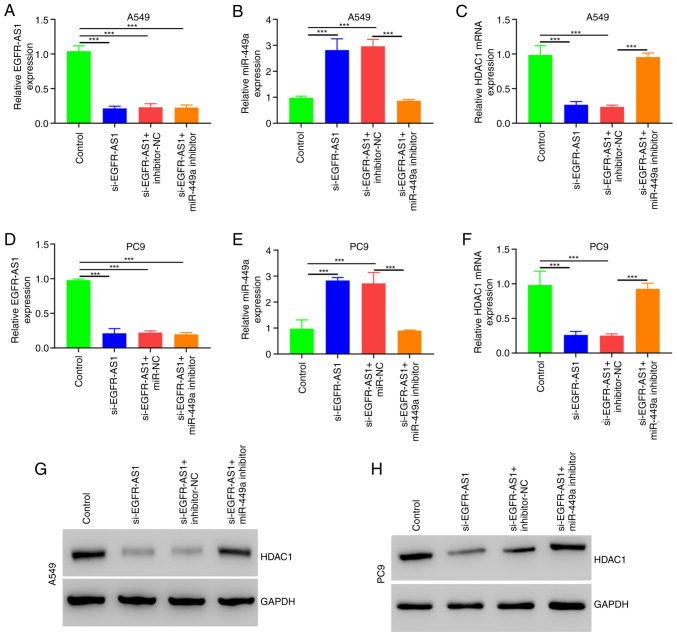
Using siEGFR-AS1, miR-449a, A549 and PC9 cells were cotransfected to study their HDAC1 expression. Western blotting and qPCR demonstrated partial restoration of HDAC1 in the siEGFR-AS1 + miR-449a inhibitors versus siEGFR-AS1 (Fig. 5 and Fig. S1).
Figure 5.
Effect of EGFR-AS1 on miR-449a and HDAC1 expression in NSCLC cells. Quantification of (A) EGFR-AS1, (B) miR-449a and (C) HDAC1 mRNA expression in A549 cells cotransfected with siEGFR-AS1 and miR-449a inhibitor. (D) EGFR-AS1, (E) miR-449a and (F) HDAC1 mRNA in PC9 cells cotransfected with siEGFR-AS1 and miR-449a inhibitor. (G) Quantification of HDAC1 in A549 cells cotransfected with siEGFR-AS1 and miR-449a inhibitor as detected by western blotting. (H) Quantification of HDAC1 in PC9 cells cotransfected with siEGFR-AS1 and miR-449a inhibitor as detected by western blotting. ***P<0.001. miR, microRNA; HDAC1, histone deacetylase 1; NSCLC, non-small-cell lung cancer; qPCR, quantitative PCR; si, short interfering.
EGFR-AS1, as a ceRNA, adsorbs miR-449a to promote the expression of HDAC1
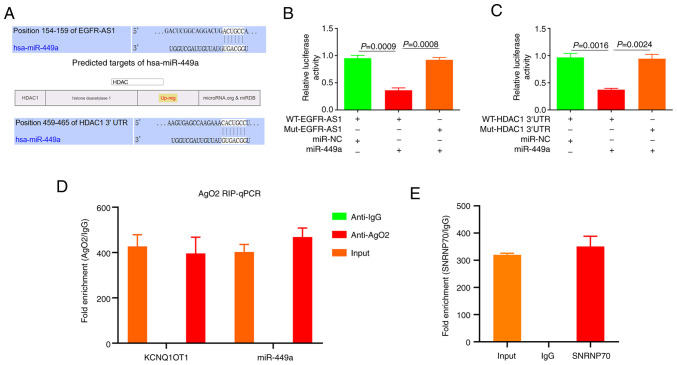
Using ENCORI and UALCAN (30) prediction, it was shown that there were binding sites between EGFR-AS1 and miR-449a, and between miR-449ap and HDAC1 3'-UTR (Fig. 6A). The results of luciferase reporter gene analysis showed that there were targeted regulatory effects between EGFR-AS1 and miR-449a (Fig. 6B) and between miR-449a and HDAC1 3'-UTR (Fig. 6C). miRNAs, which occur in the cytoplasm, form part of RISC (RNA-induced silencing complex). It has been demonstrated that Ago2 is a component of RISC, that is involved in the silencing of the miRNA-mediated gene (33). Subsequently, the SNRNP70 antibody was used as a positive control (Fig. 6E) and RNA immunoprecipitation (RIP) was performed using the Ago2 antibody to analyze whether EGFR-AS1 and miR-449ap were present in RISC. The results showed that Ago2 antibody could enrich EGFR-AS1 and miR-449ap compared to the control (IgG) (Fig. 6D). These results suggest that EGFR-AS1 regulates the miR-449a/HDAC1 pathway through ceRNA in NSCLC.
Figure 6.
EGFR-AS1 plays the role of ceRNA and regulates HDAC1 with miR-449a. (A) ENCORI predicted the EGFR-AS1 and the miR-449a binding sites of the HDAC1 3'-UTR the respective wild type and mutated luciferase reporter vectors. (B) Luciferase assay for EGFR-AS1 and miR-449a for the specific association of EGFR-AS1 with miR-449a. (C) Luciferase assay test for the specific association of miR-449a with HDAC1 3'-UTR. (D) Ago2-RIP enrichment for EGFR-AS1 and miR-449a. (E) SNRNP70-RIP (positive control). ce, competing endogenous; HDAC1, histone deacetylase 1; miR, microRNA; Ago, argonaute-; RIP, RNA immunoprecipitation.
EGFR-AS1-miR-449a-HDAC1 signaling is present in NSCLC tissues
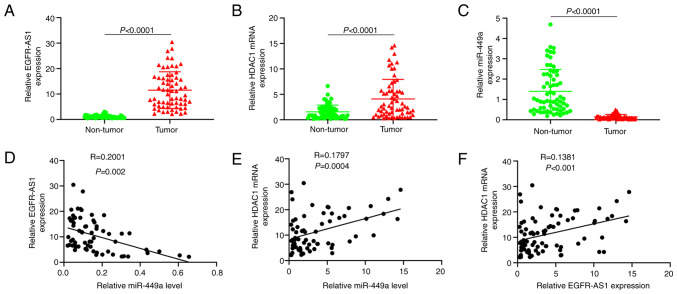
The results of qPCR showed that among 80 patients with NSCLC, EGFR-AS1 and HDAC1 mRNA were highly expressed in tumor tissues and lowly expressed in paracancerous tissues (Fig. 6A and B). miR-449a was lowly expressed in tumor tissues and highly expressed in paracancerous tissues (Fig. 7C). Furthermore, it was found that the expression levels of EGFR-AS1 and HDAC1 mRNA were negatively correlated with miR-449a (Fig. 7D and E), while the expression levels of EGFR-AS1 was positively correlated with HDAC1 mRNA (Fig. 7F).
Figure 7.
Study on the Clinical Significance of EGFR-AS1-miR-449a-HDAC1 in patients with NSCLC. qPCR quantitation of (A) EGFR-AS1 (B) miR-449a and (C) HDAC1 mRNA quantification in NSCLC and adjacent tissues. Correlation between the expression levels of (D) EGFR-AS1 miR-449a and (E) correlation between the expression levels of HDAC1 and miR-449a. (F) The correlation between the expression levels of EGFR-AS1 and HDAC1 mRNA. miR, microRNA; HDAC1, histone deacetylase 1; NSCLC, non-small-cell lung cancer; qPCR, quantitative PCR.
Discussion
It has been demonstrated that lncRNAs are essential for a number of types of human cancer (34). In addition, lncRNAs may be involved in the development of tumors by regulating ceRNA and downregulating gene expression. ceRNAs are lncRNAs and circular RNAs (circRNAs), which compete for miRNAs with mRNAs. It has been demonstrated that different lncRNAs are involved in the development and development of NSCLC and progressing as ceRNAs (35). EGFR-AS1, a newly discovered lncRNA, has been implicated in NSCLC (20), gastric cancer (36) and bladder cancer (37). EGFR-AS1 expression is significantly upregulated in NSCLC tissues and cell lines, and is positively correlated with poor prognosis (20). In addition, EGFR-AS1 inhibits the miR-381/ROCK2 axes (37). The present study analyzed the expression levels of EGFR-AS1 in lung cancer and adjacent tissues. The results showed that the expression level of EGFR-AS1 in cancer tissues was significantly higher compared with that in adjacent tissues. The expression level of EGFR-AS1 in NSCLC cells A549 and PC9 was also significantly higher compared with that in normal lung fibroblasts MRC-5. Downregulating the expression of EGFR-AS1 in A549 and PC9 cells inhibited proliferation, invasion and metastasis. These results suggest that EGFR-AS1 plays an oncogenic role in NSCLC.
miRNAs are mainly involved in the post transcriptional regulation of target genes. They are involved in the regulation of a variety of biological processes, including the occurrence and development of tumors. miRNAs have also been implicated in the therapeutic and prognostic effects of cancer. A number of trials have examined the particular role that miRNAs play in the formation and progression of NSCLC (38-40). The bioinformatic prediction of the present study showed that there was an EGFR-AS1 binding site at miR-449a and that EGFR-AS1 was then identified as a specific binding of EGFR-AS1 to miR-449a using a luciferase reporter and RIP assays. The relationship between EGFR-AS1 And miR-449a was also found in NSCLC. Jiang et al (24) demonstrated that the inhibition of CREPT-mediated Wnt/β-catenin signaling can inhibit the development of breast cancer. It has been shown that miR-449a is a useful diagnostic and prognostic indicator of glioma (25). In addition, miR-449a has been shown to be antioncogenic in gastric cancer (22), lung cancer (23), glioma (25), hepatic cell carcinoma (26), ovarian cancer (27), retinoblastoma (28) and endometrium (29). The present study discovered a significant decrease in the expression of miR-449a in NSCLC compared with adjacent tissue or healthy lung fibroblasts, indicating that it may be able to suppress the proliferation, invasion and metastasis of NSCLC. Together, the findings suggested that miR-449a may also be involved in the progression of NSCLC.
Epigenetic modifications, such as histone acetylation, are critical for regulating gene expression. It has been demonstrated that pathological epigenetic changes in cancer cells facilitate and sustain the growth and progression of tumors (41). Histone acetylases and deacetylases regulate gene expression by regulating histone acetylation (42). HDAC1 participates extensively in transcription control, which is crucial for cancer development. The results of TCGA and qPCR demonstrated the high expression of HDAC1 in NSCLC. The luciferase reporter and RIP findings showed that the HDAC1 3'-UTR is specifically associated with the inhibition of HDAC1. In addition, there was a negative correlation between miR-449a and HDAC1 mRNA in NSCLC. In addition, EGFR-AS1 downregulation or miR-449a upregulation may suppress HDAC1 expression in NSCLC cells, thus suppressing its proliferation, invasion and metastasis. Overall, EGFR-AS1 is associated with NSCLC proliferation, invasion and metastasis by regulating the miR-449a-HDAC1 axis. Although the present study found a correlation between the expression levels of EGFR-AS1, miR-449a and HDAC1 in NSCLC tissues, it was unclear whether the high expression level changes only occurred in specific cells. In the future, single-cell sequencing will be used to analyze their expression levels in different cells of NSCLC tissues. This will contribute to a more comprehensive understanding of the mechanisms through which EGFR-AS1 and HDAC1 operates in NSCLC. Network pharmacology could possibly be used to screen inhibitors for them for the treatment of NSCLC (43).
In conclusion, the present study found that EGFR-AS1 expression level was upregulated in NSCLC and it served as a molecular sponge to antagonize miR-449a, upregulate the expression of HDAC1 and promote the occurrence and development of NSCLC. The results suggested that upregulating miR-449a or downregulating EGFR-AS1 and HDAC1 expression might be an effective approach to inhibit NSCLC cancer. The present study revealed a new mechanism of NSCLC progression, providing new targets for cancer treatment.
Supplementary Material
Acknowledgements
Not applicable.
Funding Statement
Funding: The present study was supported by a grant from Medical Research Project of Xuhui District, Shanghai, China (grant no. SHXH202006) and a grant from Health system peak discipline construction Project of Xuhui District, Shanghai (grant no. SHXHZDXK202312).
Availability of data and materials
The data generated in the present study may be requested from the corresponding author.
Authors' contributions
BW designed the experiments. JH, QW, LW and CG obtained, analyzed and interpreted the data. JH drafted the manuscript and BW revised the manuscript. JH and BW confirm the authenticity of all the raw data. All authors read and approved the final manuscript.
Ethics approval and consent to participate
The Ethics Committee of Shanghai Xuhui Central Hospital (Shanghai, China) approved the present study protocol (approval no. 2022021). Written informed consent was obtained from all participants in the present study.
Patient consent for publication
Not applicable.
Competing interests
The authors declare that they have no competing interests.
References
- 1.Alexander M, Kim SY, Cheng H. Update 2020: Management of non-small cell lung cancer. Lung. 2020;198:897–907. doi: 10.1007/s00408-020-00407-5. [DOI] [PMC free article] [PubMed] [Google Scholar]
- 2.Wu F, Fan J, He Y, Xiong A, Yu J, Li Y, Zhang Y, Zhao W, Zhou F, Li W, et al. Single-cell profiling of tumor heterogeneity and the microenvironment in advanced non-small cell lung cancer. Nat Commun. 2021;12(2540) doi: 10.1038/s41467-021-22801-0. [DOI] [PMC free article] [PubMed] [Google Scholar]
- 3.Shinohara S, Takahashi Y, Komuro H, Matsui T, Sugita Y, Demachi-Okamura A, Muraoka D, Takahara H, Nakada T, Sakakura N, et al. New evaluation of the tumor immune microenvironment of non-small cell lung cancer and its association with prognosis. J Immunother Cancer. 2022;10(e003765) doi: 10.1136/jitc-2021-003765. [DOI] [PMC free article] [PubMed] [Google Scholar]
- 4.Sun X, Chen P, Chen X, Yang W, Chen X, Zhou W, Huang D, Cheng Y. KIF4A enhanced cell proliferation and migration via Hippo signaling and predicted a poor prognosis in esophageal squamous cell carcinoma. Thorac Cancer. 2021;12:512–524. doi: 10.1111/1759-7714.13787. [DOI] [PMC free article] [PubMed] [Google Scholar]
- 5.Injinari N, Amini-Farsani Z, Yadollahi-Farsani M, Teimori H. Apoptotic effects of valproic acid on miR-34a, miR-520h and HDAC1 gene in breast cancer. Life Sci. 2021;269(119027) doi: 10.1016/j.lfs.2021.119027. [DOI] [PubMed] [Google Scholar]
- 6.Thangaraju M, Carswell KN, Prasad PD, Ganapathy V. Colon cancer cells maintain low levels of pyruvate to avoid cell death caused by inhibition of HDAC1/HDAC3. Biochem J. 2009;417:379–389. doi: 10.1042/BJ20081132. [DOI] [PubMed] [Google Scholar]
- 7.Wu S, Wu E, Wang D, Niu Y, Yue H, Zhang D, Luo J, Chen R. LncRNA HRCEG, regulated by HDAC1, inhibits cells proliferation and epithelial-mesenchymal-transition in gastric cancer. Cancer Genet. 2020;241:25–33. doi: 10.1016/j.cancergen.2019.12.007. [DOI] [PubMed] [Google Scholar]
- 8.Aghdassi A, Sendler M, Guenther A, Mayerle J, Behn CO, Heidecke CD, Friess H, Büchler M, Evert M, Lerch MM, Weiss FU. Recruitment of histone deacetylases HDAC1 and HDAC2 by the transcriptional repressor ZEB1 downregulates E-cadherin expression in pancreatic cancer. Gut. 2012;61:439–448. doi: 10.1136/gutjnl-2011-300060. [DOI] [PubMed] [Google Scholar]
- 9.Zhang Y, Nalawansha DA, Herath KE, Andrade R, Pflum MKH. Differential profiles of HDAC1 substrates and associated proteins in breast cancer cells revealed by trapping. Mol Omics. 2021;17:544–553. doi: 10.1039/d0mo00047g. [DOI] [PMC free article] [PubMed] [Google Scholar]
- 10.Banerjee A, Mahata B, Dhir A, Mandal TK, Biswas K. Elevated histone H3 acetylation and loss of the Sp1-HDAC1 complex de-repress the GM2-synthase gene in renal cell carcinoma. J Biol Chem. 2019;294:1005–1018. doi: 10.1074/jbc.RA118.004485. [DOI] [PMC free article] [PubMed] [Google Scholar]
- 11.Huang R, Zhang X, Sophia S, Min Z, Liu X. Clinicopathological features and prediction values of HDAC1, HDAC2, HDAC3, and HDAC11 in classical Hodgkin lymphoma. Anticancer Drugs. 2018;29:364–370. doi: 10.1097/CAD.0000000000000610. [DOI] [PMC free article] [PubMed] [Google Scholar]
- 12.Zhang L, Bu L, Hu J, Xu Z, Ruan L, Fang Y, Wang P. HDAC1 knockdown inhibits invasion and induces apoptosis in non-small cell lung cancer cells. Biol Chem. 2018;399:603–610. doi: 10.1515/hsz-2017-0306. [DOI] [PubMed] [Google Scholar]
- 13.Jiang C, Liao J, Yang F, Jiang T, Zhang D, Xin Y. The potential mechanism of HDAC1-Catalyzed histone crotonylation of Caspase-1 in nonsmall cell lung cancer. Evid Based Complement Alternat Med. 2022;2022(5049116) doi: 10.1155/2022/5049116. [DOI] [PMC free article] [PubMed] [Google Scholar] [Retracted]
- 14.Paraskevopoulou MD, Hatzigeorgiou AG. Analyzing miRNA-LncRNA Interactions. Methods Mol Biol. 2016;1402:271–286. doi: 10.1007/978-1-4939-3378-5_21. [DOI] [PubMed] [Google Scholar]
- 15.Ferrè F, Colantoni A, Helmer-Citterich M. Revealing protein-lncRNA interaction. Brief Bioinform. 2016;17:106–116. doi: 10.1093/bib/bbv031. [DOI] [PMC free article] [PubMed] [Google Scholar]
- 16.Martens-Uzunova ES, Böttcher R, Croce CM, Jenster G, Visakorpi T, Calin GA. Long noncoding RNA in prostate, bladder, and kidney cancer. Eur Urol. 2014;65:1140–1151. doi: 10.1016/j.eururo.2013.12.003. [DOI] [PubMed] [Google Scholar]
- 17.Zhang Y, Tang L. The Application of lncRNAs in cancer treatment and diagnosis. Recent Pat Anticancer Drug Discov. 2018;13:292–301. doi: 10.2174/1574892813666180226121819. [DOI] [PubMed] [Google Scholar]
- 18.Peng WX, Koirala P, Mo YY. LncRNA-mediated regulation of cell signaling in cancer. Oncogene. 2017;36:5661–5667. doi: 10.1038/onc.2017.184. [DOI] [PMC free article] [PubMed] [Google Scholar]
- 19.Qi HL, Li CS, Qian CW, Xiao YS, Yuan YF, Liu QY, Liu ZS. The long noncoding RNA, EGFR-AS1, a target of GHR, increases the expression of EGFR in hepatocellular carcinoma. Tumour Biol. 2016;37:1079–1089. doi: 10.1007/s13277-015-3887-z. [DOI] [PubMed] [Google Scholar]
- 20.Xue Y, Zhang J, Hou J, Wang X. EGFR-AS1 promotes nonsmall cell lung cancer (NSCLC) progression via downregulating the miR-524-5p/DRAM1 axis and inhibiting autophagic lysosomal degradation. J Oncol. 2022;2022(4402536) doi: 10.1155/2022/4402536. [DOI] [PMC free article] [PubMed] [Google Scholar]
- 21.Re M, Tomasetti M, Monaco F, Amati M, Rubini C, Sollini G, Bajraktari A, Gioacchini FM, Santarelli L, Pasquini E. MiRNome analysis identifying miR-205 and miR-449a as biomarkers of disease progression in intestinal-type sinonasal adenocarcinoma. Head Neck. 2022;44:18–33. doi: 10.1002/hed.26894. [DOI] [PMC free article] [PubMed] [Google Scholar]
- 22.Bou Kheir T, Futoma-Kazmierczak E, Jacobsen A, Krogh A, Bardram L, Hother C, Grønbæk K, Federspiel B, Lund AH, Friis-Hansen L. miR-449 inhibits cell proliferation and is down-regulated in gastric cancer. Mol Cancer. 2011;10(29) doi: 10.1186/1476-4598-10-29. [DOI] [PMC free article] [PubMed] [Google Scholar]
- 23.Luo W, Huang B, Li Z, Li H, Sun L, Zhang Q, Qiu X, Wang E. MicroRNA-449a is downregulated in non-small cell lung cancer and inhibits migration and invasion by targeting c-Met. PLoS One. 2013;8(e64759) doi: 10.1371/journal.pone.0064759. [DOI] [PMC free article] [PubMed] [Google Scholar]
- 24.Jiang J, Yang X, He X, Ma W, Wang J, Zhou Q, Li M, Yu S. MicroRNA-449b-5p suppresses the growth and invasion of breast cancer cells via inhibiting CREPT-mediated Wnt/DDD-catenin signaling. Chem Biol Interact. 2019;302:74–82. doi: 10.1016/j.cbi.2019.02.004. [DOI] [PubMed] [Google Scholar]
- 25.Tabibkhooei A, Izadpanahi M, Arab A, Zare-Mirzaei A, Minaeian S, Rostami A, Mohsenian A. Profiling of novel circulating microRNAs as a non-invasive biomarker in diagnosis and follow-up of high and low-grade gliomas. Clin Neurol Neurosurg. 2020;190(105652) doi: 10.1016/j.clineuro.2019.105652. [DOI] [PubMed] [Google Scholar]
- 26.Buurman R, Gürlevik E, Schäffer V, Eilers M, Sandbothe M, Kreipe H, Wilkens L, Schlegelberger B, Kühnel F, Skawran B. Histone deacetylases activate hepatocyte growth factor signaling by repressing microRNA-449 in hepatocellular carcinoma cells. Gastroenterology. 2012;143:811–820.e15. doi: 10.1053/j.gastro.2012.05.033. [DOI] [PubMed] [Google Scholar]
- 27.Yuan JM, Shi XJ, Sun P, Liu JX, Wang W, Li M, Ling FY. Downregulation of cell cycle-related proteins in ovarian cancer line and cell cycle arrest induced by microRNA. Int J Clin Exp Med. 2015;8:18476–18481. [PMC free article] [PubMed] [Google Scholar]
- 28.Yong-Ming H, Ai-Jun J, Xiao-Yue X, Jian-Wei L, Chen Y, Ye C. miR-449a: A potential therapeutic agent for cancer. Anticancer Drugs. 2017;28:1067–1078. doi: 10.1097/CAD.0000000000000555. [DOI] [PubMed] [Google Scholar]
- 29.Jang SG, Yoo CW, Park SY, Kang S, Kim HK. Low expression of miR-449 in gynecologic clear cell carcinoma. Int J Gynecol Cancer. 2014;24:1558–1563. doi: 10.1097/IGC.0000000000000267. [DOI] [PubMed] [Google Scholar]
- 30.Gupta S, Silveira DA, Mombach JCM. Modeling the role of microRNA-449a in the regulation of the G2/M cell cycle checkpoint in prostate LNCaP cells under ionizing radiation. PLoS One. 2018;13(e0200768) doi: 10.1371/journal.pone.0200768. [DOI] [PMC free article] [PubMed] [Google Scholar]
- 31.Li JH, Liu S, Zhou H, Qu LH, Yang JH. starBase v2.0: Decoding miRNA-ceRNA, miRNA-ncRNA and protein-RNA interaction networks from large-scale CLIP-Seq data. Nucleic Acids Res. 2014;42 (Database issue):D92–D97. doi: 10.1093/nar/gkt1248. [DOI] [PMC free article] [PubMed] [Google Scholar]
- 32.Livak KJ, Schmittgen TD. Analysis of relative gene expression data using real-time quantitative PCR and the 2(-Delta Delta C(T)) method. Methods. 2001;25:402–408. doi: 10.1006/meth.2001.1262. [DOI] [PubMed] [Google Scholar]
- 33.Karginov FV, Hannon GJ. Remodeling of Ago2-mRNA interactions upon cellular stress reflects miRNA complementarity and correlates with altered translation rates. Genes Dev. 2013;27:1624–1632. doi: 10.1101/gad.215939.113. [DOI] [PMC free article] [PubMed] [Google Scholar]
- 34.Gao S, Gang J, Yu M, Xin G, Tan H. Computational analysis for identification of early diagnostic biomarkers and prognostic biomarkers of liver cancer based on GEO and TCGA databases and studies on pathways and biological functions affecting the survival time of liver cancer. BMC Cancer. 2021;21(791) doi: 10.1186/s12885-021-08520-1. [DOI] [PMC free article] [PubMed] [Google Scholar]
- 35.Ginn L, Shi L, Montagna M, Garofalo M. LncRNAs in Non-Small-cell lung cancer. Noncoding RNA. 2020;6(25) doi: 10.3390/ncrna6030025. [DOI] [PMC free article] [PubMed] [Google Scholar]
- 36.Hu J, Qian Y, Peng L, Ma L, Qiu T, Liu Y, Li X, Chen X. Long Noncoding RNA EGFR-AS1 promotes cell proliferation by increasing EGFR mRNA stability in gastric cancer. Cell Physiol Biochem. 2018;49:322–334. doi: 10.1159/000492883. [DOI] [PubMed] [Google Scholar]
- 37.Yuan S, Luan X, Chen H, Shi X, Zhang X. Long non-coding RNA EGFR-AS1 sponges micorRNA-381 to upregulate ROCK2 in bladder cancer. Oncol Lett. 2020;19:1899–1905. doi: 10.3892/ol.2020.11283. [DOI] [PMC free article] [PubMed] [Google Scholar]
- 38.Lee SS, Cheah YK. The Interplay between MicroRNAs and cellular components of tumour microenvironment (TME) on Non-small-cell lung cancer (NSCLC) progression. J Immunol Res. 2019;2019(3046379) doi: 10.1155/2019/3046379. [DOI] [PMC free article] [PubMed] [Google Scholar]
- 39.Yi M, Liao Z, Deng L, Xu L, Tan Y, Liu K, Chen Z, Zhang Y. High diagnostic value of miRNAs for NSCLC: Quantitative analysis for both single and combined miRNAs in lung cancer. Ann Med. 2021;53:2178–2193. doi: 10.1080/07853890.2021.2000634. [DOI] [PMC free article] [PubMed] [Google Scholar]
- 40.Liang G, Meng W, Huang X, Zhu W, Yin C, Wang C, Fassan M, Yu Y, Kudo M, Xiao S, et al. miR-196b-5p-mediated downregulation of TSPAN12 and GATA6 promotes tumor progression in non-small cell lung cancer. Proc Natl Acad Sci USA. 2020;117:4347–4357. doi: 10.1073/pnas.1917531117. [DOI] [PMC free article] [PubMed] [Google Scholar]
- 41.Toh TB, Lim JJ, Chow EK. Epigenetics in cancer stem cells. Mol Cancer. 2017;16(29) doi: 10.1186/s12943-017-0596-9. [DOI] [PMC free article] [PubMed] [Google Scholar]
- 42.Lu S, Chen Z, Liu Z, Liu Z. Unmasking the biological function and regulatory mechanism of NOC2L: A novel inhibitor of histone acetyltransferase. J Transl Med. 2023;21(31) doi: 10.1186/s12967-023-03877-2. [DOI] [PMC free article] [PubMed] [Google Scholar]
- 43.Gao S, Tan H, Li D. Oridonin suppresses gastric cancer SGC-7901 cell proliferation by targeting the TNF-alpha/androgen receptor/TGF-beta signalling pathway axis. J Cell Mol Med. 2023;27:2661–2674. doi: 10.1111/jcmm.17841. [DOI] [PMC free article] [PubMed] [Google Scholar]
Associated Data
This section collects any data citations, data availability statements, or supplementary materials included in this article.
Supplementary Materials
Data Availability Statement
The data generated in the present study may be requested from the corresponding author.


