Abstract
Background
This research utilized a combination of gene databases associated with ferroptosis and online gene expression data from ischemic stroke samples to pinpoint ferroptosis-related genes (FRGs) in ischemic stroke cases.
Methods
By employing Random Forest (RF) and Support Vector Machine (SVM) models based on these genes, an overlap of genes from both models was identified as “Hub” genes. Through consensus clustering analysis using Hub genes, two distinct clusters of FRGs were revealed in ischemic stroke samples. Examination of the correlation between these molecular subtypes and the immune microenvironment highlighted a close link between gene expression levels and immune cell infiltration. Significantly different gene expression and functions within the FRG clusters underscored the pivotal role of Hub genes in the immune microenvironment. A gene diagnostic model related to ferroptosis was developed and validated to elucidate the significance of the identified genes.
Results
The results demonstrated that the Hub gene-based classification model effectively differentiated between ischemic stroke patients and normal samples, achieving an AUC of 0.900, signifying clinical relevance.
Conclusion
This study successfully identified ferroptosis-related genes in ischemic stroke, offering insights that could contribute to the formulation of future comprehensive treatment approaches.
Keywords: Ischemic Stroke, Ferroptosis Related Genes, Peripheral Immune Landscape
Introduction
Ischemic stroke (IS) is a leading cause of death and long-term disability worldwide, characterized by the abrupt disruption of blood supply to the brain, resulting in neuronal injury and dysfunction.1 Despite advancements in acute stroke therapies, including thrombolytic treatment and mechanical thrombectomy, the outcomes for ischemic stroke patients remain suboptimal. The underlying mechanisms of ischemic stroke involve complex cellular processes, including oxidative stress, inflammation, and cell death.2 Among these, ferroptosis—an iron-dependent form of regulated cell death—has emerged as a significant contributor to ischemic brain injury. Recent studies have suggested that ferroptosis plays a crucial role in the pathophysiology of ischemic stroke,3 influencing not only neuronal cell death but also the inflammatory response and immune system activation in the periphery.
The peripheral immune response to ischemic stroke has been shown to affect recovery and long-term outcomes, with immune cell infiltration and cytokine release exacerbating brain damage.4 However, the precise molecular pathways linking ferroptosis to immune dysregulation in ischemic stroke are not fully understood.5 Understanding the genes involved in ferroptosis and their potential impact on the immune landscape could provide new insights into stroke pathogenesis and offer novel therapeutic targets. This study aims to identify ferroptosis-related genes in ischemic stroke and examine their role in shaping the peripheral immune response. By elucidating these pathways, we hope to uncover potential biomarkers and therapeutic targets that could enhance early diagnosis and treatment strategies, ultimately improving the prognosis of ischemic stroke patients.
Materials and Methods
Data Preparation
We retrieved the gene expression patterns of 40 peripheral blood mononuclear cell samples (20 samples from stroke and 20 samples from normalcy) from the Gene Expression Omnibus database. The GPL10558 IlluminaHumanHT-12V4.0ExpressionBeadChip platform was used with the dataset, which was designated as GSE22255 (https://www.ncbi.nlm.nih.gov/geo/query/acc.cgi?acc=GSE22255). Gene probes were transformed into genetic symbols, and the “limma” tool in R (version 4.1.2) was used to preprocess the data. Genes missing matching expression values were removed, and genes with duplicate expression values were combined using the median.
Extraction of Ferroptosis-Related Genes
The primary database containing verified ferroptosis-related markers and modulators is FerrDb database 2, which is where the ferroptosis-related gene set was obtained. After this validation, we obtained the gene sets associated with ferroptosis from the FerrDb database and retrieved their expression levels in the GSE22255 dataset. This extraction made it easier to create an expression profile matrix for further research that was especially focused on genes related to ferroptosis.
Differential Expression Analysis
To find ferroptosis-related differentially expressed genes (FRDEGs) between the stroke group and the control group, differential analysis of ferroptosis-related gene expression profiling matrices was carried out. For FRDEGs, the significance threshold was chosen at P < 0.05. The expression of FRDEGs was made visible. The heatmap and volcano map of FRDEGs were created using the pheatmap and ggplot2 packages, respectively. Following that, FRDEGs underwent analysis using Kyoto Encyclopedia of Genes and Genomes (KEGG) and Gene Ontology (GO). Among these analyses, GO enrichment analysis comprised two sections (BP, CC, and MF) to detect the pathways or functions that were enriched by FRDEGs.
Select the Disease-Related Genes
Two popular machine learning methods, support vector machines (SVM) and random forests (RF), were utilized to build models based on the expression data of forty peripheral blood samples. Using the “caret” package, a 5-fold cross-validation was performed on each model. These two models were then analyzed using the “DALEX” software. While the RF model generated several decision tree classifiers, each of which made decisions and classified the data, the SVM model used all of the feature variables in the data as the model feature variables. Boxplots and reverse cumulative distribution curves were used to display the residual distributions. In the end, RF was selected to determine the genes’ relevance score based on the residuals. To build the random forest model, the researchers compared the changes in the error rate corresponding to different numbers of trees and selected the number of trees associated with the minimum error rate. In the R model, the classification became more stable as the Gini index decreased. Subsequently, two ferroptosis-related genes (PANX2 and SLC7A11) were identified based on the “Mean Decrease Gini”. Finally, circles were drawn using the “RCircos” package to display the distribution of hubs on chromosomes.
Gene Cluster Based on Ferroptosis-Related Gene Expression
The “ConsensusClusterPlus” program, which may identify potential common biometric groups based on 36 ferroptosis-related expressed differentially genes (also known as “FRG clusters”), was used to analyze the stroke dataset in R. To assess the consensus clustering’s stability and logic, a resampling-based technique was employed. To get the “cleanest” cluster distribution, the consensus matrix plot is sorted by clustering; items with strong cohesion (dark blue) have more consensus, whereas items with low cohesion have lower consensus. The value of K when the cluster analysis results are most dependable is represented by the empirical cumulative distribution function (CDF), and the CDF value is roughly the maximum value. The relative change in k and k-1 is represented by the delta plot, which is the area under the CDF curve. In particular, the empirical cumulative distribution function (PDF), the Delta plot, and the consensus matrix’s heat map are used to determine the ideal number of clusters. Principal component analysis (PCA) was used to further confirm the categorization results, and the “ggplot2” software program was used to show the data.
Correlations Between Two Distinct Clusters of Ferroptosis-Related Genes and Immune Characteristics
Using the single-sample gene set enrichment analysis (ssGSEA) technique, the researchers investigated the relationship between two molecular categories and the immunological microenvironment. For each sample within the two molecular kinds, this required assessing the proportions of 28 different immune cell distributions and infiltration fractions. The researchers measured the amount of immune cell infiltration in each sample using ssGSEA, and they looked into the connection between immune cell infiltration level and ferroptosis-related gene expression. Heat maps and box plots were then created to graphically depict the analysis’s findings. The heat maps were made using the “Pheatmap” program, which uses color gradients to efficiently show the correlations between various variables or samples. However, box plots—which are helpful for comparing different data sets and displaying the distribution of a dataset—were created using the “Voplot” program.
Functional Enrichment Analysis of Distinct Clusters of Ferroptosis-Related Genes
The empirical Bayesian technique was used in the study carried out with the “limma” R package to determine the differentially expressed genes (CDEGs) between group A and group B. With the use of the filter criteria, which were set at |logFC| > 1 and a corrected p-value < 0.05, genes with significant fold changes and statistical significance can be chosen. After these CDEGs were identified, their biological activities and related pathways were clarified by Gene Ontology (GO) and Kyoto Encyclopedia of Genes and Genomes (KEGG) pathway studies. The purpose of this stage is to shed light on the functions and mechanisms that these differentially expressed genes are a part of. The “clusterProfiler” R package was used with a filter standard set at q < 0.05 to do the GO and KEGG pathway analyses.
Enrichment Analysis of Hub Genes
Gene set analysis of variance (GSVA) is an unsupervised, nonparametric methodology that assesses pathway enrichment for each sample using a list of relevant phrases or gene sets. The process analysis of this study that was mentioned above was finished by using the “GSVA” program. A computer technique for functional class scoring that determines if preselected gene sets are expressed differently between groups is called gene set enrichment analysis, or GSEA. Two enrichment analysis techniques were used to forecast and examine the Hub genes’ available pathways.
Development and Validation of a Diagnostic Model for Ferroptosis-Related Genes
Using the two identified Hub genes, a diagnostic model was established by applying the logistic regression technique to the analysis of ischemic stroke categorization. The accuracy of the Hub genes and the logistic regression model for classification was then evaluated using the area under the receiver operating characteristic (ROC) curve (AUC). AUC values were computed independently for the logistic regression model and the two Hub genes in order to assess the diagnostic model’s accuracy. The model’s or a particular gene’s ability to distinguish between ischemic stroke and non-stroke patients is gauged by the AUC values. We used the “ggplot2” software to finish the visual analysis of the entire process after calculating the AUC values. ROC curves and AUC values can be efficiently visualized using ggplot2, enabling a clear and understandable portrayal of the diagnostic model’s performance and the Hub genes’ discriminatory power.
Modeling and Validation of a Diagnostic Nomogram
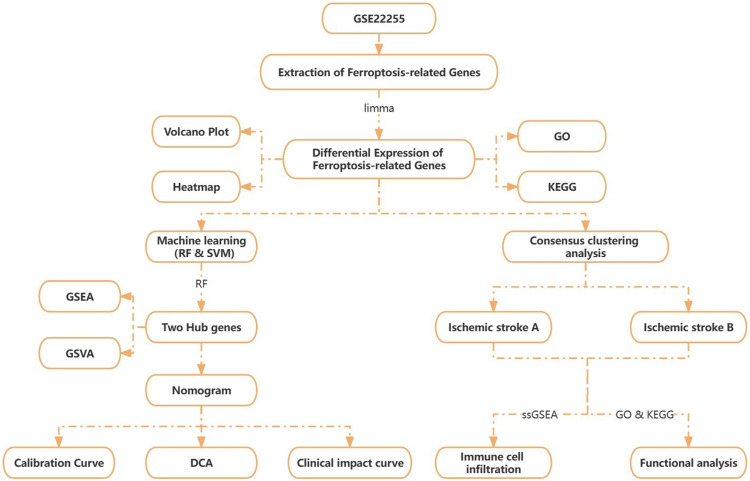
The “rms” R software was used to create the nomogram based on the two Hub genes. The nomogram’s accuracy was estimated using a calibration curve, and its clinical importance was assessed using decision curve analysis. Figure 1 displays our study’s flowchart.
Figure 1.
The flowchart of this study.
Sample Collection
For the purpose of collecting blood samples, ten patients were chosen from the neurology department of the Second Affiliated Hospital of Harbin Medical University. Five healthy people and five patients with an IS diagnosis were included in this group. The study was approved by the Medical Ethics Committee of the Second Affiliated Hospital of Harbin Medical University (SYDW2021-081) and followed the guidelines of the Declaration of Helsinki.
RNA Transcription and Quantitative Real-Time PCR
Using an RNAiso plus kit (Invitrogen, USA), total RNA was extracted from the samples, and a cDNA synthesis agent (TransGen Biotech, China) was used to reverse transcribe the RNA to cDNA. After that, three duplicates of each experiment were run using the SYBR Green Master Mix reagent (TransGen Biotech, China) for qRT-PCR. The 2−∆∆t technique was employed to determine the relative data, with β-actin serving as an internal control. Primers sequences are displayed in Table 1.
Table 1.
The Primer Sequences for PCR
| Genes | Sequences (5’-3’) | |
|---|---|---|
| SLC7A11 | Forward | GCGTGGGCATGTCTCTGAC |
| Reverse | GCTGGTAATGGACCAAAGACTTC | |
| PANX2 | Forward | CCAAGAACTTCGCAGAGGAAC |
| Reverse | GGGCAGGAACTTGTGCTCA | |
| β-actin | Forward | AATCGTGCGTGACATTAAGGAGAAG |
| Reverse | GGAGTTGAAGGTAGTTTCGTGGATG | |
Statistical Analysis
For every experiment, three independent replicates were carried out. GraphPad Prism 8 (San Diego, CA, USA) was used for statistical analysis, and the mean and standard deviation (SD) of the data are shown. Student’s t test was used to compare the data statistically, with a significance threshold of p < 0.05 denoting statistical significance. “ns” denotes non-significant differences (p ≥ 0.05), and the following symbols represent significance levels: ****p < 0.0001, ***p < 0.001, **p < 0.01 and *p < 0.05.
Results
Identification of Differential Expression of Ferroptosis-Related Genes
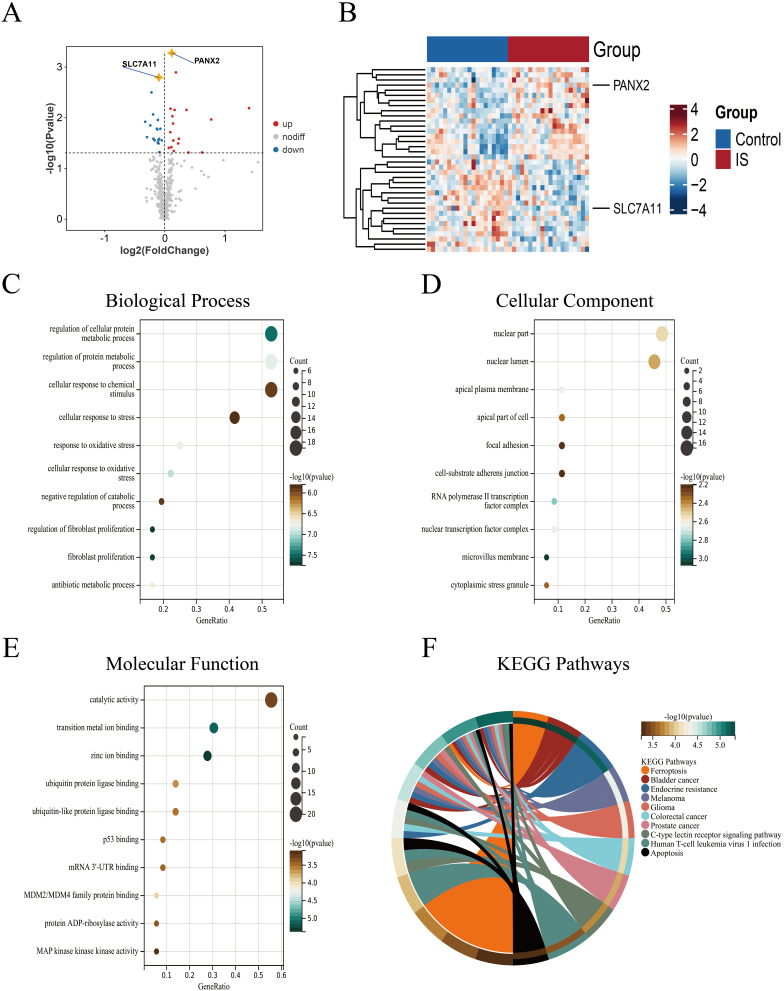
The gene set pertaining to ferroptosis, comprising 728 genes, was extracted from the FerrDb database. To create a gene expression matrix relevant to ferroptosis, the expression of these genes was extracted.18 up-regulated and 18 down-regulated genes were among the 36 FRDEGs that were found using differential expression profiling on blood samples from 20 stroke patients and 20 healthy people (Figure 2A and B). Using GO and KEGG enrichment analysis, we investigated the signaling pathways that FRDEGs may be engaged in further. The genes mentioned above were implicated in the control of the cellular protein metabolic process, the reaction of the cell to stress, the response of the cell to chemical stimulus, and the results of the BP enrichment study (Figure 2C). The nuclear lumen and nuclear portion were the primary locations of FRDEG function, according to the CC enrichment analysis (Figure 2D). FRDEGs were primarily engaged in catalytic activity, transition metal ion binding, zinc ion binding, and other molecular functions, according to MF functional enrichment analysis (Figure 2E). FRDEGs were primarily implicated in ferroptosis, bladder cancer, and endocrine resistance pathways, according to KEGG analysis (Figure 2F).
Figure 2.
Identification of 36 FRDEGs and GO and KEGG Enrichment Pathways. (A) Map of volcanoes represented by 36 FRDEGs. (B) Heatmap showing the expression of 36 FRDEGs in both healthy and stroke patients. (C–E) 36 FRDEGs are enhanced on the GO pathway. (F) 36 FRDEGs are enhanced on the KEGG pathway. The quantity of genes and the q-value of the enrichment significance are reflected in the size and color of the bubbles, accordingly.
Identification of Two Gene Features in Ischemic Stroke
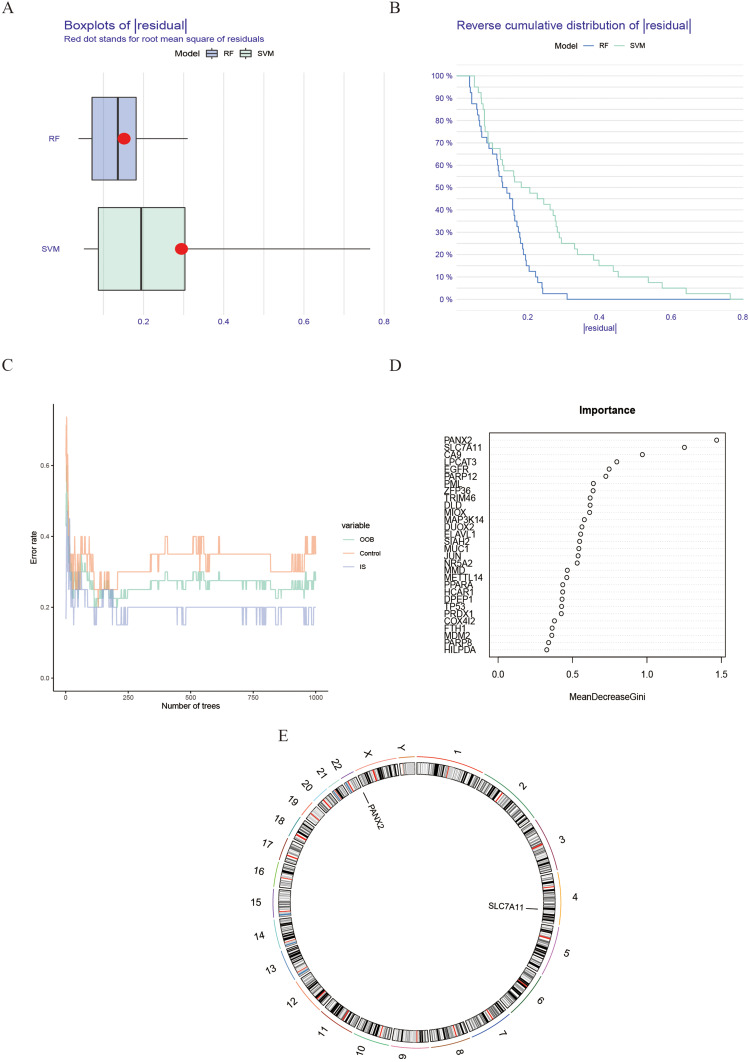
Using a variety of machine learning and bioinformatics techniques, the involvement of ferroptosis-related genes in ischemic stroke was better understood. Random Forest (RF) and Support Vector Machine (SVM), two distinct machine learning techniques, are applied to the expression spectrum of forty samples. Using the R program ggplot2, we examined the residuals in the two models (Figure 3A and B) to determine which model was better. Since RF has a modest residual, it is chosen for further examination. We next created an RF model for feature detection by looking at the link between error rate and the quantity of classification trees (Figure 3C). The graphic (graphic 3D) illustrates how the 36 FRDEGs are sorted in order based on the “average decrease of Gini coefficient” value. Drawing the column chart, two of the most important genes (PANX2 and SLC7A11) were chosen as diagnostic features because the RF model becomes more stable as the Gini index decreases. We also showed (Figure 3E) where the Hub genes are located on the chromosomes.
Figure 3.
Comparison between RF model and SVM model. (A and B) Comparison of the residuals of the SVM and RF models. (C) The correlation between the quantity of classification trees and the error rate. (D) Creating an RF Model to Identify Features. (E) The Hub Gene Distribution on Chromosomes.
Results Based on Two Distinct Clusters of Ferroptosis-Related Gene Expression
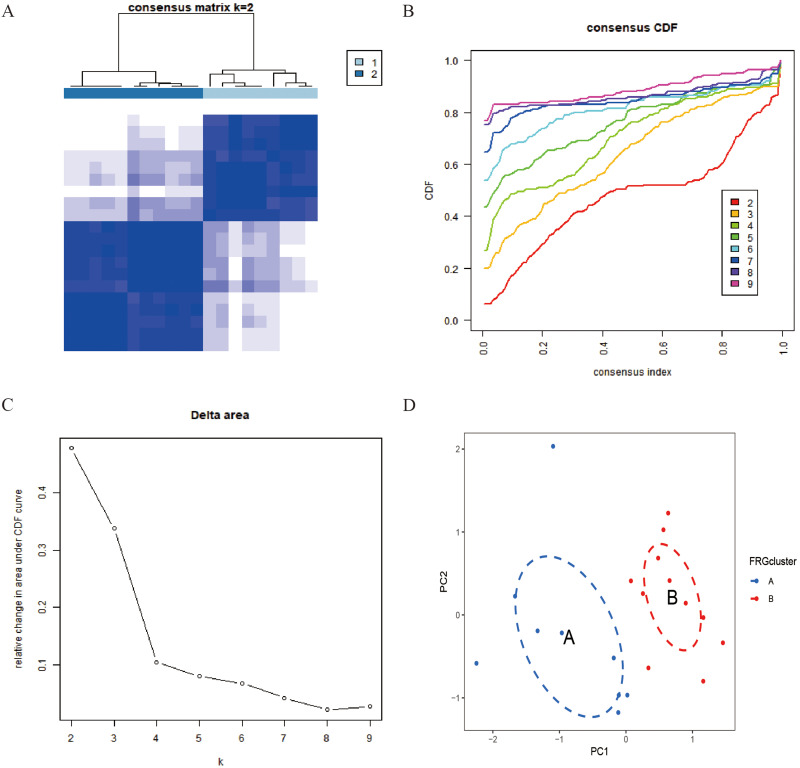
Twenty ischemic stroke samples were grouped into various sorts of clusters using unsupervised consistency cluster analysis based on the expression characteristics of these 36 FRDEGs. To be more precise, the empirical cumulative distribution function (PDF) plot, the consensus matrix heatmap, and the δ plot are used to determine the number of clusters. The fractal was most stable when k = 2, according to the data (Figure 4A). In contrast, there were notable differences in the relative changes in the area under the CDF curve for k = 2–9 (Figure 4B). Furthermore, there were minor oscillations in the CDF plot curve (Figure 4C) when the concordance index was between 0.4 and 0.8. Finally, we were able to identify two FRG Clusters out of 20 ischemic stroke samples using the consensus clustering method. Nine of the samples were designated as FRG Cluster A, and eleven as FRG Cluster B. The classification was validated using principal component analysis (PCA), which revealed a substantial difference between the two clusters ((Figure 4D).
Figure 4.
Uniform Clustering of 36 FRDEGs. (A) Divide 20 stroke samples into two clusters based on the consistency clustering matrix (k=2). (B) The cumulative distribution function (CDF) curve for k between 2 and 9. (C) The change in area under the CDF curve when k is between 2 and 9. (D) Principal component analysis shows a good difference between the two clusters. Blue and Orange dots represent clusters A and B, respectively.
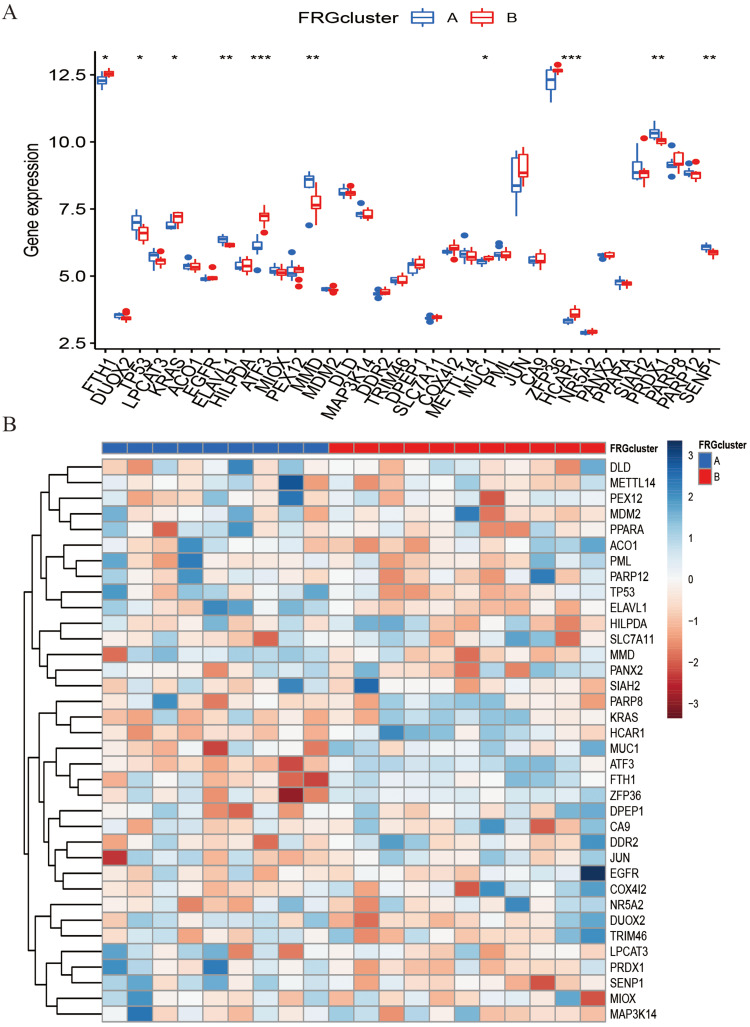
Block diagrams and heatmaps were created in order to visually comprehend the gene expression patterns of clusters A and B (Figure 5A and B). As the image illustrates, FRG clusters A and B are clearly distinguished from one another; 10 of the 36 genes were deemed statistically significant. While TP53, ELAVL1, MMD, METTL14, and PRDX1 have considerably greater expression levels in cluster A than in cluster B, the expression levels of FTH1, KRAS, ATF3, MUC1, and HCAR1 are lower in cluster A than in cluster B.
Figure 5.
The expression of Ferroptosis-related gene with different expression patterns in stroke samples. The block diagrams and heatmaps (A and B) show the expression levels of these 36 genes in groups A and B, *P < 0.05, **P < 0.01, ***P < 0.001.
Results of Immune Cell Infiltration Analysis Based on Two FRG Clusters
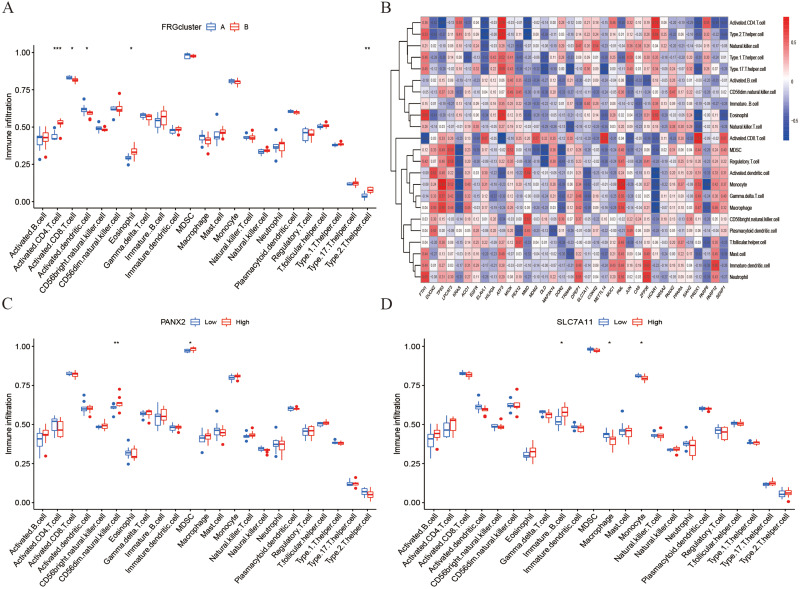
We computed the enrichment percentage of each infiltrating immune cell in the disease sample using the “GSVA” R package in order to determine the infiltration status of immune cells in ischemic stroke disease. Results of the ssGSEA analysis revealed that (Figure 6A): The infiltration ratio of activated dendritic cells and activated CD8 T cells in type A FRG cluster was substantially greater than that of type B immature cells. Initiated. The condition with CD4.T.cell, Eosinophil, and Type.2.T.helper cell invasion is completely opposite. We also examined the relationships between immune cells and the 36 ferroptosis-related differential genes, and we showed these relationships as heat maps (Figure 6B). The expression of 36 FRDEGs and the enrichment score of every immune infiltrating cell are correlated, either strongly or weakly. According to the findings, there was a strong negative link between activated dendritic cell and the Hub gene SLC7A11 and a substantial positive correlation between the Hub gene PANX2 and CD56dim natural killer cell.
Figure 6.
Characteristics of immune cell infiltration in different gene expression patterns and the correlation of immune cells with individual genes. (A) Abundance of 23 infiltrating immune cells in different clusters. (B) The correlation between the infiltrating immune cells and the ferroptosis related differential genes pathway-related. (C) The relationship between the expression of PANX2 gene and the expression of different immune cells. (D) The relationship between the expression of SLC7A11 gene and the expression of different immune cells. *P < 0.05, **P < 0.01, ***P < 0.001.
Furthermore, we examined the variation in the level of immune cell infiltration when each Hub gene was expressed at a high and low level in order to shed more light on the connection between the expression of the two Hub genes and the expression of immune infiltrating cells in the sample (Figure 6C and D). Based on the expression of the PANX2 and SLC7A11 genes, we separated the sample into two groups and investigated the expression of immune cells in the two groups. The results demonstrated a tight relationship between the invasion of immune cells and both high and low gene expression levels.
Results of Differential Expression Genes Between Two Distinct Clusters
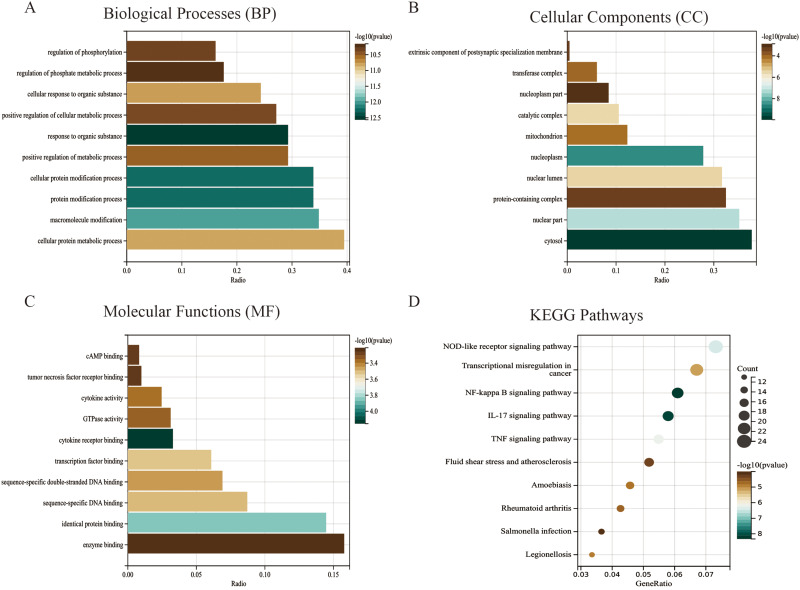
We screened a total of 807 differentially expressed genes using differential analysis on gene expression in order to investigate the role of gene expression under various categories. To investigate biological characteristics in detail, perform GO and KEGG functional enrichment analysis on differentially expressed genes, noting the ten most relevant GO terms for biological processes (BP), cellular components (CC), and molecular functions (MF) (Figure 7A-C). The findings demonstrated a considerable enrichment of gene function in biological processes, including cellular protein metabolism, phosphorylation control, and cellular response to organic matter. It exhibited an enrichment in molecular functions such as sequence-specific double stranded DNA binding, transcription factor binding, and cycline receptor binding, as well as cellular components such protein complexes, transferase complexes, and mitochondria. Furthermore, differential genes are primarily implicated in pathways including IL-17, the TNF signaling pathway, and transcriptional misregulation, according to KEGG enrichment analysis (Figure 7D).
Figure 7.
Functional enrichment analysis of differential genes. (A–C) The enrichment of the top ten most important GO terms in the BP, MF, and CC pathways. (D) The enrichment of differential genes in the KEGG pathway. The x-axis resents the ratio of pathway-enriched DEGs to the total DEGs. The size and color of bubbles correspond to number of genes and q-value of the enrichment significance, respectively.
Hub Genes Were Closely Linked to a Variety of Ischemic Stroke -Related Pathways
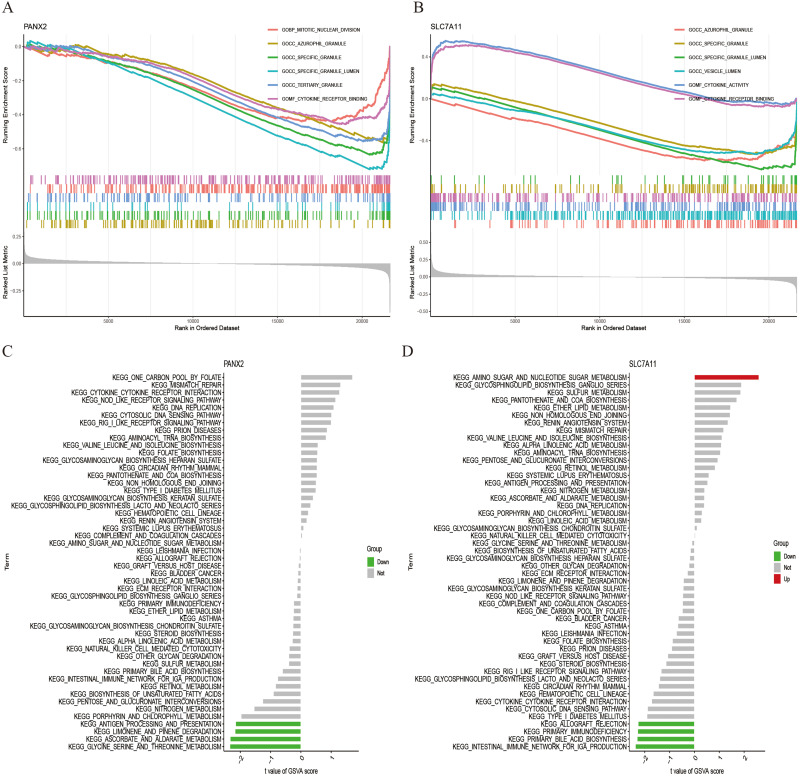
The single gene GSEA pathway was examined in order to determine the Hub gene’s potential contribution to ischemic stroke incidence. The first six enrichment pathways for each gene are displayed in the results (Figure 8A and B). The processes of cytokine receptor binding, blue granule, specific granule, specific granule lumen, etc., are all mediated by genes. The SLC7A11 gene is involved in vesicular cavity and cytokine activity, whereas the PANX2 gene is involved in generalized nuclear division and tertiary particle creation. The function of Hub in the immunological milieu is further supported by these findings. In order to forecast and evaluate the variations in activation pathways between the high expression group and the low expression group, we also performed GSVA enrichment analysis on the Hub gene (Figure 8C and D). The findings show that the metabolism of ascorbate and aldarate, as well as the processing and presentation of antigens, are linked to the downregulation of the PANX2 gene. Additionally, the primary bile acid biosynthesis, intestinal immune network, and primary immunodeficiency pathways—all of which are involved in the synthesis of IGA—are linked to the downregulation of the SLC7A11 gene, whereas the upregulation of the gene is associated with the pathways involved in the metabolism of nucleotide and amino sugars.
Figure 8.
GSEA pathway analysis of individual genes. (A and B) The first six enrichment pathways for each gene. (C and D) Perform GSVA enrichment analysis on the Hub gene. Green indicates the pathway enriched during gene downregulation. Red indicates the pathway enriched during gene upregulation.
RT-qPCR Verification of Hub Gene Expression Helps Construct Diagnosis Model and Prognosis Prediction for Ischemic Stroke
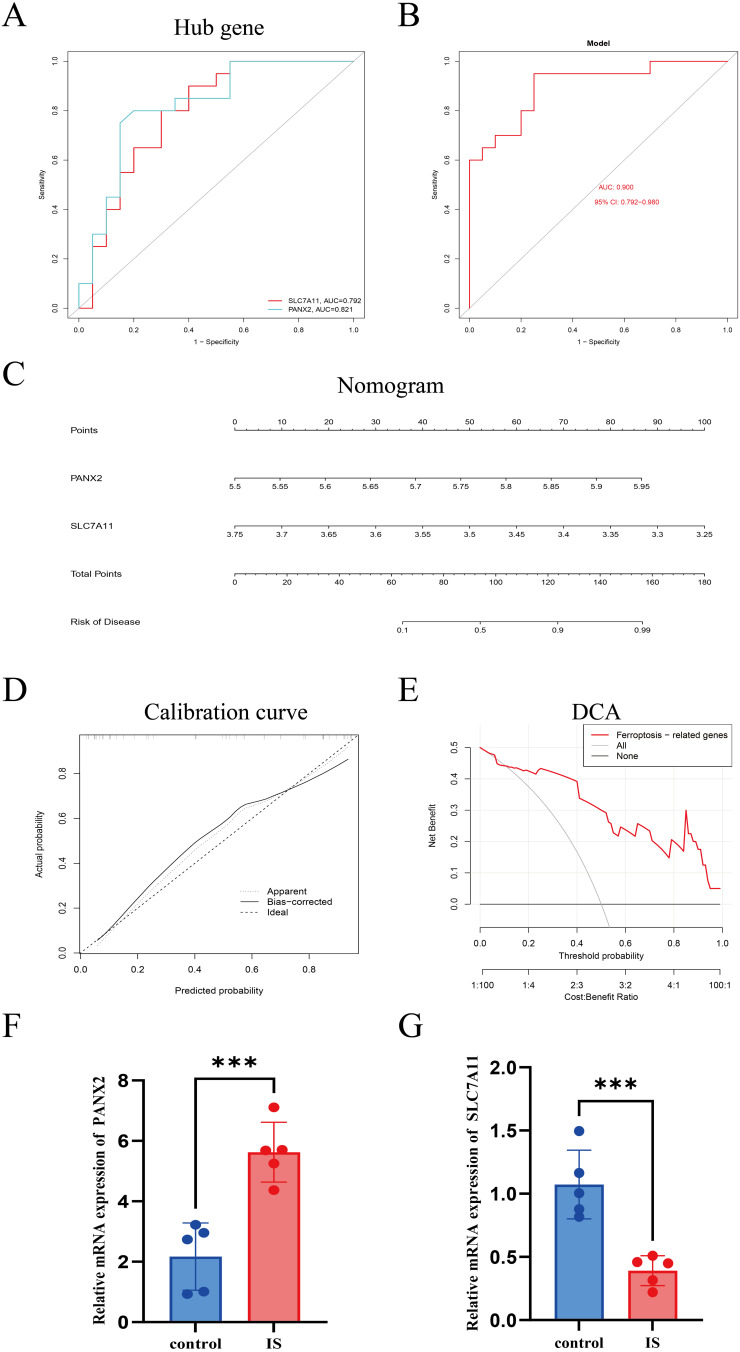
We used RT-qPCR studies to confirm Hub gene expression even more. Comparing the stroke group to the healthy control group, the results showed a significant overexpression of PANX2 (Figure 9F) and downregulation of SLC7A11 (Figure 9G). The transcriptome analysis and these qRT-PCR results agreed. The logistic regression approach was utilized to create the diagnosis model of ischemic stroke categorization, which is based on two Hub genes. The findings demonstrated that ischemic stroke patients may be distinguished from normal samples using the classification diagnosis model built using two Hub genes. We computed the AUC values for the Hub gene and model, respectively (Figure 9A and B): AUC = 0.900 for the model, AUC = 0.821 for PANX2, and AUC = 0.792 for SLC7A11. Finally, we created a Nomogram to forecast the course of an ischemic stroke by merging the two Hub genes. Every gene in the Nomogram (Figure 9C) has a corresponding scoring criterion, and the total of all gene scores can be used to forecast the probability of an ischemic stroke developing further. The calibration curve of the Nomogram (Figure 9D) verified that the Nomogram built using two genes performed well in terms of predictions. Additionally, combining scores for two ferroptosis-related genes revealed that patients with Nomogram had greater clinical benefits, according to decision curve analysis (Figure 9E). Improved clinical application translates into improved net clinical benefit.
Figure 9.
Establishing and validating a diagnostic model for iron removal related genes. (A and B) The AUC values of the Hub gene and model, SLC7A11 (AUC=0.792), PANX2 (AUC0.821), and model (AUC0.900). (C and D) Establishment of Nomogram. Nomogram for predicting the progression of ischemic stroke, each gene corresponds to a scoring criterion. Calibration curves demonstrate that Nomogram constructed with two genes has good predictive performance. (E) The decision curve indicates that two genes have higher clinical benefits. (F) RT-qPCR for PANX2 in blood from IS patients (n = 5 per group). (G) RT-qPCR of SLC7A11 in blood from IS patients (n = 5 per group). ***P < 0.001.
Discussion
Indeed, ischemic stroke is a serious health problem that costs a lot of money to both people and society as a whole. Medical research has struggled to develop practical approaches to both prevention and therapy over the years. Numerous investigations have emphasized ferroptosis’s influence on neuronal cell death and its role in the development of ischemic stroke. Different from other cell death mechanisms like necrosis or apoptosis, ferroptosis is a type of controlled cell death defined by iron-dependent lipid peroxidation. According to research, ferroptosis contributes to the aggravation of ischemic stroke-related brain damage. Interventions targeting ferroptosis inhibition via pharmacological drugs or genetic alteration of key regulators have demonstrated promise in ameliorating neurological outcomes and minimizing brain damage in experimental models of ischemic stroke. Researchers are experimenting with novel therapeutic approaches to lessen the negative consequences of ischemic stroke and improve recovery by focusing on particular pathways implicated in ferroptosis.
The findings of these research projects provide light on the possible importance of ferroptosis targeting as a therapeutic approach for ischemic stroke, offering hope for the creation of novel therapies that may eventually mitigate the devastating effects of this illness on people and society. We used GSEA analysis in our study to identify the biological characteristics of ischemic stroke. We looked into how ferroptosis-related genes affected the disease’s occurrence using the random forest technique, and we found a two-gene signature that allowed us to build a diagnostic model. Samples of ischemic stroke were divided into two different subtypes, and the distinctions between them in terms of immune cell expression and infiltration were investigated. Afterwards, genes that were found to be differentially expressed and specific to various subtypes were discovered. These genes were then analyzed using GO and KEGG to gain a thorough understanding of their impact on the pathological process of ischemic stroke.
36 FRDEGs were found after we first looked at the differential genes linked to ferroptosis in samples from both the ischemic stroke and normal control groups. These 36 FRDEGs are primarily involved in the regulation of cellular protein metabolism, catalytic activity, transition metal ion binding, zinc ion binding, and other activities, all of which are significantly associated to ischemic stroke, according to our GO and KEGG analyses. Notably, growing research indicates that autophagy may be activated after ischemic stroke in a variety of brain cell types, including glia, neurons, and cerebral microvascular cells.6 Furthermore, TP53 is intimately linked to transcription factor binding and DNA binding specific to RNA polymerase II, and it is essential to the development of ischemic stroke, suggesting that TP53 could be a target for treatment of this illness.7 Therefore, it is plausible that these 36 FRDEGs could significantly impact ischemic stroke via these channels.
Using Random Forest and Support Vector Machine models, we were able to determine the relevance of two ferroptosis-related biomarkers, PANX2 and SLC7A11, to ischemic stroke. These biomarkers associated with ferroptosis showed good ischemic stroke diagnostic efficacy. Because annexins are implicated in a number of diseases, such as cancer, ischemic stroke, neuropathic pain, Parkinson’s disease, and epilepsy, they have become attractive targets for pharmaceuticals. PANX1, PANX2, and PANX3, which are expressed in vertebrates, are the three members of this family of membrane channel proteins.8–10 PANX2 may function as a biomarker for ischemic stroke and other disorders or as a critical component in the ailment. Danhong injection (DHI) was reported to be able to reduce neuronal ferroptosis after ischemic stroke via the SATB1/SLC7A11/HO-1 pathway in another study.11 SATB1 may be a suitable target for ischemic stroke therapy. It’s interesting to note that lung cancer stem cell-like cells (CSLC) have higher levels of SLC7A11, which can activate the cell transcription factor SOX2.12 In addition to playing a part in ferroptosis and being frequently overexpressed in a variety of human malignancies, SLC7A11 also provides insights into the biology of tumors and nutrition dependence, opening the door for the creation of cutting-edge and successful cancer treatments.13
36 FRDEGs were utilized to divide ischemic stroke samples into two groups based on bioinformatics analysis; the two groups differed significantly in terms of immune cell expression. The study also revealed that there is a large increase in the expression of CD4+T cells and CD8+T cells, and that CD4+T lymphocytes are a major mediator of tissue damage following an ischemic stroke. Research has indicated that the survival and maturation of infarcts are unaffected by the lack of CD4+T cells. Both CD4+T and B lymphocytes enter the infarcted region to produce follicular-like structures once the CD4+ population in the periphery recovers. For CD4+T cells, post-stroke B cell infiltration into the ischemic brain must be delayed.14,15 It is noteworthy that lymphocyte infiltration following a stroke is an ongoing process. According to biological research, CD8+T cells are thought to play a significant role in the development of ischemic stroke, and FasL increases the cytotoxicity of CD8+T cells to neurons following an ischemic stroke. Brain damage and the death of neurons can be avoided by deactivating particular FasL on CD8+T cells.16,17 Treatment of ischemic stroke disease in the A-type FRG cluster may be accomplished by appropriate pharmacological therapy on the pertinent signaling pathways of CD4+T cells and CD8+T cells. Furthermore, a substantial negative association was observed between the Hub gene SLC7A11 and activated dendritic cells, but a significant positive correlation was observed between the Hub gene PANX2 and CD56dim natural killer cells. While CD56 deficient natural killer cell malfunction is frequently observed in higher stage malignancies, there is a functional and prognostic link in bladder cancers.18 Dendritic cells (DCs) are crucial for T cell-mediated cancer immunity and are key regulators of adaptive immune responses. A particular subset of conventional DCs is required for the anti-tumor response. Direct DC activation can release T cell responses, and DC maturation is required to give co-stimulating signals to T cells. Combination approaches that target DCs therapeutically have the potential to be revolutionary.19 It is highly significant to investigate the incidence, diagnosis, and treatment of ischemic stroke that the high expression of PANX2 gene may stimulate the expression of CD56 dim natural killer cells in cells, while the low expression of SLC7A11 gene may promote the high expression of activated dendritic cells.
Conclusion
We performed a thorough investigation of chemicals relevant to ferroptosis and their immunological properties using an integrated approach. By using this method, it was possible to identify two separate clusters of ferroptosis-related genes (FRGs), which provide useful tools for differentiating between frontal ischemic stroke severities in clinical settings. Additionally, we created diagnostic models for ischemic stroke, such as Nomograms, using the logistic regression algorithm. Our research establishes the theoretical foundation for incorporating diagnostic indicators for ischemic stroke in addition to providing fresh insight into the function of ferroptosis and its molecular immunological mechanism in the disease.
Data Sharing Statement
The original contributions presented in the study are included in the article/supplementary material, further inquiries can be directed to the corresponding author/s.
Ethics Approval
The study was approved by the Medical Ethics Committee of the Second Affiliated Hospital of Harbin Medical University (SYDW2021-081) and followed the guidelines of the Declaration of Helsinki. It obtains written informed consent from participants.
Disclosure
The authors report no conflicts of interest in this work.
References
- 1.Zhao YF, Zhang XJ, Chen XY, Wei Y. Neuronal injuries in cerebral infarction and ischemic stroke: from mechanisms to treatment. Int J Molecular Medicin. 2022;49(15). [DOI] [PMC free article] [PubMed] [Google Scholar]
- 2.Qin C, Yang S, Chu YH, et al. Signaling pathways involved in ischemic stroke: molecular mechanisms and therapeutic interventions. Signal Transduction and Targeted Therapy. 2022;7:215. doi: 10.1038/s41392-022-01064-1 [DOI] [PMC free article] [PubMed] [Google Scholar]
- 3.Tuo QZ, Liu Y, Xiang Z, et al. Thrombin induces ACSL4-dependent ferroptosis during cerebral ischemia/reperfusion. Signal Transduction and Targeted Therapy. 2022;7:59. doi: 10.1038/s41392-022-00917-z [DOI] [PMC free article] [PubMed] [Google Scholar]
- 4.Chavda V, Madhwani K, Chaurasia B. Stroke and immunotherapy: potential mechanisms and its implications as immune-therapeutics. Eur J Neurosci. 2021;54(1):4338–4357. doi: 10.1111/ejn.15224 [DOI] [PubMed] [Google Scholar]
- 5.Fares J, Ulasov I, Timashev P, Lesniak MS. Emerging principles of brain immunology and immune checkpoint blockade in brain metastases. Brain. 2021;144(4):1046–1066. doi: 10.1093/brain/awab012 [DOI] [PMC free article] [PubMed] [Google Scholar]
- 6.Wang P, Shao BZ, Deng Z, Chen S, Yue Z, Miao CY. Autophagy in ischemic stroke. Prog Neurobiol. 2018;163–164:98–117. doi: 10.1016/j.pneurobio.2018.01.001 [DOI] [PubMed] [Google Scholar]
- 7.Liu M, Zhou X, Li Y, et al. TIGAR alleviates oxidative stress in brain with extended ischemia via a pentose phosphate pathway-independent manner. Redox Biol. 2022;53:102323. doi: 10.1016/j.redox.2022.102323 [DOI] [PMC free article] [PubMed] [Google Scholar]
- 8.Sosinsky GE, Boassa D, Dermietzel R, et al. Pannexin channels are not gap junction hemichannels. Channels. 2011;5:193–197. doi: 10.4161/chan.5.3.15765 [DOI] [PMC free article] [PubMed] [Google Scholar]
- 9.Dahl G. The Pannexin1 membrane channel: distinct conformations and functions. FEBS Lett. 2018;592:3201–3209. doi: 10.1002/1873-3468.13115 [DOI] [PubMed] [Google Scholar]
- 10.Penuela S, Gehi R, Laird DW. The biochemistry and function of pannexin channels. Biochim Biophys Acta (BBA)-Biomembr. 2013;1828:15–22. doi: 10.1016/j.bbamem.2012.01.017 [DOI] [PubMed] [Google Scholar]
- 11.Zhan S, Liang J, Lin H, et al. SATB1/SLC7A11/HO-1 Axis ameliorates Ferro ptosis in neuron cells after ischemic stroke by Danhong injection. Mol Neurobiol. 2023;60(1):413–427. doi: 10.1007/s12035-022-03075-z [DOI] [PubMed] [Google Scholar]
- 12.Wang X, Chen Y, Wang X, et al. Stem cell factor SOX2 confers ferroptosis resistance in lung cancer via upregulation of SLC7A11. Cancer Res. 2021;81(20):5217–5229. doi: 10.1158/0008-5472.CAN-21-0567 [DOI] [PMC free article] [PubMed] [Google Scholar]
- 13.Koppula P, Zhuang L, Gan B. Cystine transporter SLC7A11/xCT in cancer: ferroptosis, nutrient dependency, and cancer therapy. Protein Cell. 2021;12(8):599–620. doi: 10.1007/s13238-020-00789-5 [DOI] [PMC free article] [PubMed] [Google Scholar]
- 14.Weitbrecht L, Berchtold D, Zhang T, et al. CD4 T cells promote delayed B cell responses in the ischemic brain after experimental stroke. Brain Behav Immun. 2021;91:601–614. doi: 10.1016/j.bbi.2020.09.029 [DOI] [PubMed] [Google Scholar]
- 15.Zhou SY, Guo ZN, Yang Y, Qu Y, Jin H. Gut-brain axis: mechanisms and potential therapeutic strategies for ischemic stroke through immune functions. Front Neurosci. 2023;17:1081347. doi: 10.3389/fnins.2023.1081347 [DOI] [PMC free article] [PubMed] [Google Scholar]
- 16.Fan L, Zhang CJ, Zhu L, et al. FasL-PDPK1 pathway promotes the cytotoxicity of CD8+ T cells during ischemic stroke. Transl Stroke Res. 2020;11:747–761. doi: 10.1007/s12975-019-00749-0 [DOI] [PubMed] [Google Scholar]
- 17.Flores-Mendoza G, Rodríguez-Rodríguez N, Rubio RM, Madera-Salcedo IK, Rosetti F, Crispín JC. Fas/FasL signaling regulates CD8 expression during exposure to self-antigens. Front Immunol. 2021;12:635862. doi: 10.3389/fimmu.2021.635862 [DOI] [PMC free article] [PubMed] [Google Scholar]
- 18.Mukherjee N, Ji N, Hurez V, et al. Intratumoral CD56bright natural killer cells are associated with improved survival in bladder cancer. Oncotarget. 2018;9(92):36492–36502. doi: 10.18632/oncotarget.26362 [DOI] [PMC free article] [PubMed] [Google Scholar]
- 19.Gardner A, Ruffell B. Dendritic cells and cancer immunity. Trends Immunol. 2016;37(12):855–865. doi: 10.1016/j.it.2016.09.006 [DOI] [PMC free article] [PubMed] [Google Scholar]
Associated Data
This section collects any data citations, data availability statements, or supplementary materials included in this article.
Data Availability Statement
The original contributions presented in the study are included in the article/supplementary material, further inquiries can be directed to the corresponding author/s.


