

Abstract
Purpose
The purpose of this study was to determine the natural history of the photoreceptor disease in a large group of pediatric patients with RHD12-associated Leber congenital amaurosis (RDH12-LCA), to estimate the changes expected over the duration of a clinical trial, and to define the relationship between the photoreceptor loss and visual dysfunction.
Methods
Forty-six patients representing 36 families were included. The great majority of patients were under the age of 18 years. Patients underwent complete ophthalmic examinations and imaging with various modalities including adaptive optics scanning laser ophthalmoscopy. Visual function was assessed with static and kinetic perimetry, and full-field stimulus test (FST) under dark- and light-adapted conditions.
Results
Patients had a severe and early onset retinal degeneration (EORD). Visual acuity losses showed a progression rate of 0.04 logMAR per year. A small foveal island could be retained but showed degeneration over time. Foveal cone sensitivity losses were predictable by the loss of photoreceptors. Peripapillary retina could be retained with no significant progression detectable. Peripapillary rod sensitivity was substantially less than expected from photoreceptor structure pointing to a large improvement potential. FST sensitivities were reliably recordable in pediatric patients and showed a small but significant improvement with age. Locally and globally, loss of rod sensitivity tended to be larger than loss of cone sensitivity.
Conclusions
Foveal cones of RDH12-LCA should be targeted with treatments aimed to slow progression, whereas peripapillary rod photoreceptors should be targeted with treatments aimed to improve night vision. Pediatric FST testing may be complicated by age-related maturation of decision making regarding threshold criteria.
Keywords: cone photoreceptors, early-onset retinal degeneration (EORD), leber congenital amaurosis (LCA), parapapillary preservation, peripapillary preservation, rod photoreceptors
Leber congenital amaurosis (LCA) and early onset retinal degeneration (EORD) refer to a genetically heterogenous group of retinal diseases that cause severe vision loss in early childhood.1–3 One genetic form of LCA has an approved gene therapy treatment,4 and investigational clinical trials are ongoing in several other genetic forms.5,6 Among the remaining genetic forms without treatment is an autosomal recessive LCA/EORD caused by biallelic pathogenic variants in RDH12 (referred to as RDH12-LCA hereafter),7–10 a gene that encodes a photoreceptor enzyme in the short-chain dehydrogenases/reductases superfamily. The exact molecular mechanisms of pathogenesis and progression in RDH12-LCA remains unclear. RDH12 knockout mice show no retinal degeneration under normal cyclic light but a greater predilection to light damage.11,12 It has been hypothesized that RDH12 protects cellular macromolecules within the inner segments of photoreceptors against oxidative modification.13,14 More recent research points at the involvement of RDH12 in the oxidation of 11-cis retinol in the cone-specific retinal visual cycle.15–17 It is plausible that the role of RDH12 may be different in rods and cones.
Preclinical studies with adeno-associated virus (AAV)-vectored gene augmentation therapy have shown proof-of-concept with AAV5 and AAV818,19 laying the groundwork toward translation to clinical trials. Treatment aims for RDH12-LCA would depend on whether retinas are expected to have retained photoreceptors at the time of the intervention. For retinas with retained photoreceptors, treatment aims could be vision improvement (where there is evidence of dysfunction20) or slowing of further photoreceptor losses, or both. Important considerations include the retinal location and cell type of retained photoreceptors. For retinas with no retained photoreceptors, treatment aims are regeneration or substitution.21
Most studies on the autosomal recessive form of RDH12-associated inherited retinal degeneration (IRD) have described a severe early onset disease that fits within the classic LCA/EORD classification. However, the reported phenotypic spectrum ranges from a mild macula-only IRD, to intermediate severities that overlap with diagnostic criteria of retinitis pigmentosa and cone-rod dystrophy.7–10,22–34 Common to all these clinical descriptions is a predominant macular involvement, often with relative foveal sparing at earlier stages, and central atrophic lesions, including pseudo-colobomas, at later stages. Consistent with these observations, longitudinal and cross-sectional studies suggest a natural history with early loss of visual acuity and a progressive course within the first 2 decades.10,26,29,34
To increase our understanding of the retinal structural changes and associated visual dysfunction, we studied a large group of patients with RDH12-LCA cross-sectionally and longitudinally using imaging and perceptual tests to localize treatable photoreceptors and their functional status. These results help refine the natural history of disease and define a treatment strategy for different severity stages.
Methods
Patients
Forty-six patients, at ages of 2 to 42 years, representing 36 families with RDH12-LCA were included in this study (Table 1). Thirty-seven patients (86%) were under the age of 18 years at their first visit providing a rare insight into a severe retinal disease in a young cohort with specialized perceptual testing. Thirty-three patients (77%) had multiple visits from 1 to 26 years providing longitudinal natural history; not all measures were available at all visits and/or in all patients. Sample sizes are explicitly specified for all parameters quantified (Table 2). Some of the findings from 25 patients were previously published9,10 but current work includes novel results and novel analyses. Informed consent and assent were obtained after explanation of the nature of the study; our procedures complied with the Declaration of Helsinki and were approved by the institutional review board. All patients underwent a comprehensive eye examination including age-appropriate measures of best-corrected visual acuity (BCVA).
Table 1.
Demographic and Molecular Characteristics of the Patients
| RDH12 Variants | ||||||
|---|---|---|---|---|---|---|
| Allele 1 | Allele 2 | |||||
| Patient ID | Family ID | Age†/Sex | Nucleotide Change | Effect | Nucleotide Change | Effect |
| P1‡ | F1 | 2/F | c.806_810del | p.(Ala269Glyfs*2) | c.697G>C | p.(Val233Leu) |
| P2§ | F2 | 3/F | c.582C>G | p.(Tyr194*) | c.617C>A | p.(Ala206Asp) |
| P3‡ | F3 | 4/F | c.806_810del | p.(Ala269Glyfs*2) | c.883C>T | p.(Arg295*) |
| P4 | F4 | 4/F | c.295C>A | p.(Leu99Ile) | c.295C>A | p.(Leu99Ile) |
| P5 | F5 | 5/M | c.446T>C | p.(Leu149Pro) | c.800A>C | p.(His267Pro) |
| P6§ | F6 | 5/F | c.164C>T | p.(Thr55Met) | c.883C>T | p.(Arg295*) |
| P7 | F7 | 5/M | c.210dup | p.(Arg71Glnfs*12) | c.302A>G | p.(Asp101Gly) |
| P8§ | F2 | 5/F | c.582C>G | p.(Tyr194*) | c.617C>A | p.(Ala206Asp) |
| P9‡ | F3 | 6/M | c.806_810del | p.(Ala269Glyfs*2) | c.883C>T | p.(Arg295*) |
| P10‡ | F8 | 6/M | c.806_810del | p.(Ala269Glyfs*2) | c.377C>A | p.(Ala126Glu) |
| P11§ | F9 | 6/F | c.139G>A | p.(Ala47Thr) | c.295C>A | p.(Leu99Ile) |
| P12‡ | F10 | 7/F | c.184C>T | p.(Arg62*) | c.295C>A | p.(Leu99Ile) |
| P13‡ | F1 | 7/F | c.806_810del | p.(Ala269Glyfs*2) | c.697G>C | p.(Val233Leu) |
| P14 | F11 | 7/F | c.164C>T | p.(Thr55Met) | c.806_810del | p.(Ala269Glyfs*2) |
| P15 | F12 | 7/M | c.883C>T | p.(Arg295*) | c.806_810del | p.(Ala269Glyfs*2) |
| P16 | F13 | 7/M | c.485T>C | p.(Leu162Pro) | c.485T>C | p.(Leu162Pro) |
| P17‡ | F14 | 8/M | c.226G>C | p.(Gly76Arg) | c.377C>T | p.(Ala126Val) |
| P18‡ | F15 | 8/M | c.883C>T | p.(Arg295*) | c.302A>G | p.(Asp101Gly) |
| P19‡ | F16 | 9/M | c.697G>C | p.(Val233Leu) | c.400T>C | p.(Ser134Pro) |
| P20‡ | F17 | 9/F | c.57_60del | p.(Ile22Glyfs*19) | c.641T>C | p.(Leu214Pro) |
| P21‡ | F18 | 10/F | c.806_810del | p.(Ala269Glyfs*2) | c.806_810del | p.(Ala269Glyfs*2) |
| P22‡ | F19 | 10/F | c.883C>T | p.(Arg295*) | c.883C>T | p.(Arg295*) |
| P23 | F20 | 10/F | c.295C>A | p.(Leu99Ile) | c.295C>A | p.(Leu99Ile) |
| P24‡ | F21 | 11/F | c.806_810del | p.(Ala269Glyfs*2) | c.146C>T | p.(Thr49Met) |
| P25‡ | F15 | 11/F | c.883C>T | p.(Arg295*) | c.302A>G | p.(Asp101Gly) |
| P26‡ | F8 | 11/M | c.806_810del | p.(Ala269Glyfs*2) | c.377C>A | p.(Ala126Glu) |
| P27‡ | F22 | 11/F | c.806_810del | p.(Ala269Glyfs*2) | c.883C>T | p.(Arg295*) |
| P28‡ | F1 | 11/F | c.806_810del | p.(Ala269Glyfs*2) | c.697G>C | p.(Val233Leu) |
| P29 | F23 | 12/M | c.63_66del | p.(Ile22Glyfs*19) | c.184C>T | p.(Arg62*) |
| P30‡ | F24 | 13/F | c.806_810del | p.(Ala269Glyfs*2) | c.133A>G | p.(Thr45Ala) |
| P31‡ | F22 | 13/M | c.806_810del | p.(Ala269Glyfs*2) | c.883C>T | p.(Arg295*) |
| P32‡ | F1 | 13/F | c.806_810del | p.(Ala269Glyfs*2) | c.697G>C | p.(Val233Leu) |
| P33 | F25 | 14/M | c.619A>G | p.(Asn207Asp) | c.697G>A | p.(Val233Ile) |
| P34 | F26 | 14/F | c.194G>A | p.(Arg65Gln) | c.506G>A | p.(Arg169Gln) |
| P35 | F27 | 14/M | c.446T>C | p.(Leu149Pro) | c.446T>C | p.(Leu149Pro) |
| P36‡ | F28 | 17/F | c.712dup | p.(Val238Glyfs*35) | c.712dup | p.(Val238Glyfs*35) |
| P37 | F29 | 17/F | c.609C>A | p.(Ser203Arg) | c.609C>A | p.(Ser203Arg) |
| P38 | F30 | 17/M | c.692G>A | p.(Gly231Asp) | c.823G>T | p.(Glu275*) |
| P39 | F27 | 17/M | c.446T>C | p.(Leu149Pro) | c.446T>C | p.(Leu149Pro) |
| P40 | F31 | 17/M | c.63_66del | p.(Ile22Glyfs*19) | c.806_810del | p.(Ala269Glyfs*2) |
| P41 | F32 | 21/F | c.63_66del | p.(Ile22Glyfs*19) | c.63_66del | p.(Ile22Glyfs*19) |
| P42 | F33 | 30/F | c.295C>A | p.(Leu99Ile) | c.295C>A | p.(Leu99Ile) |
| P43 | F34 | 35/F | c.806_810del | p.(Ala269Glyfs*2) | c.883C>T | p.(Arg295*) |
| P44 | F35 | 36/M | c.184C>T | p.(Arg62*) | c.63_66del | p.(Ile22Glyfs*19) |
| P45 | F36 | 40/M | c.429_432delinsGGT | p.(His143Glnfs*20) | c.429_432delinsGGT | p.(His143Glnfs*20) |
| P46 | F34 | 42/F | c.806_810del | p.(Ala269Glyfs*2) | c.883C>T | p.(Arg295*) |
Age at first study visit in years.
Aleman et al., 2018.
Jacobson et al., 2007.
F, female; M, male.
Table 2.
RDH12-LCA Natural History
| Parameter | Dataset | N * | Slope, Log10/Yr | Slope, %/Yr | P Value† | Tendency |
|---|---|---|---|---|---|---|
| BCVA | XS & L | 262/82/41 | 0.044 | 10.6% | 2.3E-21 | Deterioration |
| L only | 262/82/41 | 0.039 | 9.4% | 6.3E-11 | Deterioration | |
| Foveal ONL thickness | XS & L | 29/16/16 | –0.021 | –4.7% | 1.7E-04 | Deterioration |
| L only | 26/13/13 | –0.025 | –5.6% | 1.4E-05 | Deterioration | |
| Peripapillary ONL thickness | XS & L | 32/17/17 | n.s. | n.s. | 0.70 | No change |
| L only | 30/15/15 | n.s. | n.s. | 0.060 | No change | |
| Peripapillary OS thickness | XS & L | 31/17/17 | –0.058 | –12.5% | 0.012 | Deterioration |
| L only | 28/14/14 | –0.078 | –16.4% | 9.0E-04 | Deterioration | |
| Peripapillary ONL extent | XS & L | 32/17/17 | –0.029 | –6.4% | 0.025 | Deterioration |
| L only | 30/15/15 | –0.062 | –13.3% | 0.013 | Deterioration | |
| Kinetic field extent | XS & L | 68/36/19 | –0.036 | –8.0% | 6.8E-09 | Deterioration |
| L only | 37/8/4 | –0.031 | –6.7% | 1.8E-08 | Deterioration | |
| FST rod sensitivity loss | XS & L | 671/69/36 | n.s. | n.s. | 0.35 | No change |
| L only | 514/61/36 | –0.034 | –7.3% | 0.0038 | Improvement |
BCVA, best-corrected visual acuity; FST, full-field stimulus test; L, longitudinal; n.s., not significant; ONL, outer nuclear layer; OS, outer segment; XS, cross-sectional.
Numbers of observations/eyes/patients.
Linear mixed-effects models.
Clinical Imaging
En face imaging was performed with a scanning laser ophthalmoscope (Heidelberg Engineering GmbH, Heidelberg, Germany) using near infrared reflectance (NIR-REF), near infrared autofluorescence (NIR-AF), and short wavelength autofluorescence (SW-AF) modalities with 30 degrees or 55 degrees field of view.35,36 Ultra-wide field imaging was performed (Optos, Inc., Marlborough, MA, USA) to record pseudo-color fundus photographs and SW-AF.
Cross-sectional imaging was performed with spectral domain optical coherence tomography (SD-OCT) with one of two instruments (Spectralis; Heidelberg Engineering GmbH, Heidelberg, Germany or the RTVue-100; Optovue Inc., Fremont, CA, USA). The majority of the scans subtended 30 degrees along the horizontal meridian centered on the fovea or starting at the fovea and extending into the midperipheral retina. Some scans subtended 20 degrees along the horizontal meridian. The corresponding arc lengths on the retina can be estimated using the nominal retinal magnification factor of 300 µm/degree. Individual biometry was not available. Quantitative analyses were performed as previously described.9,10,37,38 In brief, raw OCT data were processed using custom programs (MATLAB 2023a; MathWorks, Natick, MA, USA) by first digitally joining segments to have as wide a coverage as possible. Outer nuclear layer (ONL) thickness was estimated using longitudinal reflectivity profiles (LRPs) at the fovea and in the peripapillary region. The hyposcattering ONL was defined between the hyperscattering layer attributed to outer plexiform layer (OPL) and the hyperscattering outer limiting membrane (OLM). In the parafoveal retina, signals from Henle fiber layer (HFL) would be expected between the OPL and the OLM,39 but, in the fovea and peripapillary regions, we expect the HFL component to be minimal.40 In the peripapillary region, outer segment (OS) length was estimated between the OLM and the RPE. The ONL and OS thicknesses were divided by the local mean normal values and reported as a fraction, or a logarithm of the fraction.
Adaptive Optics Imaging
To image the photoreceptor mosaic and estimate the density of cone photoreceptors, we used a custom-built, multimodal adaptive optics scanning laser ophthalmoscope (AOSLO) system, which was previously described.41,42 Three photomultiplier tubes (Hamamatsu Corporation) were configured to record confocal and nonconfocal split-detection near-infrared reflectance image sequences at 18 Hertz (Hz) simultaneously. AOSLO image sequences were acquired in the peripapillary retina and from the anatomical fovea along the nasal meridian if possible. The AOSLO image sequences from each retinal location were desinusoided, registered,43 and semi-automatically montaged.44 To quantify foveal densities, cones at the anatomic fovea were identified manually in the split-detection montage and a sliding square window 55 µm per side was then used to calculate the peak cone density. For peripapillary cone densities, a square region of interest 100 µm per side located 2.8 mm nasal from the anatomic fovea was selected, cones within the region of interest were manually identified in the split-detection image and bound cone density was calculated.
Perceptual Assessments of Visual Function
Kinetic perimetry was performed and the extent of visual field was quantified by using a computer-based algorithm and presented as a percent of the mean normal visual field extent.45 In patients with foveal fixation, static perimetry was performed with a modified automated perimeter (Humphrey Field Analyzer 750i; Carl Zeiss Meditec, Dublin, CA, USA), as previously described.38,46,47 In brief, white stimuli were used under light-adapted conditions, and blue (500 nm) and red (650 nm) stimuli were used under dark-adapted conditions. Test patterns sampled the retina at 2-degree intervals across the horizontal meridian. Photoreceptor mediation under dark-adapted conditions was determined by the sensitivity difference between the two stimuli.
Full-field stimulus test (FST) was developed to evaluate the retinal sensitivity in patients independent of fixation ability.47–50 Dark-adapted FST was performed in 36 patients with RDH12-LCA using 2 colors (blue = peak 467 nm and red = peak 637 nm) in a ganzfeld stimulator (ColorDome, Diagnosys LLC, Lowell, MA, USA); dilated eyes were tested sequentially with the contralateral eye patched. The stimulator was driven with one of two commercial consoles (E2 or E3; Diagnosys LLC, Lowell, MA, USA). In 4 of 36 patients, custom written FST2 software48 was used (E2 Console) to obtain single-button responses, whereas in the remaining 32 patients, the manufacturer's proprietary and undisclosed DiagnosysFST (referred to as D-FST hereafter) software51 was used (E3 Console) to obtain 2-button responses. Considering the young age of many of the subjects (range = 5–40 years and median = 10.4 years) and the limited literature on the use of the D-FST software in pediatric environments, raw data were evaluated in detail. The same D-FST protocol was used in adult and pediatric subjects.
In a typical setup, D-FST uses a yes/no forced choice psychophysical test (2-button responses) where variable-duration short (<4 ms) stimuli of different integrated luminances are presented and the subject responds based on visual detection. The aim is to estimate the threshold which is the stimulus luminance that the subject sees 50% of the time on average. The order of the presentations in D-FST are determined by a proprietary and undisclosed algorithm and they appear to include an approach to estimate a preliminary threshold (“auto-locate”) followed by recording of responses to stimuli presented around the preliminary threshold with an approach resembling the method of constant stimuli. Yes/no responses from each run are fit with a sigmoidal function and a final threshold estimated. D-FST also provides a proprietary and undisclosed quality (Q) factor (an integer between 0 and 3) for each threshold estimate. Q of 0 is thought to represent unusable data, Q of 2 and 3 are thought to represent reliable results; usability of data with a Q of 1 is left to the specific protocol with some studies accepting them and some discarding them.
We qualitatively evaluated 1061 sets of D-FST recordings obtained from 62 eyes performed on 85 different visits. D-FST assigned to Q of 2 or 3 (412/1061 = 39%) appeared physiologically plausible and were repeatable. However, D-FST recordings assigned to Q of 0 or 1 (649/1061 = 61%) appeared to be substantially more variable. Five representative D-FST recordings assigned a Q value of 1 demonstrate the range of such results (Supplementary Fig. 1A). Patient (P)14 at age 10 years and P12 at age 11 years showed yes/no responses with a clear and steep transition plausibly representing a physiological threshold; in each case, there is a single yes response that appears to be erroneous. P26 at age 13 years and P17 at age 9 years showed a collection of yes/no responses that are not likely to be physiologically plausible. P17 at age 12 years showed a plausible yes/no transition with 2 likely erroneous responses. There were similar ranges of results with a Q value of 0.
We re-analyzed the raw D-FST data in search of an alternative quality score that better represents an acceptability classification for each recording as follows: a Weibull function50 (y = 1 − exp( − (x/α)β)) was fit to the proportions of yes/no responses (y) at each tested intensity (x) in phot-cd.s.m−2 units (obtained by inverse-log converting from instrument log phot-cd.s.m−2 output), and a threshold was obtained as the intensity for 50% ordinate of the function. The 95% confidence interval from a preliminary fit where both α and β were free to vary, was used to define the acceptable range for α. Parameter β was then fixed to 3.052 and α left to vary within the acceptable range. We defined a score E as the maximum of the two mean-squared-errors calculated considering responses above and below threshold, respectively. We labeled the recording as acceptable based on the following empirical criteria: (1) the threshold was within the range of the equipment, (2) the data set included at least three responses above and at least three responses below the threshold, and (3) score E was lower than 0.3. This criterion classifies as acceptable 54 of 222, 283 of 427, 147 of 159, and 244 of 253 recordings with Q values of 0, 1, 2, and 3, respectively (Supplementary Fig. S1C). Mean normal dark-adapted values provided by the manufacturer (–4.59 and –7.19 log phot-cd.s.m−2 for red and blue stimuli, respectively) were used to determine rod sensitivity losses.
In a subset of patients, light-adapted D-FST was used to be able to directly compare rod- and cone-mediated sensitivities. The light-adaptation background used (white = 100 phot-cd.m−2) was higher than the standard (white = 10 phot-cd.m−2) background used in perimetry for two main reasons. First, in patients with cone diseases, the standard background does not fully desensitize the rod system,53,54 which is consistent with murine work showing rods can signal over this range.55,56 Second, the standard background can be produced by two different luminance ranges (depending on the age of the instrument and version of software), which introduces an unknown regarding the minimum luminance increment above the background available. Mean normal values provided by the manufacturer (–1.92 and –2.29 log phot-cd.s.m−2 for red and blue stimuli, respectively) were used to determine sensitivity losses. Photoreceptor mediation for dark-adapted and light-adapted conditions was defined by the difference of thresholds between blue and red: between 0.4 and 2.1 log, mixed-mediated, greater than 2.1 log, rod-mediated, and less than 0.4 log cone-mediated.
Statistics
Linear mixed-effects models57 accounting for the data correlation structure were used to assess progression associated with BCVA, rod sensitivity loss (RSL), ONL thickness, and kinetic visual field extent. Separate regressions were performed for each variable versus age and time from the first visit. Reference values obtained from adults were used for all structural and functional results.
Results
Molecular Characteristics
There were 32 RDH12 variants across the 36 families (see Table 1). Overall, 9 variants occurred in multiple unrelated families whereas 23 variants occurred in individual families. The most frequent variants were c.806_810del (11 families), c.883C>T (7 families), and c.295C>A (5 families). Among all 32 variants, 27 were classified as pathogenic or likely pathogenic by American College of Medical Genetics and Genomics (ACMG) criteria,58 and 5 were classified as variant of unknown significance (VUS). Variants classified as VUS included c.194G>A, c.302A>G, c.400T>C, and c.641T>C, which were each in trans with a known pathogenic variant demonstrating familial co-segregation, and were associated with a disease phenotype consistent with RDH12-LCA. In each case, historical molecular reports preceding ACMG criteria suggested positive or likely positive results. One VUS, c.800A>C, has an extremely low allele frequency, and is in a region of exon 8 with 7 other reported pathogenic variants. This variant was found in a patient where no familial co-segregation information was available; however, the disease phenotype was consistent with RDH12-LCA.
Localization of Retained Photoreceptors
The literature on RDH12-LCA shows a wide spectrum of disease severity across ages and ethnicities.7–10,28,30 Commonly observed across many severity stages are retained photoreceptors in three retinal regions (Fig. 1): (a) foveal region where there is either direct evidence of retained ONL, or indirect evidence of retained visual function, (b) peripapillary retina, and (c) mid/far-peripheral retina as detected by retained autofluorescence (AF) on wide angle images. Next, we considered the natural history of retinal structure and function at these three regions.
Figure 1.
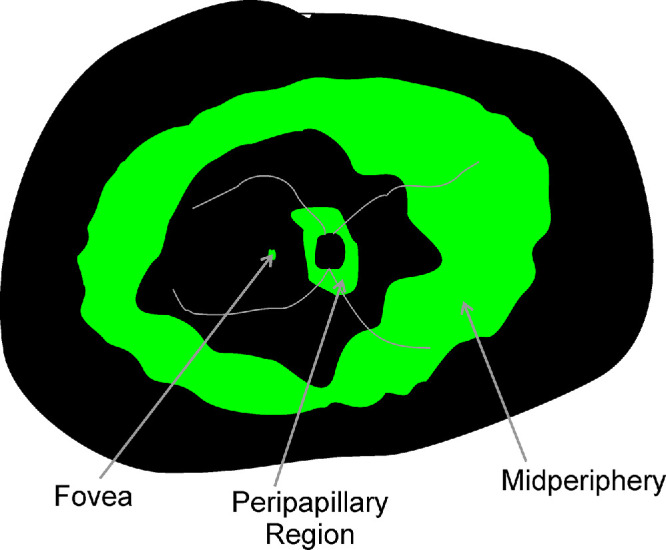
Schematic of retinal regions reported to be relatively preserved (green) in RDH12-LCA: foveal region, parapapillary region, and peripheral region.
Foveal Structure and Function
BCVA reflects the function of the fovea when fixation is at the fovea. When fixation is extrafoveal, foveal spatial resolution is understood to be equal or worse than the measured BCVA. In the current cohort, BCVA ranged from 0.20 logMAR to light perception (LP; Fig. 2A). Of note, across the whole cohort, the best BCVA of 0.20 logMAR was recorded at age 12 years in 3 eyes of 3 patients (P6-OD, P12-OS, and P25-OS). This was counterintuitive considering the large number of patients evaluated at younger ages, and hinted at the possibility of better testing performance with maturation.59,60 Eight eyes of five patients had the worst recorded BCVA of LP (P36-OD, P38-OD, P43-OU, P44-OU, and P46-OU) at ages 17 to 42 years. The median BCVA across the cohort was 0.90 logMAR. Refractive error ranged from –5.25 diopters (D) to +8.50 D (spherical equivalent) and tended to be hyperopic (median = +3.25 D). Cross-sectionally, the natural history of BCVA with age showed a cohort slope of 0.044 logMAR/year (P = 2.3E-21, mixed-effects model; see Table 2). There was generally interocular symmetry with a median BCVA difference of 0.18 logMAR between eyes; however, there were also examples of substantial asymmetry where one eye could be up to 3.4 logMAR worse than the contralateral eye (Fig. 2B). In a subset of 31 patients, serial data were obtained over observation durations ranging from 1 to 26 years (median = 4.7 years). Longitudinally, BCVA tended to change slowly (Fig. 2C); slopes from linear regressions obtained individually for each eye ranged from –0.2 to 0.4 logMAR/year (median = 0.013 logMAR/year), and the cohort slope was 0.039 logMAR/year (P = 6.3E-11, mixed-effects model; see Table 2).
Figure 2.

Best corrected visual acuity (BCVA) and foveal structure and function. (A) BCVA across all subjects, eyes, and visits. Connected symbols represent serial visits. (B) Interocular asymmetry of BCVA. The diagonal gray line represents equal acuity in both eyes. (C) Change of BCVA over time in the subset of eyes with serial visits. (D) Foveal ONL thickness in the subset of eyes with retained visual acuity. (E) Change of foveal ONL thickness over time in the subset of eyes with serial visits. The dashed red lines in panels A, C, D, and E represent mixed-model regression results that produced a statistically significant slope. (F) Relationship between foveal ONL thickness and foveal cone sensitivity loss (CSL). Symbols are the patients with RDH12-LCA. Normal variability is described by ellipses encircling the 95% confidence interval of a bivariate Gaussian distribution. Dashed lines indicate the idealized model of the relationship between structure and function in pure photoreceptor degenerations and the region of uncertainty that results by translating the normal variability along the idealized model. (G, H) Split detection AO images montaged at the foveal region of two patients with retained BCVA. Peak cone densities (based on a sliding 55 µm × 55 µm box) are 28,200, and 23,500 cones.mm−2 for P25 and P34, respectively. Below AO images are foveal OCTs. Horizontal lines demarcate the region corresponding to the AO, the brackets are the regions corresponding to RPE melanization, and the double arrows correspond to the ONL thickness.
Foveal structure by OCT was quantified for a subset of 16 patients selected for having an eye with relatively spared BCVA at 0.6 logMAR or better.61 All had detectable but abnormal ONL at the fovea (Fig. 2D). Cross-sectionally, the natural history of ONL thickness with age showed a cohort slope of –0.021 log/year (P = 1.7E-4, mixed-effects model; see Table 2). In 13 patients, there were serial data allowing evaluation of longitudinal natural history (Fig. 2E) where the cohort slope was –0.025 log/year (P = 1.4E-5, mixed-effects model; see Table 2). In seven patients (P6, P11, P21, P22, P31, P33, and P34), co-localized foveal sensitivities and foveal ONL thicknesses were measured and their relationship was evaluated quantitatively with a model of the structure-function.9,62 Foveal sensitivity losses were consistent with foveal cone photoreceptor losses (Fig. 2F), with no evidence of intrinsic foveal cone photoreceptor dysfunction, similar to previous observations.9
In two patients (P25 and P34) with retained BCVA and foveal fixation, and OCT evidence of retained ONL, corresponding to a small locus of detectable inner and outer segment signals and retinal pigment epithelium (RPE) melanization, AOSLO imaging showed retained cones at the foveal region with substantially reduced density (Figs. 2G, 2H). Estimates of peak cone densities for P25 and P34 were 28,200 and 23,500 cones.mm−2, respectively.
Peripapillary Structure and Function
Some patients with RDH12-LCA show a distinct peripapillary area of relative preservation as demonstrated with P18 at age 8 years. The preservation of this retinal region is apparent on imaging with NIR-AF (Fig. 3A) as well as on cross-sectional imaging with OCT (Fig. 3B). Preservation implies a slower time-course of underlying disease progression in the peripapillary region compared to neighboring retinal regions as exemplified over 5 years in P18 (see Figs. 3A, 3B). To better understand the natural history and structure-function relationship in this retinal region, we searched for evidence of external limiting membrane (ELM), inner segment (IS) or OS layers immediately temporal to the optic nerve head in the OCT images of 37 patients. Qualitatively, 20 patients (54%) had no evidence of ELM, IS, or OS. In the remaining 17 patients with qualitative evidence, ONL thickness, OS layer thickness, and ONL extent were quantified and plotted as a function of age (Fig. 3C). Maximal ONL thickness ranged from 21 to 52 µm, and maximal OS thickness ranged from 3 to 28 µm at first visit. The region of ONL retention often had an abrupt ending which extended 3 degrees to 6 degrees temporal to the optic nerve head. Cross-sectionally, the slope of the peripapillary ONL thickness with age was not statistically significant (P = 0.7, mixed-effects model; see Table 2), but peripapillary OS thickness showed a cohort slope of –0.058 log/year (P = 0.012, mixed-effects model; see Table 2). Similarly, peripapillary ONL extent showed a tendency to shrink with a cohort slope of –0.029 log/year (P = 0.025, mixed-effects model; see Table 2). In a subset of 15 patients, there were serial data allowing evaluation of longitudinal natural history (Fig. 3D). The slope of the peripapillary ONL thickness was not statistically significant (P = 0.060, mixed-effects model; see Table 2), but peripapillary OS thickness showed a cohort slope of –0.078 log/year (P = 9.0E-4, mixed-effects model; see Table 2). Peripapillary ONL extent showed a tendency to shrink with a cohort slope of –0.062 log/year (P = 0.013, mixed-effects model; see Table 2).
Figure 3.

Peripapillary structure and rod function. (A, B) Preserved peripapillary region on autofluorescence imaging (A) and on OCT (B) in a representative patient P18 at ages 8 and 13 years. Quantified measures of ONL thickness, OS thickness, and ONL extent are shown (B, upper). (C) Peripapillary ONL thickness, OS thickness, and ONL extent as a function of age. ONL and OS thicknesses presented as logarithm of fraction of mean normal values. Connected symbols represent serial visits. Horizontal gray dashed lines represent the normal range. (D) Change in ONL thickness, OS thickness, and ONL extent as a function of time from first visit. Dashed red lines in panels C and D represent mixed-model regression results that produced a statistically significant non-zero slope. (E) Relationship between peripapillary ONL thickness and rod sensitivity loss (RSL). Symbols are from 52 locations with measurable ONL in 14 patients with RDH12-LCA. Normal variability is described by ellipses encircling the 95% confidence interval of a bivariate Gaussian distribution. Dashed lines indicate the idealized model of the relationship between structure and function in pure photoreceptor degenerations and the region of uncertainty that results by translating the normal variability along the idealized model.
At the eccentricity of the peripapillary region, more than 80% of the normal ONL thickness is expected to be rod cell nuclei.63 Therefore, we used a model of simple retinal degeneration62 to compare losses of sensitivity mediated by rods (based on chromatic sensitivity differences) available in a subset of 14 patients to co-localized ONL thicknesses (Fig. 3E). At nearly all sampled locations, rod sensitivity loss far exceeded that predicted from the ONL thickness. The extent of structure-function dissociation, and thus treatment potential, ranged from 0.5 log to nearly 4 log units for rod photoreceptors (see Fig. 3E). Unlike the structural-functional relationship at the fovea, the relationship in the peripapillary retina is consistent with intrinsically insensitive rod photoreceptors that are structurally spared.
Cone nuclei at the eccentricity of the peripapillary retina are expected to contribute a small fraction to the thickness of the ONL as determined by OCT. To better understand the extent of cone photoreceptor sparing within the peripapillary retina, we performed AOSLO imaging in 4 patients at ages 10 to 17 years (Fig. 4A). Peripapillary cone densities were 7770, 7950, 6430, and 4260 cones.mm−2 for P18, P23, P25, and P34, respectively. Cone densities were either normal or borderline normal, with one exception being likely abnormally reduced (normal density64,65 = 8780 ± 1280 cones/mm2 at 2.8 mm or 9.3 degrees). For three of the patients with AOSLO (P18, P25, and P34), co-localized peripapillary rod and cone sensitivity loss estimates were obtained either on the same visit or within 8 months. Cone sensitivity losses ranged from 0.1 to 0.6 log, whereas rod sensitivity losses were greater and ranged from 0.9 to 1.2 log. In total, 21 patients had measurable cone sensitivity losses in the peripapillary region, and they ranged from near normal to major losses (Fig. 4B). Colocalized measures in the peripapillary region showed rod sensitivity losses to be always greater than cone sensitivity losses (Fig. 4C).
Figure 4.

Peripapillary cones and function. (A) Split detection AO images montaged at the peripapillary region of four patients in comparison with normal. Cone densities were 7770, 7950, 6430, and 4260 cones.mm−2 for P18, P23, P25, and P34, respectively. For P23, peripapillary montage and the chosen region of interest are shown. (B) Peripapillary cone sensitivity loss measured with a white stimulus under light adapted (LA) condition in all available subjects, eyes, and visits. (C) Quantitative comparison of LA cone sensitivity loss with dark-adapted (DA) rod sensitivity loss co-localized in the peripapillary retina. The gray line is the equal rod and cone sensitivity loss.
Macular Degeneration
Common to nearly all RDH12-LCA is a predilection for macular involvement often with foveal and peripapillary sparing. This feature is usually observed clinically and with autofluorescence imaging as RPE depigmentation or atrophy. However, the macular degeneration we observed on cross-sectional imaging with OCT had both expected and unexpected features. Comparison is made to a case of a common maculopathy due to ABCA4-associated Stargardt disease (STGD) to demonstrate features. ABCA4-STGD can show complete absence of sublamina corresponding to photoreceptors (outer plexiform layer or OPL, ONL, ELM, IS, and OS) and RPE neighboring an area of peripapillary sparing (Fig. 5A, middle). A widened inner nuclear layer (INL) is thought to represent the remodeling of the retina following photoreceptor degeneration.66
Figure 5.

ONL-like hyposcattering layer on OCT in the macula. (A) OCT scans from fovea toward the nasal retina along the horizontal meridian in normal, ABCA4-STGD, and RDH12-LCA eyes. Inner nuclear layer (INL) and outer nuclear layer (ONL) are highlighted with purple and blue, respectively. RDH12-LCA retina has an additional hyposcattering ONL-like layer that is highlighted with light blue. Insets show the magnified regions of transition between macular degeneration and peripapillary sparing. BrM, Bruch membrane; OPL, outer plexiform layer. (B) Longitudinal changes observed over 3 years in 2 patients demonstrating thickening (P19) and thinning (P34) of the ONL-like layer.
RDH12-LCA retinas also showed the INL thickening in macular regions temporal to the peripapillary sparing (see Fig. 5A, lower). However, there was an additional hyposcattering ONL-like layer that could have substantial thickness that spanned across large regions of the macula. This unexpected finding was unlike a thin layer of remnant photoreceptors sometimes observed in the immediate vicinity of geographic atrophy margins.67,68 Careful examination of the ONL-like layer in RDH12-LCA showed a lack of ELM, IS, OS, or RPE layers that would be expected if the layer was indeed a relatively spared ONL. Furthermore, the continuity of the OPL layer from the spared peripapillary retina appeared to split near the junction of the ONL-like layer and true ONL (see Fig. 5A, yellow arrow, inset). In six eyes where AOSLO montages were available, a photoreceptor mosaic was not apparent in the region with ONL-like layer. To better understand features of this ONL-like layer, we evaluated its thickness serially in a subset of patients. As exemplified by P19, some patients showed thickening of the ONL-like layer over time, whereas others exemplified by P34, showed thinning over time (Fig. 5B).
Peripheral Retinal Structure and Function
In many patients with RDH12-LCA, there was evidence on ultra-wide-angle imaging of partially retained mid- and/or far-peripheral retinal regions. This is exemplified by ultra-wide angle AF images in 2 patients, P34 at age 17 years and P12 at age 14 years, demonstrating retained RPE in the peripheral retina (Fig. 6A, upper row). Consistent with the retained retinal structure, there was retained peripheral visual function as apparent by the extent of kinetic visual fields obtained with a large and bright V4e target (see Fig. 6A, lower row). Cross-sectionally, the natural history of kinetic visual field extent with age (Fig. 6B) showed a cohort slope of –0.036 log/year (P = 6.8E-9, mixed-effects model; see Table 2). There was generally interocular symmetry (Fig. 6C). In a subset of 4 patients followed longitudinally (see Fig. 6D), serial data had a cohort slope was –0.031 log/year (P = 1.8E-8, mixed-effects model; see Table 2).
Figure 6.

Peripheral function. (A) Ultra-wide-angle autofluorescence imaging showing mid- and far-peripheral retention of retina (upper row) and retained peripheral vision on kinetic perimetry (lower row) in 2 representative patients P34 and P12. Tr, Ir, and Nr represent temporal, inferior, and nasal retina, and Nf, If, and Tf represent nasal, inferior, and temporal visual fields, respectively. (B) The extent of the kinetic field across all subjects, eyes, and visits. Connected symbols represent serial visits. (C) Interocular asymmetry of kinetic field extent. The diagonal line represents equal extents in both eyes. (D) Logarithm of change of kinetic field extent over time in the subset of eyes with serial visits. The dashed red lines in panels B and D represent mixed-model regression results that produced a statistically significant non-zero slope.
Retina-Wide Visual Function
To better understand maximum retinal sensitivity across the largest range of ages and severities of patients, we used dark-adapted two-color FST, which is a short test that can be performed independent of fixation ability and disease stage. Most FST measurements to date have been in adult subjects; there is little information in pediatric subjects.50 Because the great majority of the current patients were under the age of 18 years, there was an opportunity to evaluate FST in pediatric subjects. Two representative patients provide examples of FST results with replicates to demonstrate quality and repeatability of this type of visual function data (Figs. 7A, 7B). P32 at age 14 years showed steep yes/no transitions for red and blue FSTs with excellent replication (see Fig. 7A, first row). On follow-up at ages 16 and 18 years, red and blue FSTs did not appear to change appreciably (see Fig. 7A, second and third rows). Average red thresholds were –2.92 log cd.s.m−2, and average blue thresholds were –5.20 log cd.s.m−2, with a 2.28 log difference supporting rod mediation. P10 at age 7 years also showed remarkably good quality of red and blue FST responses that were repeatable on replication (see Fig. 7B, first row). On follow-up at ages 10 and 13 years, red and blue FSTs retained their good quality and repeatability (see Fig. 7B, second and third rows). Counterintuitively, both red thresholds at –2.66, –3.10, and –2.83 log cd.s.m−2, and blue thresholds at –5.11, –5.68, and –5.92 log cd.s.m−2 at ages 7, 10, and 13 years, respectively, showed a tendency to improve with age. Blue minus red differences of 2.45, 2.58, and 3.09 log suggested mediation by rods at all visits.
Figure 7.

Dark-adapted chromatic FST. (A, B) Raw FST data recorded serially at 3 ages in 2 representative pediatric patients P32 (A) and P10 (B). Red and blue colors denote respective stimuli used. Mean proportion seen (white squares) are fit with a modified Weibull function (smooth curves). Threshold is estimated at 50% seen (colored arrow). For each color, laterally paired panels show repeated tests. All yes/no responses are plotted jittered above and below the 100% and 0% lines, respectively (gray filled symbols). (C) Rod sensitivity loss (RSL) estimated from FST across all subjects, eyes, and visits. Greater RSL implies worse vision. Connected symbols represent serial visits. (D) Interocular asymmetry of RSL. The gray line represents equal results in both eyes. (E) Change of RSL over time in the subset of eyes with serial visits. Positive change represents worsening vision. The dashed red line represents mixed-model regression results that produced a statistically significant non-zero slope.
For chromatic dark-adapted FST measures recorded across all eyes and visits, 17 patients (47%) had rod mediation, 7 patients (19%) had mixed mediation, and no patients had pure cone mediation. In 12 patients (33%), FSTs were rod mediated at some instances and mixed mediated at others. Rod sensitivity losses (RSLs) calculated from blue FST ranged from 0.5 to 4.2 log with a median of 2.40 log (Fig. 7C). Cross-sectionally, the slope of the RSL with age was not statistically significant (P = 0.35, mixed-effects model; see Table 2) for the cohort as a whole. FST generally showed interocular symmetry with a median difference of 0.24 log and a maximum difference of 1.22 log (Fig. 7D). In a subset of 19 patients, there were serial FST data recorded over follow-up periods ranging from 1 to 6 years (Fig. 7E). Notably nearly all the serial data were recorded in pediatric patients (age range = 6 to 19 years, and median = 12 years). Slopes from linear regressions obtained individually for each eye ranged from –0.85 to 1.01 log/year (median = –0.046), and the cohort slope was –0.034 log/year (P = 0.0038, mixed-effects model; see Table 2) supporting a counterintuitive improvement of FST thresholds with age.
In a subset of 14 patients, both dark-adapted and light-adapted D-FST measures were performed with red and blue stimuli at the same visit and same eye allowing direct comparison of rod and cone function. Typically, dark-adapted thresholds showed approximately 2.5 log difference between the 2 colors expected from mediation by rods whereas light-adapted thresholds were comparable between the colors as demonstrated by 2 representative patients (Supplementary Figs. S2A, S2B). Across the cohort, loss of dark-adapted rod FST sensitivity tended to be greater than the loss of light-adapted cone FST sensitivity when measured with blue (Supplementary Fig. S2C) or red (Supplementary Fig. S2D) stimuli.
Discussion
Biallelic mutations in RDH12 are among the top 25 most commonly implicated genes causing autosomal recessive forms of inherited retinal disease,69–71 and one of the more common genetic causes of LCA and EORD.1,72 Over the 2 decades since its discovery, the phenotypic spectrum has expanded to range from LCA to milder forms of the disease, such as cone-rod dystrophy and isolated macular disease with normal full-field electroretinograms (ffERGs).7–10,22–26,28–34 Even in the LCA phenotype, there are some retinal regions with relative preservation of photoreceptors and vision at least at some stages of disease. Treatment aims for these retained photoreceptors include improvement of vision, which requires better understanding of structure-function relationships, or arrest of the progressive degeneration, which requires better understanding of progressive natural history. Therefore, we evaluated pediatric and adult patients RDH12-LCA to estimate the natural history of retinal structure and visual function, and their quantitative relationship, when possible. The strengths of this study included a large number of molecularly clarified pediatric patients evaluated quantitatively with measures of retinal structure and visual function recorded longitudinally. Limitations of the study included non-uniform availability of all visual function measures across the whole cohort and the resulting potential for selection bias.
Foveal Cones
Sparing of foveal structure and function as compared to the surrounding macular region was observed in a subset of the current patients with RDH12-LCA confirming previous literature across a range of disease severities.9,10,24,29,33,34 Although not specifically quantified, the extent of foveal sparing tended to be a small region of pigmented RPE within a larger pericentral region of RPE demelanization and atrophy. We found cone-mediated light sensitivity within the spared foveal island to be predictably related to the photoreceptor cell loss estimated from the thickness of the ONL layer, confirming previous findings.9 AOSLO-based cone density estimates at the fovea were consistent with ONL layer thinning. Thus, all the evidence in the current work taken together with previous literature suggests that foveal cones of RDH12-LCA do not hold a large vision improvement potential, unlike foveas of LCA associated with RPE65, CEP290, NPHP5, or LCA5 mutations.9,62,73–78 For the spared foveas of patients with RDH12-LCA, treatments should aim to arrest the progressive degeneration. Our work provides a preliminary estimate of the natural history of ONL thinning at the fovea with an exponential progression rate of 0.02 log per year. This progression rate could be an underestimate as it does not consider age-related changes in the outer retina. However, all of the foveal data originated from patients at 6 years of age or older where developmental changes are thought to be minimal.79–81 Based on a simple model previously proposed,62 light sensitivity loss would be predicted to progress at 0.04 log per year. In the current work, there was not sufficient data to estimate rate of loss of foveal light sensitivity, but BCVA showed a similar overall progression rate of 0.04 log/year. We should note, however, that BCVAs were obtained across all severity stages thus presumably including both foveal and extrafoveal sources of spatial vision. The findings are consistent with previous estimates of BCVA decline (0.02 to 0.03 log/year) in patients with RDH12-LCA.34
Peripapillary Rods and Cones
An usual preservation of parapapillary retinal structure and function was first described in ABCA4-STGD 2 decades ago.82,83 Since that time, diverse genetic retinal diseases have also been found to have para- or peri-papillary preservation (terms used interchangeably) of the retina84–89, including RDH12-LCA.10,28,29,34 The function and structure of both rods and cones in the peripapillary retina of RDH12-LCA eyes were evaluated in the current work for the first time to determine whether there was vision improvement potential. Assuming a substantial portion of the ONL thickness originates from rod photoreceptor nuclei, there was evidence of major dissociation of rod function from retinal structure implying a successful gene therapy in the peripapillary region could show immediate large improvements, such as observed in RPE65- and GUCY2D-LCA.90,91 Cone sensitivity loss, on the other hand, was smaller in magnitude implying less of an improvement potential.
Nearly half of the RDH12-LCA eyes that had peripapillary preservation at the time of their first evaluation at an average age of 8.8 years and retained this spared area over an average of 3.3 years of follow-up. In contrast, the other half of the patients did not have evidence of peripapillary preservation at the time of their first evaluation. It remains unknown whether this feature is imprinted congenitally in a subset of patients or driven by interindividual variations in spatiotemporal progression rate. However, an anecdotal result from one case provides some cause for speculation. P1 at age 2 years had clear evidence of peripapillary preservation, which had completely degenerated by age 7 years, suggesting that unknown genetic or environmental causes acting in the first decade of life. Remaining eyes showed no statistically significant thinning of the ONL, which is unlikely to be affected by minimal developmental changes at the peripapillary retinal for the ages studied.80 Our results taken together suggest that once the peripapillary retina survives the onslaught of early degeneration occurring elsewhere, it is much more likely to be spared during ensuing decades.
Previously, several hypotheses have been proposed that could act alone or in concert to explain peripapillary sparing.82 A localized reduction in the photoreceptor to RPE ratio could relieve the load of disc membranes that need to be ingested daily. Shadowing of short wavelength light onto photoreceptors due to localized thickening of the retinal nerve fiber layer could provide protection. A localized increase in retinal capillary vascularity, or melanin concentration could guard RPE cells from light-induced apoptosis. Last, higher expression of neurotrophic factors at the edges of the retina could provide enhanced survival of peripapillary photoreceptors and RPE.
RPE Atrophy in Non-Foveal Macula
IRDs show a sequence of outer retinal changes involving progressive OS shortening, photoreceptor degeneration, demelanization, and atrophy of the RPE.92,93 Once the local retinal degeneration has reached the stage of RPE atrophy, there usually are no photoreceptors remaining.94 Therefore, it was surprising to observe a relatively thick ONL-like hyposcattering layer on OCT across wide expanses of non-foveal macula of patients with RDH12-LCA that appeared to colocalize with RPE atrophy. Histological source of this layer is currently unknown but there are two main possibilities: (a) survival of photoreceptors without RPE support; or (b) formation of a new hyposcattering layer upon degeneration of photoreceptors. Remnant photoreceptors are sometimes observed near geographic atrophy margins.67,68 Observations of apparent thickening of this ONL-like layer over time in some patients, taken together with the lack of colocalized IS and OS, provides greater support for non-photoreceptor-nuclei origin such as the result of glial activation that occurs secondary to neuronal damage.95 Retinal remodeling occurring in the inner and/or outer retina could complicate future treatment attempts at these locations.
Molecular Defect and Human Phenotype
RDH12 is expressed in photoreceptor inner segments and belongs to a family of retinol dehydrogenases that can metabolize all-trans- as well as cis-retinols and have the biochemical potential to complement each other.96 Discovery of RDH12 mutations causing an early onset and severe retinal degeneration7,8 made it clear that RDH12 has a key role in human retinas that cannot be substituted with another retinol dehydrogenase. It was initially hypothesized that RDH12 is a key enzyme necessary for the reduction of all-trans retinal released from photopigments in the recovery phase of the visual cycle following absorption of a photon; loss-of-function mutations would result in deficits in the production of chromophore.97 But the human phenotype of RDH12-LCA is very different than the phenotype resulting from the classic chromophore production deficit disease lending no support to this hypothesis.9 Work performed in mouse rods led to the hypothesis that RDH12 protects cellular macromolecules against oxidative modification.13,14 Research performed in zebrafish cones pointed at the involvement of RDH12 in the oxidation of 11-cis retinol in the cone-specific retinal visual cycle17 supporting an earlier speculation.96 What remains unknown, but likely, is whether RDH12 has substantially distinct roles in rod versus cone IS. In addition, it remains unexplored whether the role of RDH12 changes across the human retinal topography.
Does the human RDH12-LCA phenotype contribute to the understanding of the pathobiology? In most cases, across large swaths of retina, there was severe and early loss of both rod and cone function and retinal degeneration, thus supporting a key role of RDH12 within both photoreceptor classes across most of the human retina. However, there were topographical exceptions such as the relative sparing of the fovea where there is a high concentration of cone photoreceptors. The cone visual cycle is thought to include Muller glial cells16 but there is some recent evidence of possible diversity of Muller glia at the fovea.98 Specifically, there appear to be inner glia that extend only from INL to the OPL as opposed to canonical outer glia that extend from the INL to the ELM. If RDH12 is indeed involved in the cone visual cycle, topographic changes in glial diversity could contribute to observed sparing of foveal and peripapillary regions. In addition, existence of detectable, and sometimes near-normal, cone function at these locations suggests that RDH12 could not be the sole source of chromophore.
When evaluated locally in the peripapillary retina, perceptual loss of rod sensitivity tended to be greater than loss of cone sensitivity. This finding was not consistent with relatively greater reduction of cone compared to rod ERGs reported in rare late-onset cases previously.27,33 However, it is important to note that the great majority of the early-onset cases do not have recordable ERGs and late-onset cases in the literature were not evaluated perceptually. The preferential involvement of the cone-rich central retina in milder cases could also disproportionally impact full-field cone ERG signals and misrepresent the retina-wide relationship between rod and cone photoreceptor dysfunction. Differences in structure-function dissociation in rods and cones caused by the RDH12 mutations documented in our work may support distinct roles for this enzyme in the two photoreceptor types.
Measure of Rod and Cone Function With FST in Pediatric Patients
Within specific retinal regions in subsets of patients, subspecialized tests of retinal function and structure such as perimetry or OCT or AOSLO were able to be performed to better understand the local consequences of the disease. But many patients with RDH12-LCA have unstable eyes that preclude co-localization of structure and function. Practically, in all these severely affected patients, FST is the only perceptual test that can provide a quantitative estimate of rod and cone function.47–50 The great majority of the FST results in the literature have been performed with custom software running on a commercial ganzfeld.53,75,91,99–105 There has been a paucity of detail about the performance of the commercial software D-FST in adults as well as pediatric subjects. In the current work, we used an extensive serial data set collected with D-FST to provide greater insight. The quality of the responses as judged with the resulting psychometric function was high and repeatable on replication independent of age. However, there was a slight but statistically significant improvement of FST thresholds with age as opposed to the progression expected from an IRD. The reason for the counterintuitive improvement is not known but highly unlikely to be physiological since most patients were well beyond the age of ocular development. Consistent with the FSTs were BCVA where best values were obtained near age 12 years and not younger. Thus, it is parsimonious to consider potential maturation of decision-making as relevant to perceptual tests in serial studies involving pediatric patients.
Supplementary Material
Acknowledgments
The authors thank the RDH12 Fund for their logistical and organizational support, and to the families and patients for their participation in this study.
Supported by the RDH12 Fund for Sight, NIH (R01EY028601 and P30EY001583), Research to Prevent Blindness, and the Samuel G. Jacobson, MD, PhD, Memorial Fund.
Disclosure: T.S. Aleman, None; A.J. Roman, None; K.E. Uyhazi, None; Y.Y. Jiang, None; E.C. Bedoukian, None; A. Sumaroka, None; V. Wu, None; M. Swider, None; I. Viarbitskaya, None; R.C. Russell, None; E.O. Shagena, None; A.J. Santos, None; L.W. Serrano, None; K.M. Parchinski, None; R.J. Kim, None; M.L. Weber, None; A.V. Garafalo, None; D.A. Thompson, None; A.M. Maguire, None; J. Bennett, None; D.H. Scoles, None; E.C. O'Neil, None; J.I.W. Morgan, (P) 8226236, 11607125, and US Patent App 63/497,933; A.V. Cideciyan, None
References
- 1. den Hollander AI, Roepman R, Koenekoop RK, Cremers FPM.. Leber congenital amaurosis: genes, proteins and disease mechanisms. Prog Retin Eye Res. 2008; 27: 391–419. [DOI] [PubMed] [Google Scholar]
- 2. Kumaran N, Moore AT, Weleber RG, Michaelides M.. Leber congenital amaurosis/early-onset severe retinal dystrophy: clinical features, molecular genetics and therapeutic interventions. Br J Ophthalmol. 2017; 101: 1147–1154. [DOI] [PMC free article] [PubMed] [Google Scholar]
- 3. Huang CH, Yang CM, Yang CH, Hou YC, Chen TC.. Leber's congenital amaurosis: current concepts of genotype-phenotype correlations. Genes (Basel). 2021; 12: 1261. [DOI] [PMC free article] [PubMed] [Google Scholar]
- 4. Russell S, Bennett J, Wellman JA, et al.. Efficacy and safety of voretigene neparvovec (AAV2-hRPE65v2) in patients with RPE65-mediated inherited retinal dystrophy: a randomised, controlled, open-label, phase 3 trial. Lancet. 2017; 390: 849–860. [DOI] [PMC free article] [PubMed] [Google Scholar]
- 5. Russell SR, Drack AV, Cideciyan AV, et al.. Intravitreal antisense oligonucleotide sepofarsen in Leber congenital amaurosis type 10: a phase 1b/2 trial. Nat Med. 2022; 28: 1014–1021. [DOI] [PMC free article] [PubMed] [Google Scholar]
- 6. Jacobson SG, Cideciyan AV, Ho AC, et al.. Night vision restored in days after decades of congenital blindness. iScience. 2022; 25: 105274. [DOI] [PMC free article] [PubMed] [Google Scholar]
- 7. Janecke AR, Thompson DA, Utermann G, et al.. Mutations in RDH12 encoding a photoreceptor cell retinol dehydrogenase cause childhood-onset severe retinal dystrophy. Nat Genet. 2004; 36: 850–854. [DOI] [PubMed] [Google Scholar]
- 8. Perrault I, Hanein S, Gerber S, et al.. Retinal dehydrogenase 12 (RDH12) mutations in Leber congenital amaurosis. Am J Hum Genet. 2004; 75: 639–646. [DOI] [PMC free article] [PubMed] [Google Scholar]
- 9. Jacobson SG, Cideciyan AV, Aleman TS, et al.. RDH12 and RPE65, visual cycle genes causing Leber congenital amaurosis, differ in disease expression. Invest Ophthalmol Vis Sci. 2007; 48: 332–338. [DOI] [PubMed] [Google Scholar]
- 10. Aleman TS, Uyhazi KE, Serrano LW, et al.. RDH12 mutations cause a severe retinal degeneration with relatively spared rod function. Invest Ophthalmol Vis Sci. 2018; 59: 5225–5236. [DOI] [PubMed] [Google Scholar]
- 11. Kurth I, Thompson DA, Ruther K, et al.. Targeted disruption of the murine retinal dehydrogenase gene Rdh12 does not limit visual cycle function. Mol Cell Biol. 2007; 27: 1370–1379. [DOI] [PMC free article] [PubMed] [Google Scholar]
- 12. Chen C, Thompson DA, Koutalos Y.. Reduction of all-trans-retinal in vertebrate rod photoreceptors requires the combined action of RDH8 and RDH12. J Biol Chem. 2012; 287: 24662–24670. [DOI] [PMC free article] [PubMed] [Google Scholar]
- 13. Maeda A, Maeda T, Imanishi Y, et al.. Retinol dehydrogenase (RDH12) protects photoreceptors from light-induced degeneration in mice. J Biol Chem. 2006; 281: 37697–37704. [DOI] [PMC free article] [PubMed] [Google Scholar]
- 14. Marchette LD, Thompson DA, Kravtsova M, Ngansop TN, Mandal MN, Kasus-Jacobi A.. Retinol dehydrogenase 12 detoxifies 4-hydroxynonenal in photoreceptor cells. Free Radic Biol Med. 2010; 48: 16–25. [DOI] [PMC free article] [PubMed] [Google Scholar]
- 15. Sato S, Kefalov VJ.. cis Retinol oxidation regulates photoreceptor access to the retina visual cycle and cone pigment regeneration. J Physiol. 2016; 594: 6753–6765. [DOI] [PMC free article] [PubMed] [Google Scholar]
- 16. Sato S, Kefalov VJ.. The retina-based visual cycle. Annu Rev Vis Sci. 2024; 10: 293–321. [DOI] [PubMed] [Google Scholar]
- 17. Kaylor JJ, Frederiksen R, Bedrosian CK, et al.. RDH12 allows cone photoreceptors to regenerate opsin visual pigments from a chromophore precursor to escape competition with rods. Curr Biol. 2024; 34: 3342–3353. [DOI] [PMC free article] [PubMed] [Google Scholar]
- 18. Feathers KL, Jia L, Perera ND, et al.. Development of a gene therapy vector for RDH12-associated retinal dystrophy. Hum Gene Ther. 2019; 30: 1325–1335. [DOI] [PMC free article] [PubMed] [Google Scholar]
- 19. Bian J, Chen H, Sun J, et al.. Gene therapy for Rdh12-associated retinal diseases helps to delay retinal degeneration and vision loss. Drug Des Devel Ther. 2021; 15: 3581–3591. [DOI] [PMC free article] [PubMed] [Google Scholar]
- 20. Cideciyan AV, Jacobson SG.. Leber congenital amaurosis (LCA): potential for improvement of vision. Invest Ophthalmol Vis Sci. 2019; 60: 1680–1695. [DOI] [PMC free article] [PubMed] [Google Scholar]
- 21. Cehajic-Kapetanovic J, Singh MS, Zrenner E, MacLaren RE.. Bioengineering strategies for restoring vision. Nat Biomed Eng. 2023; 7: 387–404. [DOI] [PubMed] [Google Scholar]
- 22. Schuster A, Janecke AR, Wilke R, et al.. The phenotype of early-onset retinal degeneration in persons with RDH12 mutations. Invest Ophthalmol Vis Sci. 2007; 48: 1824–1831. [DOI] [PubMed] [Google Scholar]
- 23. Valverde D, Pereiro I, Vallespin E, Ayuso C, Borrego S, Baiget M.. Complexity of phenotype-genotype correlations in Spanish patients with RDH12 mutations. Invest Ophthalmol Vis Sci. 2009; 50: 1065–1068. [DOI] [PubMed] [Google Scholar]
- 24. Mackay DS, Dev Borman A, Moradi P, et al.. RDH12 retinopathy: novel mutations and phenotypic description. Mol Vis. 2011; 17: 2706–2716. [PMC free article] [PubMed] [Google Scholar]
- 25. Chacon-Camacho OF, Jitskii S, Buentello-Volante B, Quevedo-Martinez J, Zenteno JC.. Exome sequencing identifies RDH12 compound heterozygous mutations in a family with severe retinitis pigmentosa. Gene. 2013; 528: 178–182. [DOI] [PubMed] [Google Scholar]
- 26. Kuniyoshi K, Sakuramoto H, Yoshitake K, et al.. Longitudinal clinical course of three Japanese patients with Leber congenital amaurosis/early-onset retinal dystrophy with RDH12 mutation. Doc Ophthalmol. 2014; 128: 219–228. [DOI] [PubMed] [Google Scholar]
- 27. Xin W, Xiao X, Li S, Zhang Q. Late-onset CORD in a patient with RDH12 mutations identified by whole exome sequencing. Ophthalmic Genet. 2016; 37: 345–348. [DOI] [PubMed] [Google Scholar]
- 28. Garg A, Lee W, Sengillo JD, Allikmets R, Garg K, Tsang SH.. Peripapillary sparing in RDH12-associated Leber congenital amaurosis. Ophthalmic Genet. 2017; 38: 575–579. [DOI] [PMC free article] [PubMed] [Google Scholar]
- 29. Fahim AT, Bouzia Z, Branham KH, et al.. Detailed clinical characterisation, unique features and natural history of autosomal recessive RDH12-associated retinal degeneration. Br J Ophthalmol. 2019; 103: 1789–1796. [DOI] [PMC free article] [PubMed] [Google Scholar]
- 30. Scott HA, Place EM, Ferenchak K, et al.. Expanding the phenotypic spectrum in RDH12-associated retinal disease. Cold Spring Harb Mol Case Stud. 2020; 6: a004754. [DOI] [PMC free article] [PubMed] [Google Scholar]
- 31. Ba-Abbad R, Arno G, Robson AG, et al.. Macula-predominant retinopathy associated with biallelic variants in RDH12. Ophthalmic Genet. 2020; 41: 612–615. [DOI] [PubMed] [Google Scholar]
- 32. De Zaeytijd J, Van Cauwenbergh C, De Bruyne M, et al.. Isolated maculopathy and moderate rod-cone dystrophy represent the milder end of the Rdh12-related retinal dystrophy spectrum. Retina. 2021; 41: 1346–1355. [DOI] [PubMed] [Google Scholar]
- 33. Wang J, Wang Y, Li S, et al.. Clinical and genetic analysis of RDH12-associated retinopathy in 27 Chinese families: a hypomorphic allele leads to cone-rod dystrophy. Invest Ophthalmol Vis Sci. 2022; 63: 24. [DOI] [PMC free article] [PubMed] [Google Scholar]
- 34. Daich Varela M, Moya R, Azevedo Souza Amaral R, et al.. Clinical and genetic characterization of RDH12-retinal dystrophy in a South American cohort. Ophthalmol Retina. 2024; 8: 163–173. [DOI] [PubMed] [Google Scholar]
- 35. Cideciyan AV, Swider M, Aleman TS, et al.. Reduced-illuminance autofluorescence imaging in ABCA4-associated retinal degenerations. J Opt Soc Am A. 2007; 24: 1457. [DOI] [PMC free article] [PubMed] [Google Scholar]
- 36. Aleman TS, Han G, Serrano LW, et al.. Natural history of the central structural abnormalities in choroideremia: a prospective cross-sectional study. Ophthalmology. 2017; 124: 359–373. [DOI] [PMC free article] [PubMed] [Google Scholar]
- 37. Cideciyan AV, Hufnagel RB, Carroll J, et al.. Human cone visual pigment deletions spare sufficient photoreceptors to warrant gene therapy. Hum Gene Ther. 2013; 24: 993–1006. [DOI] [PMC free article] [PubMed] [Google Scholar]
- 38. Cideciyan AV, Krishnan AK, Roman AJ, Sumaroka A, Swider M, Jacobson SG.. Measures of function and structure to determine phenotypic features, natural history, and treatment outcomes in inherited retinal diseases. Annu Rev Vis Sci. 2021; 7: 747–772. [DOI] [PubMed] [Google Scholar]
- 39. Lujan BJ, Roorda A, Knighton RW, Carroll J.. Revealing Henle's fiber layer using spectral domain optical coherence tomography. Invest Ophthalmol Vis Sci. 2011; 52: 1486–1492. [DOI] [PMC free article] [PubMed] [Google Scholar]
- 40. Drasdo N, Millican CL, Katholi CR, Curcio CA.. The length of Henle fibers in the human retina and a model of ganglion receptive field density in the visual field. Vision Res. 2007; 47: 2901–2911. [DOI] [PMC free article] [PubMed] [Google Scholar]
- 41. Dubra A, Sulai Y.. Reflective afocal broadband adaptive optics scanning ophthalmoscope. Biomed Opt Express. 2011; 2: 1757–1768. [DOI] [PMC free article] [PubMed] [Google Scholar]
- 42. Morgan JIW, Jiang YY, Vergilio GK, et al.. Short-term assessment of subfoveal injection of adeno-associated virus-mediated hCHM gene augmentation in choroideremia using adaptive optics ophthalmoscopy. JAMA Ophthalmol. 2022; 140: 411–420. [DOI] [PMC free article] [PubMed] [Google Scholar]
- 43. Dubra A, Harvey Z.. Registration of 2D images from fast scanning ophthalmic instruments. Lecture Notes in Comput Sci. 2010; 6204: 60–71. [Google Scholar]
- 44. Chen M, Cooper RF, Han GK, Gee J, Brainard DH, Morgan JI.. Multi-modal automatic montaging of adaptive optics retinal images. Biomed Opt Express. 2016; 7: 4899–4918. [DOI] [PMC free article] [PubMed] [Google Scholar]
- 45. Jacobson SG, Yagasaki K, Feuer WJ, Roman AJ.. Interocular asymmetry of visual function in heterozygotes of X-linked retinitis pigmentosa. Exp Eye Res. 1989; 48: 679–691. [DOI] [PubMed] [Google Scholar]
- 46. Jacobson SG, Voigt WJ, Parel JM, et al.. Automated light- and dark-adapted perimetry for evaluating retinitis pigmentosa. Ophthalmology. 1986; 93: 1604–1611. [DOI] [PubMed] [Google Scholar]
- 47. Roman AJ, Schwartz SB, Aleman TS, et al.. Quantifying rod photoreceptor-mediated vision in retinal degenerations: dark-adapted thresholds as outcome measures. Exp Eye Res. 2005; 80: 259–272. [DOI] [PubMed] [Google Scholar]
- 48. Roman AJ, Cideciyan AV, Aleman TS, Jacobson SG.. Full-field stimulus testing (FST) to quantify visual perception in severely blind candidates for treatment trials. Physiol Meas. 2007; 28: N51–N56. [DOI] [PubMed] [Google Scholar]
- 49. Roman AJ, Cideciyan AV, Wu V, Garafalo AV, Jacobson SG.. Full-field stimulus testing: role in the clinic and as an outcome measure in clinical trials of severe childhood retinal disease. Prog Retin Eye Res. 2022; 87: 101000. [DOI] [PubMed] [Google Scholar]
- 50. Jolly JK, Grigg JR, McKendrick AM, et al.. ISCEV and IPS guideline for the full-field stimulus test (FST). Doc Ophthalmol. 2024; 148: 3–14. [DOI] [PMC free article] [PubMed] [Google Scholar]
- 51. Birch DG, Cheng P, Duncan JL, et al.. The RUSH2A study: best-corrected visual acuity, full-field electroretinography amplitudes, and full-field stimulus thresholds at baseline. Transl Vis Sci Technol. 2020; 9: 9. [DOI] [PMC free article] [PubMed] [Google Scholar]
- 52. Watson AB, Pelli DG.. QUEST: a Bayesian adaptive psychometric method. Percept Psychophys. 1983; 33: 113–120. [DOI] [PubMed] [Google Scholar]
- 53. Luo X, Cideciyan AV, Iannaccone A, et al.. Blue cone monochromacy: visual function and efficacy outcome measures for clinical trials. PLoS One. 2015; 10: e0125700. [DOI] [PMC free article] [PubMed] [Google Scholar]
- 54. Zelinger L, Cideciyan AV, Kohl S, et al.. Genetics and disease expression in the CNGA3 form of achromatopsia: steps on the path to gene therapy. Ophthalmology. 2015; 122: 997–1007. [DOI] [PubMed] [Google Scholar]
- 55. Tikidji-Hamburyan A, Reinhard K, Storchi R, et al.. Rods progressively escape saturation to drive visual responses in daylight conditions. Nature Communications. 2017; 8: 1813. [DOI] [PMC free article] [PubMed] [Google Scholar]
- 56. Frederiksen R, Morshedian A, Tripathy SA, et al.. Rod photoreceptors avoid saturation in bright light by the movement of the G protein transducin. J Neurosci. 2021; 41: 3320–3330. [DOI] [PMC free article] [PubMed] [Google Scholar]
- 57. Ying GS, Maguire MG, Glynn RJ, Rosner B.. Tutorial on biostatistics: longitudinal analysis of correlated continuous eye data. Ophthalmic Epidemiol. 2021; 28: 3–20. [DOI] [PMC free article] [PubMed] [Google Scholar]
- 58. Richards S, Aziz N, Bale S, et al.. Standards and guidelines for the interpretation of sequence variants: a joint consensus recommendation of the American College of Medical Genetics and Genomics and the Association for Molecular Pathology. Genet Med. 2015; 17: 405–424. [DOI] [PMC free article] [PubMed] [Google Scholar]
- 59. Koenekoop RK, Loyer M, Dembinska O, Beneish R.. Visual improvement in Leber congenital amaurosis and the CRX genotype. Ophthalmic Genet. 2002; 23: 49–59. [DOI] [PubMed] [Google Scholar]
- 60. Chung DC, Bertelsen M, Lorenz B, et al.. The natural history of inherited retinal dystrophy due to biallelic mutations in the RPE65 gene. Am J Ophthalmol. 2019; 199: 58–70. [DOI] [PMC free article] [PubMed] [Google Scholar]
- 61. Anderson SJ, Mullen KT, Hess RF.. Human peripheral spatial resolution for achromatic and chromatic stimuli: limits imposed by optical and retinal factors. J Physiol. 1991; 442: 47–64. [DOI] [PMC free article] [PubMed] [Google Scholar]
- 62. Jacobson SG, Aleman TS, Cideciyan AV, et al.. Identifying photoreceptors in blind eyes caused by RPE65 mutations: prerequisite for human gene therapy success. Proc Natl Acad Sci USA. 2005; 102: 6177–6182. [DOI] [PMC free article] [PubMed] [Google Scholar]
- 63. Cideciyan AV, Jacobson SG, Roman AJ, et al.. Rod function deficit in retained photoreceptors of patients with class B Rhodopsin mutations. Sci Rep. 2020; 10: 12552. [DOI] [PMC free article] [PubMed] [Google Scholar]
- 64. Curcio CA, Sloan KR, Kalina RE, Hendrickson AE.. Human photoreceptor topography. J Comp Neurol. 1990; 292: 497–523. [DOI] [PubMed] [Google Scholar]
- 65. Cooper RF, Wilk MA, Tarima S, Carroll J.. Evaluating descriptive metrics of the human cone mosaic. Invest Ophthalmol Vis Sci. 2016; 57: 2992–3001. [DOI] [PMC free article] [PubMed] [Google Scholar]
- 66. Huang WC, Cideciyan AV, Roman AJ, et al.. Inner and outer retinal changes in retinal degenerations associated with ABCA4 mutations. Invest Ophthalmol Vis Sci. 2014; 55: 1810–1822. [DOI] [PMC free article] [PubMed] [Google Scholar]
- 67. Bearelly S, Chau FY, Koreishi A, Stinnett SS, Izatt JA, Toth CA.. Spectral domain optical coherence tomography imaging of geographic atrophy margins. Ophthalmology. 2009; 116: 1762–1769. [DOI] [PMC free article] [PubMed] [Google Scholar]
- 68. Pfau M, von der Emde L, Dysli C, et al.. Light sensitivity within areas of geographic atrophy secondary to age-related macular degeneration. Invest Ophthalmol Vis Sci. 2019; 60: 3992–4001. [DOI] [PubMed] [Google Scholar]
- 69. Stone EM, Andorf JL, Whitmore SS, et al.. Clinically focused molecular investigation of 1000 consecutive families with inherited retinal disease. Ophthalmology. 2017; 124: 1314–1331. [DOI] [PMC free article] [PubMed] [Google Scholar]
- 70. Hanany M, Rivolta C, Sharon D. Worldwide carrier frequency and genetic prevalence of autosomal recessive inherited retinal diseases. Proc Natl Acad Sci USA. 2020; 117: 2710–2716. [DOI] [PMC free article] [PubMed] [Google Scholar]
- 71. Pontikos N, Arno G, Jurkute N, et al.. Genetic basis of inherited retinal disease in a molecularly characterized cohort of more than 3000 families from the United Kingdom. Ophthalmology. 2020; 127: 1384–1394. [DOI] [PMC free article] [PubMed] [Google Scholar]
- 72. Kondkar AA, Abu-Amero KK. Leber congenital amaurosis: current genetic basis, scope for genetic testing and personalized medicine. Exp Eye Res. 2019; 189: 107834. [DOI] [PubMed] [Google Scholar]
- 73. Jacobson SG, Aleman TS, Cideciyan AV, et al.. Human cone photoreceptor dependence on RPE65 isomerase. Proc Natl Acad Sci USA. 2007; 104: 15123–15128. [DOI] [PMC free article] [PubMed] [Google Scholar]
- 74. Cideciyan AV, Aleman TS, Jacobson SG, et al.. Centrosomal-ciliary gene CEP290/NPHP6 mutations result in blindness with unexpected sparing of photoreceptors and visual brain: implications for therapy of Leber congenital amaurosis. Hum Mutat. 2007; 28: 1074–1083. [DOI] [PubMed] [Google Scholar]
- 75. Cideciyan AV, Rachel RA, Aleman TS, et al.. Cone photoreceptors are the main targets for gene therapy of NPHP5 (IQCB1) or NPHP6 (CEP290) blindness: generation of an all-cone Nphp6 hypomorph mouse that mimics the human retinal ciliopathy. Hum Mol Genet. 2011; 20: 1411–1423. [DOI] [PMC free article] [PubMed] [Google Scholar]
- 76. Jacobson SG, Aleman TS, Cideciyan AV, et al.. Leber congenital amaurosis caused by Lebercilin (LCA5) mutation: retained photoreceptors adjacent to retinal disorganization. Mol Vis. 2009; 15: 1098–1106. [PMC free article] [PubMed] [Google Scholar]
- 77. O'Connor K, O'Neil EC, Aleman TS. Relative preservation of the extramacular retina in LCA5-associated Leber congenital amaurosis. Am J Ophthalmol Case Rep. 2022; 25: 101260. [DOI] [PMC free article] [PubMed] [Google Scholar]
- 78. Uyhazi KE, Aravand P, Bell BA, et al.. Treatment potential for LCA5-associated Leber congenital amaurosis. Invest Ophthalmol Vis Sci. 2020; 61: 30. [DOI] [PMC free article] [PubMed] [Google Scholar]
- 79. Hendrickson AE, Yuodelis C.. The morphological development of the human fovea. Ophthalmology. 1984; 91: 603–612. [DOI] [PubMed] [Google Scholar]
- 80. Lee H, Proudlock FA, Gottlob I.. Pediatric optical coherence tomography in clinical practice - recent progress. Invest Ophthalmol Vis Sci. 2016; 57: OCT69–OCT79. [DOI] [PubMed] [Google Scholar]
- 81. Alabduljalil T, Westall CA, Reginald A, et al.. Demonstration of anatomical development of the human macula within the first 5 years of life using handheld OCT. Int Ophthalmol. 2019; 39: 1533–1542. [DOI] [PubMed] [Google Scholar]
- 82. Cideciyan AV, Swider M, Aleman TS, et al.. ABCA4-associated retinal degenerations spare structure and function of the human parapapillary retina. Invest Ophthalmol Vis Sci. 2005; 46: 4739–4746. [DOI] [PMC free article] [PubMed] [Google Scholar]
- 83. Cideciyan AV, Swider M, Aleman TS, et al.. Macular function in macular degenerations: repeatability of microperimetry as a potential outcome measure for ABCA4-associated retinopathy trials. Invest Ophthalmol Vis Sci. 2012; 53: 841–852. [DOI] [PMC free article] [PubMed] [Google Scholar]
- 84. Sergouniotis PI, Davidson AE, Mackay DS, et al.. Recessive mutations in KCNJ13, encoding an inwardly rectifying potassium channel subunit, cause Leber congenital amaurosis. Am J Hum Genet. 2011; 89: 183–190. [DOI] [PMC free article] [PubMed] [Google Scholar]
- 85. Bonafede L, Ficicioglu CH, Serrano L, et al.. Cobalamin C deficiency shows a rapidly progressing maculopathy with severe photoreceptor and ganglion cell loss. Invest Ophthalmol Vis Sci. 2015; 56: 7875–7887. [DOI] [PMC free article] [PubMed] [Google Scholar]
- 86. Duncker T, Tsang SH, Woods RL, et al.. Quantitative fundus autofluorescence and optical coherence tomography in PRPH2/RDS- and ABCA4-associated disease exhibiting phenotypic overlap. Invest Ophthalmol Vis Sci. 2015; 56: 3159–3170. [DOI] [PMC free article] [PubMed] [Google Scholar]
- 87. Birtel J, Gliem M, Herrmann P, MacLaren RE, Bolz HJ, Charbel Issa P. Peripapillary sparing in autosomal recessive bestrophinopathy. Ophthalmology Retina. 2020; 4: 523–529. [DOI] [PubMed] [Google Scholar]
- 88. Cideciyan AV, Jacobson SG, Sumaroka A, et al.. Photoreceptor function and structure in retinal degenerations caused by biallelic BEST1 mutations. Vision Res. 2023; 203: 108157. [DOI] [PMC free article] [PubMed] [Google Scholar]
- 89. Monson E, Cideciyan AV, Roman AJ, et al.. Inherited retinal degeneration caused by DHDDS mutation–effect of an ALG6 modifier variant. Intl J Mol Sci. 2024;25:1004. [DOI] [PMC free article] [PubMed] [Google Scholar]
- 90. Cideciyan AV, Aleman TS, Boye SL, et al.. Human gene therapy for RPE65 isomerase deficiency activates the retinoid cycle of vision but with slow rod kinetics. Proc Natl Acad Sci USA. 2008; 105: 15112–15117. [DOI] [PMC free article] [PubMed] [Google Scholar]
- 91. Yang P, Pardon LP, Ho AC, et al.. Safety and efficacy of ATSN-101 in patients with Leber congenital amaurosis caused by biallelic mutations in GUCY2D: a phase 1/2, multicentre, open-label, unilateral dose escalation study. Lancet. 2024; 404: 962–970. [DOI] [PubMed] [Google Scholar]
- 92. Milam AH, Li ZY, Fariss RN.. Histopathology of the human retina in retinitis pigmentosa. Prog Retin Eye Res. 1998; 17: 175–205. [DOI] [PubMed] [Google Scholar]
- 93. Jacobson SG, Cideciyan AV.. Treatment possibilities for retinitis pigmentosa. N Engl J Med. 2010; 363: 1669–1671. [DOI] [PubMed] [Google Scholar]
- 94. Stone JL, Barlow WE, Humayun MS, de Juan E Jr., Milam AH. Morphometric analysis of macular photoreceptors and ganglion cells in retinas with retinitis pigmentosa. Arch Ophthalmol. 1992; 110: 1634–1639. [DOI] [PubMed] [Google Scholar]
- 95. Rattner A, Nathans J.. The genomic response to retinal disease and injury: evidence for endothelin signaling from photoreceptors to glia. J Neurosci. 2005; 25: 4540–4549. [DOI] [PMC free article] [PubMed] [Google Scholar]
- 96. Haeseleer F, Jang GF, Imanishi Y, et al.. Dual-substrate specificity short chain retinol dehydrogenases from the vertebrate retina. J Biol Chem. 2002; 277: 45537–45546. [DOI] [PMC free article] [PubMed] [Google Scholar]
- 97. Thompson DA, Janecke AR, Lange J, et al.. Retinal degeneration associated with RDH12 mutations results from decreased 11-cis retinal synthesis due to disruption of the visual cycle. Hum Mol Genet. 2005; 14: 3865–3875. [DOI] [PubMed] [Google Scholar]
- 98. Kar D, Singireddy R, Kim YJ, et al.. Unusual morphology of foveal Muller glia in an adult human born pre-term. Front Cell Neurosci. 2024; 18: 1409405. [DOI] [PMC free article] [PubMed] [Google Scholar]
- 99. Aguirre GK, Komáromy AM, Cideciyan AV, et al.. Canine and human visual cortex intact and responsive despite early retinal blindness from RPE65 mutation. PLoS Med. 2007; 4: 1117–1128. [DOI] [PMC free article] [PubMed] [Google Scholar]
- 100. Hauswirth WW, Aleman TS, Kaushal S, et al.. Treatment of Leber congenital amaurosis due to RPE65 mutations by ocular subretinal injection of adeno-associated virus gene vector: short-term results of a phase I trial. Hum Gene Ther. 2008; 19: 979–990. [DOI] [PMC free article] [PubMed] [Google Scholar]
- 101. Banin E, Bandah-Rozenfeld D, Obolensky A, et al.. Molecular anthropology meets genetic medicine to treat blindness in the North African Jewish population: human gene therapy initiated in Israel. Hum Gene Ther. 2010; 21: 1749–1757. [DOI] [PubMed] [Google Scholar]
- 102. Jacobson SG, Cideciyan AV, Aleman TS, et al.. Human retinal disease from AIPL1 gene mutations: foveal cone loss with minimal macular photoreceptors and rod function remaining. Invest Ophthalmol Vis Sci. 2011; 52: 70–79. [DOI] [PubMed] [Google Scholar]
- 103. Jacobson SG, Cideciyan AV, Ratnakaram R, et al.. Gene therapy for Leber congenital amaurosis caused by RPE65 mutations: Safety and efficacy in 15 children and adults followed up to 3 years. Arch Ophthalmol. 2012; 130: 9–24. [DOI] [PMC free article] [PubMed] [Google Scholar]
- 104. Jacobson SG, Cideciyan AV, Peshenko IV, et al.. Determining consequences of retinal membrane guanylyl cyclase (RetGC1) deficiency in human leber congenital amaurosis en route to therapy: Residual cone-photoreceptor vision correlates with biochemical properties of the mutants. Hum Mol Genet. 2013; 22: 168–183. [DOI] [PMC free article] [PubMed] [Google Scholar]
- 105. Cideciyan AV, Jacobson SG, Drack AV, et al.. Effect of an intravitreal antisense oligonucleotide on vision in Leber congenital amaurosis due to a photoreceptor cilium defect. Nat Med. 2019; 25: 225–228. [DOI] [PubMed] [Google Scholar]
Associated Data
This section collects any data citations, data availability statements, or supplementary materials included in this article.