Abstract
Acute myocardial infarction (AMI) and sepsis are the leading causes of high mortality rates in intensive care units. While sepsis frequently affects the cardiovascular system, distinguishing between sepsis-induced cardiomyopathy and AMI remains challenging due to overlapping biomarkers. Misdiagnosis can hinder timely treatment and increase risk of complications. This study used multidimensional clinical data and machine learning techniques to develop and validate a novel predictive model for identifying AMI in critically ill patients with sepsis. Data from patients with sepsis were extracted from the Medical Information Mart for Intensive Care-IV database. Six machine learning algorithms were employed for model construction. Additionally, the machine learning-based models were compared with traditional scoring systems. Model performance was evaluated in terms of discrimination, calibration, and clinical applicability. In total, 2,103 critically ill patients with sepsis were included, 459 (21.8%) of whom experienced AMI during hospitalization. A total of 26 variables were selected for model construction. Among all models, the Gradient Boosting Classifier model demonstrated the best predictive performance in terms of discrimination, calibration, and clinical applicability. Machine learning models have the potential to serve as tools for predicting AMI in patients with sepsis. The Gradient Boosting Classifier model developed herein demonstrated promising predictive performance, supporting clinicians in identifying patients at high-risk of sepsis and implementing early interventions to reduce mortality rates.
Keywords: Acute myocardial infarction, Sepsis, Machine learning, Prediction model, MIMIC-IV database
Subject terms: Diseases, Medical research, Risk factors
Introduction
Sepsis is a systemic inflammatory response syndrome triggered by infection, often leading to multi-organ dysfunction and with high mortality rates1. Despite advances in medical technology, the treatment outcomes for sepsis remain suboptimal, primarily due to its complex pathophysiology and uncertain clinical manifestations2. The cardiovascular system is frequently affected during sepsis, resulting in complications such as myocardial depression and circulatory failure, which further increase patient mortality3. Sepsis-induced cardiomyopathy is a common form of cardiac injury associated with sepsis; however, its pathophysiological mechanisms are not fully understood and may be related to inflammatory mediators, oxidative stress, and microvascular dysfunction4.
Abnormalities in myocardial biomarkers are commonly observed in patients with sepsis, but these biochemical changes are not specific to sepsis. In some cases, they may result from sepsis-induced myocardial injury5; however, they may also indicate that the patient has concurrent acute myocardial infarction (AMI)6. Distinguishing between sepsis-induced cardiomyopathy and AMI is crucial for clinical decision-making in patients with sepsis due to the significant overlap in their clinical presentations and biomarker profiles. Misdiagnosis can lead to inappropriate treatment and potentially worsen the patient’s condition. For instance, AMI typically requires anticoagulation, antiplatelet therapy, and sometimes early percutaneous coronary intervention; however, these treatments may increase the risk of bleeding in patients with sepsis. Therefore, accurately and quickly identifying AMI in patients with sepsis is of significant clinical importance.
In recent years, the rapid development of big data and machine learning (ML) technologies has led to increasing research on predictive and diagnostic models using multimodal data, including patient history, clinical examination results, and biomarker levels. The application of ML methods in medical diagnosis and prognosis offers a promising approach for the early identification of AMI in patients with sepsis. By analyzing large-scale clinical data, ML algorithms can uncover potential characteristic patterns, thereby enhancing diagnostic accuracy and providing clinicians with more precise decision-making support7–9.
Current research on abnormal myocardial biomarkers in sepsis primarily focuses on myocardial dysfunction caused by sepsis, with limited studies on concurrent AMI. This study aimed to develop a machine learning-based model to predict the likelihood of concurrent AMI in patients with sepsis. By integrating multidimensional data—including demographic information, laboratory test results, and myocardial biomarker levels—we developed an efficient algorithm that can assist clinicians in quickly identifying patients with sepsis at high risk for concurrent AMI, provide them with personalized treatment plans, and reduce the risk of misdiagnosis and delayed treatment. The findings of this study are anticipated to offer new insights and approaches for managing sepsis and lay the groundwork for the future implementation of artificial intelligence and ML in critical care medicine.
Methods
Data design and data sources
This was a retrospective cohort study. Using the structured query language, data from patients with sepsis were extracted from a single-center publicly available database called the Medical Information Mart for Intensive Care IV (MIMIC-IV) database10. The MIMIC-IV database contains clinical data from more than 190,000 patients admitted to the Beth Israel Deaconess Medical Center (Boston, MA, USA) from 2008 to 2019 and data from 450,000 hospitalizations11. The requirement for ethical approval was waived by the Institutional Review Board of Dalian Medical University Affiliated Second Hospital because the data were obtained from the MIMIC-IV database (a publicly available database). The Institutional Review Board of Dalian Medical University Affiliated Second Hospital waived the need for written informed consent due to the retrospective nature of the study. All methods were performed in accordance with the appropriate guidelines and regulations.
Participants
When patients were diagnosed with sepsis according to the International Classification of Disease 9th revision (ICD-9; 99591, 99592) and ICD-10 (A021, A227, A267, A327, A40, A400, A401, A403, A408, A409, A410, A4101, A4102, A411, A412, A413, A415, A4150, A4151, A4152, A4153, A4159, A418, A4181, A4189, A419, A427, A5486, B377, R652, R6520, R6521, T8144, 8144XA, T8144XD, and T8144XS) after the first ICU admission, patient eligibility was considered. When patients were diagnosed with AMI using the ICD-9 (41000, 41001, 41002, 41010, 41011, 41012, 41020, 41021, 41022, 41030, 41032, 41040, 41041, 41042, 41050, 41051, 41052, 41080, 41081, 41082, 41090, 41091, 41092) and ICD-10 (I21, I210, I2101, I2102, I2109, I211, I2111, I2119, I212, I2121, I2129, I213, I214, I219, I21A, I21A1, I21A9, I22, I220, I221, I222, I228, I229) after the first ICU admission, patient eligibility was considered. The inclusion criteria were (1) age ≥ 18 years and (2) meeting the diagnostic criteria for sepsis-312—infection and Sequential Organ Failure Assessment (SOFA) score ≥ 2. The exclusion criteria were patients who (1) had a length of ICU or hospital stay less than 24 h; (2) had malignant tumors, metastatic solid tumors, or acquired immunodeficiency syndrome; or (3) had pregnancy-related or neonatal sepsis.
Data extraction
Patient data from the initial 24 h following admission were retrieved from the MIMIC-IV database. The following information was used in this study: (1) demographic features, including sex, age, and ethnicity; (2) comorbidities, including congestive heart failure, cerebrovascular disease, chronic pulmonary disease, rheumatic disease, renal disease, hypertension, diabetes and liver disease; (3) vital signs, including heart rate, respiratory rate, temperature, oxygen saturation, systolic blood pressure, and urine output; (4) scoring systems: SOFA, Acute Physiology Score III (APS III), the Logistic Organ Dysfunction System, Glasgow Coma Scale, Charlson Comorbidity Index (CCI), Oxford Acute Severity of Illness Score; (5) laboratory parameters, including counts of white blood cells, red blood cells, platelets, neutrophils, lymphocytes, and monocytes; levels of hemoglobin, hematocrit, corpuscular hemoglobin, ferritin, total calcium, chloride, sodium, potassium, bicarbonate, creatinine, glucose, blood urea nitrogen, alkaline phosphatase, glutamic oxaloacetic transaminase, glutamic pyruvic transaminase, total bilirubin, lactate, creatinine kinase, lactate dehydrogenase (LD/LDH), and troponin T (cTnT); and the red blood cell distribution width, mean corpuscular hemoglobin concentration, corpuscular volume, anion gap, international normalized ratio (INR), prothrombin time (PT), partial thromboplastin time (PTT), pH-value, arterial partial pressure of oxygen (PO2), arterial partial pressure of carbon dioxide, and base excess; (6) therapeutic and clinical management, including norepinephrine, dobutamine, dopamine and mechanical ventilation use. All the laboratory test and vital sign data were extracted from the data generated within the first 24 h after admission to the ICU, and their averages were taken. For the scoring systems, only initial test values were analyzed. Since this was an epidemiological study based on hypotheses, no attempt was made to estimate sample size. Instead, all eligible patients in the MIMIC-IV database were enrolled to achieve maximized statistical power.
To minimize biases caused by missing data, variables with more than 20% of their values missing were excluded from the final cohort. Simultaneously, the multiple imputation (MI) method was used to impute missing values for other variables. MI is an excellent and widely used method for handling missing values in medical research13. MI can be used to estimate each missing value using several plausible values. This process considers the uncertainty behind the missing values and generates multiple datasets from which the parameters of interest can be estimated14. Considering the uncertainty in estimating missing values, combining these coefficients provides an effective estimate of the coefficients. The variance of the coefficients estimated using MI is more likely to be underestimated than when estimated using single imputation15.
Statistical analysis
Continuous variables are expressed as medians with interquartile ranges due to the non-normal distribution of the data. Differences between groups were compared using the Wilcoxon rank-sum test. Categorical variables are presented as frequencies and percentages. Given the large sample size, the Chi-squared test was used to compare group differences.
Feature selection is a critical step in model development. In this study, the Boruta algorithm was applied to identify significant features. The Boruta algorithm compares the Z-scores of the original features with the maximum Z-score of the shadow features to determine which features are significantly more important than the shadow features16. For each iteration, a random seed of 77 was set, and a maximum of 800 iterations were performed. The Boruta algorithm generates shadow features by randomly shuffling the original data, which reduces the risk of overfitting and enhances the stability of feature selection. Compared to single Random Forest (RF) feature selection methods, the Boruta algorithm is more robust, reducing misleading results caused by random fluctuations and feature correlations17.
After feature selection, six ML algorithms were used to build predictive models: logistic regression (LR), k-nearest neighbors (KNN), support vector classifier (SVC), decision tree (DT), RF, and Gradient Boosting Classifier (GBC). Hyperparameter tuning was performed using 10-fold cross-validation and GridSearchCV. Cross-validation divided the data into 10 folds, using each fold as a validation set, while the remaining 9 folds were used for training. This ensured robust model evaluation, checking its generalizability across different subsets of the data. Grid search was employed to optimize hyperparameters (e.g., regularization parameters, learning rates, tree depths) for each algorithm, identifying the best combination. The model with the highest area under the receiver operating characteristic curve (AUC) was selected as the optimal model for each algorithm. We also compared the performance of the optimal ML models with traditional scoring systems, including SOFA, APS III, Logistic Organ Dysfunction System, CCI, and Oxford Acute Severity of Illness Scores, which are commonly used to predict disease severity and prognosis in patients with critical illness.
The performance of the models was evaluated in terms of discrimination, calibration, and clinical applicability. Discriminatory ability was quantified using multiple metrics, including the AUC, F1 score, recall, precision, accuracy, the Highest-J-Value of Youden’s index18,19, and the best threshold. To enhance the robustness of the performance evaluation, bootstrapping was applied to estimate the precision error. The dataset was randomly split into 10 folds, with training and validation performed on each fold. This process was repeated 10 times to ensure that model evaluation was not dependent on any single training or validation set. The model with the best performance was then subjected to bootstrapping to estimate error in test accuracy. Confidence intervals for bootstrapping results were derived from 1000 resamples, providing 95% confidence intervals (2.5% and 97.5% percentiles) for the AUC, F1 score, recall, and other metrics. This approach helps assess the stability of model performance. Decision curve analysis was used to evaluate the clinical applicability of the model20. SHapley Additive exPlanations (SHAP) technique for model interpretability in machine learning revealed the top 10 features had the greatest impact on the GBC model’s predictions21. All statistical analyses were performed using R version 4.2.3, with statistical significance set at P < 0.05. Model training and evaluation were conducted using the Python scikit-learn package.
Results
Baseline characteristics
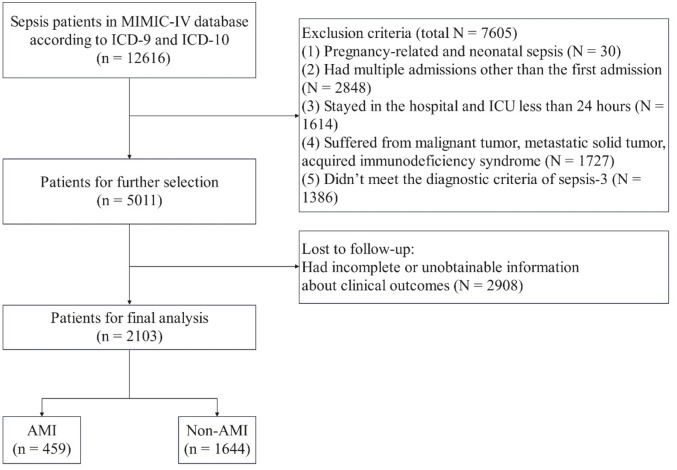
In total, 12,616 patients were diagnosed with sepsis at admission. Additionally, 10,513 patients were excluded based on the exclusion criteria (Fig. 1). Ultimately, 2,103 patients were included in our analysis, 459 of whom had AMI.
Fig. 1.
Flowchart of patient selection. MIMIC-IV medical information mort for intensive care, ICU intensive care unit.
Table 1 shows the baseline differences between patients with and without AMI. Patients with sepsis complicated by AMI were more likely to be of Caucasian descent and had higher rates of congestive heart failure, diabetes, and cerebrovascular and renal diseases, as well as more frequent use of norepinephrine and dobutamine (P < 0.05). Patients with AMI showed significantly higher values for several biomarkers, including creatinine kinase, LD/LDH, cTnT, neutrophil and monocyte counts, calcium, potassium, anion gap, glucose, glutamic pyruvic transaminase, glutamic oxaloacetic transaminase, and PTT (P < 0.05). Patients with sepsis complicated by AMI exhibited higher Glasgow Coma Scale and CCI scores but lower APS III scores (P < 0.05). Other key differences included lower heart rate, red blood cell distribution width, hemoglobin, mean corpuscular hemoglobin concentration, chloride, bicarbonate, total bilirubin, INR, PT, and PO2 levels in patients with AMI than in those without AMI (P < 0.05).
Table 1.
Baseline characteristics of patients with sepsis, with and without AMI.
| Characteristics | Sepsis (n = 2103) | Non-AMI (n = 1644) | AMI (n = 459) | P value |
|---|---|---|---|---|
| Sex n (%) | 0.915 | |||
| Female | 898 (42.70%) | 701 (42.64%) | 197 (42.92%) | |
| Male | 1205 (57.30%) | 943 (57.36%) | 262 (57.08%) | |
| Age (years) | 72.00 (61.00, 83.00) | 72.00 (61.00, 83.00) | 72.00 (63.50, 83.00) | 0.121 |
| Race, n (%) | 0.009 | |||
| Black | 220 (10.46%) | 175 (10.64%) | 45 (9.80%) | |
| White | 1335 (63.48%) | 1053 (64.05%) | 282 (61.44%) | |
| Unknown | 348 (16.55%) | 250 (15.21%) | 98 (21.35%) | |
| Other | 200 (9.51%) | 166 (10.10%) | 34 (7.41%) | |
| Hospital expire flag, n (%) | 0.571 | |||
| Death | 1485 (70.61%) | 1156 (70.32%) | 329 (71.68%) | |
| Live | 618 (29.39%) | 488 (29.68%) | 130 (28.32%) | |
| Mechanical ventilation, n (%) | 0.223 | |||
| No | 887 (42.18%) | 682 (41.48%) | 205 (44.66%) | |
| Yes | 1216 (57.82%) | 962 (58.52%) | 254 (55.34%) | |
| Congestive heart failure, n (%) | < 0.001 | |||
| No | 1061 (50.45%) | 882 (53.65%) | 179 (39.00%) | |
| Yes | 1042 (49.55%) | 762 (46.35%) | 280 (61.00%) | |
| Cerebrovascular disease, n (%) | 0.049 | |||
| No | 1784 (84.83%) | 1408 (85.64%) | 376 (81.92%) | |
| Yes | 319 (15.17%) | 236 (14.36%) | 83 (18.08%) | |
| Chronic pulmonary disease, n (%) | 0.037 | |||
| No | 1456 (69.23%) | 1120 (68.13%) | 336 (73.20%) | |
| Yes | 647 (30.77%) | 524 (31.87%) | 123 (26.80%) | |
| Rheumatic disease, n (%) | 0.771 | |||
| No | 2003 (95.24%) | 1567 (95.32%) | 436 (94.99%) | |
| Yes | 100 (4.76%) | 77 (4.68%) | 23 (5.01%) | |
| Liver disease, n (%) | < 0.001 | |||
| No | 1651 (78.51%) | 1263 (76.82%) | 388 (84.53%) | |
| Yes | 452 (21.49%) | 381 (23.18%) | 71 (15.47%) | |
| Diabetes, n (%) | 0.019 | |||
| No | 1250 (59.44%) | 999 (60.77%) | 251 (54.68%) | |
| Yes | 853 (40.56%) | 645 (39.23%) | 208 (45.32%) | |
| Renal disease, n (%) | 0.001 | |||
| No | 1351 (64.24%) | 1085 (66.00%) | 266 (57.95%) | |
| Yes | 752 (35.76%) | 559 (34.00%) | 193 (42.05%) | |
| Hypertension, n (%) | 0.357 | |||
| No | 1078 (51.26%) | 834 (50.73%) | 244 (53.16%) | |
| Yes | 1025 (48.74%) | 810 (49.27%) | 215 (46.84%) | |
| Norepinephrine, n (%) | 0.027 | |||
| No | 662 (31.48) | 537 (32.66) | 125 (27.23) | |
| Yes | 1441 (68.52) | 1107 (67.34) | 334 (72.77) | |
| Dobutamine, n (%) | < 0.001 | |||
| No | 1948 (92.63%) | 1542 (93.80%) | 406 (88.45%) | |
| Yes | 155 (7.37%) | 102 (6.20%) | 53 (11.55%) | |
| Dopamine, n (%) | 0.964 | |||
| No | 1898 (90.25%) | 1484 (90.27%) | 414 (90.20%) | |
| Yes | 205 (9.75%) | 160 (9.73%) | 45 (9.80%) | |
| SOFA, M (Q1, Q3) | 4.00 (3.00, 6.00) | 4.00 (3.00, 6.00) | 4.00 (3.00, 5.00) | 0.173 |
| APS III, M (Q1, Q3) | 62.00 (48.00, 78.00) | 63.00 (49.00, 78.00) | 59.00 (46.00, 75.00) | 0.002 |
| LODS, M (Q1, Q3) | 7.00 (5.00, 9.00) | 7.00 (5.00, 9.00) | 7.00 (5.00, 9.00) | 0.291 |
| OASIS, M (Q1, Q3) | 38.00 (32.00, 44.00) | 38.00 (32.00, 44.00) | 38.00 (32.00, 44.00) | 0.235 |
| GCS, M (Q1, Q3) | 15.00 (13.00, 15.00) | 15.00 (13.00, 15.00) | 15.00 (13.50, 15.00) | 0.047 |
| CCI, M (Q1, Q3) | 6.00 (4.00, 8.00) | 6.00 (4.00, 7.00) | 7.00 (5.00, 8.00) | < 0.001 |
| Urine output (ml) | 1082.00 (550.00, 1915.00) | 1079.00 (540.00, 1892.00) | 1082.00 (587.50, 1985.00) | 0.459 |
| Heart rate_mean (beats/min) | 89.31 (77.28, 101.33) | 90.00 (77.54, 102.24) | 86.65 (76.09, 98.70) | 0.016 |
| SBP_mean (mmHg) | 109.48 (102.33, 118.78) | 109.37 (102.37, 118.84) | 109.68 (102.01, 118.50) | 0.812 |
| Respiratory rate_mean (breaths/min) | 20.83 (18.05, 24.05) | 20.83 (18.11, 24.04) | 20.77 (17.81, 24.09) | 0.759 |
| Temperature_mean (℃) | 36.90 (36.60, 37.30) | 36.90 (36.50, 37.30) | 36.90 (36.60, 37.20) | 0.408 |
| SpO2_mean (%) | 97.04 (95.58, 98.40) | 97.04 (95.58, 98.42) | 97.03 (95.56, 98.29) | 0.774 |
| WBC_mean (K/uL) | 12.11 (9.22, 15.89) | 11.97 (9.18, 15.77) | 12.38 (9.46, 16.59) | 0.128 |
| RBC_mean (m/uL) | 3.14 (2.85, 3.57) | 3.16 (2.87, 3.57) | 3.10 (2.81, 3.54) | 0.050 |
| RDW_mean (%) | 15.84 (14.66, 17.52) | 15.91 (14.72, 17.60) | 15.65 (14.38, 17.29) | 0.018 |
| Hemoglobin_mean (g/dL) | 9.35 (8.52, 10.49) | 9.41 (8.58, 10.52) | 9.17 (8.33, 10.41) | 0.004 |
| Hematocrit_mean (%) | 28.72 (26.42, 32.30) | 28.77 (26.50, 32.38) | 28.43 (26.10, 32.17) | 0.145 |
| MCH_mean (pg) | 30.08 (28.62, 31.33) | 30.15 (28.65, 31.37) | 29.87 (28.55, 31.19) | 0.174 |
| MCHC_mean (%) | 32.49 (31.55, 33.38) | 32.57 (31.58, 33.45) | 32.25 (31.41, 33.12) | < 0.001 |
| MCV_mean (fl.) | 92.00 (88.26, 96.50) | 91.90 (88.16, 96.59) | 92.51 (88.69, 96.27) | 0.428 |
| Platelet_mean (K/uL) | 199.33 (132.00, 273.79) | 199.25 (130.53, 278.31) | 201.11 (137.79, 256.92) | 0.392 |
| FER_mean (mmol/L) | 1.89 (1.35, 2.73) | 1.86 (1.33, 2.70) | 1.95 (1.40, 2.77) | 0.068 |
| Neutrophils_mean (%) | 81.50 (74.80, 86.40) | 81.20 (74.41, 86.30) | 82.08 (76.16, 86.82) | 0.034 |
| Lymphocytes_mean (%) | 8.27 (5.25, 12.69) | 8.36 (5.30, 12.90) | 7.95 (5.07, 12.01) | 0.156 |
| Monocytes_mean (%) | 5.05 (3.57, 7.20) | 5.00 (3.35, 7.00) | 5.97 (4.00, 8.00) | < 0.001 |
| Toall calcium_mean (mg/dl) | 8.21 (7.86, 8.62) | 8.19 (7.85, 8.61) | 8.28 (7.92, 8.64) | 0.030 |
| Chloride_mean (mEq/l) | 103.84 (99.92, 107.57) | 104.12 (100.25, 107.87) | 102.82 (99.03, 105.93) | < 0.001 |
| Sodium_mean (mEq/l) | 139.36 (136.84, 142.02) | 139.39 (136.90, 142.00) | 139.30 (136.69, 142.19) | 0.895 |
| Potassium_mean (mEq/l) | 4.09 (3.88, 4.35) | 4.08 (3.86, 4.33) | 4.14 (3.93, 4.40) | < 0.001 |
| Bicarbonate_mean (mEq/L) | 23.50 (20.92, 26.10) | 23.57 (21.00, 26.23) | 23.05 (20.56, 25.53) | 0.020 |
| Anion gap_mean (mEq/L) | 14.64 (12.78, 17.13) | 14.50 (12.62, 17.00) | 15.19 (13.25, 17.69) | < 0.001 |
| Creatinine_mean (mg/dl) | 1.52 (1.01, 2.48) | 1.51 (0.99, 2.48) | 1.55 (1.03, 2.48) | 0.408 |
| Glucose_mean (mg/dl) | 132.57 (114.03, 165.12) | 131.62 (113.36, 160.69) | 139.00 (115.58, 182.75) | < 0.001 |
| BUN_mean (mg/dl) | 34.08 (22.28, 50.77) | 33.65 (22.00, 50.68) | 35.26 (23.21, 51.88) | 0.193 |
| ALP_mean (IU/L) | 100.80 (73.00, 150.25) | 101.80 (73.00, 153.54) | 99.50 (74.25, 140.23) | 0.330 |
| ALT_mean (IU/L) | 38.00 (19.50, 97.80) | 36.67 (19.00, 91.50) | 42.00 (23.06, 124.60) | 0.004 |
| AST_mean (IU/L) | 53.50 (29.90, 129.67) | 52.00 (29.00, 124.09) | 60.00 (33.00, 147.83) | 0.011 |
| Total bilirubin_mean (mg/dl) | 0.72 (0.40, 1.67) | 0.75 (0.40, 1.80) | 0.65 (0.40, 1.28) | 0.007 |
| INR_mean | 1.40 (1.23, 1.79) | 1.41 (1.23, 1.80) | 1.38 (1.20, 1.72) | 0.033 |
| PT_mean (s) | 15.47 (13.66, 19.29) | 15.57 (13.75, 19.39) | 15.08 (13.23, 18.73) | 0.004 |
| PTT_mean (s) | 39.66 (31.44, 54.94) | 38.82 (31.36, 52.88) | 43.14 (31.98, 60.38) | < 0.001 |
| PH_mean | 7.37 (7.33, 7.41) | 7.37 (7.33, 7.41) | 7.37 (7.32, 7.41) | 0.436 |
| PO2_mean (mmHg) | 96.00 (72.03, 120.96) | 98.38 (76.33, 122.60) | 86.11 (59.33, 112.41) | < 0.001 |
| PCO2_mean (mmHg) | 39.71 (35.31, 45.00) | 39.67 (35.30, 45.00) | 39.88 (35.38, 44.53) | 0.861 |
| Lactate_mean (mmol/l) | 2.05 (1.43, 2.69) | 2.05 (1.41, 2.65) | 2.08 (1.50, 2.72) | 0.167 |
| Base excess_mean (mEq/L) | -1.56 (-4.50, 0.53) | -1.51 (-4.50, 0.70) | -1.73 (-4.35, 0.33) | 0.363 |
| CK/CPK_mean (IU/L) | 181.75 (62.83, 564.20) | 159.40 (57.46, 512.00) | 270.25 (82.25, 747.33) | < 0.001 |
| LD/LDH_mean (IU/L) | 318.67 (243.12, 473.35) | 309.25 (234.23, 447.00) | 365.33 (271.30, 547.03) | < 0.001 |
| cTnT_mean (ng/mL) | 0.10 (0.04, 0.33) | 0.07 (0.03, 0.22) | 0.29 (0.09, 1.19) | < 0.001 |
Z: Mann–Whitney test, χ²: chi-square test; M: median, Q₁: 1st quartile, Q₃: 3rd quartile. AMI acute myocardial infarction, SOFA Sequential Organ Failure Assessment, APS III Acute Physiology Score III, LODS Logistic Organ Dysfunction System, OASIS Oxford Acute Severity of Illness Scale, GCS Glasgow Coma Scale, CCI Charlson Comorbidity Index, SBP systolic blood pressure, SpO2 oxygen saturation, WBC white blood cell, RBC red blood cell, RDW red blood cell distribution width, MHC corpuscular hemoglobin, MCHC corpuscular hemoglobin concentration, MCV corpuscular volume, FER ferritin, BUN blood urea nitrogen, ALP alkaline phosphatase, ALT glutamic pyruvic transaminase, AST glutamic oxaloacetic transaminase, INR international normalized ratio, PT prothrombin time, PTT partial thromboplastin time, PH pH-value, PO2 arterial partial pressure of oxygen, PCO2 arterial partial pressure of carbon dioxide, CK/CPK creatine kinase, lactate base excess, LD/LDH lactate dehydrogenase, cTnT troponin T.
Feature selection
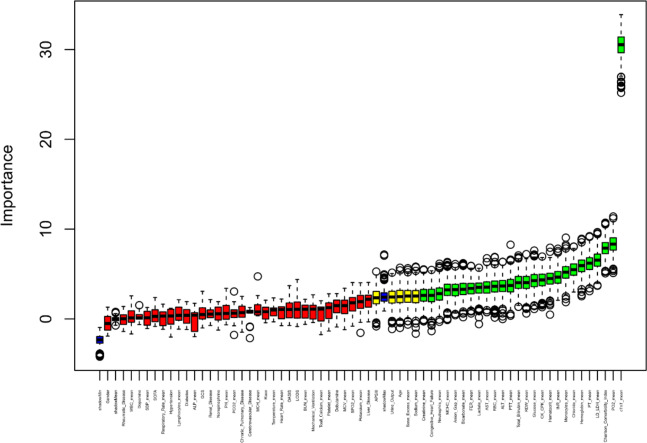
Using the Boruta algorithm, 26 variables most associated with AMI were identified (Fig. 2). Notable features included cTnT, PO2, CCI, LD/LDH, PT, hemoglobin, chloride, monocyte count, INR, and hematocrit.
Fig. 2.
Feature selection based on the Boruta algorithm. The horizontal axis represents all variables, and the vertical axis represents the Z value of each variable. The box plot shows the Z values of each variable during model calculation. The green boxes represent the first 26 important variables, the yellow boxes represent tentative attributes, and the red boxes represent unimportant variables.
Overall discriminative power of all models
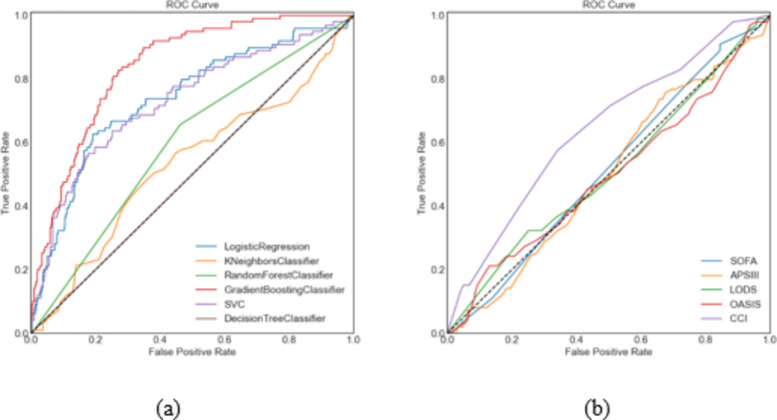
Receiver operating characteristic curves illustrated the performance of 11 models for predicting AMI in patients with sepsis (Fig. 3). The GBC model achieved the highest predictive accuracy (AUC = 0.838), outperforming logistic regression (AUC = 0.737), support vector classifier (AUC = 0.729), and other models. Performance metrics for the eleven ML models are shown in Table 2. The GBC model achieved the highest accuracy (0.77), recall (0.79), F1 score (0.76), Highest-J-Value (0.53) and best threshold (0.21), while the decision tree model performed the worst.
Fig. 3.
Receiver operating characteristic curves of the eleven models. Figure (a) Includes 6 machine models; Figure (b) includes five traditional scoring systems. LR logistic regression, KNN k-nearest neighbors, RF random forest, GBC gradient boosting classifier, SVC support vector, DT decision tree, APS III acute physiology score III, LODS logistic organ dysfunction system, CCI Charlson comorbidity index, SOFA sequential organ failure assessment, OASIS Oxford acute severity of illness scale, AUC area under the curve.
Table 2.
Model performance metrics.
| Models | AUC | F1 score | Recall | Precision | Accuracy | Highest J value | Best threshold |
|---|---|---|---|---|---|---|---|
| LR | 0.737 | 0.70 | 0.77 | 0.72 | 0.72 | 0.37 | 0.23 |
| KNN | 0.530 | 0.66 | 0.76 | 0.63 | 0.70 | 0.12 | 0.35 |
| RF | 0.596 | 0.66 | 0.76 | 0.58 | 0.55 | 0.19 | 0.34 |
| GBC | 0.838 | 0.76 | 0.79 | 0.77 | 0.77 | 0.53 | 0.21 |
| SVC | 0.729 | 0.71 | 0.77 | 0.73 | 0.72 | 0.41 | 0.20 |
| DT | 0.500 | 0.66 | 0.76 | 0.58 | 0.22 | 0.00 | 0.00 |
| SOFA | 0.514 | 0.14 | 0.25 | 0.63 | 0.33 | 0.06 | 0.20 |
| APS III | 0.500 | 0.18 | 0.27 | 0.62 | 0.47 | 0.08 | 0.18 |
| LODS | 0.510 | 0.15 | 0.26 | 0.66 | 0.32 | 0.07 | 0.27 |
| OASIS | 0.496 | 0.14 | 0.26 | 0.67 | 0.45 | 0.08 | 0.27 |
| CCI | 0.642 | 0.24 | 0.27 | 0.71 | 0.55 | 0.23 | 0.24 |
LR logistic regression, KNN k-nearest neighbors, RF random forest, GBC gradient boosting classifier, SVC support vector, DT decision tree.
Recall and decision boundary
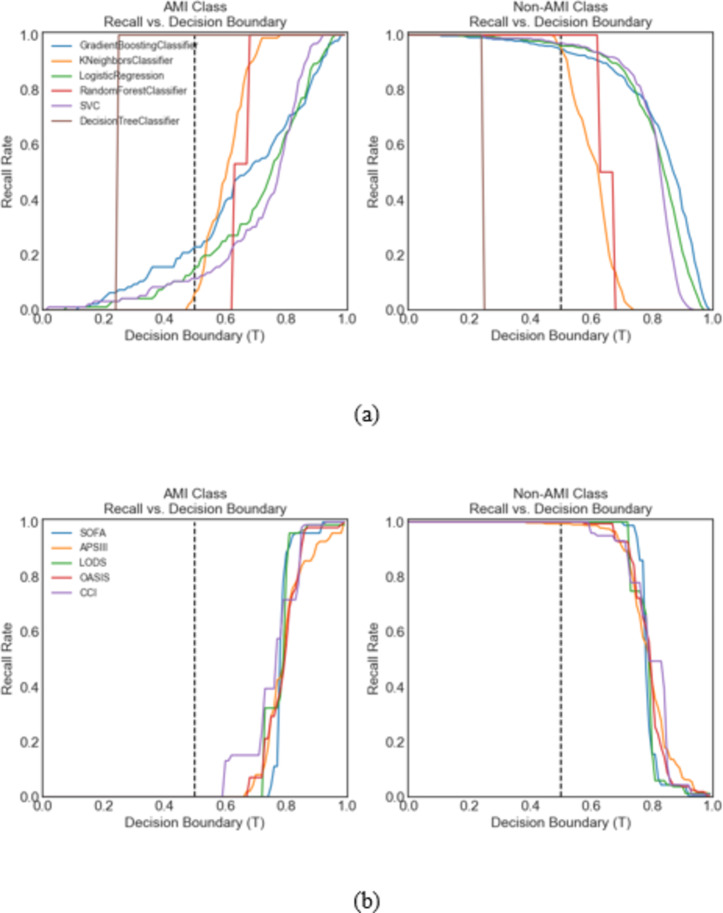
Figure 4 displays recall rates for the GBC model across decision boundaries. At T = 0.5, the recall for patients with AMI was 0.25. Adjusting to T = 0.77, the recall for patients with and without AMI was balanced at 0.75, improving identification of AMI with a minor (19%) reduction in recall for patients without AMI. Recall rates for each model at different thresholds are shown in Fig. 5.
Fig. 4.
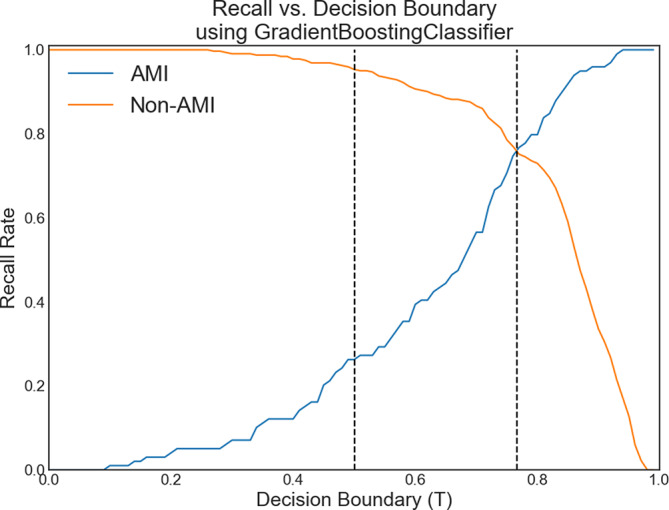
Recall vs. decision boundary T curves for sepsis patients with acute myocardial infarction (AMI) and non-AMI patients for the top performing model, the gradient boosting classifier. At the default classification of T = 0.5 (middle dotted line), the recall rate was 0.94 for non-AMI patients and 0.25 for AMI patients. For T = 0.77 (right dotted line), the recall rates for non-AMI and AMI patients were both 0.75, representing a large improvement in identifying AMI patients, with only a small decrease in the recall rate (19%) for non-AMI patients.
Fig. 5.
Recall vs. decision boundary curves for AMI patients and non-AMI patients according to all 11 ML models. Figure (a) includes 6 machine models; Fig. (b) includes five traditional scoring systems. The gradient boosting classifier model performed the best. The metrics are shown in Table 2.
Testing error
Figure 6 shows ROC curves for the GBC model based on bootstrapped samples (N = 1000), with an average AUC of 0.799 and 95% confidence interval from 0.771 to 0.824, indicating a stable classification performance.
Fig. 6.
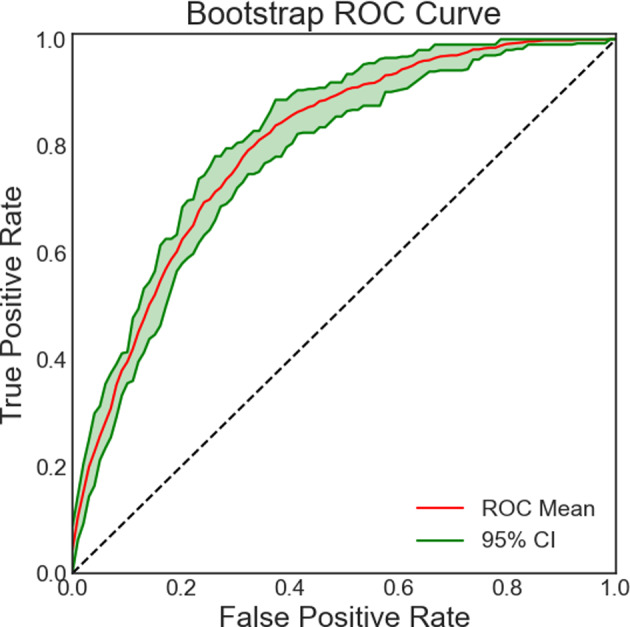
ROC curve for the gradient boosting classifier. The 2-standard deviation spread representing the testing performance for models trained on Nboot bootstrapped samples is also plotted.
Decision curve analysis
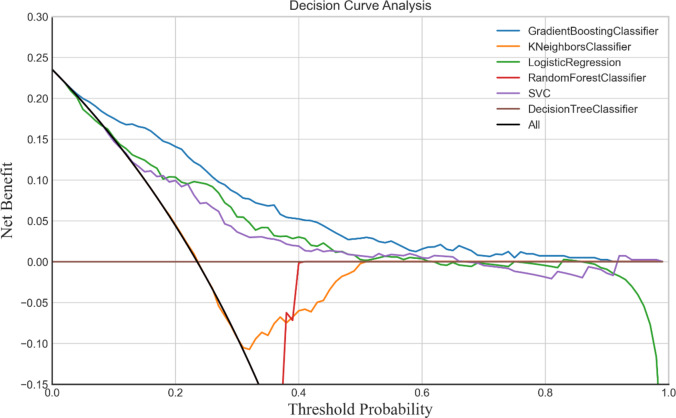
Decision curve analysis (Fig. 7) confirmed the GBC model’s clinical utility within thresholds from 0.1 to 0.9, indicating a net benefit for AMI prediction over models that intervene for all or no patients.
Fig. 7.
Decision curve analyses of the six models.
Feature importance in the GBC model
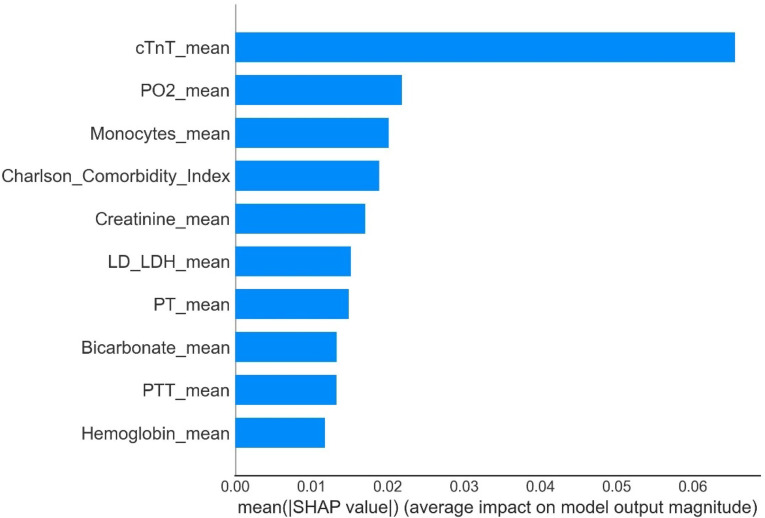
The most significant features in the GBC model were cTnT, PO2, monocyte counts, CCI, creatinine, LD/LDH, PT, bicarbonate, PTT, and hemoglobin, as shown in Fig. 8.
Fig. 8.
Feature importance derived from the gradient boosting classifier model. SHAP revealed the top 10 features that had the greatest impact on the GBC model predictions.
Discussion
This study is the first to utilize the MIMIC-IV database to establish an ML-based model to explore the prediction of AMI in patients with sepsis. We found that the GBC model demonstrated superior predictive performance in identifying patients with sepsis and concurrent AMI, achieving an AUC of 0.838, which was significantly higher than other ML models (such as logistic regression, support vector machines, etc.) (Fig. 3; Table 2). These results suggest that ML, particularly the GBC model, can be used ot effectively identify the risk of AMI in patients with sepsis, offering high clinical value. Important features selected by Boruta algorithm include cTnT, PO2, monocyte count, CCI, creatinine, LD/LDH, PT, bicarbonate, PTT, and hemoglobin (Fig. 2). These biomarkers and clinical characteristics are closely associated with the occurrence of AMI in sepsis, providing key insights for early diagnosis and intervention of this condition22,23.
Sepsis and AMI are the leading causes of death in intensive care units (ICUs), and sepsis has been shown to exacerbate the occurrence of AMI24. In our study, the mortality rate for patients with sepsis and concurrent AMI was 71.7%. A retrospective cohort study conducted in the United States over more than 15 years demonstrated that patients with sepsis and AMI had a higher in-hospital mortality rate23. The results of the SHOCK trial further confirmed a high mortality risk for patients with sepsis with AMI25. Shah et al. also verified that, among patients with sepsis, those with AMI had a significantly higher in-hospital mortality rate than those with demand ischemia (48.3% vs. 28.5%)6. In another large cohort study, Dalager-Pedersen et al. reported that, compared to other hospitalized patients, those with community-acquired bacteremia had an increased risk of developing AMI and stroke26. Given the high mortality rate associated with sepsis with concurrent AMI, timely prediction and intervention are expected to improve clinical outcomes. Unfortunately, it is often difficult for clinicians to identify patients with sepsis and concurrent AMI in the ICU. Therefore, establishing and implementing reliable predictive models to identify these patients and provide timely, effective interventions to improve their prognosis is of significant importance.
There is a pathophysiological link between sepsis and AMI, and patients with both conditions typically have a higher mortality rate27. In our study, using the SHAP model for interpretation, we identified five key predictive factors: cTnT, PO2, monocyte count, CCI, and creatinine (Fig. 8). In patients with sepsis, an imbalance in myocardial oxygen supply and demand occurs, leading to reduced coronary perfusion and increased myocardial oxygen consumption. When hypoxia is reversed and oxygen is administered (reperfusion), the excessive production of superoxide radicals and other free radicals exacerbates the hypoxia, resulting in myocardial cell injury and apoptosis, which increases the risk of AMI28–31. Therefore, cTnT and PO2 serve as effective predictive factors. The systemic immune-inflammatory response in sepsis activates monocytes, promoting a “cytokine storm” and intensifying the accumulation of lipids and immune cells in the vascular endothelium, thereby increasing the risk of AMI32,33. Additionally, patients with sepsis and AMI typically have higher CCI scores, which are closely associated with the prognosis of both sepsis and AMI, supporting their use in disease prognosis evaluation34,35. Moreover, sepsis often leads to renal failure, and elevated creatinine levels indicate impaired renal excretion, activating the renin–angiotensin–aldosterone system, which causes vasoconstriction and increased blood pressure, further aggravating coronary insufficiency and ultimately raising the risk of AMI36. Therefore, factors such as cTnT, PO2, the monocyte count, CCI, and creatinine play crucial roles in predicting sepsis complicated by AMI, helping clinicians to identify and intervene earlier to improve prognoses.
The GBC model has demonstrated consistent performance in predicting sepsis-associated kidney injury16, diagnosing sepsis37, and predicting the 30-d mortality rate in patients with sepsis38. However, there remains a considerable research gap regarding the predictive efficacy, model stability, and clinical utility of the GBC model specifically in sepsis complicated by AMI, with insufficient evidence to substantiate its advantage in this area. Although the GBC model has shown promise in some clinical applications, it is not always the optimal choice. For instance, a study by Zhu et al.39, the RF model was most effective in predicting in-hospital mortality for patients with sepsis, demonstrating greater net benefit and better threshold probability compared to other models. Misra et al.’s study7 further showed that the RF model performed best in the early identification of patients with septic shock, achieving a sensitivity of 83.9% and specificity of 88.1%. In terms of predicting adverse cardiovascular events, Xiao et al. also reported that the RF model outperformed others and was considered the best predictive tool for patients with AMI8. Cai et al. found that the RF model was the top-performing model among six ML models for predicting the risk of acute kidney injury in patients with AMI9. These findings suggest that, while the GBC model performs well in some applications, the RF model consistently demonstrates stronger predictive capabilities across various clinical scenarios. Future studies should consider incorporating additional predictive factors to further optimize model stability and predictive accuracy.
Sepsis is a severe life-threatening condition that often leads to multiple organ failure and, in particular, cardiovascular dysfunction, which significantly impacts patient morbidity and mortality3. Sepsis-induced cardiomyopathy and septic cardiogenic shock are key cardiac complications contributing to poor outcomes, especially in the ICU, where predicting these complications is crucial for improving prognosis40. Although previous studies have explored various predictive factors, including biomarkers, hemodynamic parameters, and clinical indicators, the dynamic and heterogeneous nature of sepsis still poses challenges for accurate prediction41. In recent years, ML models, especially those incorporating feature selection methods42, have shown potential for improving mortality prediction accuracy in the ICU setting. By identifying robust predictive factors such as organ dysfunction (PT, INR, creatinine, etc.)43, hemodynamic instability, and inflammatory markers (cTnT, WBC, PCT, IL-6, TNF-α, etc.)44, ML methods can help provide more information for individual-level mortality prediction and analyzing regional mortality differences, supporting targeted quality improvement initiatives. Furthermore, precise risk stratification not only helps predict the risk of AMI in patients with sepsis but also improves clinical strategies. Early identification of patients with high risk, particularly in regions with high sepsis mortality, may significantly improve outcomes45. Imaging data, especially functional connectivity data, have also recently been recognized as important for predicting cardiac events (such as AMI) triggered by sepsis. Since these cardiac events often accompany subtle physiological changes that traditional clinical assessment methods may miss, imaging techniques provide additional biomarkers to monitor cardiovascular changes during sepsis. Combining clinical features with imaging data enhances the predictive ability of ML models, offering more precise tools for the early detection of sepsis-related cardiac events46. Moreover, deep learning models based on attention mechanisms have shown great potential for real-time monitoring of clinical events, particularly during critical moments like when patients have elevated cardiac biomarkers and “cytokine storms,” which typically require urgent intervention47. By focusing on key moments in a patient’s clinical trajectory, attention-based models may significantly improve the prediction of sepsis-related cardiac events, especially in detecting early signs of deterioration that traditional monitoring methods may overlook. In the future, integrating traditional ML methods with imaging technologies to develop more efficient and interpretable predictive models will help improve outcomes for patients.
This study had several limitations. First, its retrospective and observational nature may have introduced unavoidable selection bias. Second, the data from MIMIC-IV are sourced from a single center in the United States, which may limit the generalizability of the predictive model to other populations. Therefore, further research with larger sample sizes and external validation from multiple centers is needed to apply and validate the model. Third, our study primarily focused on clinical features, but incorporating imaging data could further enhance the predictive power of the ML model.
Conclusions
In conclusion, this study provides evidence to support the application of ML in predicting AMI in patients with sepsis. By identifying key clinical predictive factors and integrating them into an ML framework, we developed a GBC predictive model that may assist clinicians in identifying patients with high risk of AMI earlier and more accurately. This could lead to earlier intervention strategies and more personalized treatment plans, thereby improving patient outcomes. Our research also highlights the broader implications of sepsis-related mortality and the potential of attention-based deep learning models to enhance predictive accuracy. In the future, integrating multimodal data, including clinical, hemodynamic, and imaging data, into a unified ML framework may represent the next frontier in improving the prediction and management of sepsis-related complications. Further validation and refinement of these models in different clinical settings are crucial to establishing their practical applications and optimizing patient care outcomes.
Acknowledgements
The authors would like to thank MIMIC-IV for open access to their database. The opinions expressed in this study are those of the authors and do not represent the opinions of the Beth Israel Deaconess Medical Center.
Abbreviations
- AMI
Acute myocardial infarction
- ICUs
Intensive care units
- MIMIC-IV
Medical information mart for intensive care IV
- LR
Logistic regression
- KNN
k-nearest neighbors
- RF
Random forest
- GBC
Gradient boosting classifier
- SVC
Support vector classifier
- DT
Decision tree
- SOFA
Sequential organ failure assessment
- APS III
Acute physiology score III
- CCI
Charlson comorbidity index
- ML
Machine learning
- ICD-9
International Classification of Diseases and Ninth Revision
- INR
International normalized ratio
- PT
Prothrombin time
- PTT
Partial thromboplastin time
- PO2
Arterial partial pressure of oxygen
- LD/LDH
Lactate dehydrogenase
- cTnT
Troponin T
- AUC
Area under curve
Author contributions
Literature search: SF, HJ, YW and WN; Study design: SF and XJ; Data collection: SF, YF, WS and JZ; Data analysis: SF and HJ; Model construction: SF and JZ; Manuscript writing: SF, YW, WN, WS and YF. All authors read and approved the final manuscript.
Funding
This work was supported by the “1 + X” Plan Clinical Technology Improvement Project of the Second Hospital of Dalian Medical University, Project No. 2022LCJSGC11.
Data availability
The datasets used and analyzed during the current study are available from the corresponding author on reasonable request.
Declarations
Competing interests
The authors declare no competing interests.
Footnotes
Publisher’s note
Springer Nature remains neutral with regard to jurisdictional claims in published maps and institutional affiliations.
References
- 1.Rhodes, A. et al. Surviving sepsis campaign: International guidelines for Management of Sepsis and Septic Shock: 2016. Intensive Care Med.43, 304–377 (2017). [DOI] [PubMed] [Google Scholar]
- 2.Song, J. et al. Diagnostic and prognostic value of interleukin-6, pentraxin 3, and procalcitonin levels among sepsis and septic shock patients: a prospective controlled study according to the Sepsis-3 definitions. BMC Infect. Dis.19, 968 (2019). [DOI] [PMC free article] [PubMed] [Google Scholar]
- 3.Frencken, J. F. et al. Myocardial Injury in patients with sepsis and its association with long-term outcome. Circ: Cardiovasc. Qual. Outcomes11, e004040 (2018). [DOI] [PubMed] [Google Scholar]
- 4.Kakihana, Y., Ito, T., Nakahara, M., Yamaguchi, K. & Yasuda, T. Sepsis-induced myocardial dysfunction: pathophysiology and management. J. Intensive Care4, 22 (2016). [DOI] [PMC free article] [PubMed] [Google Scholar]
- 5.Lin, Y. M. et al. Association of sepsis-induced cardiomyopathy and mortality: a systematic review and meta-analysis. Ann. Intensiv. Care12, 112 (2022). [DOI] [PMC free article] [PubMed] [Google Scholar]
- 6.Shah, M. et al. Mortality in sepsis: comparison of outcomes between patients with demand ischemia, acute myocardial infarction, and neither demand ischemia nor acute myocardial infarction. Clin. Cardiol.41, 936–944 (2018). [DOI] [PMC free article] [PubMed] [Google Scholar]
- 7.Misra, D. et al. Early detection of septic shock onset using interpretable machine learners. J. Clin. Med.10, 301 (2021). [DOI] [PMC free article] [PubMed] [Google Scholar]
- 8.Xiao, C. et al. Prognostic value of machine learning in patients with acute myocardial infarction. J. Cardiovasc. Dev. Dis.9, 56 (2022). [DOI] [PMC free article] [PubMed] [Google Scholar]
- 9.Cai, D. et al. Predicting acute kidney injury risk in acute myocardial infarction patients: an artificial intelligence model using medical information mart for intensive care databases. Front. Cardiovasc. Med.9, 964894 (2022). [DOI] [PMC free article] [PubMed] [Google Scholar]
- 10.Wu, W. T. et al. Data mining in clinical big data: the frequently used databases, steps, and methodological models. Milit. Med. Res.8, 44 (2021). [DOI] [PMC free article] [PubMed] [Google Scholar]
- 11.Johnson, A. E. W. et al. MIMIC-IV, a freely accessible electronic health record dataset. Sci. Data10, 1 (2023). [DOI] [PMC free article] [PubMed] [Google Scholar]
- 12.Evans, L. Surviving sepsis campaign: international guidelines for management of sepsis and septic shock 2021. [DOI] [PMC free article] [PubMed]
- 13.Zhang, Z. Multiple imputation with multivariate imputation by chained equation (MICE) package. Ann. Transl. Med.4, 30 (2016). [DOI] [PMC free article] [PubMed] [Google Scholar]
- 14.Lee, K. J. & Simpson, J. A. Introduction to multiple imputation for dealing with missing data. Respirology19, 162–167 (2014). [DOI] [PubMed] [Google Scholar]
- 15.Sterne, J. A. C. et al. Multiple imputation for missing data in epidemiological and clinical research: potential and pitfalls. BMJ338, b2393 (2009). [DOI] [PMC free article] [PubMed] [Google Scholar]
- 16.Yue, S. et al. Machine learning for the prediction of acute kidney injury in patients with sepsis. J. Transl. Med.20, 215 (2022). [DOI] [PMC free article] [PubMed] [Google Scholar]
- 17.Kursa, M. B. & Rudnicki, W. R. Feature selection with the Boruta Package. J. Stat. Soft36 (2010).
- 18.Hosseini Mojahed, F. et al. Clinical Evaluation of the Diagnostic Role of MicroRNA-155 in Breast Cancer. Int J Genom. 2020, 9514831 (2020). [DOI] [PMC free article] [PubMed]
- 19.Santulli, G. et al. We are what we eat: impact of food from short supply chain on metabolic syndrome. J. Clin. Med.8, 2061 (2019). [DOI] [PMC free article] [PubMed] [Google Scholar]
- 20.Vickers, A. J., Van Calster, B. & Steyerberg, E. W. A simple, step-by-step guide to interpreting decision curve analysis. Diagn. Progn. Res.3, 18 (2019). [DOI] [PMC free article] [PubMed] [Google Scholar]
- 21.Ponce-Bobadilla, A. V., Schmitt, V., Maier, C. S., Mensing, S. & Stodtmann, S. Practical guide to SHAP analysis: explaining supervised machine learning model predictions in drug development. Clin. Transl. Sci.17, e70056 (2024). [DOI] [PMC free article] [PubMed] [Google Scholar]
- 22.Smilowitz, N. R., Gupta, N., Guo, Y. & Bangalore, S. Comparison of outcomes of patients with Sepsis with Versus without Acute myocardial infarction and comparison of Invasive Versus Noninvasive Management of the patients with infarction. Am. J. Cardiol.117, 1065–1071 (2016). [DOI] [PubMed] [Google Scholar]
- 23.Jentzer, J. C. et al. Concomitant Sepsis diagnoses in Acute myocardial infarction-cardiogenic shock: 15-Year national temporal trends, Management, and outcomes. Crit. Care Explor.4, e0637 (2022). [DOI] [PMC free article] [PubMed] [Google Scholar]
- 24.Jentzer, J. C. et al. Shock in the cardiac intensive care unit: changes in epidemiology and prognosis over time. Am. Heart J.232, 94–104 (2021). [DOI] [PubMed] [Google Scholar]
- 25.Kohsaka, S. Systemic inflammatory response syndrome after Acute myocardial infarction complicated by cardiogenic shock. Arch. Intern. Med.165, 1643 (2005). [DOI] [PubMed] [Google Scholar]
- 26.Ramirez, J. et al. Acute myocardial infarction in hospitalized patients with community-acquired pneumonia. Clin. Infect. Dis.47, 182–187 (2008). [DOI] [PubMed] [Google Scholar]
- 27.Zochios, V. & Valchanov, K. Raised cardiac troponin in intensive care patients with sepsis, in the absence of angiographically documented coronary artery disease: a systematic review. J. Intensive Care Soc.16, 52–57 (2015). [DOI] [PMC free article] [PubMed] [Google Scholar]
- 28.Hussain, N. Elevated cardiac troponins in setting of systemic inflammatory response syndrome, sepsis, and septic shock. ISRN Cardiol.2013, 723435 (2013). [DOI] [PMC free article] [PubMed]
- 29.Landesberg, G. et al. Troponin elevation in severe sepsis and septic shock: the role of left ventricular diastolic dysfunction and right ventricular dilatation*. Crit. Care Med.42, 790–800 (2014). [DOI] [PubMed] [Google Scholar]
- 30.Rahmel, T. et al. Mitochondrial dysfunction in sepsis is associated with diminished intramitochondrial TFAM despite its increased cellular expression. Sci. Rep.10, 21029 (2020). [DOI] [PMC free article] [PubMed] [Google Scholar]
- 31.Bar-Or, D. et al. Sepsis, oxidative stress, and hypoxia: are there clues to better treatment? Redox Rep.20, 193–197 (2015). [DOI] [PMC free article] [PubMed] [Google Scholar]
- 32.Shalova, I. N. et al. Human monocytes undergo functional re-programming during sepsis mediated by hypoxia-inducible factor-1α. Immunity42, 484–498 (2015). [DOI] [PubMed] [Google Scholar]
- 33.Dong, Z. et al. Myocardial infarction drives trained immunity of monocytes, accelerating atherosclerosis. Eur. Heart J.45, 669–684 (2024). [DOI] [PubMed] [Google Scholar]
- 34.Radovanovic, D. et al. Validity of Charlson Comorbidity Index in patients hospitalised with acute coronary syndrome. Insights from the nationwide AMIS Plus registry 2002–2012. Heart100, 288–294 (2014). [DOI] [PubMed] [Google Scholar]
- 35.Jouffroy, R. et al. Relationship between prehospital modified Charlson Comorbidity Index and septic shock 30-day mortality. Am. J. Emerg. Med.60, 128–133 (2022). [DOI] [PubMed] [Google Scholar]
- 36.Maksimczuk, J., Galas, A. & Krzesiński, P. What promotes acute kidney Injury in patients with myocardial infarction and multivessel coronary artery disease-contrast media, hydration status or something else? Nutrients15, 21 (2022). [DOI] [PMC free article] [PubMed] [Google Scholar]
- 37.Yang, Z., Cui, X. & Song, Z. Predicting sepsis onset in ICU using machine learning models: a systematic review and meta-analysis. BMC Infect. Dis.23, 635 (2023). [DOI] [PMC free article] [PubMed] [Google Scholar]
- 38.Hou, N. et al. Predicting 30-days mortality for MIMIC-III patients with sepsis-3: a machine learning approach using XGboost. J. Transl. Med.18, 462 (2020). [DOI] [PMC free article] [PubMed] [Google Scholar]
- 39.Zhu, M. et al. Construction of a predictive model for in-hospital mortality of sepsis patients in intensive care unit based on machine learning. Zhonghua Wei Zhong Bing Ji Jiu Yi Xue35, 696–701 (2023). [DOI] [PubMed] [Google Scholar]
- 40.Hendrickson, K. W. et al. Identifying predictors and determining mortality rates of septic cardiomyopathy and sepsis-related cardiogenic shock: a retrospective, observational study. PLoS One19, e0299876 (2024). [DOI] [PMC free article] [PubMed] [Google Scholar]
- 41.Morales, C., Ribas, V. & Vellido, A. Applying Conditional Independence Maps to Improve Sepsis Prognosis. In IEEE 16th International Conference on Data Mining Workshops (ICDMW), 254–260. 10.1109/ICDMW.2016.0043 (2016).
- 42.Aushev, A. et al. Feature selection for the accurate prediction of septic and cardiogenic shock ICU mortality in the acute phase. PLoS One13, e0199089 (2018). [DOI] [PMC free article] [PubMed] [Google Scholar]
- 43.Liu, L. et al. The association between prothrombin time-international normalized ratio and long-term mortality in patients with coronary artery disease: a large cohort retrospective study with 44,662 patients. BMC Cardiovasc. Disord.22, 297 (2022). [DOI] [PMC free article] [PubMed] [Google Scholar]
- 44.Chen, Y., Tao, Y., Zhang, L., Xu, W. & Zhou, X. Diagnostic and prognostic value of biomarkers in acute myocardial infarction. Postgrad. Med. J.95, 210–216 (2019). [DOI] [PubMed] [Google Scholar]
- 45.Hu, J. R. et al. Risk-standardized sepsis mortality map of the United States. Digit. Health8, 20552076211072400 (2022). [DOI] [PMC free article] [PubMed] [Google Scholar]
- 46.Avvisato, R., Forzano, I., Varzideh, F., Mone, P. & Santulli, G. A machine learning model identifies a functional connectome signature that predicts blood pressure levels: imaging insights from a large population of 35 882 patients. Cardiovasc. Res.119, 1458–1460 (2023). [DOI] [PubMed] [Google Scholar]
- 47.Kaji, D. A. et al. An attention based deep learning model of clinical events in the intensive care unit. PLoS One14, e0211057 (2019). [DOI] [PMC free article] [PubMed] [Google Scholar]
Associated Data
This section collects any data citations, data availability statements, or supplementary materials included in this article.
Data Availability Statement
The datasets used and analyzed during the current study are available from the corresponding author on reasonable request.


