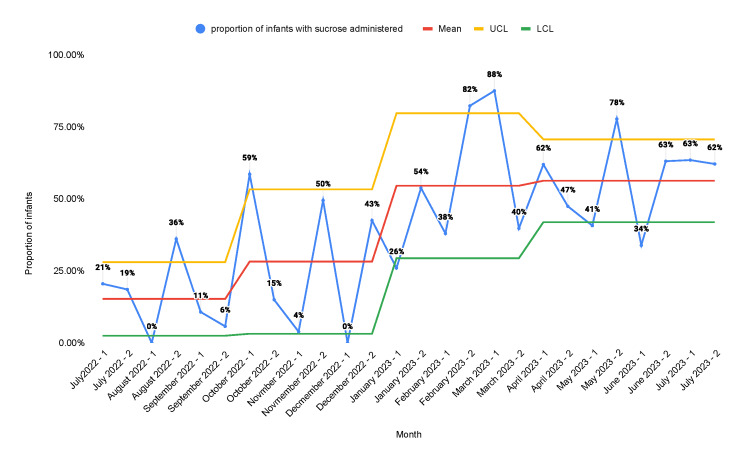
Figure 5. Statistical process control chart representing the proportion of procedures that received sucrose for pain .
A: educational campaign; B: monthly stakeholder meetings; C: weekly huddles; D: note-writing assistance; E: readily available medication information; F: incorporation of smart order sets; G: placement of sucrose and lidocaine in readily accessible locations
UCL: upper control limit; LCL: lower control limit

