Abstract
Background
Oral squamous cell carcinoma (OSCC) is an aggressive malignancy with poor prognosis. Neutrophil infiltration has been associated with unfavorable outcomes in OSCC, but the underlying molecular mechanisms remain unclear.
Methods
This study integrated single-cell transcriptomics (scRNA-seq) with bulk RNA-seq data to analyze neutrophil infiltration patterns in OSCC and identify key gene modules using weighted gene co-expression network analysis (hdWGCNA). A prognostic model was developed based on univariate and Lasso-Cox regression analyses, stratifying patients into high- and low-risk groups. Immune landscape and drug sensitivity analyses were conducted to explore group-specific differences. Additionally, Mendelian randomization analysis was employed to identify genes causally related to OSCC progression.
Results
Several key pathways associated with neutrophil interactions in OSCC progression were identified, leading to the construction of a prognostic model based on significant module genes. The model demonstrated strong predictive performance in distinguishing survival rates between high- and low-risk groups. Immune landscape analysis revealed significant differences in cell infiltration patterns and TIDE scores between the groups. Drug sensitivity analysis highlighted differences in drug responsiveness between high- and low-risk groups.
Conclusion
This study elucidates the critical role of neutrophils and their associated gene modules in OSCC progression. The prognostic model provides a novel reference for patient stratification and targeted therapy. These findings offer potential new targets for OSCC diagnosis, prognosis, and immunotherapy.
Supplementary Information
The online version contains supplementary material available at 10.1186/s40246-024-00712-7.
Keywords: Oral squamous cell carcinoma, Neutrophils, Immune landscape, Risk model, Biomarkers
Introduction
Oral squamous cell carcinoma (OSCC) is a type of head and neck cancer primarily manifested as oral ulcers or sores, bleeding lumps, gingival bleeding, and difficulties in chewing or swallowing [1–3]. Chronic OSCC can invade surrounding tissues and bones, leading to jaw or facial deformities. Smoking and alcohol consumption are typical risk factors for OSCC. The five-year survival rate for OSCC is approximately 50% [4], and early diagnosis can significantly improve patient prognosis. Therefore, identifying and validating more effective molecular biomarkers is essential for OSCC diagnosis, targeted therapy, and prognosis improvement.
Neutrophils play a critical role in oral squamous cell carcinoma (OSCC), primarily by promoting tumor growth and modulating the tumor microenvironment, which influences tumor progression. They contribute to an inflammatory response, suppress anti-tumor immunity, and remodel the extracellular matrix, creating favorable conditions for tumor development [5–7]. Additionally, neutrophils act as regulators of signaling pathways, modulating mechanisms associated with cancer cell survival and metastasis [8]. Furthermore, they release neutrophil extracellular traps (NETs), which enhance cancer cell migration and invasion [9]. Concurrently, endoplasmic reticulum stress can induce immunosuppressive functions in neutrophils, further inhibiting anti-tumor immune responses [10]. Neutrophils can promote tumor growth by supporting inflammation, suppressing anti-tumor immune responses, and remodeling the extracellular matrix, creating a favorable microenvironment for tumor development. In the OSCC tumor microenvironment, they act as regulators of various signaling pathways with pro-tumor functions. For instance, Marco A. O. Magalhaes et al. found that neutrophils modulate pathways linked to cancer cell survival and metastasis [11]. Additionally, neutrophils produce neutrophil extracellular traps (NETs), which, as Marzena Garley et al. highlighted, actively contribute to OSCC progression by facilitating cancer cell migration and invasion [12]. Wu et al. discovered that endoplasmic reticulum stress within OSCC cells can be transmitted to neutrophils, inducing immunosuppressive functions that inhibit the anti-tumor immune response [10].
Previous studies have described the potential role of key genes and signatures in OSCC prognosis and diagnosis from various aspects. For instance, Zhou et al. identified the pro-cancer role of E2F7 in OSCC cell lines through qRT-PCR and Western blot analysis [13]. Chen et al. analyzed head and neck squamous cell carcinoma (HNSCC) cohorts from The Cancer Genome Atlas (TCGA) database, using ssGSEA and hierarchical clustering to categorize patients into high and low immune groups, and established a robust prognostic model with five features [14]. Xie et al. found that CDH4 expression in OSCC is higher than in normal tissues based on TCGA data. Further biological experiments revealed that CDH4 promotes cell proliferation, migration, self-renewal, and invasion [15]. Given the significant association between neutrophil infiltration and OSCC prognosis, this study identifies key gene modules related to neutrophils in OSCC using single-cell transcriptomics (scRNA-seq). Further analysis of bulk RNA-seq data identified multiple genes related to OSCC prognosis. The risk model constructed based on these genes can effectively stratify patients, providing a reference for patient stratification and targeted therapy. Additionally, researchers have reported on the roles of neutrophil-associated markers in various squamous cell carcinomas. For instance, Guo et al. found that Porphyromonas gingivalis promotes OSCC progression within the tumor microenvironment by activating neutrophil chemotaxis [16]. Wang et al. identified that the expression of neutrophil gelatinase-associated lipocalin protein is associated with the incidence of head and neck squamous cell carcinoma (HNSCC) but not with regional metastasis, suggesting its potential as a novel prognostic biomarker for HNSCC patients [17]. In lung squamous cell carcinoma, Wang et al. reported that high levels of neutrophil-associated markers correlate with poor prognosis. The developed risk score model effectively predicted patient survival and revealed mechanisms of interaction between neutrophils and tumor cells, offering potential targets for personalized treatment [18].
Despite current advancements in OSCC diagnosis and treatment, patient prognosis remains suboptimal, necessitating further research to uncover key molecular mechanisms affecting OSCC progression. This study utilizes scRNA-seq technology, combined with bulk RNA-seq data, to comprehensively analyze neutrophil infiltration patterns and associated key gene modules in OSCC. Prognostic genes were identified using univariate Cox regression and Lasso-Cox regression, and an effective prognostic model was constructed, stratifying patients into high and low-risk groups based on risk scores. Subsequent immune landscape and drug sensitivity analyses revealed significant immune differences and potential drug targets between the high and low-risk groups. Additionally, Mendelian randomization (MR) analysis identified prognostic genes causally related to OSCC development. Our research not only elucidates the critical role of neutrophils in the OSCC tumor microenvironment but also provides new molecular biomarkers and potential targets for patient diagnosis, prognosis evaluation, and targeted therapy, laying the foundation for clinical applications.
Method
Dataset acquisition
For scRNA-seq data, we obtained the GSE172577 dataset from the Gene Expression Omnibus (GEO) database. This dataset includes 6 OSCC samples. For bulk RNA-seq data, we acquired the expression data from the TCGA-HNSC cohort from The Cancer Genome Atlas (TCGA) database, which includes 32 normal and 330 OSCC patients. The GSE41613 dataset from the GEO database, containing 97 oral cancer patients, was used as a validation dataset for the prognostic model. For tumor mutation burden (TMB) analysis, we used the “TCGAbiolinks” package in R software to download TMB data from the TCGA-HNSC cohort [19].We explored the DNA methylation levels of prognosis-related genes in head and neck cancer (HNSCC, to which OSCC belongs) using the UALCAN database (https://ualcan.path.uab.edu/). Additionally, we collected four spatial transcriptomics samples of OSCC from the GSE220978 dataset.
Preprocessing of scRNA-seq data
We used the Seurat package (v4.0.0) in R software to read the raw data using the Read10X function and created Seurat objects for each sample. The samples were merged into a single Seurat object. In this study, the quality control steps for single-cell RNA sequencing data were conducted using the Seurat package. First, to remove low-quality cells, each cell was filtered based on the number of features (genes) and the proportion of mitochondrial genes. Specifically, only cells with a feature count between 200 and 7500 and a mitochondrial gene proportion below 20% were retained, ensuring the reliability and quality of the data for subsequent analysis. The filtered cells were then normalized, log-transformed, and scaled using the NormalizeData, FindVariableFeatures, and ScaleData functions, respectively. Principal component analysis (PCA) was used to identify variable features, retaining the top 20 principal components for downstream analysis.
Further, we annotated cell types using the SingleR package (v1.0.0) in R software. The Human Primary Cell Atlas database was used as a reference dataset for cell type identification. The scRNA-seq data were matched to the reference dataset, and cell types were predicted using the SingleR algorithm. Predicted cell types were visualized using t-distributed stochastic neighbor embedding (t-SNE) plots. To identify marker genes associated with specific cell types, we selected genes based on their expression levels and calculated the proportion of each cell type in the dataset. Marker gene expression was visualized using violin plots and stacked bar plots.
Cell communication analysis
In this study, cell–cell communication analysis was conducted using the CellChat package (v1.6.1) in R software. First, expression matrices and cell type information were extracted from preprocessed scRNA-seq data to create CellChat objects. The CellChatDB database was selected to identify specific interaction annotations associated with cell–cell communication, and secreted signaling pathways were chosen for further analysis. Signaling pathways were inferred at both the gene expression and interaction levels, with ligand and receptor expression data projected onto protein interaction networks. Next, cell–cell communication networks were constructed by calculating communication probabilities using the computeCommunProb function. A minimum cell count threshold (min.cells = 3) was applied to exclude communications involving only a few cells, enhancing specificity. To refine communication signals, the computeCommunProbPathway function was used to infer communication at the pathway level, and aggregateNet was employed to calculate the aggregated cell communication network. Finally, centrality scores were calculated using netAnalysis_computeCentrality, and heatmaps and scatter plots were generated to visualize the primary signaling sources and targets in the network, thus identifying ligand-receptor pairs that play key roles in intercellular communication.
High-dimensional weighted gene co-expression network analysis
Weighted gene co-expression network analysis (WGCNA) was conducted using the hdWGCNA package (v0.2.19) in R software [20]. This algorithm is particularly well-suited for handling high-dimensional and complex datasets. It efficiently identifies gene modules with co-expression patterns, reducing data dimensionality and extracting underlying biological information. This enhances biological interpretability, assisting researchers in identifying gene modules associated with specific biological processes or disease states. The hdWGCNA package also facilitates the analysis of associations between gene modules and phenotypic traits and provides a range of visualization tools for intuitive display of gene networks and modules.
Specifically, the SetupForWGCNA(·) function was used to prepare for WGCNA analysis, selecting the “fraction” gene selection method and setting the sampling proportion to 0.05. Metacells were constructed using the MetacellsByGroups(·) function, grouped by cell type and batch, with PCA used for dimensionality reduction, setting the KNN parameter to 25 and the maximum shared cell number to 10.
Different soft-thresholds were tested using the TestSoftPowers(·) function, selecting a “signed” network type. The selection of the soft threshold was based on the results of this function, aiming to identify a power value that would yield a scale-free topology in the constructed network. A visual assessment of the power values plotted using PlotSoftPowers(·) function guided the selection of a soft threshold of 5, which was determined to provide the best balance between sensitivity and specificity in capturing co-expression patterns. This approach ensures that the selected threshold not only reflects true biological relationships but also accounts for potential influences of other threshold values tested during the analysis. A co-expression network was then constructed using the ConstructNetwork(·) function with the identified soft threshold. Module eigengenes were calculated using the ModuleEigengenes(·) function. Module connectivity based on eigengenes was calculated using the ModuleConnectivity(·) function. Module-trait correlations were computed using the ModuleTraitCorrelation(·) function, grouped by cell type. Visualization was performed using the PlotDendrogram(·) function for module clustering trees, the ModuleNetworkPlot(·) function for module network plots, the HubGeneNetworkPlot(·) function for hub gene network plots, and the ModuleCorrelogram(·) function for module correlation heatmaps. Finally, we performed KEGG and GO enrichment analyses on genes in the most relevant modules of the neutrophil population. We used the Benjamini-Hochberg (BH) method for multiple testing correction in both GO and KEGG enrichment analyses to control the false discovery rate (FDR).
Pseudotime analysis
Pseudotime trajectory inference was performed on scRNA-seq data using the monocle package (v2.28.0) in R software. The scRNA-seq count matrix and metadata were converted to a monocle-compatible object. Size factors and dispersion were estimated, and low-expressed genes were detected. High-variance genes were selected based on dispersion values, and the dataset was ordered accordingly. Dimensionality reduction was performed using the DDRTree method, and cells were ordered along the trajectory. Pseudotime trajectories were visualized using the plot_cell_trajectory function, with cells colored by cell type and pseudotime values. Cell density along the pseudotime axis was visualized using density plots colored by cell type.
Transcription factor and inferCNV analysis
Transcription factor information was obtained using the Dorothea package (v1.14.1) in R software. High-confidence regulators were screened based on interactions in the Dorothea database. The analysis considered cellular heterogeneity by identifying different cell states within the single-cell RNA sequencing (scRNA-seq) dataset. Transcription factor activity was calculated using the Viper package (v1.36.0) in R software, taking into account the cell types assigned to individual cells. The Viper scores were summarized by cell populations to assess the average activity of transcription factors in each cell type. Transcription factor activity heatmaps were plotted using the pheatmap function, visualizing transcription factors by their activity levels across cell types. This approach allowed for a nuanced understanding of transcription factor dynamics within the heterogeneous cellular landscape of the analyzed samples.
Additionally, we conducted copy number variation (CNV) analysis on scRNA-seq data using the inferCNV package to uncover genomic instability among different cell types within the tumor microenvironment. First, scRNA-seq data were loaded and preprocessed, with human gene annotations obtained through the annoGene(·) function in the “AnnoProbe” package in R, retrieving chromosomal location information, which was then sorted by position and deduplicated. The raw count data from the expression matrix was extracted as the expression matrix file, with T cells designated as the reference group to infer copy number changes in tumor cells. An inferCNV object was then created using the CreateInfercnvObject(·) function, specifying the expression matrix, cell annotations, and gene ordering file, with T cells set as the reference. CNV analysis was performed using the run(·) function.
Differential expression and tumor mutation burden analysis
Differential expression analysis of the TCGA-HNSC cohort transcriptome data was performed using the “limma” package [21] in R software. Benjamini Hochberg was used for p-value correction. Genes were screened with a corrected p-value < 0.001 and |logFC|< 0.5. The differentially expressed genes (DEGs) were intersected with the previously identified blue gene module to obtain intersecting genes. Tumor mutation burden (TMB) analysis was performed on somatic variants from the mutation annotation format (MAF) using the “Maftools” package [22] in R software.
Prognostic gene screening and prognostic model construction and validation
We intersected the differentially expressed genes obtained from previous transcriptomic analysis with the genes in the neutrophil-associated modules identified in the hdWGCNA analysis to obtain a set of intersecting genes. Based on Kaplan–Meier (KM) survival analysis, we then identified genes significantly associated with OSCC prognosis. Subsequently, Prognostic genes were screened from the intersecting genes of OSCC samples using univariate Cox regression analysis (p < 0.03). A network graph of interactions between prognostic genes was constructed using the “igraph,” “psych,” “reshape2,” and “RColorBrewer” packages in R software. Lasso-Cox regression analysis was performed on prognostic genes using the “glmnet” package [22] in R software to further screen genes and construct the prognostic model. The constructed model provided a risk score for each OSCC sample. High- and low-risk groups were divided based on the median score. Kaplan–Meier (KM) curve analysis was performed using the “survival” and “survminer” packages in R software to evaluate prognostic differences between risk groups. The predictive performance of the risk model for patient prognosis was further assessed using receiver operating characteristic (ROC) curves plotted with the “timeROC” package in R software.
Construction and evaluation of the nomogram model
A nomogram model was constructed and calibration curves were plotted using the “rms” package in R software, based on risk scores and clinical factors. The model established a scoring system based on regression coefficients of the features.
Immune infiltration analysis
The CIBERSORT algorithm was used to assess the abundance of various immune cells in OSCC samples. The R package “e1071” was used for CIBERSORT analysis, and we included samples with p-values less than 0.05 for further analysis to ensure statistical significance of the results. Tumor Immune Dysfunction and Exclusion (TIDE) was then introduced to score the two risk groups. TIDE represents tumor immune dysfunction and exclusion, used to evaluate the likelihood of tumor immune escape in the gene expression profiles of tumor samples. TIDE score analysis was completed via the online website (http://tide.dfci.harvard.edu/). We used the Wilcoxon test to analyze differences in TIDE scores between risk subgroups. A p-value of less than 0.05 was considered statistically significant.Finally, we utilized the Estimation of STromal and Immune cells in MAlignant Tumor tissues using Expression data (ESTIMATE) algorithm [23] to calculate the immune and stromal scores of tumor samples using pre-screened stromal/immune-related gene sets.
Mendelian randomization analysis
To identify genes causally related to OSCC development, two-sample Mendelian randomization (MR) analysis was performed using the “TwoSampleMR” package (v0.5.7) in R software. Expression quantitative trait loci (eQTLs) data for prognostic genes and genome-wide association study (GWAS) data for OSCC were collected. Benjamini Hochberg was used for p-value correction. Tool variables were selected based on the significant SNPs derived from eQTL analyses, ensuring they met the criteria of r2 < 0.001, p-value < 5 × 10⁸, and F statistic > 10, and F statistic > 10 to confirm their strength as instrumental variables. To account for potential pleiotropy, we performed horizontal pleiotropy tests and assessed the heterogeneity of the effects. Wald estimates were calculated by dividing SNP-outcome by SNP-exposure values, using the Wald ratio test. A corrected p-value < 0.05 indicated a causal relationship between the gene and the disease.
Drug sensitivity analysis
Based on the GDSC (Genomics of Drug Sensitivity in Cancer) database, drug sensitivity information for various compounds in high- and low-risk OSCC samples was assessed using the “oncoPredict” package [24] in R software. IC50 values, indicating the potential of a compound to inhibit a specific biological or biochemical function, were introduced. Drugs with significantly different IC50 values (p < 0.001) between the two groups were retained.
Spatial transcriptomics data analysis
In this study, the spatial transcriptomics data of oral squamous cell carcinoma (OSCC) were analyzed using the Seurat package. Initially, gene expression data and spatial images from four samples (GSM633487, GSM633486, GSM633485, and GSM633484) were imported to generate Seurat objects, which were then integrated into a single Seurat object named `stRNA` for subsequent analysis. During the data filtering phase, mitochondrial and ribosomal-related genes were removed, and only genes expressed in at least 10 spatial points were retained. Data normalization was performed using the `SCTransform` method to reduce the impact of technical noise. Following normalization, principal component analysis (PCA) was used for dimensionality reduction, and neighborhood graph construction and clustering analysis were conducted based on the top 20 principal components. The spatial distribution of different clusters was visualized using UMAP.
To further analyze the cellular composition of the OSCC samples, we applied deconvolution techniques. Using the scRNA-seq data from this study, we filtered tumor samples and generated a single-cell RNA count matrix along with the number of transcripts per cell, constructing a reference dataset `reference` containing cell types for deconvolution analysis. Subsequently, robust cell type deconvolution was performed on the spatial transcriptomics data using the Robust Cell Type Decomposition method [25] based on the constructed reference single-cell data and spatial transcriptomics data. Dot plots and spatial distribution maps were created to observe the expression patterns of specific genes, and cell types were loaded and annotated.
Quantitative real-time polymerase chain reaction (qRT-PCR)
Patient sample collection
Patients diagnosed with OSCC who underwent surgical treatment between March 2021 and March 2022 at the Fourth Hospital of Hebei Medical University were selected for this study. A total of 16 tissue samples were obtained from the patients, comprising cancerous and corresponding paracancerous tissues from each patient. Notably, none of the patients had undergone tumor-related treatment prior to surgery. Tissue specimens were collected intraoperatively, rapidly frozen in liquid nitrogen post-excision, and cryopreserved in a tumor specimen bank for subsequent RNA extraction. Each patient provided informed consent prior to participation in the study. The use of patient tissue samples was approved by the Ethics Committee of the Fourth Hospital of Hebei Medical University (Approval No.: 2020KY283).
qRT-PCR for gene expression detection
RNA was extracted from tissues using TriQuick reagent (Solarbio, Beijing, China). Reverse transcription and cDNA synthesis were performed using the Eastep® RT Master Mix Kit (Promega, Shanghai, China). Subsequently, qRT-PCR was conducted using Universal Blue SYBR Green qPCR Master Mix (Servicebio, Wuhan, China) to determine mRNA expression levels. The primers were provided by Sangon Biotech (Shanghai, China), and the specific sequences are presented in Table 1. β-actin was used as an internal reference, and the 2−ΔΔCt method was used to calculate the relative mRNA expression levels. Each experiment was conducted at least three times, and the results were expressed as mean ± standard deviation. The data were analyzed using either a paired t-test (when normality was satisfied) or a Wilcoxon signed-rank test (when normality was not satisfied). The raw data from the qRT-PCR experiments are provided in the supplementary material file “PCR data.xlsx”.
Table 1.
Primers for qRT-PCR
| Gene | Primer sequence (5′ → 3′) | |
|---|---|---|
| PTGES3 | Forward | GCCTGCTTCTGCAAAGTGGT |
| Reverse | CTGTCCGTTCTTTTATGCTTGG | |
| CSRP2 | Forward | GAGCAGGGGCTCTTGTTCAT |
| Reverse | TCCTACGAGTTAGCCAGCCT | |
| PSMD2 | Forward | GGACCCAAACAACCTCTTCA |
| Reverse | AGCCACCAGCCCATACAAT | |
| LRG1 | Forward | GTTGGAGACCTTGCCACCT |
| Reverse | GCTTGTTGCCGTTCAGGA | |
| ADM | Forward | TTGCCAGTGGGACGTCTGAG |
| Reverse | GTACATCAGGGCGACGGAAAC | |
| RNF149 | Forward | AACATCACCTTGCCCATGTCT |
| Reverse | CCCCTATGGTCATCGTTACTGG | |
| SNX6 | Forward | AAGCACGAGTGTCTGCTGAT |
| Reverse | TGGGAAGTTTCGGCCTGTAG | |
| PGAM1 | Forward | AGTCAGGTCACTGCCTACTGC |
| Reverse | TCAGGGAGGAAACAGTTGTCAC | |
| PYGL | Forward | CAGCCTATGGATACGGCATTC |
| Reverse | CGGTGTTGGTGTGTTCTACTTT | |
| ANP32B | Forward | CTGTTCGAGAACTTGTCTTGGAC |
| Reverse | AGCTTGGGGAGATTTGAAACTG | |
| EIF2S2 | Forward | CCAGAGCCAACTGAGGACAA |
| Reverse | ACATCACTTTCAATCTTTACACCTT | |
| β-actin | Forward | AGCGAGCATCCCCCAAAGTT |
| Reverse | GGGCACGAAGGCTCATCATT |
Statistical analysis
Statistical analyses were performed using R software (v4.0.3). The Wilcoxon test was employed to compare differences between groups. Prognostic differences between groups were assessed using the Log-rank test. The Kruskal–Wallis rank-sum test was used for multi-group comparisons of clinical factors. Additionally, Spearman correlation analysis was conducted to evaluate the relationship between immune cells and prognostic genes. Unless otherwise specified, a P-value of less than 0.05 was considered statistically significant.
Results
Basic analysis of scRNA-seq and cell communication analysis results
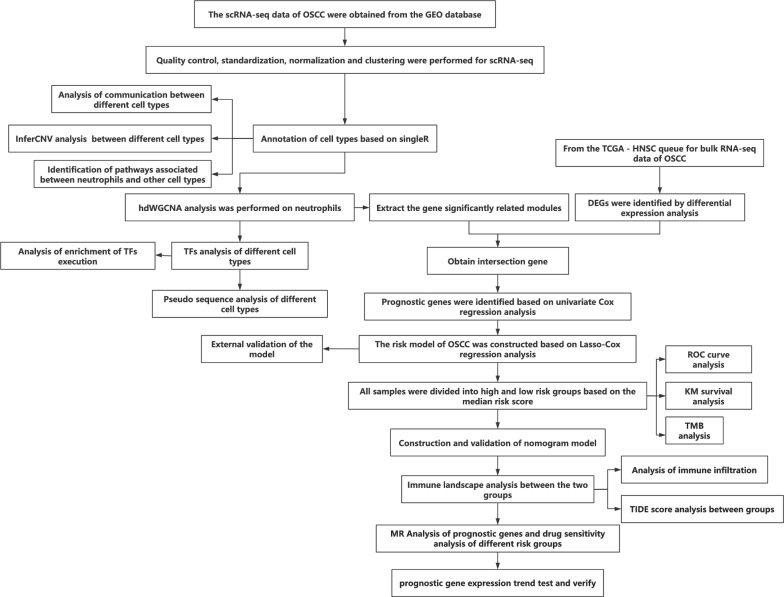
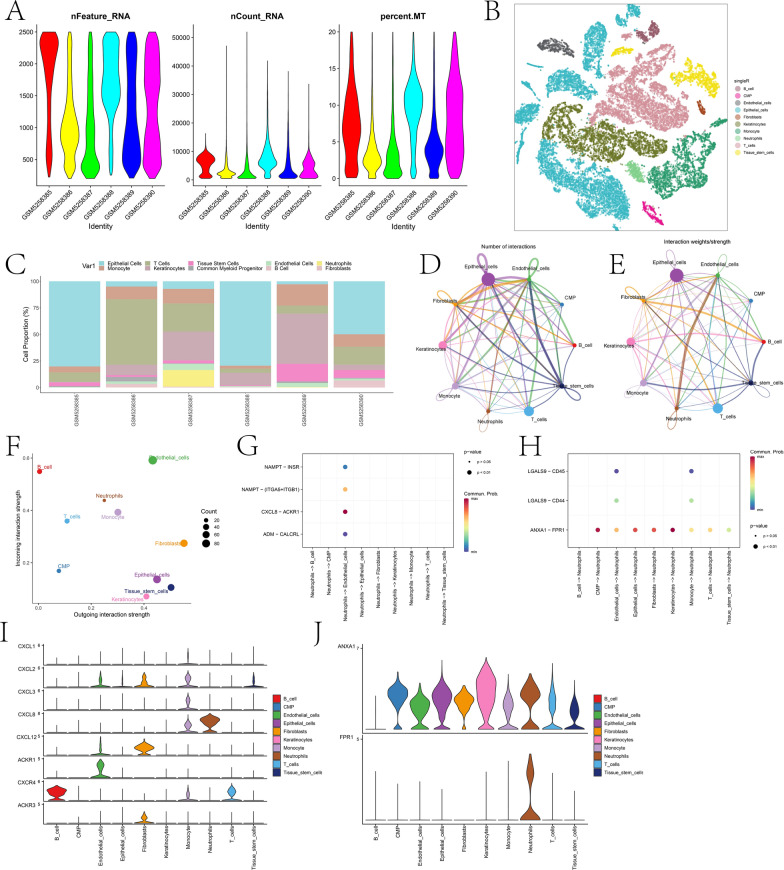
Figure 1 presents the technical roadmap of this study. Initially, scRNA-seq data of OSCC were obtained. First, according to the quality control criteria outlined in Sect. “Dataset acquisition” of the Methods, the number of cells was reduced from 65,225 to 57,904. During cell processing, we initially normalized the data using the NormalizeData(·) function with the parameter normalization.method = ”LogNormalize”. This step adjusted for sequencing depth and other technical variations across cells, ensuring comparability of expression levels. After normalization, we identified the most variable genes using the FindVariableFeatures(·) function and then centered and scaled the data with the ScaleData(·) function. Next, dimensionality reduction was performed (retaining the top 20 principal components, see Fig. S1), followed by clustering analysis. Cell types were annotated using the singleR package in combination with marker genes (see Fig. S2). A total of 10 cell types were annotated (Fig. 2B), including epithelial cells, monocytes, T cells, keratinocytes, tissue stem cells, common myeloid progenitor cells (CMP), endothelial cells, B cells, neutrophils, and fibroblasts. There were notable differences in the proportions of different cell types among various samples (Fig. 2C). The specific proportion is shown in the “Table 1.csv” file in the Supplementary materials. Cell communication analysis results indicated extensive and strong interactions among most cell types (Fig. 2D-E). Among all cell types, endothelial cells exhibited the highest input signal intensity, while fibroblasts showed the highest output signal intensity (Fig. 2F). Given the close association between neutrophils and OSCC, we further explored their communication pathways with other cell types when acting as both receptors and ligands (Fig. 2G-H). The results indicated that the Chemokine (C-X-C motif) ligand (CXCL) pathway and ANNEXIN pathway had the highest intensities when neutrophils were acting as both ligands and receptors. In the discussion section, we will analyze the roles of these pathways and the genes involved in OSCC progression.
Fig. 1.
Technical roadmap for the paper
Fig. 2.
Basic analysis of scRNA-seq. A depicts the violin plot of basic metrics after filtering scRNA-seq data. B shows the distribution of different cell types in two-dimensional space based on t-SNE dimensionality reduction. C illustrates the proportion of different cell types across six samples. D and E represent network diagrams based on the quantity and strength of interaction pathways between different cell types, respectively. F is a scatter plot showing the strength of incoming and outgoing interactions between different cell types. G and H display bubble plots of communication processes between neutrophils acting as ligands and receptors with other cells. I and J show the expression profiles of significant signaling pathway genes involved in neutrophil outgoing and incoming interactions across different cell types, respectively
Module selection related to neutrophils through hdWGCNA
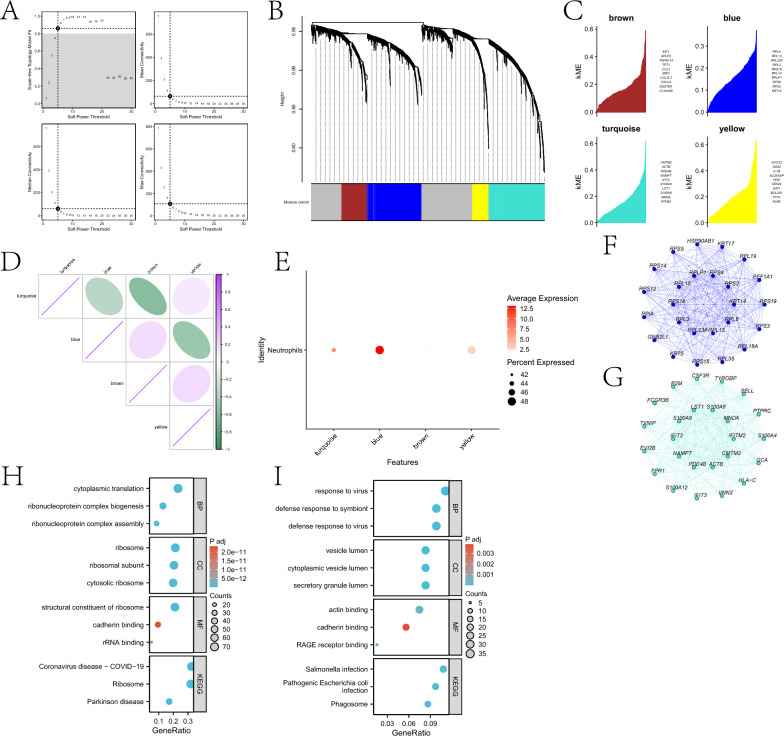
This study explored genes highly correlated with neutrophils based on Weighted Gene Co-expression Network Analysis (WGCNA). After setting the soft threshold to 5 (Fig. 3A), a dendrogram reflecting the relationship between gene expression patterns and modules was drawn (Fig. 3B). The “grey” module contained genes not assigned to any co-expression module. Four modules were identified through hdWGCNA analysis (Fig. 3C), with strong correlations observed between some of them (Fig. 3D). Central genes from the four modules exhibited distinct expression patterns within the neutrophil cluster. Genes in the blue and turquoise modules were significantly enriched in neutrophils (Fig. 3E). Additionally, interaction networks were constructed based on hub genes from the two modules (Fig. 3F-G). We performed KEGG and GO enrichment analyses on genes within the blue and turquoise modules (Fig. 3H-I). Enrichment results for genes in the blue module suggest that OSCC may involve abnormalities in ribonucleoprotein complex assembly and cytoplasmic translation, leading to dysregulated protein synthesis and promoting cancer cell proliferation. Alterations in ribosomal structure and function, along with aberrant cadherin binding, may affect intercellular adhesion and cell migration, facilitating tumor invasion and metastasis. Additionally, pathways related to coronavirus disease and Parkinson’s disease indicate abnormalities in inflammatory responses and protein processing mechanisms, collectively contributing to OSCC progression. Enrichment results for genes in the turquoise module suggest OSCC may involve defense responses to viruses and symbionts, abnormalities in vesicle transport and secretion, functional changes in RAGE receptors and intercellular adhesion molecules, and inflammatory processes associated with phagosomes and bacterial infections.
Fig. 3.
Using hdWGCNA, key modules related to neutrophils were identified. A illustrates the scale-free topology fitting index and average connectivity of soft-threshold power. B presents a dendrogram reflecting gene hierarchical clustering, with different colors at the bottom representing different co-expression modules. C displays the top 10 hub genes in each module. D shows the matrix of inter-module relationships based on the correlation of module characteristic genes. E depicts the average expression bubble plot of module-specific hub genes in neutrophil clusters. F and G are interaction networks of hub genes in the blue and turquoise modules, respectively. H and I are the KEGG and GO enrichment analysis results of genes in the blue and turquoise modules, respectively
Acquisition of intersection genes and construction and validation of the risk model
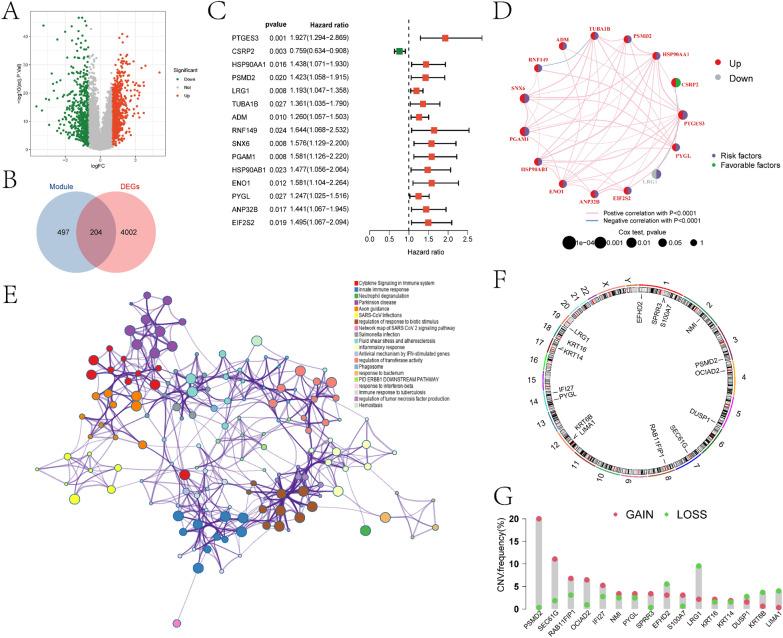
In this study, we initially conducted differential expression analysis between the control and OSCC samples in the TCGA-HNSC cohort, resulting in the identification of 4206 DEGs (Fig. 4A). Detailed information regarding DEGs is provided in the supplementary materials in the “diff.xls” file. We intersected the differentially expressed genes (DEGs) with the genes from the previously identified blue and turquoise modules, resulting in a total of 204 intersecting genes (Fig. 4B). A detailed list of these intersecting genes can be found in the supplementary materials in the “Intersection_gene.xlsx” file. Based on the Kaplan–Meier analysis, we selected 45 genes that were significantly associated with OSCC prognosis (p < 0.01). A univariate Cox regression analysis was then performed on these 45 prognostic genes. The results indicated that the expression of 15 genes (PTGES3, CSRP2, HSP90AA1, PSMD2, LRG1, TUBA1B, ADM, RNF149, SNX6, PGAM1, HSP90AB1, ENO1, PYGL, ANP32B, and EIF2S2) was significantly associated with the prognosis of OSCC patients (Fig. 4C). In Fig. 4D, we depicted the network showing the interaction, expression, and relationship with prognosis of these 15 prognostic genes in OSCC patients. Subsequently, metascape analysis was performed on intersection genes to identify the interaction network between the pathways they participate in (Fig. 4E). The roles of relevant pathways in OSCC development will be further analyzed in the discussion section. We further annotated the positions of the 15 genes on chromosomes (Fig. 4F) and investigated their copy number variations (CNVs) (Fig. 4G) to explore the changes of prognostic genes on chromosomes. The results showed that PSMD2 was the most significant gene with “GAIN,” while LRGS was the most significant gene with “LOSS.”
Fig. 4.
Analysis results of differential expression and intersection genes. A depicts the volcano plot of differential expression analysis between the control and OSCC groups in the TCGA-HNSC cohort. B shows the Venn diagram of DEGs intersecting with the blue and turquoise modules. C illustrates the forest plot obtained from single-factor Cox regression analysis of intersection genes. D represents the Circos plot of single-factor Cox regression analysis, indicating the correlation between the β value of prognostic genes and OSCC prognosis (red denotes upregulated prognostic genes, gray denotes downregulated prognostic genes, purple denotes risk factors; green denotes protective factors). E displays the pathway network diagram constructed from metascape enrichment analysis of intersection genes. F shows the circular plot of the chromosomal locations of 15 prognosis-related intersection genes. G presents the frequency statistics of gains and losses in CNVs of the 15 prognosis-related intersection genes
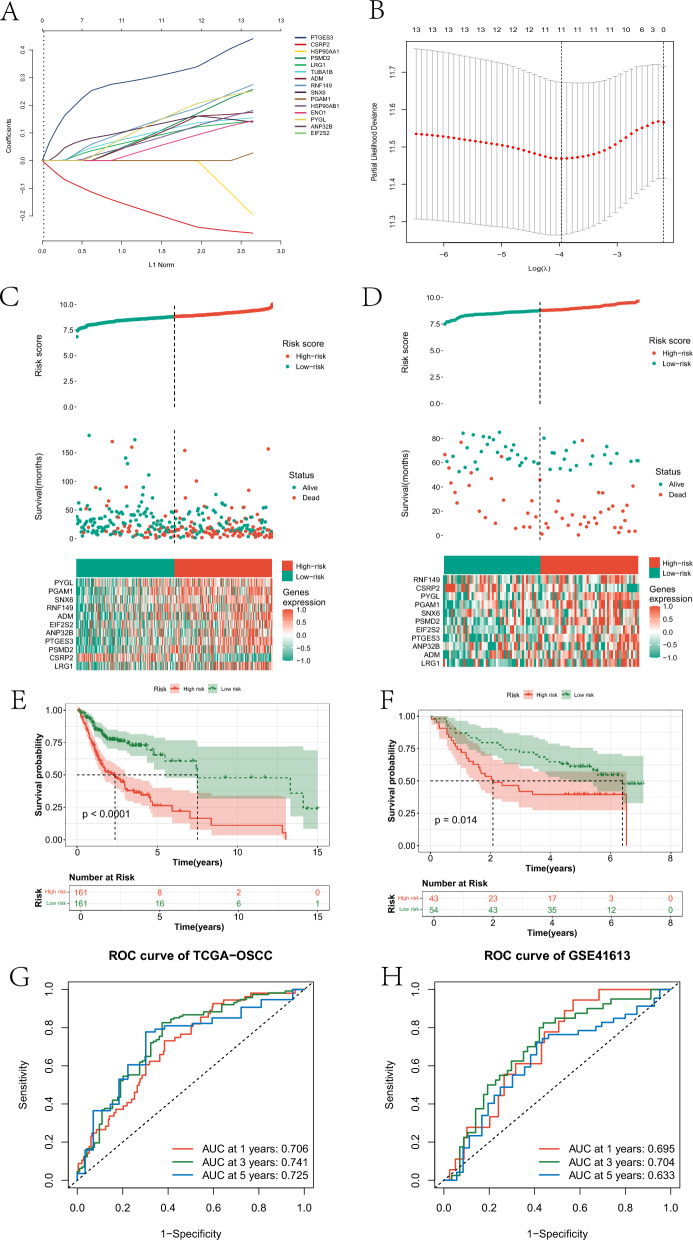
Furthermore, we further screened the fifteen prognostic genes to construct a risk model for OSCC. Specifically, based on Lasso-Cox regression analysis, we constructed an OSCC risk model based on eleven genes in the training set (Fig. 5A-B). This model assigned a risk score to each OSCC sample. All OSCC samples were divided into high- and low-risk groups based on the median risk score. By examining the risk score curves and scatter plots, it was found that samples in the high-risk group exhibited poorer survival status in both the training and testing cohorts (Fig. 5C-D), with significant differences in the expression of 11 genes between the two groups. The survival status of the two groups also showed significant differences in both datasets (Fig. 5E-F). Additionally, KM survival curves of the eleven genes are provided in supplementary material Figure S5 The survival between OSCC samples stratified into high and low expression groups based on the expression levels of the eleven genes showed significant differences. The model predicted the 1-year, 3-year, and 5-year survival of patients in the training set with AUCs of 0.706, 0.741, and 0.725, respectively (Fig. 5G). In the test set, the AUCs for predicting the 1-year, 3-year, and 5-year survival of patients were 0.695, 0.704, and 0.633, respectively (Fig. 5H).
Fig. 5.
The process of constructing the prognostic model based on Lasso-Cox. A and B represent the genes determined by Lasso regression analysis to participate in building the risk model and their corresponding coefficients. C and D represent the risk score distribution curves, risk score scatter plots, and the heatmap of gene expression involved in constructing the risk model for the high-risk and low-risk groups in the training and testing cohorts, respectively. E and F represent the KM survival curves of high and low-risk groups in the training and test sets, respectively. G and H respectively depict the ROC curves of the risk model predicting 1-year, 3-year, and 5-year survival rates of OSCC patients in the training and test sets
Nomogram model construction and immunological landscape of different risk groups
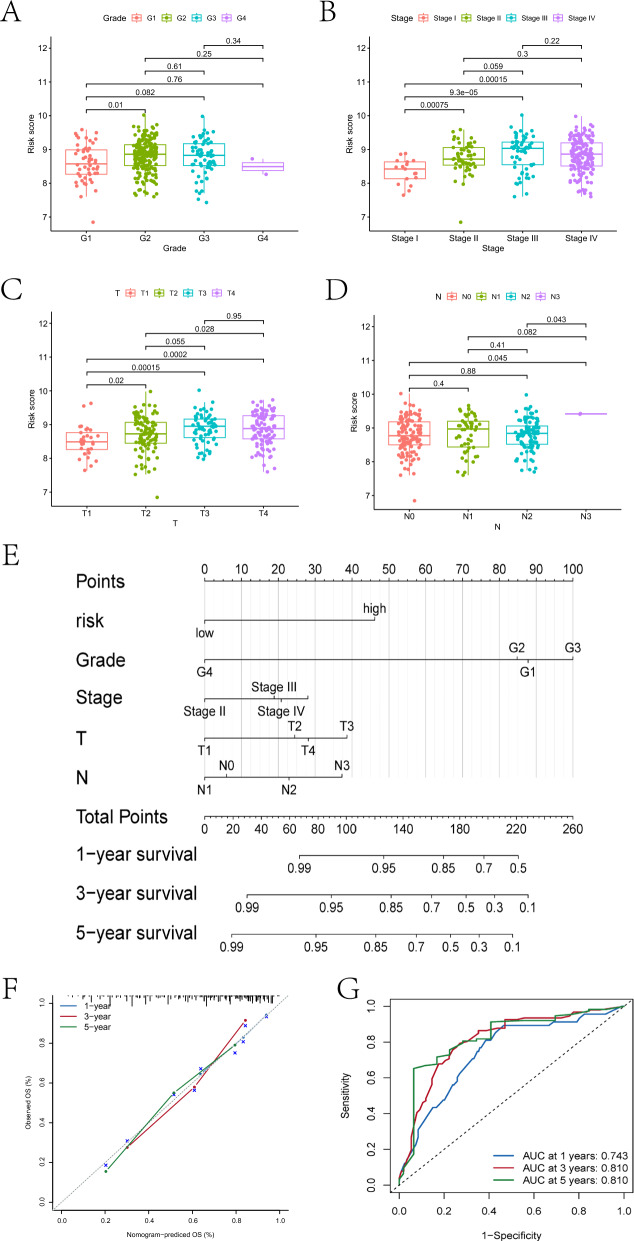
In this section, we first explored the differences in various clinical factors between the high- and low-risk groups. Significant differences were observed between the two groups in terms of G1 and G2 grading, Stage I and Stage II staging, Stage I and Stage III staging, Stage I and Stage IV staging, T1 and T2 staging, T1 and T3 staging, T1 and T4 staging, T2 and T4 staging, N0 and N3 staging, and N2 and N3 staging (Fig. 6A-D). Additionally, we constructed a nomogram model based on risk scores and four clinical factors (Fig. 6E-F). The AUC of this model for predicting patient survival at 1 year, 3 years, and 5 years was 0.743, 0.81, and 0.81, respectively (Fig. 6G), indicating superior predictive capability compared to the risk model.
Fig. 6.
Differences in clinical indicators between different risk groups and the results of nomogram model construction are depicted. A-D represent the differential box plots of OSCC samples in Grade grading, Stage staging, T staging, and N staging in high- and low-risk groups respectively. E illustrates the nomogram model constructed based on patient clinical factors and risk scores. F shows the calibration curve of the nomogram model. Figure G displays the ROC curves of the nomogram model predicting 1-year, 3-year, and 5-year survival rates for patients
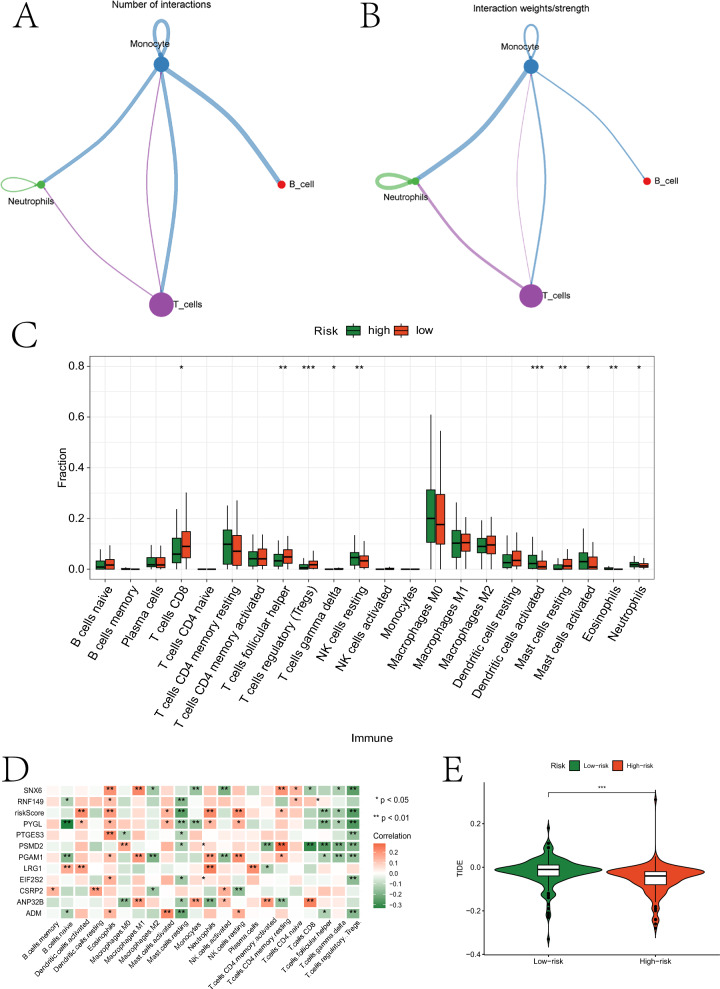
Furthermore, we explored the interactions between different types of immune cells and the immunological landscape of the two groups. Initially, we assessed the quantity and intensity of interactions between four immune cell types at the single-cell level. Macrophages exhibited a greater number and stronger intensity of interactions with other cells (Fig. 7A-B). Subsequently, we evaluated the abundance of various immune cell infiltrations based on expression data from OSCC samples (Fig. 7C and the “Fig. 7C.p_values.txt” document of the Supplementary Material). Significant differences in infiltration abundance were observed in both groups for T cells CD8, T cells follicular helper, T cells regulatory (Tregs), T cells gamma delta, NK cells resting, NK cells resting, Mast cells resting, Mast cells activated, Eosinophils, and Neutrophils. The relationship between these cells and OSCC will be analyzed in the discussion section. Eleven prognostic genes showed significant correlations with various immune cells (Fig. 7D and the “Fig. 7D.p_values.txt” document of the Supplementary Material). The TIDE scores also exhibited significant differences between the two groups (Fig. 7E).
Fig. 7.
Immunological analysis results. A and B represent network diagrams highlighting the quantity/strength of interactions between different types of immune cells based on scRNA-seq data. C illustrates the immune infiltration abundance of different cell types in high- and low-risk groups based on bulk RNA-seq data. D shows a heatmap depicting the correlation between prognostic genes and immune cells. E presents violin plots of TIDE scores between high- and low-risk groups
Mutation, mendelian randomization, and drug sensitivity analysis results
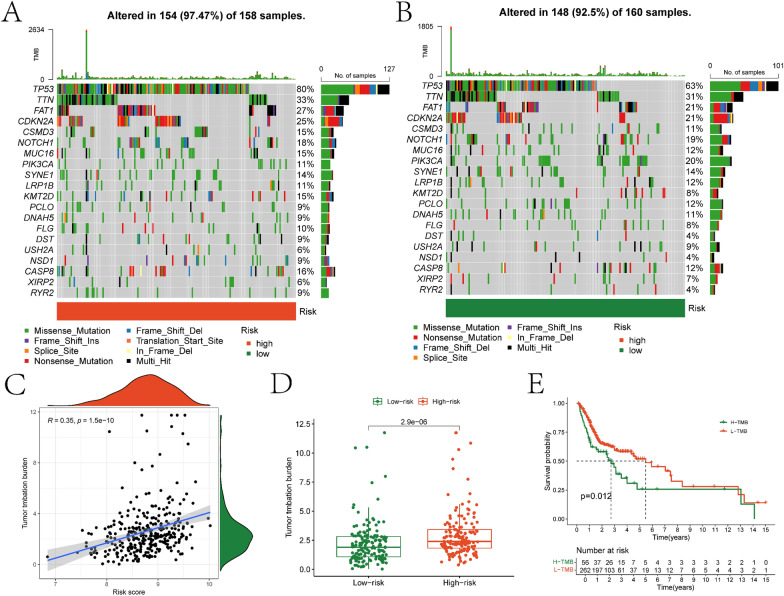
Firstly, we assessed the somatic mutation landscape of 11 prognostic genes in the high- and low-risk groups (Fig. 8A-B). Furthermore, we observed a significant positive correlation between risk score and Tumor Mutation Burden (TMB) (Fig. 8C). The TMB in the high-risk group was significantly higher than that in the low-risk group (Fig. 8D). Additionally, significant differences in survival were observed between the high and low TMB groups, divided based on the median TMB of all OSCC samples (Fig. 8E). Finally, the ESTIMATE algorithm revealed significant differences in tumor purity, stromal score, immune score, and ESTIMATE score between the two groups (Figure S6).
Fig. 8.
Mutation analysis of risk models. The mutation landscape plots for somatic mutations in the high- and low-risk groups are illustrated in A and B, respectively. C depicts the scatter plot showing the correlation between risk scores and Tumor Mutational Burden (TMB). D presents the differential box plot of TMB between high- and low-risk groups. E displays the KM survival curves for high- and low-TMB groups
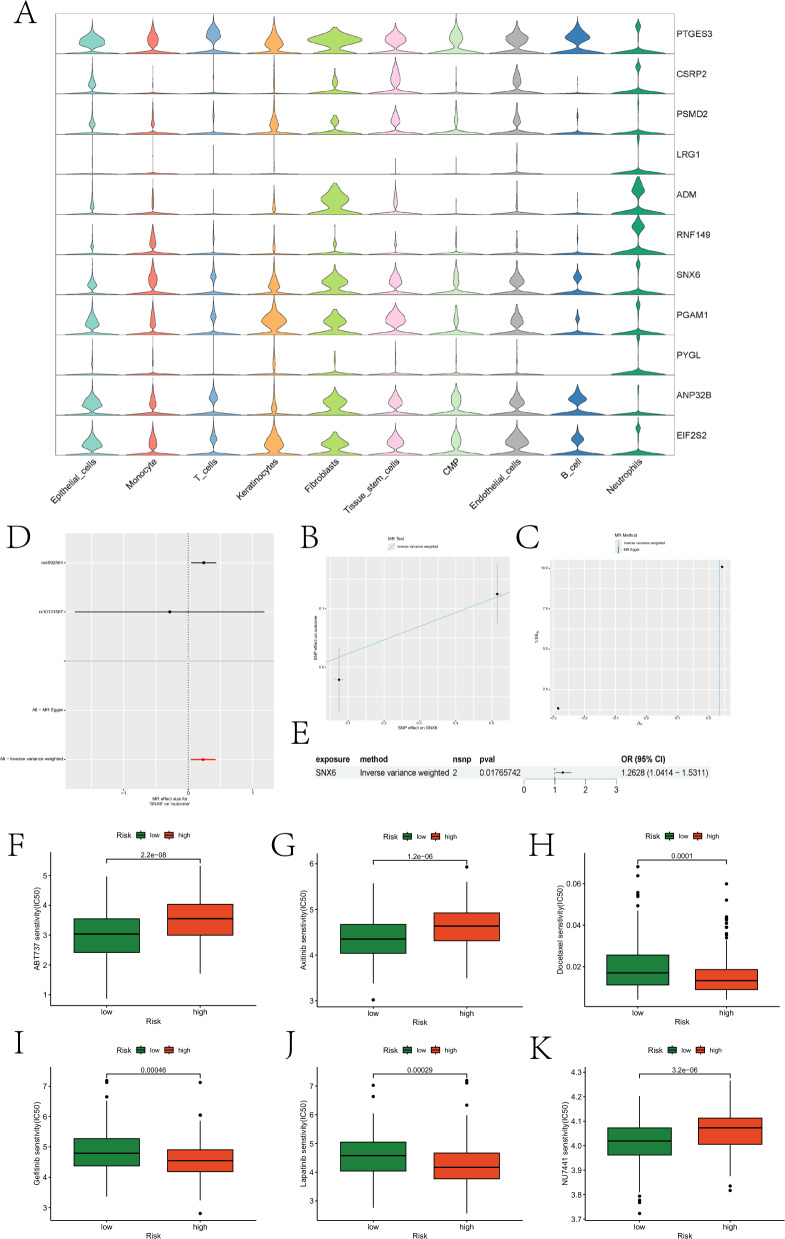
Next, we evaluated the expression of prognostic genes in different cell types. PTGES3 exhibited high expression in T cells, while LRG1, ADM, RNF149, and PYGL showed high expression in Neutrophils (Fig. 9A). Mendelian randomization analysis of these genes indicated a causal relationship between SNX6 and OSCC development, where SNX6 acted as a risk factor for OSCC (Fig. 9B-E). Finally, we assessed differences in drug sensitivity between the two groups. Partial boxplots illustrating significant differences in sensitivity to certain drugs between the two groups are presented in Fig. 9F-K, and the roles of these drugs in OSCC treatment are analyzed in the discussion section. Boxplots for the remaining drugs are provided in the “drug” folder of the supplementary materials.
Fig. 9.
Prognostic gene expression, MR, and drug sensitivity analysis results. A depicts violin plots illustrating the expression of prognostic genes across different cell types. B illustrates the impact of SNPs on HNSCC within the model. C presents a funnel plot generated from sensitivity analysis. D represents the causal relationship of SNX6 with OSCC, depicted using Wald ratios. E summarizes the forest plot illustrating the role of SNX6 in OSCC. F-K consist of box plots illustrating drugs with significantly different sensitivities between high- and low-risk groups
Validation of prognostic gene expression
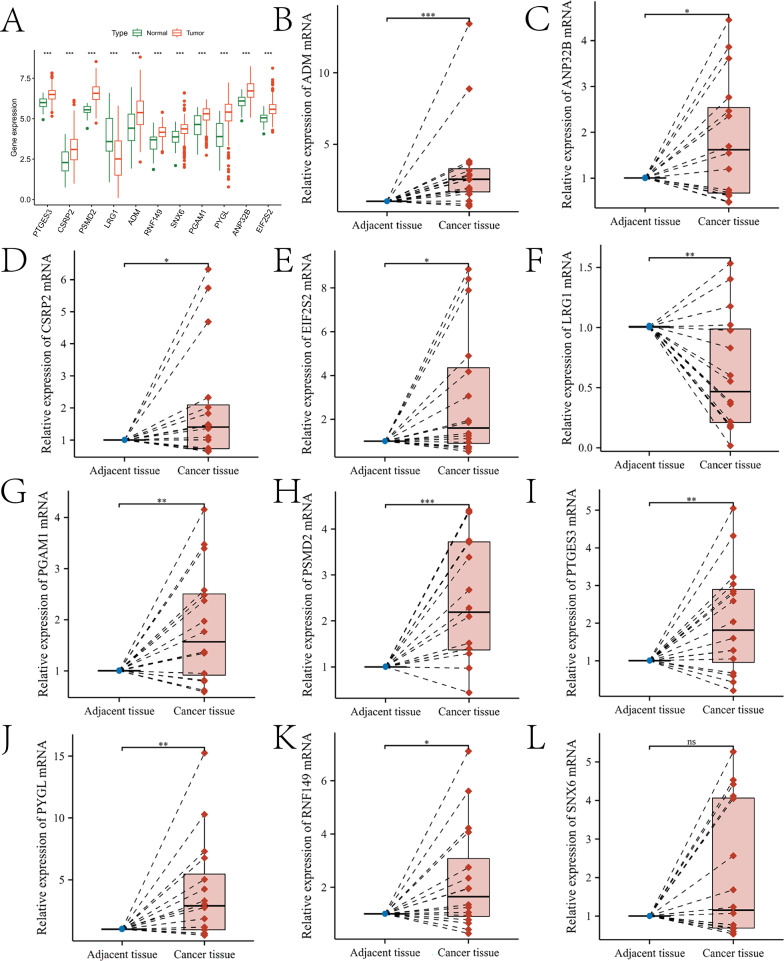
In this study, the expression of 11 prognostic genes was further validated. Specifically, Fig. 10A illustrates the expression levels of these genes in both the control and HNSC groups (the “Fig. 10A.p_values.txt” document of the Supplementary Material). All genes showed significant differences in expression between the two groups (p < 0.05) (Fig. 10B-L). The expression of the 11 genes was further validated in 16 pairs of tissue samples. qRT-PCR results demonstrated that the expression levels of PTGES3, CSRP2, PSMD2, ADM, RNF149, PGAM1, PYGL, ANP32B, and EIF2S2 were elevated in OSCC tissues (p < 0.05), while LRG1 expression was reduced in OSCC tissues (p < 0.05). SNX6 levels showed a slight increase in OSCC, but this difference did not reach statistical significance (p > 0.05). These findings are consistent with the bioinformatics analysis results presented in Fig. 10A. In Figure S7, we compared the distribution of methylation levels in the corresponding methylated regions of these genes between the control group and the OSCC group. The LinkedOmicsKB database (https://kb.linkedomics.org/) enables users to access uniformly processed and systematically precomputed CPTAC pan-cancer proteogenomics data, including head and neck squamous cell carcinoma (HNSCC, to which OSCC belongs). Using the LinkedOmicsKB database, we investigated the protein expression levels of 11 prognostic genes. Detailed results are provided in the “protein.docx” file in the supplementary materials. Additionally, we performed deconvolution on the spatial transcriptomics data of OSCC using the annotation results from previous scRNA-seq data. Figures S8 and S9 show the expression profiles of the prognostic genes in the tissue sections and in different cell types, respectively. Finally, we queried the immunohistochemical results of seven prognostic genes in the control and OSCC groups through The Human Protein Atlas (HPA) database (https://www.proteinatlas.org/), and they were consistent with the bioinformatics and qRT-PCR analysis results (Figure S10).
Fig. 10.
Validation results of the expression trends of prognostic genes. A presents box plots illustrating the expression differences of 11 prognostic genes between the high- and low-risk groups based on TCGA-HNSC transcriptome data. B–L depict box plots showing the expression trends of ADM, ANP32B, CSRP2, EIF2S2, LRG1, PGAM1, PSMD2, PTGES3, PYGL, RNF149, and SNX6 in tumor-adjacent normal tissues and cancer tissues, respectively
Discussion
OSCC is a malignant tumor with poor prognosis. Multiple studies have shown that neutrophil infiltration is often closely associated with promoting OSCC development. This study aims to identify reliable prognostic biomarkers for OSCC through bioinformatics and experimental validation. Firstly, complex cell types and communication networks in OSCC were revealed through scRNA-seq data. A total of 10 cell types were identified, with significant differences in their proportions among different samples. Cell communication analysis indicated strong interactions between most cells, especially endothelial cells and fibroblasts, showing the highest input and output signal strengths, respectively. Communication pathways of granulocytes, particularly CXCL and ANNEXIN pathways, were highlighted. Zhou et al. found that CC chemokine receptor 7 in OSCC cells promotes recruitment and M2 polarization of macrophages by regulating the production of CCL19 and CCL21 [26]. Sun et al. found that decreased expression of Annexin A1 enhances OSCC sensitivity to combined chemotherapy with multiple chemotherapeutic drugs [27]. Genes involved in both pathways were also confirmed to be closely associated with OSCC, such as CXCL1, CXCL2, CXCL3, and ANXA1. Wei et al. found that CXCL1 induced by stimulation of cancer-associated fibroblasts (CAFs) mediated the invasion of OSCC cells [28]. CXCL2 synthesized by OSCC contributes to tumor-associated bone destruction [29]. Overexpression of CXCL3 affects the malignant behavior of OSCC through the MAPK signaling pathway [30]. Wan et al.’s study first demonstrated that ANXA1 inhibits the proliferation and invasion of OSCC cells in vitro [31].
Secondly, based on hdWGCNA analysis, four gene modules highly correlated with neutrophils were identified. Genes in the blue and turquoise modules were significantly enriched in neutrophils, suggesting their potential key roles in OSCC development. Interaction network analysis further revealed complex relationships among these genes, providing new research directions to understand neutrophil functions in OSCC.
Thirdly, pseudo-time analysis revealed the distribution of different cell types at different stages of OSCC development, indicating that keratinocytes mainly reside in the early differentiation stage, while monocytes and tissue stem cells are concentrated in the late differentiation stage. Additionally, transcription factor analysis showed the involvement of multiple transcription factors in key biological processes associated with OSCC, including glandular development and hematopoiesis. These findings provide new insights into the pathogenesis and progression of OSCC. We found that pathways involving multiple TFs have complex roles in OSCC progression, such as adipogenesis, pyroptosis, hepatitis B, and head and neck squamous cell carcinoma pathways. Experimental results from Kazuhisa Watanabe suggest that N4bp2l1 may be involved in adipogenesis and is highly expressed in OSCC [32]. Liu et al. found that cyanidin promotes OSCC cell death by activating cell pyroptosis, inhibiting tumor progression [33]. Sara Donà et al. found a positive correlation between chronic hepatitis B infection and HNSCC, suggesting that the increased risk of HNSCC may lead to earlier diagnosis and better outcomes for patients with hepatitis B [34].
Fourth, this study identified 204 intersecting genes through differential expression analysis and hdWGCNA, and constructed an OSCC risk model based on these genes, consisting of 11 genes (PTGES3, CSRP2, PSMD2, LRG1, ADM, RNF149, SNX6, PGAM1, PYGL, ANP32B, and EIF2S2). The model exhibited good predictive performance in both the training and test sets, with AUC values of 0.706 and 0.695, respectively. Survival analysis further confirmed the effectiveness of this model. Additionally, some of the 11 genes have been shown to play crucial roles in OSCC development, such as CSRP2, LRG1, ADM, and PGAM1. CSRP2 overexpression is associated with poor prognosis in OSCC and plays a critical role in maintaining the stemness of OSCC cells [35]. Wang et al. found that reduced expression of LRG1 in HNSCC tissues, regardless of grade, has potential clinical value in early diagnosis of HNSCC [36]. Lucas de Lima Maia et al. identified ADM as a predictor of OSCC progression and prognosis after detecting its expression in OSCC paraffin-embedded tissue microarrays using immunohistochemical methods [37]. Zhang et al. identified PGAM1 as a poor prognostic biomarker for OSCC through bioinformatics analysis and immunohistochemical experiments [38]. Additionally, PSMD2, RNF149, and PYGL have been confirmed to play critical roles in other squamous cell carcinomas. Liu et al. found that PSMD2 is involved in the progression of esophageal squamous cell carcinoma by inhibiting autophagy [39]. Zhu et al. reported that RNF149 induces cisplatin resistance in esophageal squamous cell carcinoma by destabilizing PHLPP2 and activating the PI3K/AKT signaling pathway [40]. Guan et al. demonstrated that PYGL promotes the progression, metastasis, and chemoresistance of head and neck squamous cell carcinoma (HNSCC) via the GSH/ROS/p53 pathway [41].
Fifth, immune landscape analysis revealed significant differences between high- and low-risk groups. Specifically, strong interactions between monocytes and other cells, as well as significant differences in the abundance of various immune cell infiltrations between high- and low-risk groups, suggest the critical role of the immune microenvironment in OSCC progression. Immune cells such as CD8 + T cells, regulatory T cells, and neutrophils were particularly highlighted. Zhang et al. found that CD8 + T cells may be involved in lymphatic metastasis of OSCC, with FKBP4 being a potential biomarker for lymph node metastasis risk among the cell-associated genes [42]. OSCC cell-infiltrating CD25 + FoxP3 + regulatory Tregs are associated with tumor grading and stromal inflammation [43]. Judah E Glogauer et al. reported that neutrophils increase OSCC invasion through an invadopodia-dependent pathway [44].
Finally, mutation analysis revealed that the high-risk group had a higher TMB, and TMB was significantly positively correlated with risk scores. MR analysis demonstrated that SNX6 had a causal relationship with OSCC development and was a risk factor for OSCC. Drug sensitivity analysis revealed differential responses to various drugs between the high- and low-risk groups, providing potential strategies for personalized therapy. Drugs depicted in Fig. 10F-K have been used in clinical treatment of OSCC. Li et al. found that ABT737 synergistically kills HNSCC cells in chemotherapy through the noxa-mediated pathway [45]. There are many dysregulated pathways in head and neck tumors, including VEGFR and EGFR, highlighting the potential role of targeted therapy. A review elaborated on the role of VEGFR in head and neck cancer and discussed recent trials using axitinib, a tyrosine kinase inhibitor targeting dysregulated pathways VEGFR-1, 2, and 3 present in head and neck tumors [46]. Sun et al. found that decreased Annexin A1 expression enhances OSCC sensitivity to combination chemotherapy with docetaxel, cisplatin, and 5-fluorouracil [27]. Jin et al. found that BST2 promotes OSCC cell growth and induces resistance to gefitinib [47]. Lapatinib is an oral medication that targets multiple transmembrane receptors in the epidermal growth factor receptor family. Mitul D Gandhi et al. reviewed the principles and clinical efficacy of lapatinib therapy in HNSCC [48]. NU7441 enhances the radiosensitivity of clinically relevant radiation-resistant OSCC cells [49].
Conclusion
In summary, this study identified gene modules associated with neutrophils in OSCC, and functional enrichment analysis of these genes provides insight into potential mechanisms of neutrophil infiltration in OSCC. Furthermore, several genes associated with OSCC prognosis were identified, and a prognostic model was constructed. This model effectively stratifies patients and provides a reference for drug target development and therapeutic interventions in OSCC.
Supplementary Information
Author contributions
Jinhang Wang contributed to data analysis and manuscript writing. Zifeng Cui and Qiwen Song were responsible for data collection and processing. Kaicheng Yang contributed to experimental design and data interpretation. Yanping Chen participated in the revision of the manuscript. Shixiong Peng supervised the study, provided project funding, and revised the manuscript. All authors read and approved the final manuscript.
Funding
The research was supported by The Hebei Provincial Health Commission Youth Science and Technology Project (No.20240889).
Data availability
The data used in this paper are from GEO database and TCGA database.
Declarations
Ethics approval and consent to participate
Not applicable.
Consent for publication
Not applicable.
Competing interests
The authors declare no competing interests.
Footnotes
Publisher's Note
Springer Nature remains neutral with regard to jurisdictional claims in published maps and institutional affiliations.
References
- 1.Peres MA, Macpherson LMD, Weyant RJ, Daly B, Venturelli R, Mathur MR, Listl S, Celeste RK, Guarnizo-Herreño CC, Kearns C, Benzian H, Allison P, Watt RG. Oral diseases: a global public health challenge. Lancet. 2019;394(10194):249–60. [DOI] [PubMed] [Google Scholar]
- 2.Takkem A, Barakat C, Zakaraia S, Zaid K, Najmeh J, Ayoub M, Seirawan MY. Ki-67 prognostic value in different histological grades of oral epithelial dysplasia and oral squamous cell carcinoma. Asian Pac J Cancer Prev. 2018;19(11):3279–86. [DOI] [PMC free article] [PubMed] [Google Scholar]
- 3.Chinn SB, Myers JN. Oral cavity carcinoma: current management, controversies, and future directions. J Clin Oncol. 2015;33(29):3269–76. [DOI] [PMC free article] [PubMed] [Google Scholar]
- 4.Gan CP, Sam KK, Yee PS, Zainal NS, Lee BKB, Abdul Rahman ZA, Patel V, Tan AC, Zain RB, Cheong SC. IFITM3 knockdown reduces the expression of CCND1 and CDK4 and suppresses the growth of oral squamous cell carcinoma cells. Cell Oncol (Dordr). 2019;42(4):477–90. [DOI] [PMC free article] [PubMed] [Google Scholar]
- 5.Domnich M, Riedesel J, Pylaeva E, Kürten CHL, Buer J, Lang S, Jablonska J. Oral neutrophils: underestimated players in oral cancer. Front Immunol. 2020;11: 565683. [DOI] [PMC free article] [PubMed] [Google Scholar]
- 6.Hadjigol S, Shah BA, O’Brien-Simpson NM. The ‘danse macabre’-neutrophils the interactive partner affecting oral cancer outcomes. Front Immunol. 2022;13: 894021. [DOI] [PMC free article] [PubMed] [Google Scholar]
- 7.Zhou J, Hu Z, Wang L, Hu Q, Chen Z, Lin T, Zhou R, Cai Y, Wu Z, Zhang Z, Yang Y, Zhang C, Li G, Zeng L, Su K, Li H, Su Q, Zeng G, Cheng B, Wu T. Tumor-colonized Streptococcus mutans metabolically reprograms tumor microenvironment and promotes oral squamous cell carcinoma. Microbiome. 2024;12(1):193. [DOI] [PMC free article] [PubMed] [Google Scholar]
- 8.Zanoni DK, Valero C, McGill MR, Montero PH, Shah JP, Wong RJ, Ganly I, Patel SG. Distant metastasis in oral squamous cell carcinoma: does the neutrophil-to-lymphocyte ratio act as a surrogate of the host immune status? Oral Oncol. 2022;124: 105641. [DOI] [PMC free article] [PubMed] [Google Scholar]
- 9.Kim TS, Moutsopoulos NM. Neutrophils and neutrophil extracellular traps in oral health and disease. Exp Mol Med. 2024;56(5):1055–65. [DOI] [PMC free article] [PubMed] [Google Scholar]
- 10.Wu CF, Hung TT, Su YC, Chen PJ, Lai KH, Wang CC. Endoplasmic reticulum stress of oral squamous cell carcinoma induces immunosuppression of neutrophils. Front Oncol. 2022;12: 818192. [DOI] [PMC free article] [PubMed] [Google Scholar]
- 11.Magalhaes MA, Glogauer JE, Glogauer M. Neutrophils and oral squamous cell carcinoma: lessons learned and future directions. J Leukoc Biol. 2014;96(5):695–702. [DOI] [PubMed] [Google Scholar]
- 12.Garley M. Unobvious neutrophil extracellular traps signification in the course of oral squamous cell carcinoma: current understanding and future perspectives. Cancer Control. 2023;30:10732748231159312. [DOI] [PMC free article] [PubMed] [Google Scholar]
- 13.Zhou P, Xiao L, Xu X. Identification of E2F transcription factor 7 as a novel potential biomarker for oral squamous cell carcinoma. Head Face Med. 2021;17(1):7. [DOI] [PMC free article] [PubMed] [Google Scholar]
- 14.Chen Y, Feng Y, Yan F, Zhao Y, Zhao H, Guo Y. A Novel immune-related gene signature to identify the tumor microenvironment and prognose disease among patients with oral squamous cell carcinoma patients using ssGSEA: a bioinformatics and biological validation study. Front Immunol. 2022;13: 922195. [DOI] [PMC free article] [PubMed] [Google Scholar]
- 15.Xie J, Lan T, Zheng DL, Ding LC, Lu YG. CDH4 inhibits ferroptosis in oral squamous cell carcinoma cells. BMC Oral Health. 2023;23(1):329. [DOI] [PMC free article] [PubMed] [Google Scholar]
- 16.Guo ZC, Jing SL, Jumatai S, Gong ZC. Porphyromonas gingivalis promotes the progression of oral squamous cell carcinoma by activating the neutrophil chemotaxis in the tumour microenvironment. Cancer Immunol, Immunother : CII. 2023;72(6):1523–39. [DOI] [PMC free article] [PubMed] [Google Scholar]
- 17.Wang L, Chen C, Li F, Hua Q, Chen S, Xiao B, Dai M, Li M, Zheng A, Yu D, Hu Z, Tao Z. Down-regulation of neutrophil gelatinase-associated lipocalin in head and neck squamous cell carcinoma correlated with tumorigenesis, not with metastasis. Int J Clin Exp Pathol. 2015;8(8):8857–68. [PMC free article] [PubMed] [Google Scholar]
- 18.Wang Y, Li D, Li Q, Basnet A, Efird JT, Seki N. Neutrophil estimation and prognosis analysis based on existing lung squamous cell carcinoma datasets: the development and validation of a prognosis prediction model. Transl Lung Cancer Res. 2024;13(8):2023–37. [DOI] [PMC free article] [PubMed] [Google Scholar]
- 19.Colaprico A, Silva TC, Olsen C, Garofano L, Cava C, Garolini D, Sabedot TS, Malta TM, Pagnotta SM, Castiglioni I, Ceccarelli M, Bontempi G, Noushmehr H. TCGAbiolinks: an R/Bioconductor package for integrative analysis of TCGA data. Nucleic Acids Res. 2016;44(8): e71. [DOI] [PMC free article] [PubMed] [Google Scholar]
- 20.Morabito S, Reese F, Rahimzadeh N, Miyoshi E, Swarup V. hdWGCNA identifies co-expression networks in high-dimensional transcriptomics data. Cell Rep Methods. 2023;3(6): 100498. [DOI] [PMC free article] [PubMed] [Google Scholar]
- 21.Ritchie ME, Phipson B, Wu D, Hu Y, Law CW, Shi W, Smyth GK. limma powers differential expression analyses for RNA-sequencing and microarray studies. Nucleic Acids Res. 2015;43(7): e47. [DOI] [PMC free article] [PubMed] [Google Scholar]
- 22.Mayakonda A, Lin DC, Assenov Y, Plass C, Koeffler HP. Maftools: efficient and comprehensive analysis of somatic variants in cancer. Genome Res. 2018;28(11):1747–56. [DOI] [PMC free article] [PubMed] [Google Scholar]
- 23.Yoshihara K, Shahmoradgoli M, Martínez E, Vegesna R, Kim H, Torres-Garcia W, Treviño V, Shen H, Laird PW, Levine DA, Carter SL, Getz G, Stemke-Hale K, Mills GB, Verhaak RG. Inferring tumour purity and stromal and immune cell admixture from expression data. Nat Commun. 2013;4:2612. [DOI] [PMC free article] [PubMed] [Google Scholar]
- 24.Chi C, Ye Y, Chen B, Huang H. Bipartite graph-based approach for clustering of cell lines by gene expression-drug response associations. Bioinform (Oxford, England). 2021;37(17):2617–26. [DOI] [PMC free article] [PubMed] [Google Scholar]
- 25.Cable DM, Murray E, Zou LS, Goeva A, Macosko EZ, Chen F, Irizarry RA. Robust decomposition of cell type mixtures in spatial transcriptomics. Nat Biotechnol. 2022;40(4):517–26. [DOI] [PMC free article] [PubMed] [Google Scholar]
- 26.Zhou WH, Wang Y, Yan C, Du WD, Al-Aroomi MA, Zheng L, Lin SF, Gao JX, Jiang S, Wang ZX, Sun CF, Liu FY. CC chemokine receptor 7 promotes macrophage recruitment and induces M2-polarization through CC chemokine ligand 19&21 in oral squamous cell carcinoma. Discov Oncol. 2022;13(1):67. [DOI] [PMC free article] [PubMed] [Google Scholar]
- 27.Sun W, Zhao T, Aladelusi TO, Ju W, Zhang Z, Zhong L, Zhu D. Decreased Annexin A1 expression enhances sensitivity to docetaxel, cisplatin and 5-fluorouracil combination induction chemotherapy in oral squamous cell carcinoma. J Oral Pathol Med. 2021;50(8):795–802. [DOI] [PMC free article] [PubMed] [Google Scholar]
- 28.Wei LY, Lee JJ, Yeh CY, Yang CJ, Kok SH, Ko JY, Tsai FC, Chia JS. Reciprocal activation of cancer-associated fibroblasts and oral squamous carcinoma cells through CXCL1. Oral Oncol. 2019;88:115–23. [DOI] [PubMed] [Google Scholar]
- 29.Oue E, Lee JW, Sakamoto K, Iimura T, Aoki K, Kayamori K, Michi Y, Yamashiro M, Harada K, Amagasa T, Yamaguchi A. CXCL2 synthesized by oral squamous cell carcinoma is involved in cancer-associated bone destruction. Biochem Biophys Res Commun. 2012;424(3):456–61. [DOI] [PubMed] [Google Scholar]
- 30.Weng J, Ren Q, Li Z, Wang W, Guan J. CXCL3 overexpression affects the malignant behavior of oral squamous cell carcinoma cells via the MAPK signaling pathway. J Oral Pathol Med. 2021;50(9):902–10. [DOI] [PubMed] [Google Scholar]
- 31.Wan YM, Tian J, Qi L, Liu LM, Xu N. ANXA1 affects cell proliferation, invasion and epithelial-mesenchymal transition of oral squamous cell carcinoma. Exp Ther Med. 2017;14(5):5214–8. [DOI] [PMC free article] [PubMed] [Google Scholar]
- 32.Watanabe K, Yokota K, Yoshida K, Matsumoto A, Iwamoto S. A novel upstream transcription factor 1 target gene N4bp2l1 that regulates adipogenesis. Biochem Biophys Rep. 2019;20: 100676. [DOI] [PMC free article] [PubMed] [Google Scholar]
- 33.Yue E, Tuguzbaeva G, Chen X, Qin Y, Li A, Sun X, Dong C, Liu Y, Yu Y, Zahra SM, Shan Q, Jiang Y, Du Z, Bai Y. Anthocyanin is involved in the activation of pyroptosis in oral squamous cell carcinoma. Phytomedicine. 2019;56:286–94. [DOI] [PubMed] [Google Scholar]
- 34.Donà S, Borsetto D, Fussey J, Biscaro V, Vian E, Spinato G, Menegaldo A, Da Mosto MC, Rigoli R, Polesel J, Boscolo-Rizzo P. Association between hepatitis C and B viruses and head and neck squamous cell carcinoma. J Clin Virol. 2019;121: 104209. [DOI] [PubMed] [Google Scholar]
- 35.Zhang MJ, Liu J, Wan SC, Li JX, Wang S, Fidele NB, Huang CF, Sun ZJ. CSRP2 promotes cell stemness in head and neck squamous cell carcinoma. Head Neck. 2023;45(9):2161–72. [DOI] [PubMed] [Google Scholar]
- 36.Wang Y, Chen C, Hua Q, Wang L, Li F, Li M, Mei Z, Zhou T, Xiao B, Tao Z. Downregulation of leucine-rich-α-2-glycoprotein 1 expression is associated with the tumorigenesis of head and neck squamous cell carcinoma. Oncol Rep. 2017;37(3):1503–10. [DOI] [PubMed] [Google Scholar]
- 37.Maia LL, Peterle GT, Dos Santos M, Trivilin LO, Mendes SO, de Oliveira MM, Dos Santos JG, Stur E, Agostini LP, Couto C, Dalbó J, de Assis A, Archanjo AB, Mercante A, Lopez RVM, Nunes FD, de Carvalho MB, Tajara EH, Louro ID, Álvares-da-Silva AM. JMJD1A, H3K9me1, H3K9me2 and ADM expression as prognostic markers in oral and oropharyngeal squamous cell carcinoma. PLoS ONE. 2018;13(3): e0194884. [DOI] [PMC free article] [PubMed] [Google Scholar]
- 38.Zhang D, Wu H, Zhang X, Ding X, Huang M, Geng M, Li H, Xie Z. Phosphoglycerate mutase 1 predicts the poor prognosis of oral squamous cell carcinoma and is associated with cell migration. J Cancer. 2017;8(11):1943–51. [DOI] [PMC free article] [PubMed] [Google Scholar]
- 39.Liu Y, Wu M, Xu S, Niu X, Liu W, Miao C, Lin A, Xu Y, Yu L. PSMD2 contributes to the progression of esophageal squamous cell carcinoma by repressing autophagy. Cell Biosci. 2023;13(1):67. [DOI] [PMC free article] [PubMed] [Google Scholar]
- 40.J. Zhu, J. Tang, Y. Wu, X. Qiu, X. Jin, R. Zhang, RNF149 confers cisplatin resistance in esophageal squamous cell carcinoma via destabilization of PHLPP2 and activating PI3K/AKT signalling, Medical oncology (Northwood, London, England) 40(10) (2023) 290. [DOI] [PubMed]
- 41.Guan J, Xu X, Qiu G, He C, Lu X, Wang K, Liu X, Li Y, Ling Z, Tang X, Liang Y, Tao X, Cheng B, Yang B. Cellular hierarchy framework based on single-cell/multi-patient sample sequencing reveals metabolic biomarker PYGL as a therapeutic target for HNSCC. J Exp Clin Cancer Res : CR. 2023;42(1):162. [DOI] [PMC free article] [PubMed] [Google Scholar]
- 42.Zhang Y, Wang J, Yu J, Zhu H. FKBP4 correlates with CD8(+) T cells and lymphatic metastases in oral squamous cell carcinoma. Oral Dis. 2024;30(2):422–32. [DOI] [PubMed] [Google Scholar]
- 43.Al-Qahtani D, Anil S, Rajendran R. Tumour infiltrating CD25+ FoxP3+ regulatory T cells (Tregs) relate to tumour grade and stromal inflammation in oral squamous cell carcinoma. J Oral Pathol Med. 2011;40(8):636–42. [DOI] [PubMed] [Google Scholar]
- 44.Glogauer JE, Sun CX, Bradley G, Magalhaes MA. Neutrophils increase oral squamous cell carcinoma invasion through an invadopodia-dependent pathway. Cancer Immunol Res. 2015;3(11):1218–26. [DOI] [PubMed] [Google Scholar]
- 45.Li R, Zang Y, Li C, Patel NS, Grandis JR, Johnson DE. ABT-737 synergizes with chemotherapy to kill head and neck squamous cell carcinoma cells via a Noxa-mediated pathway. Mol Pharmacol. 2009;75(5):1231–9. [DOI] [PMC free article] [PubMed] [Google Scholar]
- 46.Swiecicki PL, Spector M, Worden FP. Axitinib in the treatment of head and neck malignancies. Curr Clin Pharmacol. 2016;11(2):72–6. [DOI] [PubMed] [Google Scholar]
- 47.Jin H, Zhang L, Wang S, Qian L. BST2 promotes growth and induces gefitinib resistance in oral squamous cell carcinoma via regulating the EGFR pathway. Arch Med Sci. 2021;17(6):1772–82. [DOI] [PMC free article] [PubMed] [Google Scholar]
- 48.Gandhi MD, Agulnik M. Targeted treatment of head and neck squamous-cell carcinoma: potential of lapatinib. Onco Targets Ther. 2014;7:245–51. [DOI] [PMC free article] [PubMed] [Google Scholar]
- 49.Ohuchi K, Saga R, Hasegawa K, Tsuruga E, Hosokawa Y, Fukumoto M, Okumura K. DNA-PKcs phosphorylation specific inhibitor, NU7441, enhances the radiosensitivity of clinically relevant radioresistant oral squamous cell carcinoma cells. Biomed Rep. 2023;18(4):28. [DOI] [PMC free article] [PubMed] [Google Scholar]
Associated Data
This section collects any data citations, data availability statements, or supplementary materials included in this article.
Supplementary Materials
Data Availability Statement
The data used in this paper are from GEO database and TCGA database.


